VALLIDATION OF ANALYTICAL METHODS Presented By, Asmita Rajendra Magare M.Pharm 1 st year (QAT) Guided By, Dr. Mrs Sonali Mahaparale Professor of AAT. Dr. Dy. Patil college of pharmacy akurdi.
Transcript
VALLIDATION OF ANALYTICAL METHODS
Presented By,Asmita Rajendra MagareM.Pharm 1st year (QAT)
Guided By,Dr. Mrs Sonali Mahaparale
Professor of AAT.
Dr. Dy. Patil college of pharmacy akurdi.
2
“ Action providing that any procedure, process equipment, material, activity or system actually
lead to the expected results.”
VALIDATION
3
Provides assurance of reliability The field of
validation is divided into a number of subsections
as follows-
Cleaning validation
Process validation
Analytical method validation
Computer system validation
Equipment validation
4
Validation of Analytical procedure is the process by which it is established, by
laboratory studies ,that the performance characteristics of the analytical procedure
meet the requirement for its use
Validation of Analytical Method
5
Characteristics that should be considered during validation of analytical methods include:
Accuracy Precision Specificity Limit of Detection Limit of Quantitation Linearity Range Robustness Ruggedness
6
Accuracy
Closeness of Test result obtained between the true value .This accuracy should be established across its range.
7
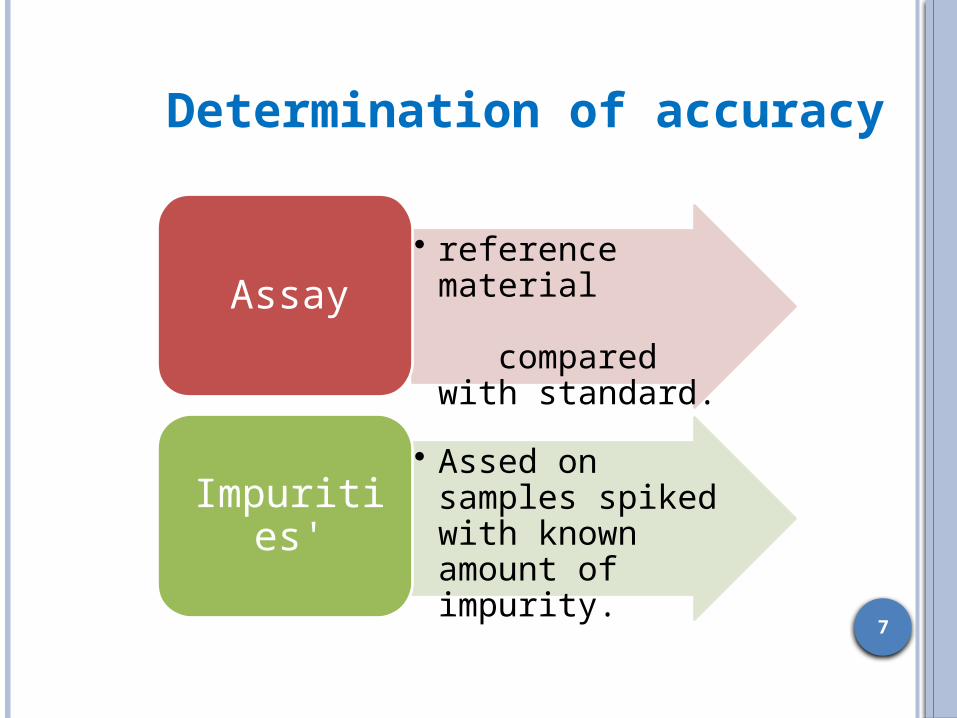
• reference material compared with standard.
Assay
• Assed on samples spiked with known amount of impurity.
Impurities'
Determination of accuracy
8
PrecisionThe measure of the degree of agreement
(degree of scatter) between a series of measurement obtain from multiple sampling of the same sample under the prescribe conditions.
9
10
Determination of Precision
11
Specificity is the ability to detect analyte of interest in the presence of interfering subestance . Typically these might include impurities, degradation product etc.
Specificity
12
LOD
Lowest amount of analyte
in a sample that can be
detected but not
necessarily quantitated.
Estimated by Signal to
Noise Ratio of 3:1.
LOQ
Lowest amount of
analyte in a sample that
can be quantified with
suitable accuracy and
precision.
Estimated by Signal to
Noise Ratio of 10:1.
LOD and LOQ
13
LOD and LOQ Estimated by
S = slope of calibration curves = standard deviation of blank readings or standard deviation of regression line
DL = 3.3s QL = 10sS S
1. Based in Visual Evaluations- Used for non-instrumental methods
2. Based on Signal-to Noise-Ratio- 3:1 for Detection Limit- 10:1 for Quantitation Limit
3. Based on Standard Deviation of the Response and the Slope
14
Ybl
LOD LOQ
Statistical estimate of LOD & LOQ
LOD = 3.3 Sbl / b LOQ = 10 Sbl / b
Y = b X + a
15noise
Peak ALOD
Peak BLOQ
Baseline
Signal-to Noise-Ratio
16
Linearity
Linearity- Its ability to obtain results that are directly or by a well defined mathematical transformations proportional to concentration of analyte in sample within a given range.
A minimum of five concentrations should be used
17
By Visual Inspection of plot of signals vs. analyte
concentrationAcceptance criteria: Linear regression r2 > 0.95
Determination of Linearity
18
The range of an analytical procedure is the interval between the upper and lower concentration (amounts) of analyte in the sample (including these concentrations) for which it has been demonstrated that the analytical procedure has a suitable level of precision, accuracy and linearity.
Range
19
Robustness
Definition: Capacity to remain unaffected by small but
deliberate variations in method parameters.
Determination: Comparison results under differing
conditions with precision under normal conditions.
20
RuggednessDegree of reproducibility of test results
under a variety of conditions Different Analysts Different Laboratories Different Instruments Different Reagents Different Days
Etc.
21
Equipment validationIt demonstrate that equipment used in validation studies is suitable for use and is comparable to equipment used for routine analysis.
QualificationAction of proving and documenting that equipment or
ancillary systems are properly installed, work correctly, and
actually lead to the expected results.
Qualification is part of validation , but the individual
qualification steps alone do not constitute process validation.
22
Parts of qualification
The activity of qualifying system of equipment is divided into four subtypes-
Design qualification (DQ)
Installation qualification (IQ)
Operational qualification (OQ)
Performance qualification (PQ)
23
Design qualification (DQ)- Demonstrates that the proposed
design will satisfy all the requirements.
Installation qualification (IQ)- Demonstrates that the
process or equipment meets all specifications, is installed
correctly.
24
Operational qualification (OQ)- Demonstrates that all
facets of the process or equipment are operating correctly.
Performance qualification (PQ)- Demonstrates that the
process or equipment performs as intended in a consistent
manner over time.
25
Validation of HPLC
Flow rate accuracy
Injector accuracy
System precision
Wavelength accuracy
Detector linearity
Injector linearity
Gradient performance check
Column oven temperature accuracy
26
Flow rate accuracy:-The performance of pump module is the ability to maintain
accurate and consistent flow of the mobile phase. Poor flow rate
will affect the retention time and resolution of the separation.
Test:-
The flow rate accuracy at 2 ml/min can be verified by using a
calibrated stopwatch to measure the time it takes to collect 25 ml of
effluent from the pump into a 25 ml volumetric flask
Acceptance:-
±2.0% of the set flow rate
27
System precision:-
Weigh accurately 60 mg of caffeine into 100 ml volumetric
flask.
Dissolve and dilute to the volume with mobile phase.
Transfer 10 ml of this solution into 100 ml flask and make up with
mobile phase.
Inject blank followed by standard preparation in 6
replicates. Note down the areas and retention times.
Acceptance:-
The % RSD of retention time and peak area should be
<1.0%
28
Wavelength accuracy:-
Inject blank followed by standard
preparation and note down the height or
absorbance.
Acceptance:-
The maximum absorbance should be ±2
nm.
29
Detector linearity:-
The linearity of the detector response can be checked by
pumping or by filling the flow cell with a series of standard
solution of various concentration.
Aqueous caffeine solutions are convenient for the linearity
measurement.
The correlation coefficient between sample concentration and
response can be calculated to determine the linearity.
Acceptance:-
R≥ 0.999
30
Injector linearity:-
Linearity is important for methods that require the use of variable
injection volumes.
The linearity of the injector can be demonstrated by making
injections, typically 5,10,20,50 and 100 μl to cover the range 0 to 100 μl.
The response of the injection is plotted against the injection volume.
The correlation coefficient of the plot is used in evaluation of the
injector linearity.
Acceptance:-
R≥0.999
31
Column oven temperature accuracy:-
The efficiency of HPLC column varies with column temperature.
The temperature accuracy of the column heater is evaluated by
placing a calibrated thermometer in the column compartment
to measure the actual compartment temperature.
The thermometer readings are compared to the preset
temperature at 40 and 60°C.
Acceptance:-
The resulting oven temperature from the thermometer
display should be within ±2°C of the set temperature.
32
REFERENCES
Dr. Sohan S.Chitlange,Dr.Pravin Dchaudhari Pharmaceutical Validation Pharmatree Education First Edition April 2014,Page no: 1.1-4.4
Manohar A.Potdar Pharmaceutical Quality Assurance Nirali Prakashan Third Edition Octomber 2013.Page no ;8.1-8.44.