www.aquaticrc.com 18 Sunset Drive Ashburnham, MA 01430 508-397-0033 August 28, 2019 Bare Hill Pond Watershed Management Committee Bruce Leicher Town of Harvard 99 Ann Lee Road Harvard, MA 01451 Mr. Leicher, Attached is the report for the water quality sampling and aquatic plant surveys conducted in 2019. The phosphorus concentrations in 2019 started below 0.02 mg/L in May then rose a bit to 0.035 mg/L in June but came back down in July to 0.021 mg/L. I didn’t feel an August sample was justified since concentrations came back down and were not at the excessive level seen in 2018. The changes in the plant community this year was obvious. There was more tapegrass and pondweed (Vallisneria and Potamogeton) both are beneficial native species, but can become nuisance to recreation. I spoke with two residents that mentioned conditions this year were different than they remembered and each pointed out the species mentioned. There was a lot of filamentous green algae as well. And, with the some new equipment, I could see a few small patches of bluegreen mats at the bottom. We pulled three water chestnut (Trapa natans) plants from the southern end (Transect A) proximal to a partial “blue noodle” float. Perhaps someone marked the spot of other plants pulled earlier this year. Although there was an increase in the plant density this year, the increase is from native plant growth which provides beneficial habitat. These plants have likely kept invasive species from recolonizing these areas. The drawdown may be helping with lake flushing and keeping phosphorus concentrations low. For these reasons, I see no substantial evidence to suggest that a change in the drawdown program is warranted or recommended. Results of these analyses are provided in the attached report. Please let me know if you have any questions or comments regarding this report. Thank you for the opportunity to assist with your continued assessment and management of Bare Hill Pond. Sincerely, Wendy C. Gendron, CLM Aquatic Ecologist
Transcript
www.aquaticrc.com 18 Sunset Drive Ashburnham, MA 01430 508-397-0033
August 28, 2019
Bare Hill Pond Watershed Management Committee Bruce Leicher Town of Harvard 99 Ann Lee Road Harvard, MA 01451 Mr. Leicher, Attached is the report for the water quality sampling and aquatic plant surveys conducted in 2019. The phosphorus concentrations in 2019 started below 0.02 mg/L in May then rose a bit to 0.035 mg/L in June but came back down in July to 0.021 mg/L. I didn’t feel an August sample was justified since concentrations came back down and were not at the excessive level seen in 2018. The changes in the plant community this year was obvious. There was more tapegrass and pondweed (Vallisneria and Potamogeton) both are beneficial native species, but can become nuisance to recreation. I spoke with two residents that mentioned conditions this year were different than they remembered and each pointed out the species mentioned. There was a lot of filamentous green algae as well. And, with the some new equipment, I could see a few small patches of bluegreen mats at the bottom. We pulled three water chestnut (Trapa natans) plants from the southern end (Transect A) proximal to a partial “blue noodle” float. Perhaps someone marked the spot of other plants pulled earlier this year. Although there was an increase in the plant density this year, the increase is from native plant growth which provides beneficial habitat. These plants have likely kept invasive species from recolonizing these areas. The drawdown may be helping with lake flushing and keeping phosphorus concentrations low. For these reasons, I see no substantial evidence to suggest that a change in the drawdown program is warranted or recommended. Results of these analyses are provided in the attached report. Please let me know if you have any questions or comments regarding this report. Thank you for the opportunity to assist with your continued assessment and management of Bare Hill Pond. Sincerely, Wendy C. Gendron, CLM Aquatic Ecologist
Report For: Town of Harvard Bare Hill Pond Watershed Management Committee Harvard Massachusetts
Bare Hill Pond In-Lake Water Quality and Plant Surveys - 2019
Tables Table 1. History of Bare Hill Pond Winter Drawdowns. ............................................................... 2 Table 2. Bare Hill Pond Water Depth Profiles 2019. ................................................................... 5 Table 3. 2018 Bare Hill Pond In-lake Water Quality Data. .......................................................... 7 Table 4. 2019 Macrophyte Survey Data ....................................................................................10 Table 5. Bare Hill Pond Cover and Biovolume Relative Change ...............................................15
Figures Figure 1. Average Low Air Temperature and Number of Days below 30°F ................................ 3 Figure 2. Number of Days with Air Temperatures below 30°F during the Winter Season. .......... 4 Figure 3. Temperature & Dissolved Oxygen Profiles at BHP-2 for 2010-2019 ............................ 6 Figure 4. BHP-2 Total and Dissolved Phosphorus Concentrations. ............................................ 8 Figure 5. Bare Hill Pond (BHP-2) Secchi Disk Transparency. .................................................... 9 Figure 6. Bare Hill Pond 2019 Plant Cover ................................................................................12 Figure 7. Bare Hill Pond 2019 Plant Biovolume .........................................................................13 Figure 8. Bare Hill Pond Select Plant Species Frequency of Occurrence ..................................16 Figure 9. Iris Surveys 2018 and 2019 ........................................................................................18
Aquatic Restoration Consulting, LLC
Bare Hill Pond In-lake Water Quality & Plant Surveys 2019 1
Introduction Aquatic Restoration Consulting, LLC (ARC) performed in-lake water quality sampling and aquatic plant surveys within and surrounding Bare Hill Pond in 2019. The intent of these surveys were to document 2019 summer conditions and compare these data to previous years, identifying any trends. The Bare Hill Pond Watershed Committee (Committee) has conducted winter water level drawdowns periodically since 2002. Early drawdowns were limited to the depth of the outlet (3.5 foot drawdown) but the installation of a pump system enables the Committee to increase the drawdown depth. Substantial reductions in plant cover and density were observed in association with initial extended water level drawdowns and remained consistent following subsequent drawdowns. A shift in species dominance from tall growing vegetative propagators (spread through fragmentation or by rhizomes) to low growing seed producers was observed. A history of drawdown depth and summary of conditions reported by the Committee is provided in Table 1. The Committee, in consultation with ARC and the Town of Harvard Conservation Commission, decided not to perform a drawdown over the winter of 2013–2014. The purpose of the hiatus was to determine if taking a year off would result in discernible changes to the plant community and/or water quality. While the 2014 survey showed no substantial evidence in the observation points to suggest a drastic increase in plant growth, fanwort (Cabomba caroliniana) regained dominance in a portion of the drawdown zone. Observations outside the surveyed points by ARC and lake users made note of a general increase in plant growth. Watershield (Brasenia schreberi) was more prevalent in many areas outside the measurement points. Measurable changes in phosphorus concentrations were not observed in 2014. Given the observed increase in plant abundance and concerns by residents that plant density will continue to increase in absence of a drawdown, the Conservation Commission permitted drawdowns in following years. This report summarizes data collected in 2019 and provides a comparison over several years, with an emphasis on the comparison within the last five years.
Aquatic Restoration Consulting, LLC
Bare Hill Pond In-lake Water Quality & Plant Surveys 2019 2
Table 1. History of Bare Hill Pond Winter Drawdowns.
Winter Season Water Level Reduction and Summary of Following Growing Season Observations
2002-03 1.5 Feet
2003-04 3.5' gravity drawdown
2004-05 3.5' gravity drawdown
2005-06 3.5' gravity drawdown - these first few created evidence of efficacy in drawdown zone and no evidence of substantial issues
2006-07 5' gravity and pump drawdown - some increase in efficacy
2007-08 5' gravity and pump drawdown - good freeze and improvement
2008-09 3.5' gravity drawdown - per request to see if a year off pumping would work - limited efficacy and rebound in plants
2009-10 6' gravity and pump drawdown - planning started for beach excavation and the storm water rain gardens
2010-11 6.5' gravity and pump drawdown - continued incremental efficacy and no harm detected
2011-12 7' gravity and pump drawdown - more efficacy and depth needed for the beach excavation project
2012-13 6' gravity and pump drawdown - backed off to see if efficacy could be maintained
2013-14 No drawdown - year off to see if lower frequency worked - phosphorous stable, some re-emergence in spots
2014-15 5.5' drawdown - heavy snowfall runoff - phosphorous increase and increased observance of invasives by residents in 5-8 foot zone but overall reduction in plant volume and at transect sites
2015-16 6.0’ drawdown – very mild winter with an extended warm, dry and sunny growing season following
2016-17 5.75’ drawdown – very mild winter, even warmer than previous year. Wet spring and summer; water level higher than past years
2017-18 6' drawdown; cold long winter with freezing temperatures into April. Period of hot humid weather leading to a pattern of extended wet weather. Water levels remained high throughout the summer.
2018-19 4.5’ drawdown. While 6’ was the goal, it was difficult to achieve the desired drawdown depth due to precipitation. The early portion of the summer was wet and overcast, but come July it was warm and dry.
Aquatic Restoration Consulting, LLC
Bare Hill Pond In-lake Water Quality & Plant Surveys 2019 3
Influence of Weather Ideal conditions for a winter water level drawdown to control rooted plants is a consistent cold winter (consecutive days below freezing) with little rain or snow. Snow insulates the ground preventing the hard freeze necessary to kill plant roots. Looking at the historic weather conditions recorded at Fitchburg Airport since 2009 during the Nov 15 through Mar 15 winter season, the winters of 2013-2014 and 2014-2015 had the lowest average minimum temperatures (18.0 and 17.2°F, respectively (Figure 1). The number of days when the low temperature fell below 30°F was 102 during 2013-2014, representing 84% of the days during the period of analysis; similarly, 92 days experienced low temperatures below 30°F in 2014-2015 representing 76% of the time (Figure 2). The next two winters were milder with average lows in mid-20 degrees with fewer days below 30°F. 2017-2018 and 2018-2019 were cold years with 98 and 95 days with low temperatures (81% and 79% of the days) with an average low of 19.5 and 20.2°F.
Figure 1. Average Low Air Temperature and Number of Days below 30°F during the Winter Season.
Aquatic Restoration Consulting, LLC
Bare Hill Pond In-lake Water Quality & Plant Surveys 2019 4
Figure 2. Number of Days with Air Temperatures below 30°F during the Winter Season.
In-Lake Sampling In-lake sampling was conducted on May 30, June 27, and July 25, 2019. ARC used the same sampling methods as prior surveys for data collection consistency (see prior reports for methodology). In-situ water depth profile measurements of temperature, dissolved oxygen (DO), and specific conductivity were recorded at two locations: shallow basin BHP-1 in the south basin and the deep hole in the north basin BHP-2 (Table 2). Figure 3 provides a graphical representation of temperature and DO data for the deep station (BHP-2) in comparison with prior years. The temperature and DO profiles suggest that the lake began to thermally stratify in May and was weakly stratified by June. Surface water temperature was warmer than most years and DO in waters deeper than eight feet had the lowest oxygen concentration in the last eight years. July temperatures remained high. As in the past, DO depletion was also noted above the thermocline at about 12 feet. The hypolimnion was mostly devoid of oxygen except a slight increase in oxygen at 16 feet (Table 2, Figure 3). This could indicate a pocket of algae; a similar bump was seen in 2018 at 19 feet. These data suggest that there is substantial oxygen consumption in bottom waters with little to no mixing. This condition increases the potential for sediment phosphorus release and if mixed with upper water, could result in an algal bloom.
Aquatic Restoration Consulting, LLC
Bare Hill Pond In-lake Water Quality & Plant Surveys 2019 5
Table 2. Bare Hill Pond Water Depth Profiles 2019.
Bare Hill Pond In-lake Water Quality & Plant Surveys 2019 6
Figure 3. Temperature & Dissolved Oxygen Profiles at BHP-2 for 2010-2019
Aquatic Restoration Consulting, LLC
Bare Hill Pond In-lake Water Quality & Plant Surveys 2019 7
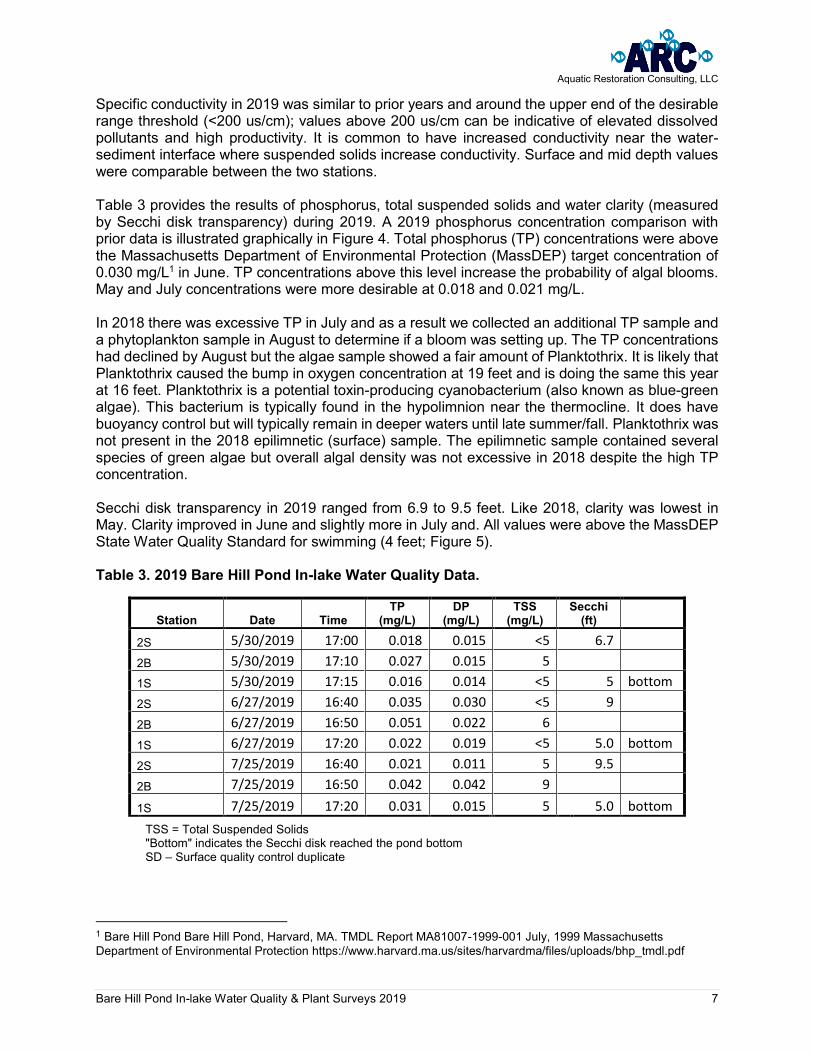
Specific conductivity in 2019 was similar to prior years and around the upper end of the desirable range threshold (<200 us/cm); values above 200 us/cm can be indicative of elevated dissolved pollutants and high productivity. It is common to have increased conductivity near the water-sediment interface where suspended solids increase conductivity. Surface and mid depth values were comparable between the two stations. Table 3 provides the results of phosphorus, total suspended solids and water clarity (measured by Secchi disk transparency) during 2019. A 2019 phosphorus concentration comparison with prior data is illustrated graphically in Figure 4. Total phosphorus (TP) concentrations were above the Massachusetts Department of Environmental Protection (MassDEP) target concentration of 0.030 mg/L1 in June. TP concentrations above this level increase the probability of algal blooms. May and July concentrations were more desirable at 0.018 and 0.021 mg/L. In 2018 there was excessive TP in July and as a result we collected an additional TP sample and a phytoplankton sample in August to determine if a bloom was setting up. The TP concentrations had declined by August but the algae sample showed a fair amount of Planktothrix. It is likely that Planktothrix caused the bump in oxygen concentration at 19 feet and is doing the same this year at 16 feet. Planktothrix is a potential toxin-producing cyanobacterium (also known as blue-green algae). This bacterium is typically found in the hypolimnion near the thermocline. It does have buoyancy control but will typically remain in deeper waters until late summer/fall. Planktothrix was not present in the 2018 epilimnetic (surface) sample. The epilimnetic sample contained several species of green algae but overall algal density was not excessive in 2018 despite the high TP concentration. Secchi disk transparency in 2019 ranged from 6.9 to 9.5 feet. Like 2018, clarity was lowest in May. Clarity improved in June and slightly more in July and. All values were above the MassDEP State Water Quality Standard for swimming (4 feet; Figure 5). Table 3. 2019 Bare Hill Pond In-lake Water Quality Data.
Station Date Time TP
(mg/L) DP
(mg/L) TSS
(mg/L) Secchi
(ft) 2S 5/30/2019 17:00 0.018 0.015 <5 6.7
2B 5/30/2019 17:10 0.027 0.015 5
1S 5/30/2019 17:15 0.016 0.014 <5 5 bottom
2S 6/27/2019 16:40 0.035 0.030 <5 9
2B 6/27/2019 16:50 0.051 0.022 6
1S 6/27/2019 17:20 0.022 0.019 <5 5.0 bottom
2S 7/25/2019 16:40 0.021 0.011 5 9.5
2B 7/25/2019 16:50 0.042 0.042 9
1S 7/25/2019 17:20 0.031 0.015 5 5.0 bottom
TSS = Total Suspended Solids "Bottom" indicates the Secchi disk reached the pond bottom SD – Surface quality control duplicate
1 Bare Hill Pond Bare Hill Pond, Harvard, MA. TMDL Report MA81007-1999-001 July, 1999 Massachusetts Department of Environmental Protection https://www.harvard.ma.us/sites/harvardma/files/uploads/bhp_tmdl.pdf
Aquatic Restoration Consulting, LLC
Bare Hill Pond In-lake Water Quality & Plant Surveys 2019 8
Figure 4. BHP-2 Total and Dissolved Phosphorus Concentrations.
Aquatic Restoration Consulting, LLC
Bare Hill Pond In-lake Water Quality & Plant Surveys 2019 9
Figure 5. Bare Hill Pond (BHP-2) Secchi Disk Transparency.
In-lake Plant Survey ARC conducted a plant survey on August 24, 2019. We used the same methods employed during the previous surveys conducted in 1998 through 2018. ARC mapped pond aquatic vegetation along the five transects (A through E) established in 1998. We also repeated the eight points added in 2016 (F through I). Each transect was divided into a series of observation points and were located using Global Positioning System (GPS). A total of 60 points were assessed during the survey. The plant survey focused on macroscopic fully submerged (e.g., milfoil), floating-leaved (e.g., pond lily), and/or free floating plants (e.g., duckweed). At each transect point, we recorded the percent cover of all plants, the percent biovolume (as measured by the amount of the water column filled with plants) using a semi-quantitative (0-5) ranking system. A rank of 0 represented 0% cover/biovolume. A rank of 1 corresponded to 1 - 25% cover/biovolume; 2 = 26 - 50%; 3 = 51 - 75%; 4 = 76 - 99; and 5 = 100%. Species observed in each transect were identified and assigned a percent of composition of all species present. Water depth was also recorded at each transect point. These data are presented in Table 4 and Figures 6 and 7. .
Aquatic Restoration Consulting, LLC
Bare Hill Pond In-lake Water Quality & Plant Surveys 2019 10
Table 4. 2019 Macrophyte Survey Data
Shaded cell indicates dominant species at observation point
Point Water Depth (ft)Cover
Bio-
volume Bs BG Cc Cd Ec FG Iso Macro AlgaeMega Mh Mhum Nf Nm No Nv Pa Pc Poly Prob Pspir Pot Sg Spar Usp Va
A-1 3.3 2 2 60 10 10 20
A-2 3.5 3 2 50 25 25
A-3 3.8 4 2 30 30 15 5 20
A-4 4.0 4 3 10 10 40 40
A-5 4.5 4 3 30 30 30 5 5
A-6 4.5 5 2 20 10 10 10 20 10 20
A-7 5.5 5 4 20 20 15 30 15
A-8 5.5 2 2 10 90
A-9 6.8 2 1 70 30
A-10 10.5 4 2 100
A-11 11.5 1 1 100
A-12 13.2 0 0
A-13 5.5 2 1 25 5 5 5 60
B-1 3.5 5 3 10 10 25 5 5 5 5 10 25
B-2 4.8 4 1 10 20 10 30 10 20
B-3 4.8 5 3 40 20 40
B-4 4.5 5 3 5 40 40 5 10
B-5 5.0 4 1 10 25 10 15 40
B-6 4.5 5 1 5 15 5 25 5 25 20
B-7 4.8 5 1 5 5 10 10 40 30
B-8 5.2 4 1 10 10 10 10 30 30
B-9 4.7 5 1 10 5 10 10 10 25 30
B-10 4.5 5 1 5 5 25 15 20 30
C-1 6.0 4 3 60 20 10 10
C-2 8.3 4 2 10 90
C-3 9.0 4 3 10 10 80
C-4 10.0 4 2 90 10
C-5 12.7 1 1 100
C-6 12.3 4 2 100
C-7 11.7 4 2 100
C-8 7.3 4 3 40 20 10 30
D-1 4.2 3 1 40 25 10 25
D-2 4.5 5 3 30 10 30 30
D-3 4.5 5 4 10 20 30 40
D-4 4.3 5 2 25 30 5 5 5 5 5 20
D-5 4.4 5 3 25 15 15 5 20 20
D-6 4.6 5 2 30 10 20 10 20 10
D-7 4.3 5 3 20 10 5 60 5
D-8 4.5 5 2 10 15 15 50 10
D-9 5.5 5 2 5 20 40 5 30
Aquatic Restoration Consulting, LLC
Bare Hill Pond In-lake Water Quality & Plant Surveys 2019 11
Table 5 (continued). 2019 Macrophyte Survey Data
Shaded cell indicates dominant species at observation point
Species Composition
Point Water Depth (ft)Cover
Bio-
volume Bs BG Cc Cd Ec FG Iso Macro AlgaeMega Mh Mhum Nf Nm No Nv Pa Pc Poly Prob Pspir Pot Sg Spar Usp Va
Mh – Myriophyllum heterophyllum (variable-leaf milfoil) Usp – Utricularia spp. (bladderwort)Nf - Najas flexilis Va - Vallisneria americana (tapegrass)Nm - Najas minor (brittle waternymph)
Aquatic Restoration Consulting, LLC
Bare Hill Pond In-lake Water Quality & Plant Surveys 2019 12
Figure 6. Bare Hill Pond 2019 Plant Cover
E
D
Points 1-8
Points 1-13
B
C
F Points
1-2
Points 1-10
G Points
1-2
I
Points 1-12
A Points
1-8 Points
1-2
H
Points 1-2
Aquatic Restoration Consulting, LLC
Bare Hill Pond In-lake Water Quality & Plant Surveys 2019 13
Figure 7. Bare Hill Pond 2019 Plant Biovolume
E
D
Points 1-8
Points 1-13
B
C
F Points
1-2
Points 1-10
G Points
1-2
I
Points 1-12
A Points
1-8 Points
1-2
H
Points 1-2
Aquatic Restoration Consulting, LLC
Bare Hill Pond In-lake Water Quality & Plant Surveys 2019 14
Table 5 provides a comparison between the last four surveys. The “IN” column in Table 5 represents the sample locations that were susceptible to the prior year’s drawdown (“in” the drawdown zone). One would expect to see changes in this column with variation of drawdown depth, provided the weather is ideal (exposed shoreline is subjected to freezing temperatures for a prolonged period without the insulating effect of snow cover). The “OUT” column represents data at sample locations where water depths are greater than the drawdown depth (“out” of the drawdown zone). No change related to the drawdown is expected in these cells. Ranks shaded green represent a change of two or more categories lower than the previous year and, in general, represent a desired outcome. Numbers shaded red indicate a two category change higher (an increase in plant cover or biovolume over the previous year). 2014 data do not have shaded values as 2014 was the starting point for this comparison. The prior year’s drawdown depth is shown in parentheses next to the year. All 2014 data are presented in the “OUT” column and the drawdown depth is zero since there wasn’t a drawdown the prior winter. Generally, a shift by two or more ranks (e.g. change from rank 1 to 3) is required before statistical significance is reportable. Data for 2019 were expected to be similar to 2018 given the weather but the desired drawdown depth was not reached. Water temperatures in May were warmer than prior years and could have encouraged plant growth early. The survey data show very similar cover conditions to 2018. There was a decrease in cover at two points and an increase at one. In contrast to cover, there was a noticeable increase in biovolume in 2019. Nine locations had an increase by two ranks (17% of the observation locations). Six locations with increases were outside the drawdown zone and three were within. The species composition at the sites with increased biovolume within the drawdown zone can be attributable to an increased abundance of a native pondweed. While it is difficult to identify some of the finer leaved pondweeds, this species is likely small pondweed (Potamogeton pusillus). It is a very common plant with high habitat value but can get abundant and annoying to recreational users of the lake. Many species of aquatic biota seek refuge and feed on small pondweed, including painted turtles and fish. It can reproduce with seeds, turions (overwintering buds) as well as vegetatively which make it an ideal plant to thrive in the drawdown zone. There was also a noted increase in filamentous green algae at these locations. There was one location where the biovolume increase was due to an increase in the non-native invasive fanwort (Cabomba caroliniana). The general appearance of the pond also showed more tapegrass (Vallisneria americana). This was corroborated based on anecdotal accounts in conversation with two residents encountered during the survey. The frequency of occurrence data did capture this increase of tapegrass as well. It was observed at 18 points in 2018 and 29 points in 2019. Like small pondweed, tapegrass is an important native species with high habitat value. It has ribbon like leaves that grow in clusters. It is generally benign to lake users until it sends up flower stalks that squiggle their way to the surface. It spreads through rhizomes and seeds. It is also a popular aquarium plant. Select plant species frequency data are shown in Figure 8.
Aquatic Restoration Consulting, LLC
Bare Hill Pond In-lake Water Quality & Plant Surveys 2019 15
Table 6. Bare Hill Pond Cover and Biovolume Relative Change
Increase by 2 or more ranks from prior year Decrease by 2 or more ranks from prior year
Bare Hill Pond In-lake Water Quality & Plant Surveys 2019 16
Figure 8. Bare Hill Pond Select Plant Species Frequency of Occurrence
0
10
20
30
40
50
60
70
80
90
Water Shield Fanwort Milfoil Macro Algae Filament Algae White Water Lily Naiad Pond Weed(Robins)
Bladderwort Tapegrass
Fre
qu
en
cy o
f O
ccu
rre
nce
(%
of
ob
serv
atio
n p
oin
ts)
Select Species Frequency of Occurrence
1998
2001
2004
2007
2010
2013
2014
2015
2016
2017
2018
2019
Aquatic Restoration Consulting, LLC
Bare Hill Pond In-lake Water Quality & Plant Surveys 2019 17
Shoreline Iris Survey In 2013 ARC marked the lateral extent of yellow iris (Iris pseudacorus) along Bare Hill Pond’s shoreline. At the time, residents and the Conservation Commission were concerned that the drawdown was encouraging the growth and expansion of this non-native invasive species. Yellow iris is an invasive species that can outcompete native shoreline plants, reducing diversity and habitat value. ARC repeated the presence/absence mapping of iris in June 2018 and 2019. The latitude and longitude of iris clusters were recorded using a handheld GPS unit when observed. Not all plants were in bloom at the time of these surveys and could be confused with similar species. We observed the native iris species (blue flag iris) at multiple locations around of the pond. It is possible that some of these points may represent native blue iris. A map of the two surveys (2018 & 2019) is provided in Figure 9. Abundance of iris in 2019 was similar to 2018 with a few more locations identified in 2019. These locations were within the dense stand of cattail at the southern end of the lake and do not necessarily indicate a spread of the plant; Iris can easily be missed among the cattail. This plant is can grow in up to 8 inches of water and can tolerate fluctuating water levels. Most of the iris observed were in waters less than 1’ deep or on the bank.
Wetland Plot Monitoring Four pre-established wetland plots were surveyed on August 18, 2019. Two plots are located downstream of the dam and two plots are located north of the town beach. A wetland scientist recorded plants using the same methodology used by ENSR in 2001 (MassDEP Handbook: Delineating Bordering Vegetated Wetlands Under the Massachusetts Wetlands Protection Act). Plot coordinate locations were established in 2016 and relocated using GPS for the 2019 survey. Plot locations were further verified by locating previous markings of pink surveyor’s ribbons. The 2019 survey observations indicated only slight changes in plant coverage and abundance with a few new species and a few absent species documented. Generally, the plant coverage and abundance within each plot remained similar to that of previous years. Cattail (Typha latifolia) continued to be the dominate species in all four plots, although a slight decrease in cover was observed in most of the plots. Common reed (Phragmites australis) was again observed within the wetland north of the dam (although not within the monitoring plot) and abundance appeared to be slightly increased from the 2018 observations, see photo 7 of the photo log in the Appendix. The overall abundance and cover of Purple loosestrife (Lythrum salicaria) appeared similar to the 2018 survey and no recordable increases were noted. However the plants did not have evidence of heavy grazing as they did last year. Based on a comparison of the 2018 data no significant changes to vegetation abundance or cover were observed and only slight fluctuations in plant species. Plot descriptions and photo log are included in the Appendix.
Aquatic Restoration Consulting, LLC
Bare Hill Pond In-lake Water Quality & Plant Surveys 2019 18
Figure 9. Iris Surveys 2018 and 2019
Aquatic Restoration Consulting, LLC
Bare Hill Pond In-lake Water Quality & Plant Surveys 2019 19
Conclusion Water quality data were not within the ideal range for all months in 2019 but values were not as high as in 2018. Water clarity remain largely unchanged. The lake continues to have low-no oxygen in much of the hypolimnion and the blip of oxygen in the hypolimnion suggest that algae is growing in deep waters and has the potential to rise to the photic zone creating a bloom. The region had significant rainfall in early summer followed by a prolonged period of warm-hot sunny weather. This resulted in early warm water temperatures, depletion of oxygen and possibly increased plant and filamentous algae growth. The plant composition change was evident and quantifiable. There was a surge in pondweed, tapegrass and filamentous green algae. The drawdown may be favoring the growth of the pondweed and tapegrass as these plants are both seed producers. The warm sunny weather this summer likely helped promote growth of plants and algae this year. Overall conditions within the wetland plots remain the same. The hand pulling of common reed in the wetland north of the dam may have retarded the spread but has not reduced the density. This plant has the capability to significantly reduce the diversity of this wetland. But for now, plant diversity in the sampling plots remain high. The water level was up in the wetland again this year. Although there was an increase in the plant density this year, the increase is from native plant growth which provides beneficial habitat. These plants have likely kept invasive species from recolonizing these areas. The drawdown may be helping with lake flushing and keeping phosphorus concentrations low. For these reasons, I see no substantial evidence to suggest that a change in the drawdown program is warranted or recommended.
Aquatic Restoration Consulting, LLC
Bare Hill Pond In-lake Water Quality & Plant Surveys 2019 Appendix
Appendix – Wetland Plot Monitoring (current and last year only)
Aquatic Restoration Consulting, LLC
Bare Hill Pond In-lake Water Quality & Plant Surveys 2019 Appendix
Aquatic Restoration Consulting, LLC
Bare Hill Pond In-lake Water Quality & Plant Surveys 2019 Appendix
Aquatic Restoration Consulting, LLC
Bare Hill Pond In-lake Water Quality & Plant Surveys 2019 Appendix
2018 FIELD REPORT: VEGETATION SAMPLING SHEET
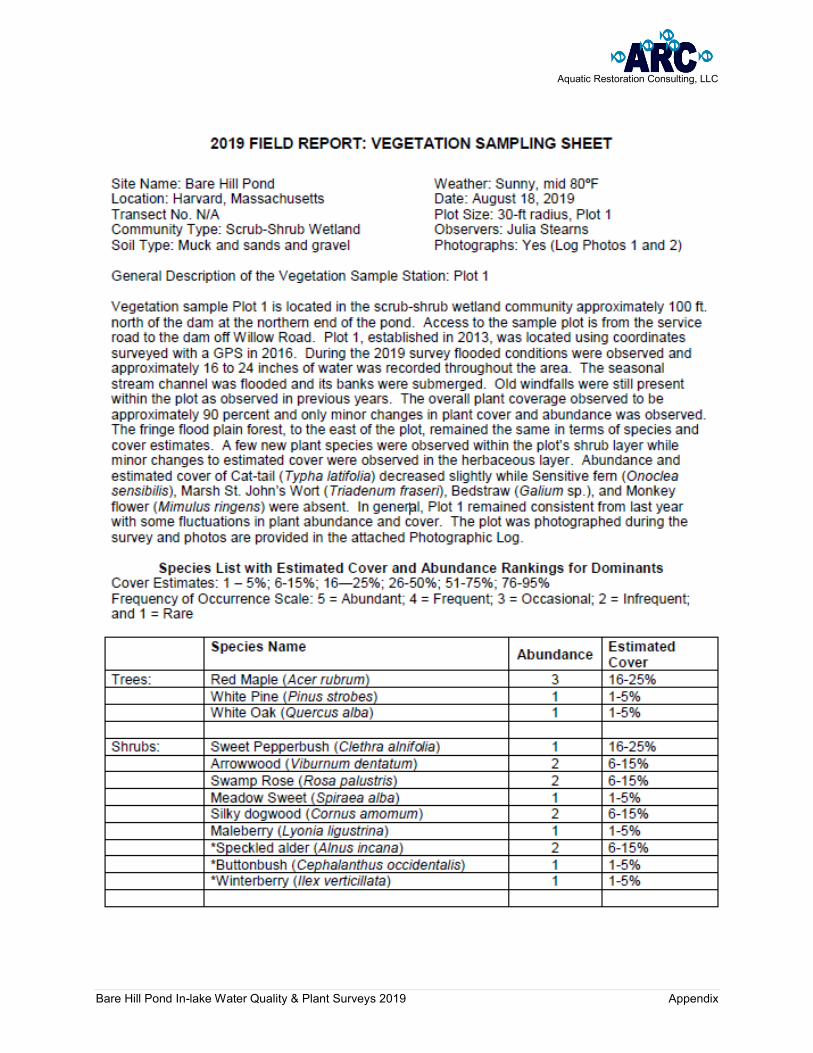
Site Name: Bare Hill Pond Weather: Sunny, mid 80sºF Location: Harvard, Massachusetts Date: August 23, 2018 Transect No. N/A Plot Size: 30-ft radius, Plot 1 Community Type: Scrub-Shrub Wetland Observers: Julia Stearns Soil Type: Muck and sands and gravel Photographs: Yes (Log Photos 1 and 2) General Description of the Vegetation Sample Station: Plot 1 Vegetation sample Plot 1 is located in the scrub-shrub wetland community approximately 100 ft. north of the dam at the northern end of the pond. Access to the sample plot is from the service road to the dam off Willow Road. Plot 1, established in 2013, was located using coordinates surveyed with a GPS in 2016. During the 2018 survey flooded conditions were observed and approximately 18 to 26 inches of water was recorded throughout the area. The seasonal stream channel observed in previous years was obscured by the high water though variations of water depths within the plot indicated the channel was still present. Old windfalls were also present within the plot. The overall plant coverage increased from 80 percent, observed in previous years, to approximately 85-90 percent. Plant diversity continues and only minor changes of estimated cover for some species were observed. The fringe flood plain forest, located to the east of the plot, has not changed in terms of species and cover estimates. A few new species were observed within the plot’s herbaceous layer, see table below. Estimated cover of cat-tail (Typha latifolia) increased slightly while Speckled alder (Alnus incana) and Black chokeberry (Aronia melanocarpa) were not observed this year, most likely due to difficulty identifying the exact plot location during the 2017 survey since these species are present within the wetland. The sample plot was photographed during the survey, see Photos 1 and 2 of the attached Photographic Log.
Species List with Estimated Cover and Abundance Rankings for Dominants Cover Estimates: 1 – 5%; 6-15%; 16—25%; 26-50%; 51-75%; 76-95% Frequency of Occurrence Scale: 5 = Abundant; 4 = Frequent; 3 = Occasional; 2 = Infrequent; and 1 = Rare Species Name Abundance Estimated
Cover Trees: Red Maple (Acer rubrum) 3 26-50% White Pine (Pinus strobes) 1 6-15% White Oak (Quercus alba) 1 1-5% Shrubs: Sweet Pepperbush (Clethra alnifolia) 1 16-25% Arrowwood (Viburnum dentatum) 2 6-15% Multiflora Rose (Rosa multiflora) 2 6-15% Swamp Rose (Rosa palustris) 1 1-5% Meadow Sweet (Spiraea alba) 1 1-5% Silky dogwood (Cornus amomum) 2 6-15% *Maleberry (Lyonia ligustrina) 1 1-5% Herbaceous: Cat-tail (Typha latifolia) 4 26-50% Wool-grass (Scirpus cyperinus) 2 6-15% Purple loosestrife (Lythrum salicaria) 2 6-15%
Aquatic Restoration Consulting, LLC
Bare Hill Pond In-lake Water Quality & Plant Surveys 2019 Appendix
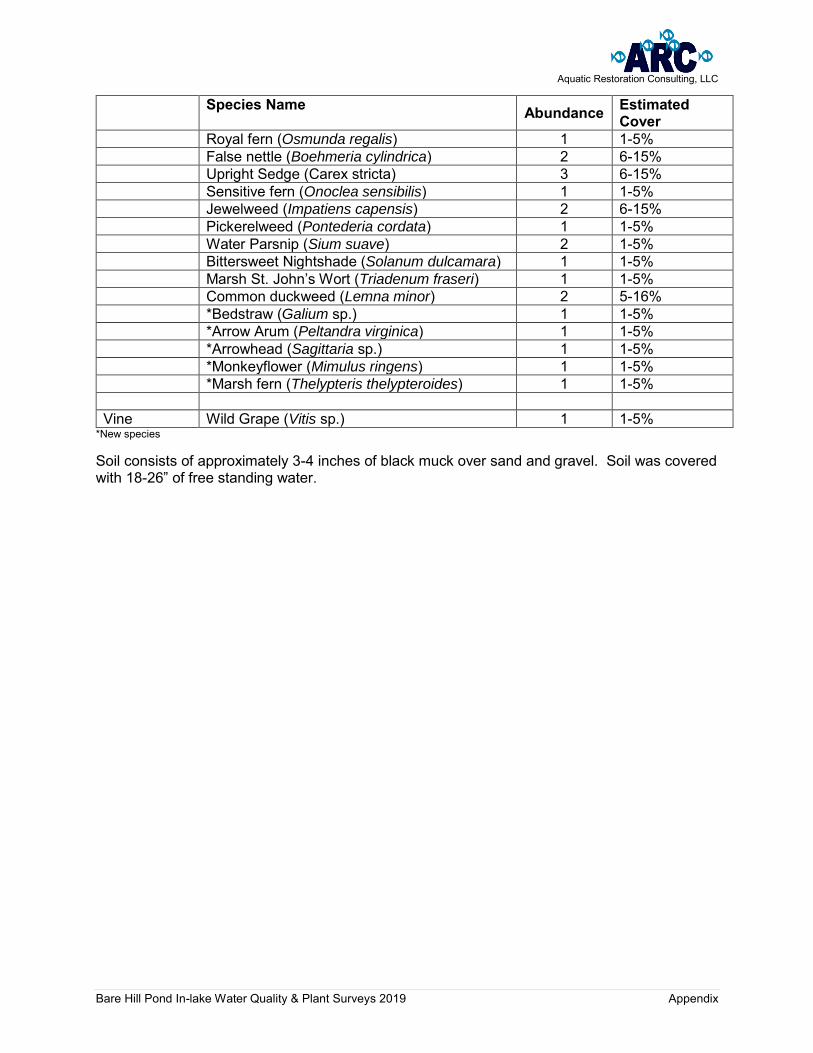
*New species Soil consists of approximately 3-4 inches of black muck over sand and gravel. Soil was covered with 18-26” of free standing water.
Aquatic Restoration Consulting, LLC
Bare Hill Pond In-lake Water Quality & Plant Surveys 2019 Appendix
Aquatic Restoration Consulting, LLC
Bare Hill Pond In-lake Water Quality & Plant Surveys 2019 Appendix
Aquatic Restoration Consulting, LLC
Bare Hill Pond In-lake Water Quality & Plant Surveys 2019 Appendix
2018 FIELD REPORT: VEGETATION SAMPLING SHEET
Site Name: Bare Hill Pond Weather: Sunny, mid 80sºF Location: Harvard, Massachusetts Date: August 23, 2018 Transect No. N/A Plot Size: 30-ft radius, Plot 2 Community Type: Scrub-Shrub Wetland Observers: Julia Stearns Soil Type: Muck and sands Photographs: Yes (Photos 3 and 4) General Description of the Vegetation Sample Station: Plot 2 Vegetation sample plot 2 is located in the scrub-shrub wetland community located approximately 500 ft. north of the dam at the northern end of the pond. Access to the sample plot is from the service road to the dam off Willow Road. The plot was located using GPS coordinates collected during the 2016 survey. The plot includes a fringe of flood plain forest along its eastern border that has not changed in species or abundance. Similar to previous surveyed years the plant cover estimate remains over 90 percent. During the 2018 survey slight variations in vegetative species and abundance were observed and four additional species were documented, Beggar tick (Bidens connate), Smartweed (Polygonum sp.), Jewelweed (Impatiens capensis), and Arrow arum (Peltandra virginica). Reductions in abundance of Cat-tail (Typha latifolia), Purple loosestrife (Lythrum salicaria), and False nettle (Boehmeria cylindrical) were also observed while Royal fern (Osmunda regalis) increased in abundance and estimated cover. Sensitive fern (Onoclea sensibilis) was not observed during this survey. Species abundance and cover remained similar to that of the 2017 survey. The sample plot was photographed during the survey and photos are provided in the Photograph Log (photos 3 and 4).
Species List with Estimated Cover and Abundance Rankings for Dominants Cover Estimates: 1 – 5%; 6-15%; 16—25%; 26-50%; 51-75%; 76-95% Frequency of Occurrence Scale: 5 = Abundant; 4 = Frequent; 3 = Occasional; 2 = Infrequent; and 1 = Rare Species Name Abundance Estimated
*New species Soil consists of approximately 8 inches of black muck over sand and gravel. Approximately 8-24” of standing water was observed amongst the vegetation.
Aquatic Restoration Consulting, LLC
Bare Hill Pond In-lake Water Quality & Plant Surveys 2019 Appendix
Aquatic Restoration Consulting, LLC
Bare Hill Pond In-lake Water Quality & Plant Surveys 2019 Appendix
2018 FIELD REPORT: VEGETATION SAMPLING SHEET Site Name: Bare Hill Pond Weather: Sunny, mid 80sºF Location: Harvard, Massachusetts Date: August 23, 2018 Transect No. N/A Plot Size: 30-ft radius, Plot 3 Community Type: Scrub-Shrub Wetland Observers: Julia Stearns Soil Type: Muck and sands and gravel Photographs: Yes (Log Photos 5 and 6) General Description of the Vegetation Sample Station: Plot 3 Vegetation sample Plot 3 is located in the scrub-shrub wetland community approximately 1,000 ft. north of town beach parking lot. Access to the sample plot is from the bike trail along Pond Road and approximately 300 ft. to the northwest. This plot, established in 2016, was marked in the field with pink surveyors ribbon tied to a stand of Speckled Alder at the plot’s eastern perimeter. The plot center was located approximately 30 feet west of this survey ribbon. The plot was also located approximately 100 ft. northwest of plot 4. A narrow fringe of scrub-shrub wetland occurs along the eastern border of the plot which was unchanged in terms of abundance and estimated cover. The estimated plant cover remained at over 85 percent and only a minor change to Wild grape (Vitis sp.) abundance was observed. The occurrence of Purple loosestrife (Lythrum salicaria) remained rare. The sample plot was photographed during the survey, see Photos 5 and 6 of the attached Photographic Log.
Species List with Estimated Cover and Abundance Rankings for Dominants Cover Estimates: 1 – 5%; 6-15%; 16-25%; 26-50%; 51-75%; 76-95% Frequency of Occurrence Scale: 5 = Abundant; 4 = Frequent; 3 = Occasional; 2 = Infrequent; and 1 = Rare Species Name Abundance Estimated
Soil consists of approximately 3-4 inches of black muck over sand and gravel. Approximately 12-24” of free standing water was observed covering the plot.
Aquatic Restoration Consulting, LLC
Bare Hill Pond In-lake Water Quality & Plant Surveys 2019 Appendix
Aquatic Restoration Consulting, LLC
Bare Hill Pond In-lake Water Quality & Plant Surveys 2019 Appendix
Aquatic Restoration Consulting, LLC
Bare Hill Pond In-lake Water Quality & Plant Surveys 2019 Appendix
2018 FIELD REPORT: VEGETATION SAMPLING SHEET
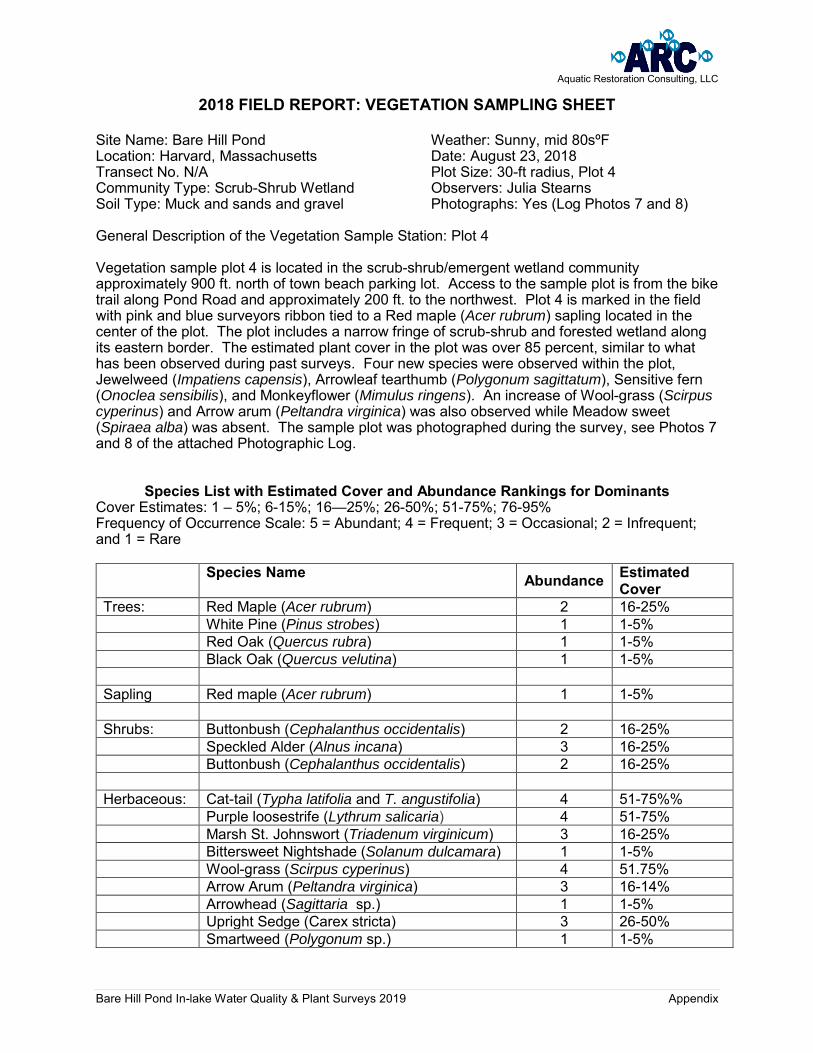
Site Name: Bare Hill Pond Weather: Sunny, mid 80sºF Location: Harvard, Massachusetts Date: August 23, 2018 Transect No. N/A Plot Size: 30-ft radius, Plot 4 Community Type: Scrub-Shrub Wetland Observers: Julia Stearns Soil Type: Muck and sands and gravel Photographs: Yes (Log Photos 7 and 8) General Description of the Vegetation Sample Station: Plot 4 Vegetation sample plot 4 is located in the scrub-shrub/emergent wetland community approximately 900 ft. north of town beach parking lot. Access to the sample plot is from the bike trail along Pond Road and approximately 200 ft. to the northwest. Plot 4 is marked in the field with pink and blue surveyors ribbon tied to a Red maple (Acer rubrum) sapling located in the center of the plot. The plot includes a narrow fringe of scrub-shrub and forested wetland along its eastern border. The estimated plant cover in the plot was over 85 percent, similar to what has been observed during past surveys. Four new species were observed within the plot, Jewelweed (Impatiens capensis), Arrowleaf tearthumb (Polygonum sagittatum), Sensitive fern (Onoclea sensibilis), and Monkeyflower (Mimulus ringens). An increase of Wool-grass (Scirpus cyperinus) and Arrow arum (Peltandra virginica) was also observed while Meadow sweet (Spiraea alba) was absent. The sample plot was photographed during the survey, see Photos 7 and 8 of the attached Photographic Log.
Species List with Estimated Cover and Abundance Rankings for Dominants Cover Estimates: 1 – 5%; 6-15%; 16—25%; 26-50%; 51-75%; 76-95% Frequency of Occurrence Scale: 5 = Abundant; 4 = Frequent; 3 = Occasional; 2 = Infrequent; and 1 = Rare Species Name Abundance Estimated
Cover Trees: Red Maple (Acer rubrum) 2 16-25% White Pine (Pinus strobes) 1 1-5% Red Oak (Quercus rubra) 1 1-5% Black Oak (Quercus velutina) 1 1-5% Sapling Red maple (Acer rubrum) 1 1-5% Shrubs: Buttonbush (Cephalanthus occidentalis) 2 16-25% Speckled Alder (Alnus incana) 3 16-25% Buttonbush (Cephalanthus occidentalis) 2 16-25% Herbaceous: Cat-tail (Typha latifolia and T. angustifolia) 4 51-75%% Purple loosestrife (Lythrum salicaria) 4 51-75% Marsh St. Johnswort (Triadenum virginicum) 3 16-25% Bittersweet Nightshade (Solanum dulcamara) 1 1-5% Wool-grass (Scirpus cyperinus) 4 51.75% Arrow Arum (Peltandra virginica) 3 16-14% Arrowhead (Sagittaria sp.) 1 1-5% Upright Sedge (Carex stricta) 3 26-50% Smartweed (Polygonum sp.) 1 1-5%
Aquatic Restoration Consulting, LLC
Bare Hill Pond In-lake Water Quality & Plant Surveys 2019 Appendix
*New species Soil consists of approximately 3-4 inches of black muck over sand and gravel. Soil was saturated and 8-14” of free standing water was observed.
Aquatic Restoration Consulting, LLC
Bare Hill Pond In-lake Water Quality & Plant Surveys 2019 Appendix
Aquatic Restoration Consulting, LLC
Bare Hill Pond In-lake Water Quality & Plant Surveys 2019 Appendix
Aquatic Restoration Consulting, LLC
Bare Hill Pond In-lake Water Quality & Plant Surveys 2019 Appendix
Aquatic Restoration Consulting, LLC
Bare Hill Pond In-lake Water Quality & Plant Surveys 2019 Appendix
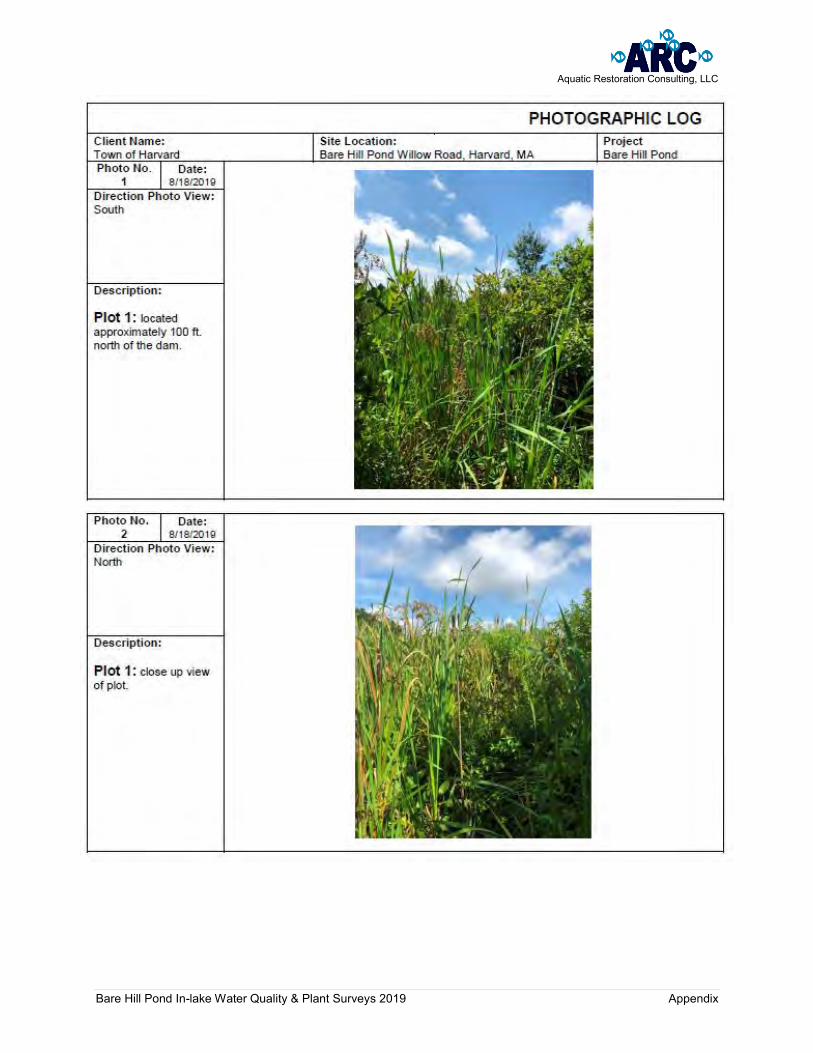
PHOTOGRAPHIC LOG Client Name: Town of Harvard
Site Location: Bare Hill Pond Willow Road, Harvard, MA
Project Bare Hill Pond
Photo No. 1
Date: 8/23/2018
Direction Photo View: East
Description: Plot 1: located approximately 100 ft. north of the dam.
Photo No.
2 Date:
8/23/2018
Direction Photo View: North
Description: Plot 1: close up view of plot.
Aquatic Restoration Consulting, LLC
Bare Hill Pond In-lake Water Quality & Plant Surveys 2019 Appendix
PHOTOGRAPHIC LOG Client Name: Town of Harvard, MA
Site Location: Bare Hill Pond, Willow Road, Harvard, MA
Project Bare Hill Pond
Photo No. 3
Date: 8/23/2018
Direction Photo View: North
Description: Plot 2: located 500 feet north of the dam and marked with pink survey ribbon visible in center of photograph.
Photo No.
4 Date:
8/23/2018
Direction Photo View: West
Description: Plot 2: Fringe forest in background is not part of the sample plot.
Aquatic Restoration Consulting, LLC
Bare Hill Pond In-lake Water Quality & Plant Surveys 2019 Appendix
PHOTOGRAPHIC LOG Client Name: Town of Harvard, MA
Site Location: Bare Hill Pond, Willow Road, Harvard, MA
Project Bare Hill Pond
Photo No. 5
Date: 8/23/2018
Direction Photo View: West
Description: Plot 3: dominant cattail in plot.
Photo No.
6 Date:
8/23/2018
Direction Photo View: East
Description: Plot 3: close-up view of plot.
Aquatic Restoration Consulting, LLC
Bare Hill Pond In-lake Water Quality & Plant Surveys 2019 Appendix
PHOTOGRAPHIC LOG Client Name: Town of Harvard, MA
Site Location: Bare Hill Pond, Willow Road, Harvard, MA
Project Bare Hill Pond
Photo No. 7
Date: 8/23/2018
Direction Photo View: North
Description: Plot 4: Purple loosestrife, wool-grass, and button bush apparent in photo.
Photo No.
8 Date:
8/23/2018
Direction Photo View: South
Description: Plot 4: center or plot marked with blue and pink ribbon.
Aquatic Restoration Consulting, LLC
Bare Hill Pond In-lake Water Quality & Plant Surveys 2019 Appendix
PHOTOGRAPHIC LOG Client Name: Town of Harvard
Site Location: Bare Hill Pond Willow Road, Harvard, MA