57
Valmet Roadshow Presentation December, 2013 Pasi Laine, President and CEO Markku Honkasalo, CFO Hanna-Maria Heikkinen, VP, Investor Relations
| Date post: | 11-Apr-2018 |
| Category: |
Documents |
| Upload: | hoangquynh |
| View: | 217 times |
| Download: | 0 times |

Valmet Roadshow Presentation December, 2013
Pasi Laine, President and CEO
Markku Honkasalo, CFO
Hanna-Maria Heikkinen, VP,
Investor Relations

Agenda Valmet Roadshow
Demerger timeline
Valmet overview
Investment highlights
Financials
Appendix
1
2
3
4
5

Demerger timeline
© Valmet | Roadshow 3
March 25 The Board of Directors
decided to undertake
demerger study
May 31 Demerger plan signed
by the Board of Directors
October 1 EGM decision
on demerger
October 24 Metso Q3
result release
November 26 Capital Markets Day
in London
December 30 Last day to purchase
or hold Metso shares
to receive Valmet
shares
December 31 Demerger effective
January 2,
2014 (Expected) Listing of Valmet
shares on NASDAQ
OMX Helsinki
December 2013
Valmet overview

© Valmet | Roadshow 5
Valmet’s Road to Becoming a Global Market Leader
December 2013
1942 Rauma-
Raahe
1951 Valmet
1951-1995 Several M&As
1968-1996 Several M&As i.e.
1986 KMW
1987 Wärtsilä paper finishing machinery
1992 Tampella Papertech
1999 Metso created
through the
merger of Valmet
and Rauma
Key acquisitions 2000 Beloit Technology
2006 Kvaerner Pulping
Kvaerner Power
2009 Tamfelt
End of 2013 Demerger to create
Valmet and Metso
1797 Tamfelt
1856 Tampella
1858 Beloit
1860 KMW
1868 Sunds
Defibrator

34%
39%
27%
Capitalizing on the growing pulp, energy, tissue, and packaging board needs globally
December 2013 © Valmet | Roadshow 6
17%
13%
11% 40%
19%
South and Central America
Asia-Pacific
China
North America
EMEA Services
Pulp and Energy Paper
Sales1 Global market leader with
#1-2 market positions in all
markets served
Stable, growing and profitable
EUR 1 billion services business
High barrier to entry capital
business with good long-term
growth potential in businesses
such as board, tissue, pulp, and
biotechnology
2012 figures1
Net sales1 EUR 3,014 m
Profit2 EUR 192 m
Employees 12,000
Position
#1-2 Services
#1-2 Pulping
#1-2 Bioenergy generation
#1-2 Paper, board, tissue
1) Carve-out figures for the periods indicated, 2012
2) EBITA before non-recurring items

Our three business lines serve the same customer base
December 2013 © Valmet | Roadshow 7
Services
Net sales1 1.0 bn, 34%
• Mill and plant improvements
• Roll and workshop services
• Parts and fabrics
• Life-cycle services
Pulp and Energy
Net sales1 1.2 bn, 39%
Technologies and solutions for
• Pulp production
• Power generation
• Biomass conversion
Paper
Net sales1 0.8 bn, 27%
Technologies and solutions for
• Board
• Tissue
• Paper
1) Net sales by business line on a carve-out basis for the periods indicated (excl. Intra-Metso net sales)
877 974 1,011 748
2010 2011 2012 1-9/2013
698 975
1,189
666
2010 2011 2012 1-9/2013
875 743 805
522
2010 2011 2012 1-9/2013
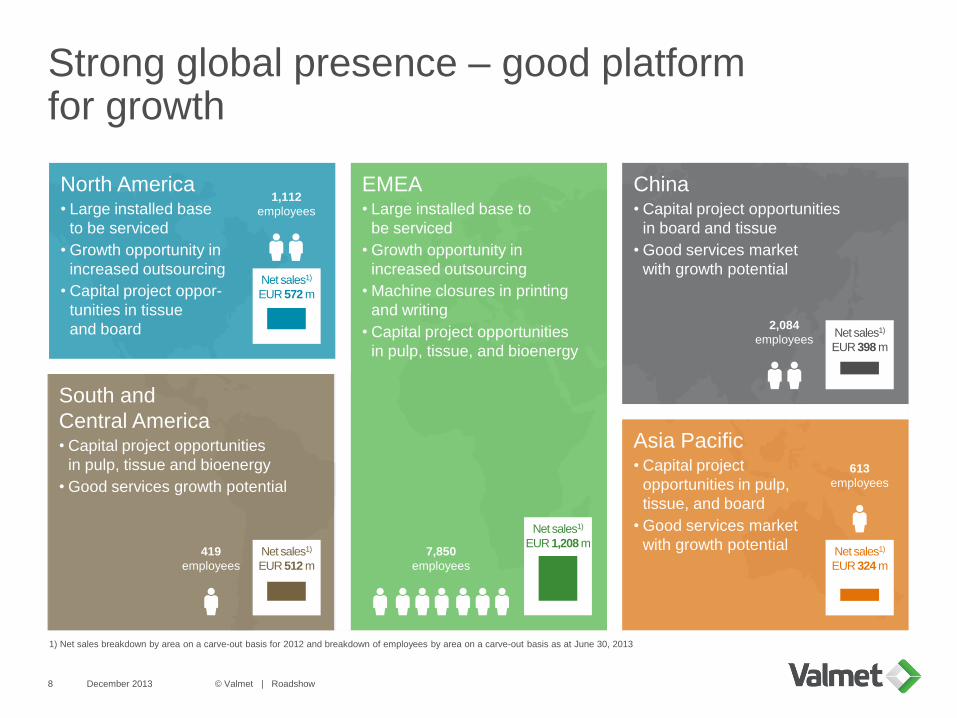
Strong global presence – good platform for growth
December 2013 © Valmet | Roadshow 8
North America
• Large installed base
to be serviced
• Growth opportunity in
increased outsourcing
• Capital project oppor-
tunities in tissue
and board
South and
Central America
• Capital project opportunities
in pulp, tissue and bioenergy
• Good services growth potential
EMEA
• Large installed base to
be serviced
• Growth opportunity in
increased outsourcing
• Machine closures in printing
and writing
• Capital project opportunities
in pulp, tissue, and bioenergy
Asia Pacific
• Capital project
opportunities in pulp,
tissue, and board
• Good services market
with growth potential
China
• Capital project opportunities
in board and tissue
• Good services market
with growth potential Net sales1)
EUR 572 m
Net sales1)
EUR 324 m
Net sales1)
EUR 512 m
Net sales1)
EUR 398 m
Net sales1)
EUR 1,208 m 419
employees
7,850
employees
613
employees
1,112
employees
2,084
employees
1) Net sales breakdown by area on a carve-out basis for 2012 and breakdown of employees by area on a carve-out basis as at June 30, 2013

Key customers Key customers Key customers
Serving global customer base
November 26, 2013 9
Valmet is a registered trademark of Valmet Corporation. Other trademarks appearing here are trademarks of their respective owners.
Services Pulp and Energy Paper
Yunnan Yun-Jing Forestry & Pulp Mill
© Valmet | Roadshow

© Valmet | Roadshow 10
Valmet’s way forward
Vision
To become the global
champion in serving
our customers
Must-wins
> Customer
excellence
> Leader in
technology
and innovation
> Excellence in
processes
> Winning team
Mission
Converting renewable
resources into
sustainable results
Strategy
Competitive
technologies and
services to the pulp,
paper and energy
industries.
Strong commitment to
move our customers’
performance
forward.
December 2013

Valmet’s Must-Win initiatives and objectives
November 26, 2013 11
• Reduce quality costs
• Savings in procurement
• Reduction in lead times
• Improve health and safety
• Improve project and service margin
• Implement cost competitiveness
program to reach EUR 100 million
cost savings
• Strengthen our presence close to customers and growth markets
• Strengthen Key Account Management to enhance growth at the customer
• Drive service growth through long-term agreements and expanded customer base
• Improve product cost competitiveness to increase gross profit
• Create new revenue from biotechnology solutions and new offering
• Strengthen high-performance culture
• Continue further globalization of our capabilities to be closer to customers
1. Customer
excellence
2. Leader in
technology and
innovation
3. Excellence
in processes
4. Winning
team
Primary Must-Win objectives Must-Wins
© Valmet | Roadshow
Investment highlights

Investment highlight summary
© Valmet | Roadshow 13
Established market leader with #1-2 market positions
in all markets served
Stable, growing, and profitable services business
with over EUR 1 billion sales provides good visibility
and resilience
Long-term growth potential in capital business
from increase in pulp, energy, board and tissue
consumption and from substitution of fossil fuels
Global diversified footprint with large exposure
to growing emerging markets
Strong focus on profitability improvement
1
2
3
4
5
December 2013

Established market leader with #1-2 market positions in all markets served
14
Market position
Services #1-2 Pulping #1-2 Bioenergy generation #1-2 Board #1-2
Tissue #1
Paper #1-2
Machines
• 3,800 pulp and paper mills
in the world
• Over 50% purchase services
from Valmet
Large installed base
• 200 wood-handling systems
• 470 cooking systems
• 300 complete fiber lines
• 400 evaporation systems
• 350 recovery islands
• 200 mechanical pulping lines
• 270 fluidized bed boilers
• 120 BioGrate boilers
• 400 environmental protection
systems
• 700 board machines
• 180 tissue machines
• 900 paper machines
Consistent investments in R&D
2010-2012 average ~EUR 70 m (2.5% of sales)
Extensive IP portfolio
~1,800 protected inventions – June 30, 2013
>70 new products launched per year
Pulp Energy Paper
1) Net sales in 2012 on a carve-out basis
1
Superior technological know-how
December 2013 © Valmet | Roadshow
Services (>EUR 1 bn)1 Capital (~EUR 2 bn)1
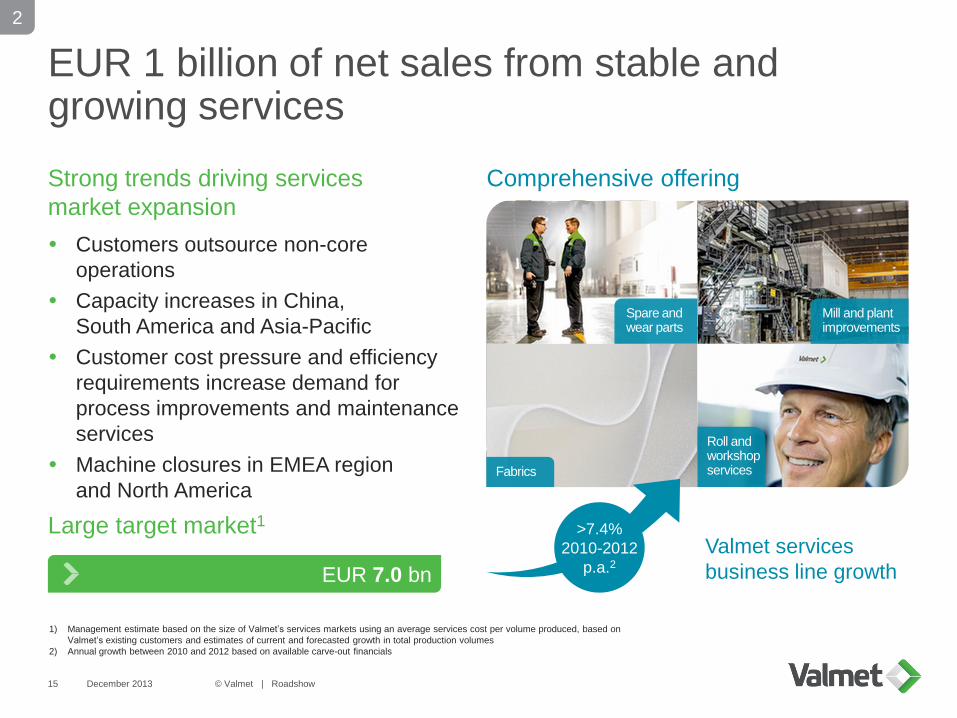
EUR 1 billion of net sales from stable and growing services
Strong trends driving services
market expansion
Customers outsource non-core
operations
Capacity increases in China,
South America and Asia-Pacific
Customer cost pressure and efficiency
requirements increase demand for
process improvements and maintenance
services
Machine closures in EMEA region
and North America
Large target market1
Comprehensive offering
15
1) Management estimate based on the size of Valmet’s services markets using an average services cost per volume produced, based on
Valmet’s existing customers and estimates of current and forecasted growth in total production volumes
2) Annual growth between 2010 and 2012 based on available carve-out financials
>7.4%
2010-2012
p.a.2
2
EUR 7.0 bn
Valmet services
business line growth
Spare and wear parts
Fabrics
Mill and plant improvements
Roll and workshop services
December 2013 © Valmet | Roadshow

Energy1
Pulp, energy, board, and tissue capital business on long-term growth trajectory
16
Source: Leading consulting firms, RISI, management estimates
Estimated market size for
current offering in 2012 (EUR)
• Growth in energy
consumption
• Demand for
sustainable energy
• Modernization of
aging plants
• Incentives and
regulation
• Shale gas in North
America and the
recession in Europe
reducing demand
• Growth in paper,
board, and tissue
consumption in Asia
• Need for virgin wood
pulp, as recycling
rates can not grow
infinitely
• Increased size of pulp
lines and mills
• Growth in pulping in
Asia and South
America
• World trade, e-
commerce and
emerging markets
growth drive
packaging
• Shift from plastic
packaging to
renewable materials
• Growth in emerging
markets
• Rise in purchasing
power and living
standards in
emerging markets
• Increasing role of
digital media
decreases demand
for printing and writing
papers
• Some growth in
emerging markets
Anticipated long-term market
growth
Demand drivers
Board Pulp Tissue Printing and
writing papers
and newsprint
~1% p.a.
2.0 bn
~1-2% p.a.
1.4 bn
~3% p.a.
1.0 bn
~3% p.a.
0.6 bn
~-1% p.a.
0.6 bn
3
December 2013 © Valmet | Roadshow
Pulp and Energy Paper
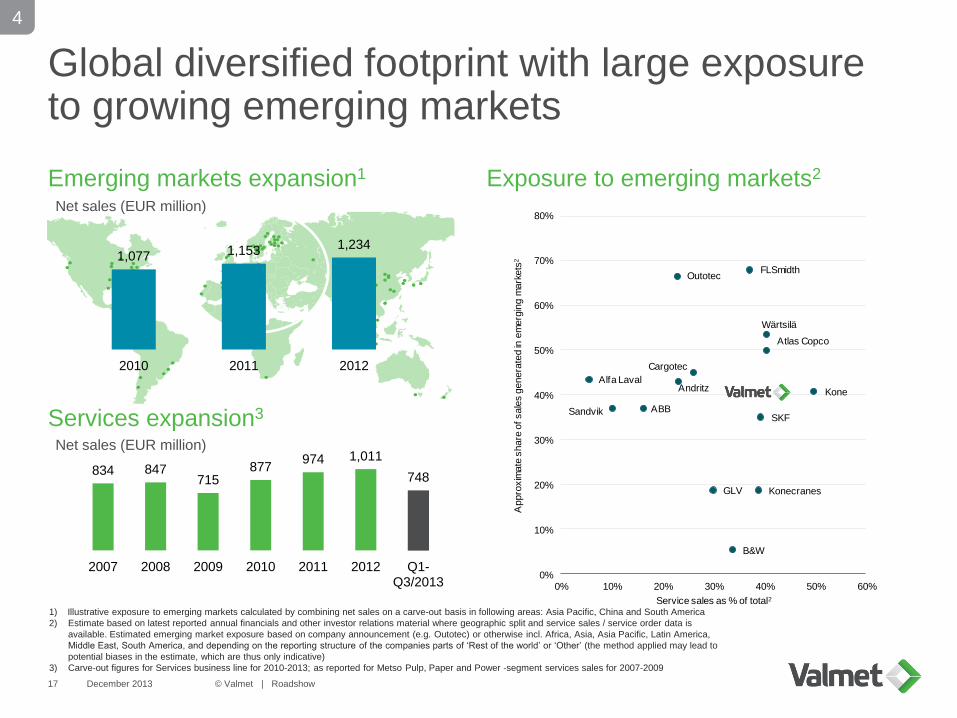
Global diversified footprint with large exposure to growing emerging markets
Services expansion3
Exposure to emerging markets2
17
Cargotec
Kone
Konecranes
Outotec
Wärtsilä
ABB
Alfa Laval
Atlas Copco
SandvikSKF
FLSmidth
Andritz
GLV
B&W
0%
10%
20%
30%
40%
50%
60%
70%
80%
0% 10% 20% 30% 40% 50% 60%
Appro
xim
ate
share
of sale
s g
enera
ted in
em
erg
ing m
ark
ets
2
Service sales as % of total2
1) Illustrative exposure to emerging markets calculated by combining net sales on a carve-out basis in following areas: Asia Pacific, China and South America
2) Estimate based on latest reported annual financials and other investor relations material where geographic split and service sales / service order data is
available. Estimated emerging market exposure based on company announcement (e.g. Outotec) or otherwise incl. Africa, Asia, Asia Pacific, Latin America,
Middle East, South America, and depending on the reporting structure of the companies parts of ‘Rest of the world’ or ‘Other’ (the method applied may lead to
potential biases in the estimate, which are thus only indicative)
3) Carve-out figures for Services business line for 2010-2013; as reported for Metso Pulp, Paper and Power -segment services sales for 2007-2009
Emerging markets expansion1
4
Net sales (EUR million)
Net sales (EUR million)
December 2013 © Valmet | Roadshow
834 847 715
877 974 1,011
748
2007 2008 2009 2010 2011 2012 Q1-Q3/2013
1,077 1,153 1,234
2010 2011 2012

Short- to mid-term
profitability
improvement through
cost-reduction
program with clearly
defined steps that
take profitability
towards the targeted
level
Strong focus on profitability improvement
Cost-savings program EUR 100 million
We are addressing the current decline
in the capital business
Valmet is re-shaping its operations to
become leaner, more flexible, and agile
Capacity being adjusted to meet the new level of
demand
Current level of SG&A expense base to be lowered
Additional actions to increase operational efficiency
Target to reach historical gross margin levels
December 2013 © Valmet | Roadshow 18
5

Financial review

Dividend
policy
Financial targets
December 2013 © Valmet | Roadshow 20
Profitability
Growth
ROCE
Net sales growth to exceed market growth
EBITA1 before non-recurring items: 6-9%
Return on capital employed (pre-tax),
ROCE 2: minimum of 15%
Dividend payout at least 40% of net profit
1) EBITA before non-recurring items = operating profit + amortization + non-recurring items
2) ROCE (pre-tax) = ( profit before taxes + interests and other financial expenses ) / ( balance sheet total - non-interest-bearing liabilities )

Net sales and profitability development, annual
December 2013 © Valmet | Roadshow 21
Net sales and EBITA before NRI (EUR million)1
1) Carve-out figures for 2010-2012; as reported for Metso’s Pulp, Paper and Power segment for 2006-2009
• Timing of large projects has had an impact on the level of net sales
• EBITA-% has been relatively stable over time
• The paper machine market has shifted to smaller and lower-cost machines
• The power generation market is changing due to low-cost shale gas and political and
economical uncertainty in Europe
• Intensified competition has had an impact on profitability
636 834 847 715 877 974 1,011 809
5.5%
6.3%
7.1%
5.6%
6.5%
7.6%
6.4%
5.3 %
4.1%
2006 2007 2008 2009 2010 2011 2012 Q1-Q3/13
Services
Capital
EBITA-%
2,092
2,925 2,735
2,061
2,453 2,703
3,014
1,946
115 184 194 116 159 205 192 79 EBITA before
NRI (MEUR)
EBITA
target 6-9%

Profitability improvement program
EUR 100 million savings program
Announced in April, 2013
Capacity being adjusted
SG&A expense base is being reduced
Status of the program
Two major negotiation processes completed
– Total cost reduction: EUR 75 million
– Total headcount reduction: approximately 1,000
– Major impact in Jyväskylä, Järvenpää, Tampere,
Pori, and Örnsköldsvik
– All business lines, areas, and functions impacted
Additional negotiations announced on October 21
– Targeted cost reduction: EUR 25 million by the end
of 2014
– Targeted headcount reduction: 425
– Impact on Energy and Service
Savings schedule advanced: EUR 100 million impact
by the end of 2014
Impact of announced actions (EUR million)
December 2013 © Valmet | Roadshow 22
75
100 25
Measures undertaken
currently
Measures announced
Q4/2013
by end of 2014
Total
100
~2/3
COGS
~1/3
SG&A

6.4%
4.1%
6-9%
2012 Q1-Q3/2013 Measures Target level
Profitability improvement actions
Actions to reach target margin
EUR 100 million savings program
Efficiency improvement actions aimed at
reaching historical gross margin levels
– Development of modularized and
standardized solutions
– Procurement savings
– Increased use of subcontracting and
external service providers
– Increasing the role of low-cost
countries in production and sourcing
EBITA margin before NRI1
December 2013 © Valmet | Roadshow 23
Increased flexibility and better capability to react
to changes in market conditions
1) Carve-out figures for the periods indicated
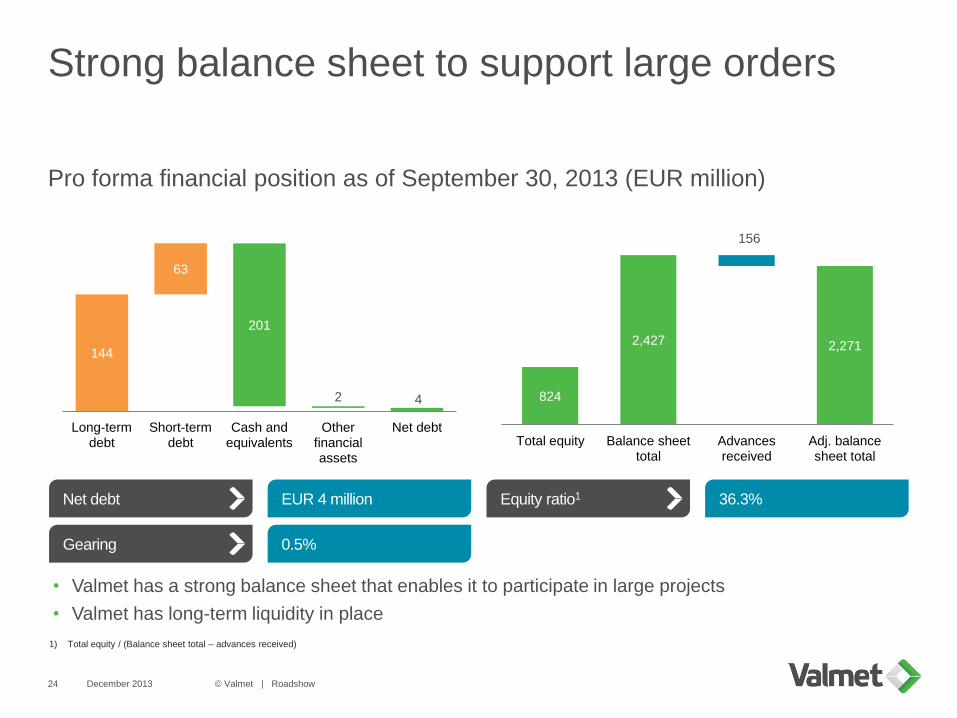
Strong balance sheet to support large orders
Pro forma financial position as of September 30, 2013 (EUR million)
December 2013 © Valmet | Roadshow 24
Net debt
Gearing
EUR 4 million
0.5%
Equity ratio1 36.3%
• Valmet has a strong balance sheet that enables it to participate in large projects
• Valmet has long-term liquidity in place
1) Total equity / (Balance sheet total – advances received)
144
4
63
201
2
Long-term debt
Short-term debt
Cash and equivalents
Other financial assets
Net debt
824
2,427 2,271
156
Total equity Balance sheet total
Advances received
Adj. balance sheet total
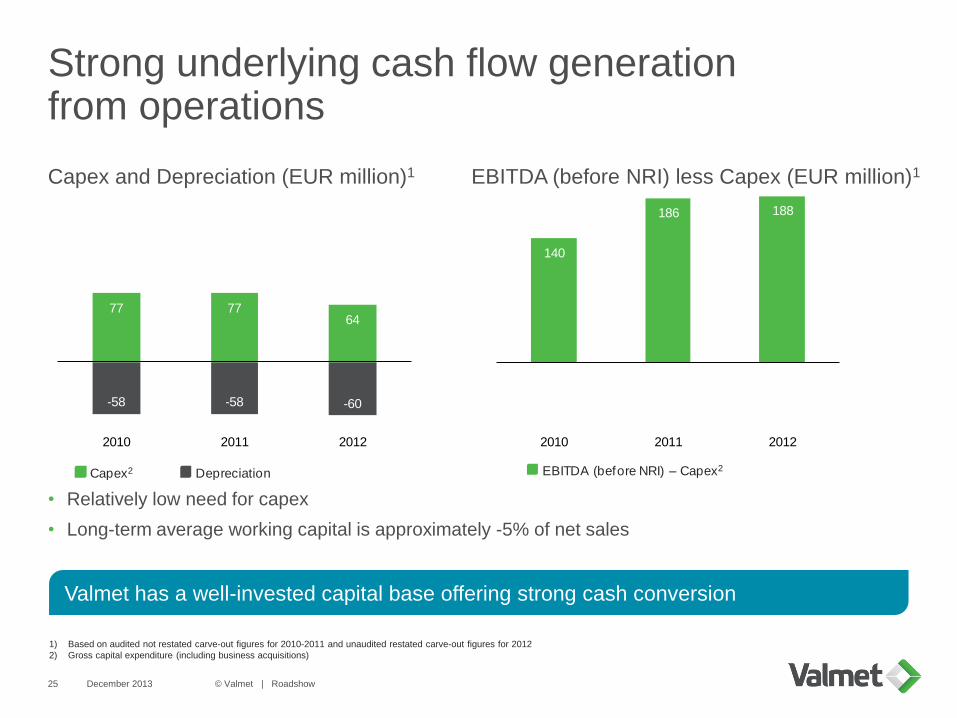
Strong underlying cash flow generation from operations
Capex and Depreciation (EUR million)1 EBITDA (before NRI) less Capex (EUR million)1
December 2013 © Valmet | Roadshow 25
• Relatively low need for capex
• Long-term average working capital is approximately -5% of net sales
1) Based on audited not restated carve-out figures for 2010-2011 and unaudited restated carve-out figures for 2012
2) Gross capital expenditure (including business acquisitions)
Valmet has a well-invested capital base offering strong cash conversion
77 7764
-58 -58 -60
2010 2011 2012
Capex2 Depreciation
140
186 188
2010 2011 2012
EBITDA (before NRI) – Capex2

Long-term liquidity in place
EUR 200 million syndicated
revolving credit facility
Maturity: 5 years from the demerger
date
International bank syndicate
EUR 52 million term loan
Maturity: 3 years
For refinancing of Metso’s loans or
other liabilities that relate
to Valmet
EUR 139 million EIB loan
• Amount outstanding of
two EIB loans:
– EUR 135 million loan entered into in
May 2004, and
– EUR 160 million loan entered into in
November 2008
USD 23 million NIB loan
• Amount outstanding of one loan:
– USD 85 million loan entered into in
December 2007
December 2013 © Valmet | Roadshow 26
New financing facilities Other borrowings

Conclusion
28
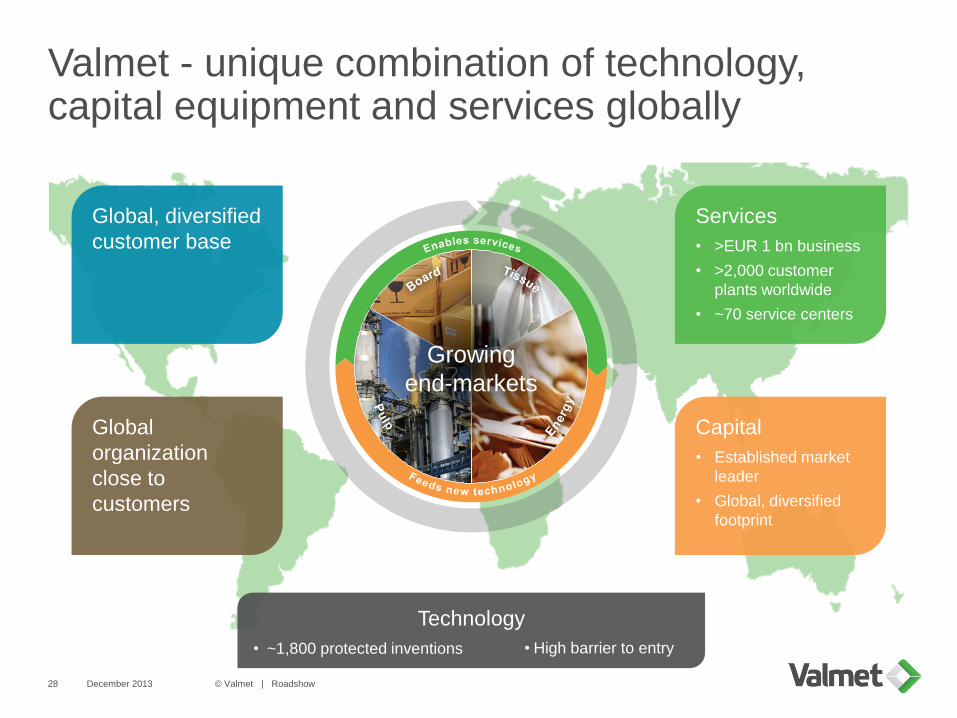
Valmet - unique combination of technology, capital equipment and services globally
December 2013 © Valmet | Roadshow
Growing
end-markets
Global
organization
close to
customers
Global, diversified
customer base
Technology
• ~1,800 protected inventions
• High barrier to entry
Capital
• Established market
leader
• Global, diversified
footprint
Services
• >EUR 1 bn business
• >2,000 customer
plants worldwide
• ~70 service centers

Investment highlight summary
© Valmet | Roadshow 29
Established market leader with #1-2 market positions
in all markets served
Stable, growing, and profitable services business
with over EUR 1 billion sales provides good visibility
and resilience
Long-term growth potential in capital business
from increase in pulp, energy, board and tissue
consumption and from substitution of fossil fuels
Global diversified footprint with large exposure
to growing emerging markets
Strong focus on profitability improvement
1
2
3
4
5
December 2013

Weak
Valmet’s policy on commenting on short-term market outlook and profitability of business lines
December 2013 30 © Valmet | Roadshow
Valmet will comment on its short-term market outlook and the profitability of its
business lines using the following scale:
Good Satisfactory Weak
Profitability will be commented on for each business line
Market outlook will be split up into 5 categories
Services Pulp and Energy
Satisfactory
Weak
Short-term
market outlook
Profitability
Satisfactory
Satisfactory
Satisfactory
Weak
Weak
Pulp Tissue Energy Board & paper
Paper

Important notice
IMPORTANT: You must read the following before continuing. The following applies to this document, the oral presentation of the information in this document by Valmet (the
“Company”) or any person on behalf of the Company, and any question-and-answer session that follows the oral presentation (collectively, the “Information”). In accessing the
Information, you agree to be bound by the following terms and conditions.
The Information is not directed to, or intended for distribution to or use by, any person or entity that is a citizen or resident of, or located in, any locality, state, country or other
jurisdiction where such distribution or use would be contrary to law or regulation or which would require any registration or licensing within such jurisdiction. The Information is not for
publication, release or distribution in the United States, the United Kingdom, Australia, Canada or Japan.
The Information does not constitute or form part of, and should not be construed as an offer or the solicitation of an offer to subscribe for or purchase any securities, and nothing
contained therein shall form the basis of or be relied on in connection with any contract or commitment whatsoever, nor does it constitute a recommendation regarding any securities.
Prospective investors are required to make their own independent investigations and appraisals of the business and financial condition of the Company before taking any investment
decision with respect to securities of the Company. Prospective investors should make any investment decision solely on the basis of the information contained in the demerger
prospectus published on September 23, 2013 and any stock exchange releases regarding the Company following the publication of the demerger prospectus.
No securities of the Company are being offered or sold, directly or indirectly, in or into the United States and no shares in the Company have been, or will be, registered under the
Securities Act of 1933, as amended (the “Securities Act”), or under the securities laws of any state of the United States and, accordingly, may not be offered or sold, directly or
indirectly, in or into the United States (as defined in Regulation S under the Securities Act), unless registered under the Securities Act or pursuant to an exemption from the
registration requirements of the Securities Act and in compliance with any applicable state securities laws of the United States.
The Information is directed solely at: (i) persons outside the United Kingdom, (ii) persons with professional experience in matters relating to investments falling within Article 19(5) of
the Financial Services and Markets Act 2000 (Financial Promotion) Order 2005 as amended (the “Order”), (iii) high net worth entities, and other persons to whom it may lawfully be
communicated, falling within Article 49(2)(a) to (d) of the Order and (iv) persons to whom an invitation or inducement to engage in investment activity (within the meaning of section
21 of the Financial Services and Markets Act 2000) in connection with the issue or sale of any securities of the Company or any member of its group may otherwise lawfully be
communicated or caused to be communicated (all such persons in (i)-(iv) above being “Relevant Persons”). Any investment activity to which the Information relates will only be
available to and will only be engaged with Relevant Persons. Any person who is not a Relevant Person should not act or rely on the Information. By accessing the Information, you
represent that you are a Relevant Person.
The Information contains forward-looking statements. All statements other than statements of historical fact included in the Information are forward-looking statements. Forward-
looking statements give the Company’s current expectations and projections relating to its financial condition, results of operations, plans, objectives, future performance and
business. These statements may include, without limitation, any statements preceded by, followed by or including words such as “target,” “believe,” “expect,” “aim,” “intend,” “may,”
“anticipate,” “estimate,” “plan,” “project,” “will,” “can have,” “likely,” “should,” “would,” “could” and other words and terms of similar meaning or the negative thereof. Such forward-
looking statements involve known and unknown risks, uncertainties and other important factors beyond the Company’s control that could cause the Company’s actual results,
performance or achievements to be materially different from the expected results, performance or achievements expressed or implied by such forward-looking statements. Such
forward-looking statements are based on numerous assumptions regarding the Company’s present and future business strategies and the environment in which it will operate in the
future.
No representation, warranty or undertaking, express or implied, is made as to, and no reliance should be placed on, the fairness, accuracy, completeness or correctness of the
Information or the opinions contained therein. The Information has not been independently verified and will not be updated. The Information, including but not limited to forward-
looking statements, applies only as of the date of this document and is not intended to give any assurances as to future results. The Company expressly disclaims any obligation or
undertaking to disseminate any updates or revisions to the Information, including any financial data or forward-looking statements, and will not publicly release any revisions it may
make to the Information that may result from any change in the Company’s expectations, any change in events, conditions or circumstances on which these forward-looking
statements are based, or other events or circumstances arising after the date of this document. Market data used in the Information not attributed to a specific source are estimates
of the Company and have not been independently verified.
December 2013 © Valmet | Roadshow 31

Appendix Company information

Comprehensive life-cycle services offering and large customer base with significant potential
© Valmet | Roadshow 33
Comprehensive life-cycle services offering
Spare and wear parts
• All OEM spare parts and
standard parts in Valmet
deliveries
• Inventory management services
and process parts, such as
consumables and auxiliary
products
Fabrics
• Paper machinery clothing
• Filter fabrics used in the pulp
and paper, mining and chemical
industries and power plants for
various filtration purposes as
well as in commercial laundries
Mill and plant improvements
• Plant upgrades
• Modifications and environmental
improvements
• Troubleshooting
• Shutdown maintenance
• Maintenance outsourcing for the
entire customer plant
Roll and workshop services
• Maintenance services on rotating
equipment: roll covers, spare
rolls and roll upgrades
• Rebuilds for all manufacturers’
board, tissue, pulp and paper
machines
• Workshop services: pressure
part manufacturing, boiler
component services, parts to
protect and enhance boiler
performance and fiber
equipment refurbishing
Comprehensive life-cycle services offering serving global customer base
with over 2,000 plants purchasing services from Valmet annually
December 2013

Experienced management team
© Valmet | Roadshow 34
1) Includes 100 shares in Metso owned by Ms. Salonsaari-Posti’s family members
2) Includes 30 shares in Metso owned by Mr. Tiitinen’s family members
Corporate
Business
lines
Areas
23
Pasi Laine President and CEO
Share ownership: 17,616
23
6
Markku Honkasalo Chief Financial Officer
Share ownership: -
<1
2
Kari Saarinen Head of Strategy and
Operational Development
Share ownership: -
2
10
Julia Macharey Head of Human Resources
Share ownership: -
1
19
Anu Salonsaari-Posti Head of Marketing &
Communications
Share ownership1: 100
<1
24
Jukka Tiitinen Business Line President,
Services
Share ownership2: 3,030
24
2
Jyrki Holmala Business Line President, Pulp
and Energy
Share ownership: 800
2
26
Jari Vähäpesola Business Line President,
Paper
Share ownership: 4,785
26
37
William Bohn Area President, North
America
Share ownership: -
20
27
Celso Tacla Area President, South
America
Share ownership: 4,027
19
37
Hannu Mälkiä Area President, EMEA
Share ownership: 9,415
35
21
Aki Niemi Area President, China
Share ownership: -
19
30
Hannu T. Pietilä Area President, Asia Pacific
Share ownership: 1,000
27
# years at Valmet /
its predecessor
# years of experience
in the sector
December 2013
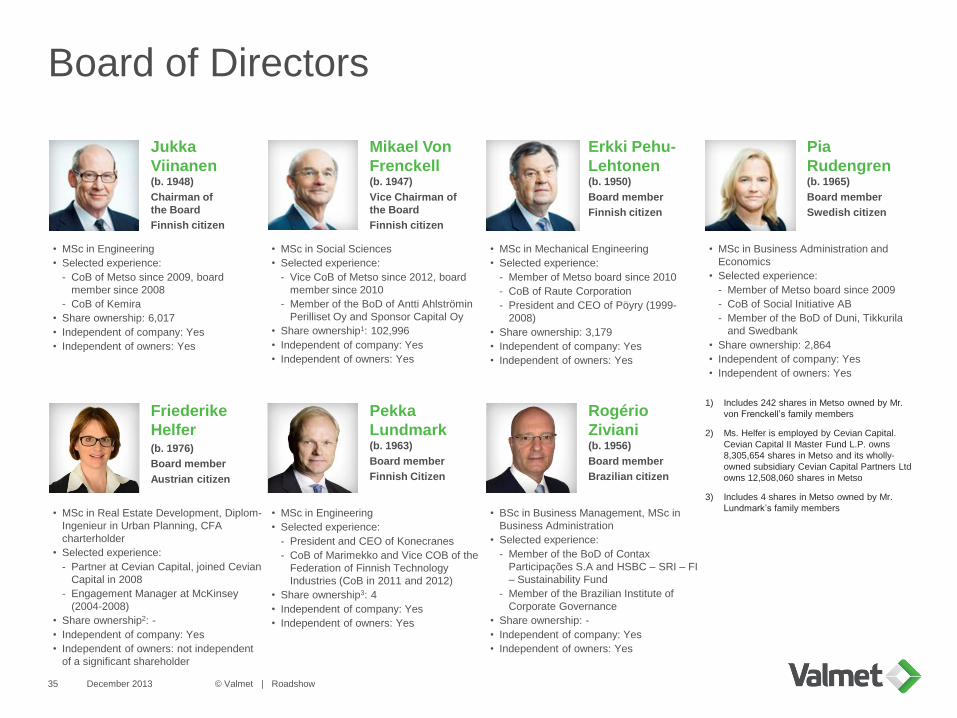
Board of Directors
• MSc in Engineering
• Selected experience:
- CoB of Metso since 2009, board
member since 2008
- CoB of Kemira
• Share ownership: 6,017
• Independent of company: Yes
• Independent of owners: Yes
• MSc in Social Sciences
• Selected experience:
- Vice CoB of Metso since 2012, board
member since 2010
- Member of the BoD of Antti Ahlströmin
Perilliset Oy and Sponsor Capital Oy
• Share ownership1: 102,996
• Independent of company: Yes
• Independent of owners: Yes
• MSc in Mechanical Engineering
• Selected experience:
- Member of Metso board since 2010
- CoB of Raute Corporation
- President and CEO of Pöyry (1999-
2008)
• Share ownership: 3,179
• Independent of company: Yes
• Independent of owners: Yes
• MSc in Business Administration and
Economics
• Selected experience:
- Member of Metso board since 2009
- CoB of Social Initiative AB
- Member of the BoD of Duni, Tikkurila
and Swedbank
• Share ownership: 2,864
• Independent of company: Yes
• Independent of owners: Yes
Jukka
Viinanen (b. 1948)
Chairman of
the Board
Finnish citizen
Mikael Von
Frenckell (b. 1947)
Vice Chairman of
the Board
Finnish citizen
Erkki Pehu-
Lehtonen (b. 1950)
Board member
Finnish citizen
Pia
Rudengren (b. 1965)
Board member
Swedish citizen
• MSc in Real Estate Development, Diplom-
Ingenieur in Urban Planning, CFA
charterholder
• Selected experience:
- Partner at Cevian Capital, joined Cevian
Capital in 2008
- Engagement Manager at McKinsey
(2004-2008)
• Share ownership2: -
• Independent of company: Yes
• Independent of owners: not independent
of a significant shareholder
• MSc in Engineering
• Selected experience:
- President and CEO of Konecranes
- CoB of Marimekko and Vice COB of the
Federation of Finnish Technology
Industries (CoB in 2011 and 2012)
• Share ownership3: 4
• Independent of company: Yes
• Independent of owners: Yes
• BSc in Business Management, MSc in
Business Administration
• Selected experience:
- Member of the BoD of Contax
Participações S.A and HSBC – SRI – FI
– Sustainability Fund
- Member of the Brazilian Institute of
Corporate Governance
• Share ownership: -
• Independent of company: Yes
• Independent of owners: Yes
Friederike
Helfer (b. 1976)
Board member
Austrian citizen
Pekka
Lundmark (b. 1963)
Board member
Finnish Citizen
Rogério
Ziviani (b. 1956)
Board member
Brazilian citizen
1) Includes 242 shares in Metso owned by Mr.
von Frenckell’s family members
2) Ms. Helfer is employed by Cevian Capital.
Cevian Capital II Master Fund L.P. owns
8,305,654 shares in Metso and its wholly-
owned subsidiary Cevian Capital Partners Ltd
owns 12,508,060 shares in Metso
3) Includes 4 shares in Metso owned by Mr.
Lundmark’s family members
© Valmet | Roadshow 35 December 2013

Largest shareholders on October 31, 2013
# Shareholder name Number of shares
in Metso
% of shares and
votes in Metso
Number of shares
in Valmet2
% of shares and
votes in Valmet2
1 Solidium Oy3 16,695,287 11.10% 16,695,287 11.14%
2 Ilmarinen Mutual Pension Insurance Company 4,300,126 2.86% 4,300,126 2.87%
3 Varma Mutual Pension Insurance Company 2,908,465 1.93% 2,908,465 1.94%
4 OP-funds 2,085,000 1.39% 2,085,000 1.39%
5 Mandatum Life Insurance Company Ltd 1,727,000 1.15% 1,727,000 1.15%
6 The State Pension Fund 1,724,419 1.15% 1,724,419 1.15%
7 Nordea-funds 1,585,708 1.05% 1,585,708 1.06%
8 Keva 1,543,015 1.03% 1,543,015 1.03%
9 Nordea Nordenfonden 1,443,612 0.96% 1,443,612 0.96%
10 Svenska litteratursällskapet i Finland r.f. 1,188,076 0.79% 1,188,076 0.79%
10 largest shareholders, total 35,200,708 23.41% 35,200,708 23.49%
Other shareholders 115,147,548 76.59% 114,663,911 76.51%
Total 150,348,256 100.00% 149,864,619 100.00%
Largest shareholders1
1) 10 largest shareholders of Metso that appear on the shareholder register maintained by Euroclear Finland as at October 31, 2013
2) As adjusted as no Demerger Consideration will be issued in respect of own shares held by Metso (483,637 as at October 31, 2013)
3) A holding company that is wholly owned by the Finnish State
© Valmet | Roadshow 36
Flagging notification on September 27, 2013: Total holding of Cevian funds amounted to 20,068,239 shares on
August 29, 2013, which corresponded to 13.35 percent of the total amount of shares and votes in Metso Corporation.
December 2013
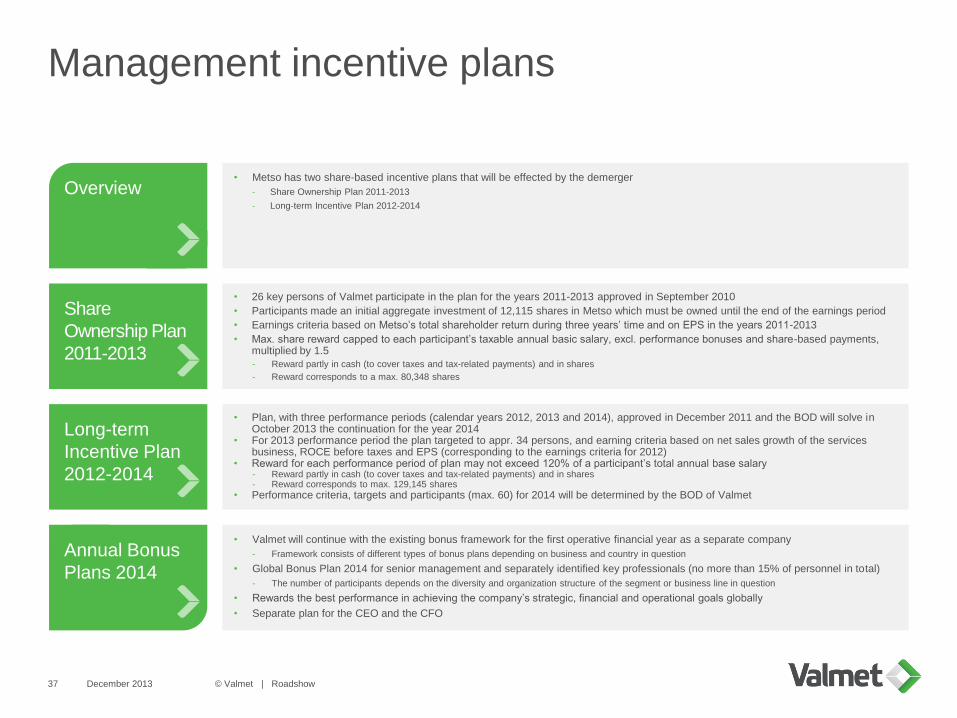
Management incentive plans
Share
Ownership Plan
2011-2013
Overview
Long-term
Incentive Plan
2012-2014
Annual Bonus
Plans 2014
• Metso has two share-based incentive plans that will be effected by the demerger
- Share Ownership Plan 2011-2013
- Long-term Incentive Plan 2012-2014
• 26 key persons of Valmet participate in the plan for the years 2011-2013 approved in September 2010
• Participants made an initial aggregate investment of 12,115 shares in Metso which must be owned until the end of the earnings period
• Earnings criteria based on Metso’s total shareholder return during three years’ time and on EPS in the years 2011-2013
• Max. share reward capped to each participant’s taxable annual basic salary, excl. performance bonuses and share-based payments, multiplied by 1.5
- Reward partly in cash (to cover taxes and tax-related payments) and in shares
- Reward corresponds to a max. 80,348 shares
• Plan, with three performance periods (calendar years 2012, 2013 and 2014), approved in December 2011 and the BOD will solve in October 2013 the continuation for the year 2014
• For 2013 performance period the plan targeted to appr. 34 persons, and earning criteria based on net sales growth of the services business, ROCE before taxes and EPS (corresponding to the earnings criteria for 2012)
• Reward for each performance period of plan may not exceed 120% of a participant’s total annual base salary - Reward partly in cash (to cover taxes and tax-related payments) and in shares - Reward corresponds to max. 129,145 shares
• Performance criteria, targets and participants (max. 60) for 2014 will be determined by the BOD of Valmet
• Valmet will continue with the existing bonus framework for the first operative financial year as a separate company
- Framework consists of different types of bonus plans depending on business and country in question
• Global Bonus Plan 2014 for senior management and separately identified key professionals (no more than 15% of personnel in total)
- The number of participants depends on the diversity and organization structure of the segment or business line in question
• Rewards the best performance in achieving the company’s strategic, financial and operational goals globally
• Separate plan for the CEO and the CFO
© Valmet | Roadshow 37 December 2013

Appendix Financials

Key pro forma data
EUR million, unless otherwise indicated
As at and for the nine
months ended September
30, 2013
As at and for the year ended
December 31, 2012
(unaudited)
Net sales 1,946 3,014
Operating profit 13 128
Profit before taxes 8 118
Amortization -20 -30
Depreciation -43 -60
Non-recurring items:
Capacity adjustment expenses -46 -24
Costs related to the demerger 0 -16
EBITA 33 152
EBITA before non-recurring items 79 192
percent of net sales 4.1 6.4
Earnings per share, EUR 0.04 0.52
Shares (outstanding shares in Metso as at Sep 30, 2013) 149,864,206 149,756,034
Balance sheet total 2,427 n/a
Equity 824 n/a
Interest-bearing liabilities 207 n/a
Net debt 4 n/a
Net gearing, % 0.5 n/a
ROCE before taxes, % 2.5 n/a
ROCE after taxes, % 2.2 n/a
Equity to asset ratio, % 40.8 n/a
• Pro forma income statement assumes
that the Demerger and the Valmet
formation related transactions had
been completed on January 1, 2012
• Pro forma balance sheet as at
September 30, 2013 has been
compiled assuming that the demerger
and certain transactions related to the
formation of Valmet had been
completed on September 30, 2013
• Pro forma financials are based on the
restated (unaudited) carve-out
financials and adjusted for demerger
related items:
– Pro forma adj. I: Certain intra-
group arrangements related to
the Demerger
– Pro forma adj. II: Interest-bearing
intra-group receivables and
liabilities
– Pro forma adj. III: Costs related to
the Demerger and Listing
– Pro forma adj. IV: Formation of
Valmet’s equity structure
Comments
© Valmet | Roadshow 39 December 2013

Valmet carve-out income statement
Carve-out income statement, EUR million For the nine months
ended September 30, For the year ended December 31,
2013 2012 2012 2012 2011 2010
(unaudited) (restated1,
unaudited) (audited) (audited) (audited)
Net sales 1,936 2,082 3,005 3,005 2,692 2,450
Net sales, Metso Group 10 7 9 9 11 3
Net sales, total 1,946 2,089 3,014 3,014 2,703 2,453
Cost of goods sold -1,534 -1,597 -2,345 -2,345 -2,029 -1,877
Cost of goods sold, Metso Group -46 -38 -60 -60 -58 -46
Cost of goods sold, total -1,580 -1,635 -2,405 -2,405 -2,087 -1,923
Gross profit 366 454 609 609 616 530
Selling, general and administrative expenses -343 -335 -457 -460 -451 -426
Other operating income and expenses, net -17 -3 -14 -14 9 2
Share in profits of associated companies 1 0 0 0 0 0
Operating profit 7 116 138 135 174 106
Financial income and expenses, net -6 7 0 5 5 -8
Financial income and expenses, Metso Group, net -2 -17 -23 -23 -24 -29
Financial income and expenses, net -8 -10 -23 -18 -19 -37
Profit before taxes -1 106 115 117 155 69
Income taxes 0 -36 -39 -40 -46 -22
Profit -1 70 76 77 109 47
Attributable to:
Equityholders of Valmet Group -2 70 76 77 108 46
Non-controlling interests 1 0 0 0 1 1
© Valmet | Roadshow 40
1) Restated due to the adoption of the revised “IAS 19 – Employee Benefits” on January 1, 2013
December 2013

Valmet pro forma income statement
2012 Pro forma income statement,
EUR million
Carve-out
1-12/2012 PF adj. I
PF adj.
II
PF adj.
III
PF adj.
IV
Pro forma
1-12/2012 (restated1,
unaudited) (unaudited)
Net sales 3,014 3,014
Cost of goods sold -2,405 -2,405
Gross profit 609 609
Selling, general and administrative expenses -457 -16 -473
Other operating income and expenses, net -14 -14
Share in profits and losses of associated companies 0 0
Operating profit 138 -16 122
Financial income and expenses, net -23 23 -4 -4
Profit before taxes 115 23 -20 118
Income taxes -39 -6 5 -40
Profit 76 17 -15 78
1) Restated due to the adoption of the revised “IAS 19 – Employee Benefits” on January 1, 2013
1-9/2013 Pro forma income statement,
EUR million
Carve-out
1-9/2013 PF adj. I
PF adj.
II
PF adj.
III
PF adj.
IV
Pro forma
1-9/2013
(unaudited) (unaudited)
Net sales 1,946 1,946
Cost of goods sold -1,580 -1,580
Gross profit 366 366
Selling, general and administrative expenses -343 6 -337
Other operating income and expenses, net -17 -17
Share in profits and losses of associated companies 1 1
Operating profit 7 6 13
Financial income and expenses, net -8 1 2 -5
Profit before taxes -1 1 8 8
Income taxes 0 0 -2 -2
Profit -1 1 6 6
© Valmet | Roadshow 41
Comments
December 2013
• Pro forma income statement assumes
that the Demerger and the Valmet
formation related transactions had
been completed on January 1, 2012
• Pro forma balance sheet as at
September 30, 2013 has been
compiled assuming that the demerger
and certain transactions related to the
formation of Valmet had been
completed on September 30, 2013
• Pro forma financials are based on the
restated (unaudited) carve-out
financials and adjusted for demerger
related items:
– Pro forma adj. I: Certain intra-
group arrangements related to
the Demerger
– Pro forma adj. II: Interest-bearing
intra-group receivables and
liabilities
– Pro forma adj. III: Costs related to
the Demerger and Listing
– Pro forma adj. IV: Formation of
Valmet’s equity structure

Pro forma balance sheet as at September 30, 2013
Pro forma balance sheet, EUR million Carve-out
30.9.2013 PF adj. I
PF adj.
II
PF adj.
III
PF adj.
IV
Pro forma
30.9.2013
Assets (unaudited) (unaudited)
Goodwill 446 446
Other intangible assets 118 118
Property, plant and equipment, total 407 407
Investments in associated companies 4 4
Available-for-sale equity investments 4 4
Loan and other interest-bearing receivables 1 1
Other receivables, Metso Group 20 -20 –
Deferred tax asset 70 4 74
Other non-current assets 8 8
Total non-current assets 1,078 -20 4 1,062
Inventories 472 472
Trade and other receivables 450 450
Trade and other receivables, Metso Group 13 13
Cost and earnings of projects under construction in
excess of advance billings 187 187
Loan receivables, Metso Group – 45 -45 –
Cash pooling receivables, Metso Group 109 -109 –
Available-for-sale financial assets 1 1
Derivative financial instruments 7 7
Income tax receivables 34 34
Cash and cash equivalents 200 18 -17 201
Total current assets 1,473 45 -136 -17 1,365
Total assets 2,551 25 -136 -13 2,427
© Valmet | Roadshow 42
Comments
December 2013
• Pro forma income statement assumes
that the Demerger and the Valmet
formation related transactions had
been completed on January 1, 2012
• Pro forma balance sheet as at
September 30, 2013 has been
compiled assuming that the demerger
and certain transactions related to the
formation of Valmet had been
completed on September 30, 2013
• Pro forma financials are based on the
restated (unaudited) carve-out
financials and adjusted for demerger
related items:
– Pro forma adj. I: Certain intra-
group arrangements related to
the Demerger
– Pro forma adj. II: Interest-bearing
intra-group receivables and
liabilities
– Pro forma adj. III: Costs related to
the Demerger and Listing
– Pro forma adj. IV: Formation of
Valmet’s equity structure

Pro forma balance sheet, EUR million Carve-out
30.9.2013 PF adj. I
PF adj.
II
PF adj.
III
PF adj.
IV
Pro forma
30.9.2013
Equity and liabilities (unaudited) (unaudited)
Share capital – 100 100
Reserve for invested unrestricted equity – 295 295
Cumulative translation adjustments 10 10
Fair value and other reserves 1 1
Retained earnings – 413 413
Invested equity and retained earnings 829 -8 -13 -808 –
Equity attributable to equityholders of Valmet 840 -8 -13 819
Non-controlling interests 5 5
Total equity 845 -8 -13 824
Long-term debt 92 52 144
Long-term debt, Metso Group – –
Other long-term liabilities 185 185
Total non-current liabilities 277 52 329
Current portion of long-term debt 63 63
Current portion of long-term debt, Metso Group – –
Short-term debt, Metso Group – 32 -32 –
Cash pooling liabilities, Metso Group 156 -156 –
Trade and other payables 646 646
Trade and other payables, Metso Group 24 24
Provisions 102 102
Advances received 150 150
Advances received, Metso Group 6 6
Billings in excess of cost and earnings of projects
under construction 249 249
Derivative financial instruments 8 8
Income tax liabilities 25 1 26
Total current liabilities 1,429 33 -188 1,274
Total liabilities 1,706 33 -136 1,603
Total equity and liabilities 2,551 25 -136 -13 2,427
© Valmet | Roadshow 43
Comments
December 2013
• Pro forma income statement assumes
that the Demerger and the Valmet
formation related transactions had
been completed on January 1, 2012
• Pro forma balance sheet as at
September 30, 2013 has been
compiled assuming that the demerger
and certain transactions related to the
formation of Valmet had been
completed on September 30, 2013
• Pro forma financials are based on the
restated (unaudited) carve-out
financials and adjusted for demerger
related items:
– Pro forma adj. I: Certain intra-
group arrangements related to
the Demerger
– Pro forma adj. II: Interest-bearing
intra-group receivables and
liabilities
– Pro forma adj. III: Costs related to
the Demerger and Listing
– Pro forma adj. IV: Formation of
Valmet’s equity structure
Pro forma balance sheet as at September 30, 2013

Appendix Market statistics

Services market Market trends
EMEA and North America ► Largest market for the
Services BL where majority of
installed base is located
► Customer cost pressure and
machine closures key drivers
China ► Largest single country for
Valmet
► The services market
expected to grow by ~5% in
2012-2016 in China, South
America and Asia Pacific
region
► Growth supported by
significant amounts of new
capacity being installed in
these areas during the last
ten years and the installed
base is aging
Asia Pacific ► Important growth market,
together with China and
South and Central America
South and Central America ► Important growth market,
together with China and Asia
Pacific
Total market for Valmet’s
services offering ~EUR 7bn1 • Pulp and paper services = ~EUR 6bn
• Power services market = ~EUR 1bn
Cost pressure and outsourcing
► Customer cost pressure and machine
closures increase demand for solutions
decreasing costs, net working capital, and
raw material and energy consumption
► Increased demand for more competitive
processes and decreasing in-house
customer competencies expected to provide
growth in demand for services
Packaging growth
► Growing demand for containerboard
expected to increase need for services
Closure of graphic machines
► Reduces demand for spare parts and
process consumables, but instead
► Increases demand for expert and
outsourcing services
► Increases demand for process
improvements and debottlenecking of the
remaining machines
1) Global market size for current offering in 2012 estimated by using an average services cost per volume produced based on Valmet’s
existing customers and estimates of current and forecasted growth in total production volumes
© Valmet | Roadshow 45
The total market for Valmet’s services offering estimated to grow to EUR 7.7 billion
by the end of 2016, corresponding to an annual global growth rate of about 2.0%1
December 2013

Pulp market Market trends
EMEA and North America ► Chemical pulp production
growing by ~1% p.a. in 2010-
2020 in the EMEA region and
decline by ~0.2% p.a. in North
America3
► Demand in Europe and North
America mainly focused on
upgrades and conversions
China ► Chemical pulp production
growing by ~6% p.a. in 2010-
20203
► Chemical wood pulp
production growing by ~2.4%
p.a. in Asia in 2011-20253
► Especially mid-sized plants
market segment growing in
Asia
► Increase in new hardwood
pulp production capacity
second largest in Asia after
South America
► Increasing standard of living
in Asia driving demand for
paper, board and tissue
based products, expected to
increase the demand for fiber
► Paper, board and tissue
growing fastest in Asia,
especially China and India,
which do not have sufficient
indigenous fiber resources3
Asia Pacific ► Chemical pulp production
growing by ~3% p.a. in 2010-
20203
► Main markets for larger pulp
plant deliveries are South
America and Asia Pacific
region
► Especially mid-sized plants
market segment growing in
Asia
► Increase in new hardwood
pulp production capacity
second largest in Asia after
South America
South and Central America ► Chemical wood pulp
production growing by ~3.4%
p.a. in 2011-20253
► Main markets for larger pulp
plant deliveries are South
America and Asia Pacific
region
► Growing virgin fiber demand
expected to be met primarily
by increase in new hardwood
pulp production capacity,
especially in South America
Total market for Valmet’s pulp
technology ~EUR 1.4bn1 • Chemical pulp accounts for ~70% of the total
volume of virgin papermaking fiber raw materials2
Virgin wood pulp growth due to
limitations of recycled paper growth
and growing demand for tissue
► Growth of pulp produced from recycled
paper limited by increasing marginal costs
and the decreasing quality of recovered
paper3
► Management expects demand for pulp to be
driven primarily by tissue production growth
Increased size of pulp lines and mills
► Typical greenfield pulp mill size up from avg.
capacity of ~0.7-1.0m metric tons of pulp
p.a. in 2000-2007 to ~1.3-1.5m metric tons
of pulp p.a. in 2007-2013
► Expected to benefit technology providers,
such as Valmet and Andritz with good
references of large project deliveries and
comprehensive product offering covering
complete plant solutions
1) Management estimate for total market size for Valmet’s pulp production technology offering based on historical and projected pulp capacity increases
2) Virgin papermaking fibre raw materials in 2011, where virgin papermaking fibre raw materials include chemical wood pulp, mechanical and semi-mechanical wood pulp and
non-wood pulp (source: Leading consulting firm)
3) Source: Leading consulting firm
© Valmet | Roadshow 46
Total market for Valmet’s pulp technology estimated to be around EUR 1.4bn1 and virgin pulp
consumption is estimated to grow 1.0% annually on average between 2010 and 20253
December 2013

Energy market Market trends
EMEA and North America ► EMEA region and North
America, represent ~50% of
the global market4
► Totals ~ EUR 2.3bn in 2013-
2015 on average4
► Expected to grow to an
average of EUR 2.6bn in next
3 years4
► North American market
impacted by low price of
natural gas
► EMEA region impacted by
slow economy and political
uncertainty around renewable
energy support schemes
► EU target of 20% share of
energy from renewable
sources in overall EU energy
consumption by 2020
China ► Market in Asia-Pacific, China
and South America,
estimated to EUR 2.1bn
between 2013 and 20154
► Expected to grow to EUR
3.6bn in next 3 year period4
► China’s current 5 year plan
targets 13,000 MW of
biomass power production
capacity by 2015, a
substantial increase from the
5,500 MW installed biomass-
based power capacity in
2010
Asia Pacific ► Market in Asia-Pacific, China
and South America,
estimated to EUR 2.1bn
between 2013 and 20154
► Expected to grow to EUR
3.6bn in next 3 year period4
South and Central America ► Market in Asia-Pacific, China
and South America,
estimated to EUR 2.1bn
between 2013 and 20154
► Expected to grow to EUR
3.6bn in next 3 year period4
Global biomass and waste power
plant market ~EUR 4.5bn1
• Average estimate for global biomass and waste
power plant market between 2013-2015
Growth in energy consumption and
demand for sustainable energy
► Global electricity demand to grow 2.2% p.a.
from 18,443 TWh in 2010 to 31,859 TWh in
20353
► Fossil fuels continue to be the predominant
fuel in energy production, but the share of
fossil fuels in energy production expected to
decrease from 68% in 2010 to 58% in 20353
► Biomass-based electricity generation
represented ~1.6% of global electricity
generation in 2011, but is forecast to grow
6.9% p.a. between 2011 and 20183
Incentives and regulation supporting
biomass and new biomass conversion
technology-based solutions
► Aim to reduce emissions and mitigate
climate change has resulted in targeted
reductions of CO2 emissions and use of
fossil fuel-based energy production in many
countries
► Policy decisions also impacted by
governments’ objectives to increase the
energy security and decrease dependence
on imported energy
Biomass conversion technology
market >EUR 1.5bn by 20202
• Management estimate for Valmet’s offering
1) Global biomass and waste power plant market estimated by Management to total ~ EUR 4.5bn on average between 2013 and 2015, a decline from an average of EUR
5.0bn between 2010 and 2012. The market is forecast to recuperate and reach an average of EUR 6.2bn between 2016 and 2018
2) Management estimates that the market for its biomass conversion technology solutions will exceed EUR 1.5 billion in 2020
3) Source: IEA, 2012
4) Source: Leading consulting firm
© Valmet | Roadshow 47
The global biomass and waste power plant market estimated to be some EUR 4.5 billion on average in
2013-2015 and increase to EUR 6.2 billion on average in 2016-2018
December 2013

Paper market Market trends
EMEA and North America ► Market expected to mainly
relate to rebuilds of existing
installed capacity
► Changes in consumer
demographics and shopping
behavior expected to create
additional demand for board in
developed countries2
► Tissue consumption growth
1.4% p.a. in North America, 5-
9% p.a. in Eastern Europe and
3.5% p.a. in Western Europe
in 2010-20213
China ► Emerging markets, e.g.
China, expected to drive
containerboard demand
► Higher product penetration
together with improved
product quality drive tissue
consumption e.g. in China
► Tissue consumption growing
5-9% between 2010-20213
Asia Pacific ► Emerging markets expected
to account for largest share
of capacity growth for carton
board3
South and Central America ► Tissue consumption growing
5-9% between 2010-2021 in
Latin America3
Total market for Valmet’s1:
Board technology ~EUR 1bn
• Containerboard consumption growing by ~2.7%
and carton board by ~2.4% p.a. in 2010-20255
Tissue technology ~EUR 0.6bn
• Global tissue paper consumption growing by
~3% p.a. through 20252
Newsprint and P&W paper
technology ~EUR 0.6bn
• P&W paper demand growing marginally while
global consumption of newsprint declines ~1-
2% p.a. in 2010-20252
General: Demand for increased energy,
water and raw material efficiency
► Focus on environmental responsibilities and
stricter energy and environmental
regulations drive demand for machines that
use less energy, water and raw materials, as
well as use of renewable energy sources
Board: Increased demand due to growth
in packaging and emerging markets
► Containerboard demand driven by GDP
growth and industrial manufacturing
► Demand for carton board driven by
increased retail sales, consumer packaging
and urbanization3
Tissue: Growth driven by increasing
standard of living and tissue
consumption
► Use of tissue-based hygiene products
generally correlated with economic growth,
population growth and standard of living
► Increased product penetration from
improved product quality drive tissue
consumption e.g. in China3
► Tissue products not conducive to long-
distance transportation due to their bulky
nature, thus the size of tissue mills expected
to continue to be relatively small while the
number of mills is expected to increase
Newsprint and writing and printing
papers: Decreased demand due to
growth of digital media
► Ongoing structural change resulting in
production overcapacity in EMEA
region and North America has
weakened demand for writing and
printing paper machines and shifted
demand to lower-cost solutions, mid-
sized machines and machine rebuilds
► Despite decline in demand in
EMEA region and North America
the demand is still growing in
China and other emerging
markets2
► Average order size from the paper
industry to decrease and paper
machines will need to produce
different paper grades more
flexibly and meet more stringent
environmental regulations
1) Management estimate based on current machine demand
2) Source: Leading consulting firms
3) RISI
© Valmet | Roadshow 48
General demand driven by increased need for energy, water and raw material efficiency; board and
tissue demand growing with packaging and emerging markets
December 2013
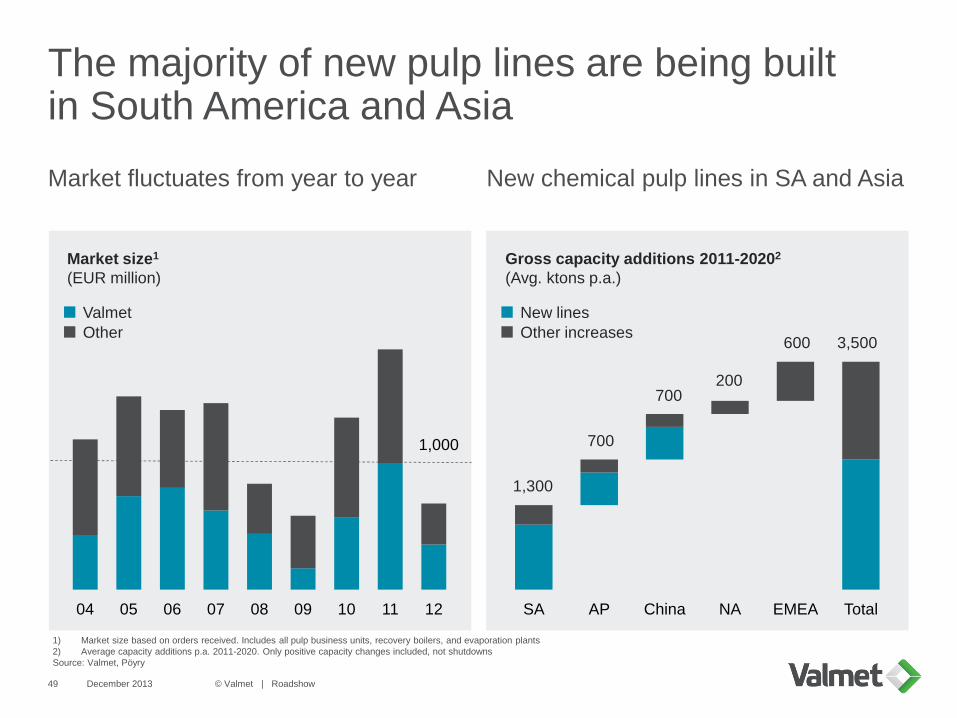
The majority of new pulp lines are being built in South America and Asia
Market fluctuates from year to year
04 05 06 07 08 09 10 11 12
New chemical pulp lines in SA and Asia
SA AP China NA EMEA Total
1,300
700
700 200
600 3,500
December 2013 © Valmet | Roadshow 49
Valmet
Other
Market size1
(EUR million)
Gross capacity additions 2011-20202
(Avg. ktons p.a.)
New lines
Other increases
1) Market size based on orders received. Includes all pulp business units, recovery boilers, and evaporation plants
2) Average capacity additions p.a. 2011-2020. Only positive capacity changes included, not shutdowns
Source: Valmet, Pöyry
1,000

Market for larger size (> 50 MWth) biomass boilers has significantly declined in EMEA and North America
2005 2006 2007 2008 2009 2010 2011 2012 1-9/2013
EMEA Rest of the world
Key messages
and implications
• Strong market decline in
2013 and unclear future
market development
• Increased political
uncertainty about meeting
CO2 targets and reduced
ability to finance support
schemes
• Price of coal has reduced,
making it more attractive for
power generation in Europe
and elsewhere
• North American biomass
power market has declined
significantly
• Price of energy has dropped
and previous subsidy
schemes supporting
biomass have expired
1) Note: Includes the power boiler market served by Valmet excluding small power plants < 50MW (EUR 200-300 million), air pollution control
(EUR 50-100 million p.a.), retrofits (EUR 100-200 million), and projects where Valmet has not competed (boilers ~EUR 1 billion p.a.)
Source: Valmet
New boiler market served by Valmet1 (EUR million) (only projects where Valmet has been involved)
500
December 2013 © Valmet | Roadshow 50

Board
machines:
Narrow, slow,
and lower
technology
Paper
machines:
Wide, fast, and
high technology
Major changes in the paper and board market
December 2013 © Valmet | Roadshow 51
1) Company estimate based on estimated capacity by start-up year and estimated average price per ton (constant value of EUR180/ton used over time)
Estimated net sales1 (EUR millions)
0
100
200
300
400
500
600
700
800
900
1,000
1996 1998 2000 2002 2004 2006 2008 2010 2012
Paper Board

Consumption development
December 2013 © Valmet | Roadshow 52
Growth in board and tissue consumption is expected to continue while
newsprint is declining
1) Source: Pöyry
Paper consumption1 (Mton)
CAGR 2001-2013 2013-2025F
Containerboard +3.6% +2.5%
Printing & Writing +1.2% +0.2%
Cartonboard +3.2% +2.2%
Tissue +3.3% +2.9%
Newsprint -1.4% -1.4%
0
20
40
60
80
100
120
140
160
180
200
220
1990 1995 2000 2005 2010 2015F2020F2025F
Newsprint Printing & Writing
Containerboard Cartonboard
Tissue

Paper and board consumption growth trends
December 2013 © Valmet | Roadshow 53
Population growth in
emerging markets is
larger than in
developed markets
Level of consumption
per capita in
emerging markets
clearly below that in
developed markets
This offers us long-
term growth potential
Paper and board consumption per capita vs. population1
Average global consumption: 53 kg per capita
1) Source: PPI Annual Review 2013 (2012 figures)
0
500
1,000
1,500
2,000
2,500
0
50
100
150
200
250
Ea
ste
rn E
uro
pe
Weste
rn E
uro
pe
Nort
h A
me
rica
La
tin
Am
erica
Ja
pa
n
Chin
a
Rest o
f A
sia
Oce
an
ia
Afr
ica
Mid
dle
Ea
st
Consumption per capita, kg (LHS) Population, million (RHS)

Demand has shifted more towards smaller paper and board machines
December 2013 © Valmet | Roadshow 54
• We are focusing more on modularized and standardized solutions
• Competition is higher in smaller machines
Capacity of start-ups1, by machine size
29 Mton
35 Mton
47 Mton
26 Mton
1998-02 2003-07 2008-12 2013-17
S (<200 kton) M (200-350 kton)
L (350-550 kton) XL (>500 kton)
S
M
L
XL
Valmet’s market share1, by machine size
Competition is lower in
larger machine sizes.
Higher number of
players in smaller
machines.
1) Source: Pöyry, Valmet
40-60%
35-45%
25-35%
0%
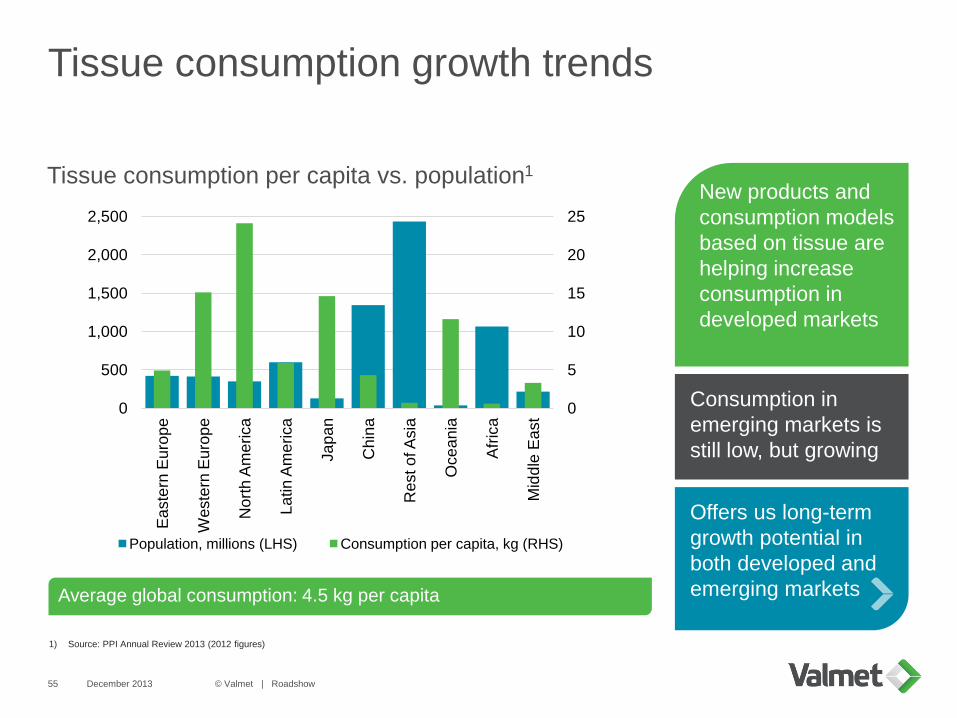
Tissue consumption growth trends
December 2013 © Valmet | Roadshow 55
New products and
consumption models
based on tissue are
helping increase
consumption in
developed markets
Consumption in
emerging markets is
still low, but growing
Offers us long-term
growth potential in
both developed and
emerging markets
Tissue consumption per capita vs. population1
Average global consumption: 4.5 kg per capita
1) Source: PPI Annual Review 2013 (2012 figures)
0
5
10
15
20
25
0
500
1,000
1,500
2,000
2,500
Ea
ste
rn E
uro
pe
Weste
rn E
uro
pe
Nort
h A
me
rica
La
tin
Am
erica
Ja
pa
n
Chin
a
Rest o
f A
sia
Oce
an
ia
Afr
ica
Mid
dle
Ea
st
Population, millions (LHS) Consumption per capita, kg (RHS)

Tissue market growing long term
December 2013 © Valmet | Roadshow 56
EMEA
North America
China
APAC ex. China
South America
• Recent market reduction due to heavy Chinese investments
• Competition is high in all areas, Valmet is strongest in North America
Capacity of start-ups1, by area Valmet’s market share1, by area
4 Mton
5 Mton
7 Mton
6 Mton
1998-02 2003-07 2008-12 2013-17
EMEA North America China
APAC ex. China South America
Number of competitors
is low in the Americas
and EMEA.
Smaller Chinese
companies present in
China and Asia.
1) Source: Pöyry, Valmet
20-40%
5-15%
10-20%
50-65%
30-50%