44
Valmet – unique offering with process technology, automation and services Forest Products & Paper Seminar 2015 Pasi Laine President and CEO
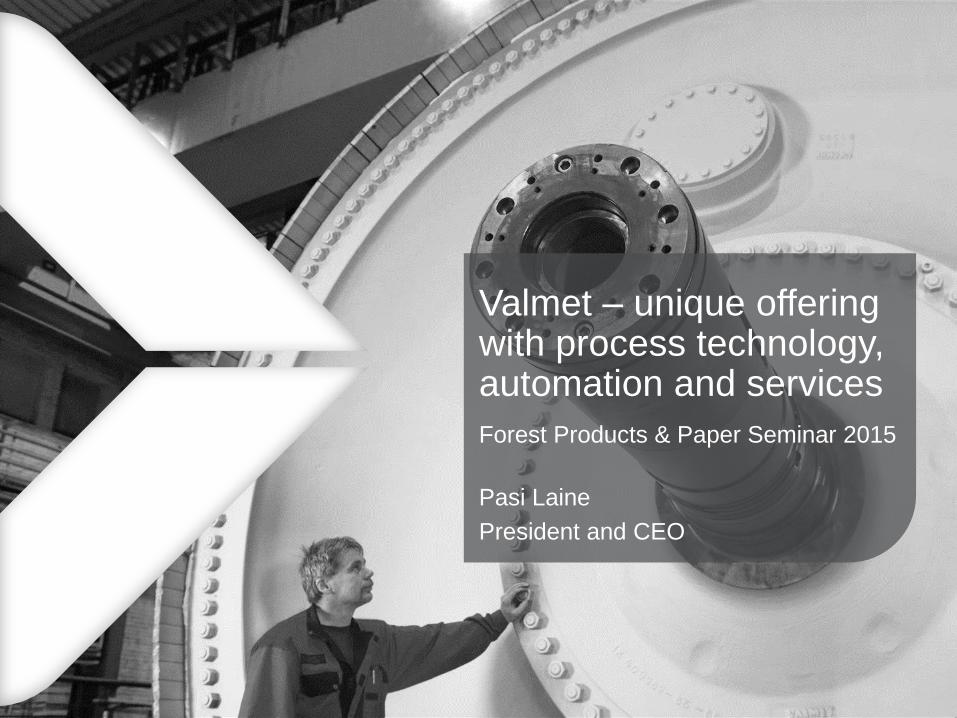
Valmet – unique offering with process technology, automation and services
Forest Products & Paper Seminar 2015
Pasi Laine
President and CEO
AgendaForest Products & Paper Seminar 2015
Valmet overview
Q1/2015 in brief
Automation
Investment highlights
1
2
3
4
Customer cases5
Conclusions6

Valmet overview
© Valmet | Pasi Laine, President and CEO4
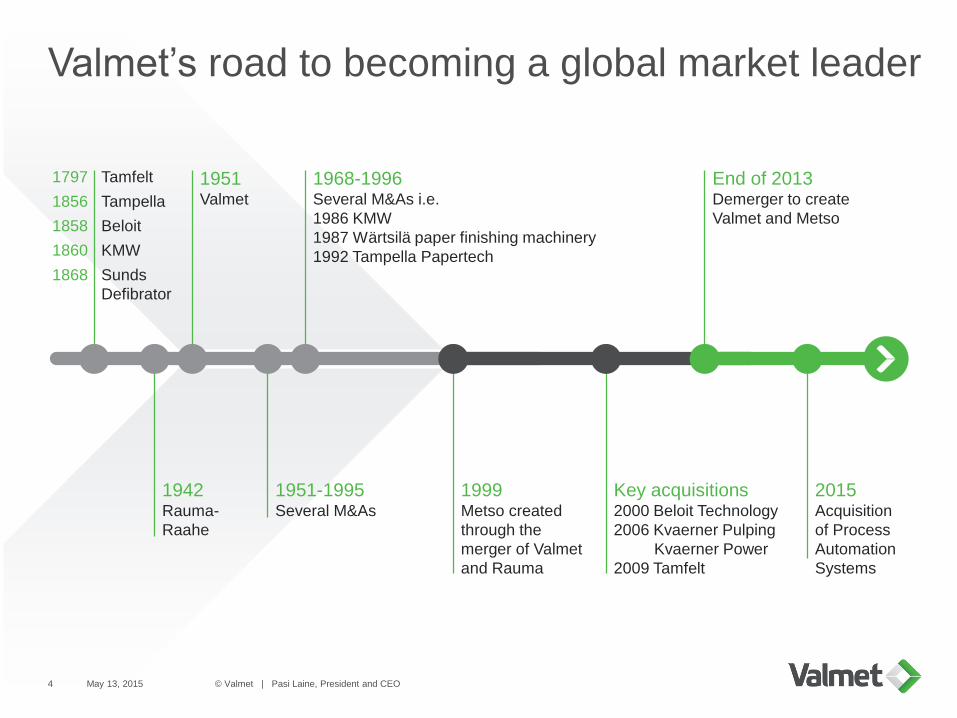
Valmet’s road to becoming a global market leader
May 13, 2015
1942Rauma-
Raahe
1951Valmet
1951-1995Several M&As
1968-1996Several M&As i.e.
1986 KMW
1987 Wärtsilä paper finishing machinery
1992 Tampella Papertech
1999Metso created
through the
merger of Valmet
and Rauma
Key acquisitions2000 Beloit Technology
2006 Kvaerner Pulping
Kvaerner Power
2009 Tamfelt
End of 2013Demerger to create
Valmet and Metso
1797 Tamfelt
1856 Tampella
1858 Beloit
1860 KMW
1868 Sunds
Defibrator
2015Acquisition
of Process
Automation
Systems
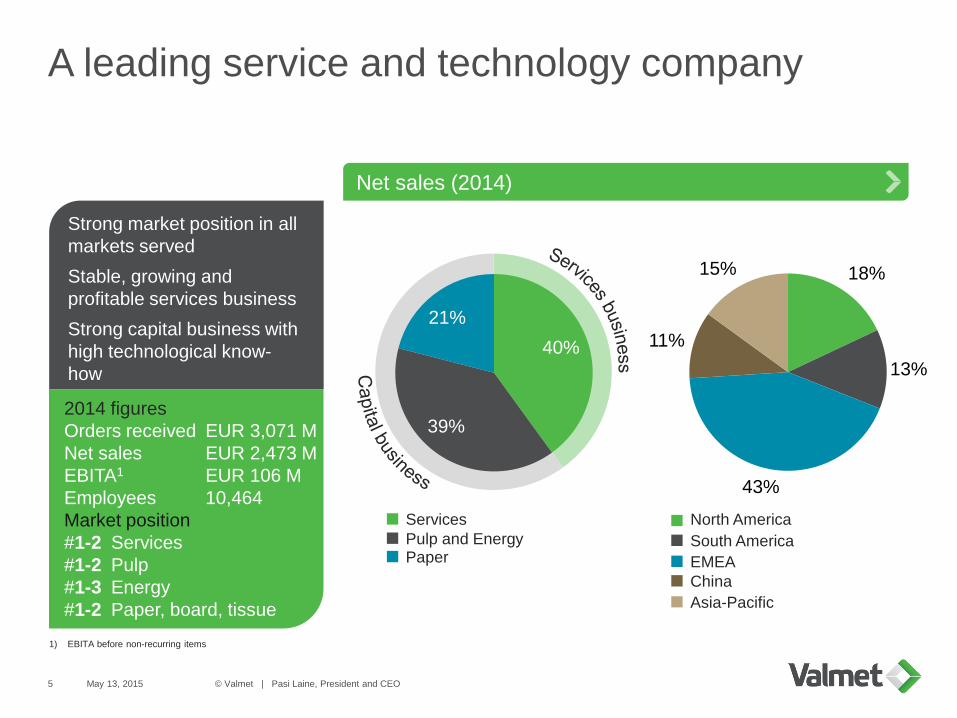
A leading service and technology company
May 13, 2015 © Valmet | Pasi Laine, President and CEO5
40%
39%
21%
Net sales (2014)
Strong market position in all
markets served
Stable, growing and
profitable services business
Strong capital business with
high technological know-
how
2014 figures
Orders received EUR 3,071 M
Net sales EUR 2,473 M
EBITA1 EUR 106 M
Employees 10,464
Market position
#1-2 Services
#1-2 Pulp
#1-3 Energy
#1-2 Paper, board, tissue
1) EBITA before non-recurring items
Services
Pulp and EnergyPaper
18%
13%
43%
11%
15%
North America
EMEA
South America
Asia-Pacific
China
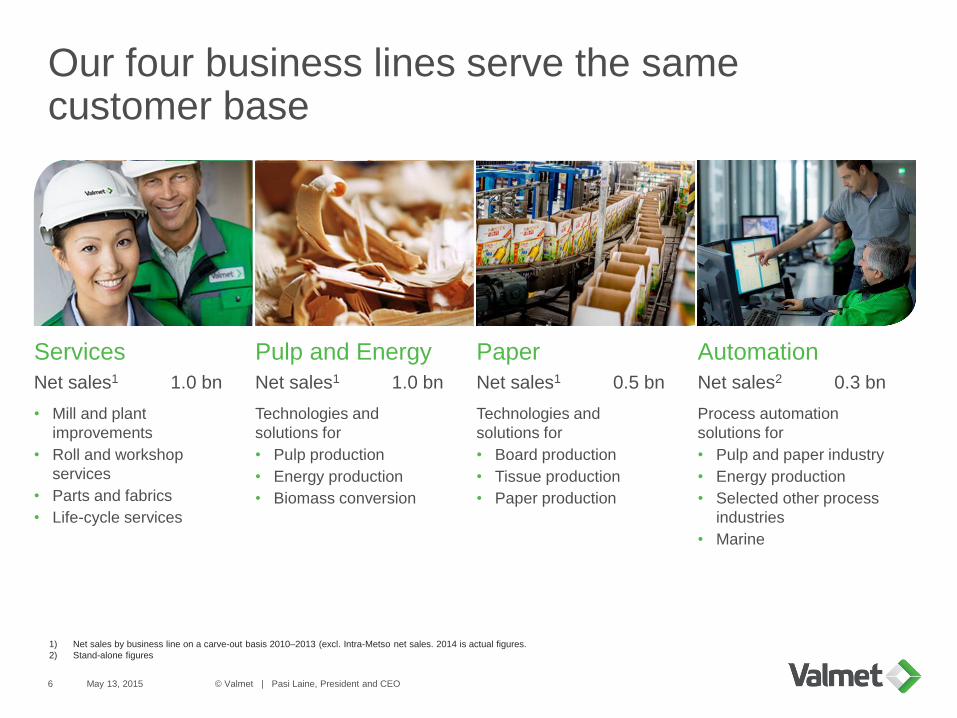
Our four business lines serve the samecustomer base
May 13, 2015 © Valmet | Pasi Laine, President and CEO6
Services
Net sales1 1.0 bn
• Mill and plant
improvements
• Roll and workshop
services
• Parts and fabrics
• Life-cycle services
Pulp and Energy
Net sales1 1.0 bn
Technologies and
solutions for
• Pulp production
• Energy production
• Biomass conversion
Paper
Net sales1 0.5 bn
Technologies and
solutions for
• Board production
• Tissue production
• Paper production
1) Net sales by business line on a carve-out basis 2010–2013 (excl. Intra-Metso net sales. 2014 is actual figures.
2) Stand-alone figures
Automation
Net sales2 0.3 bn
Process automation
solutions for
• Pulp and paper industry
• Energy production
• Selected other process
industries
• Marine
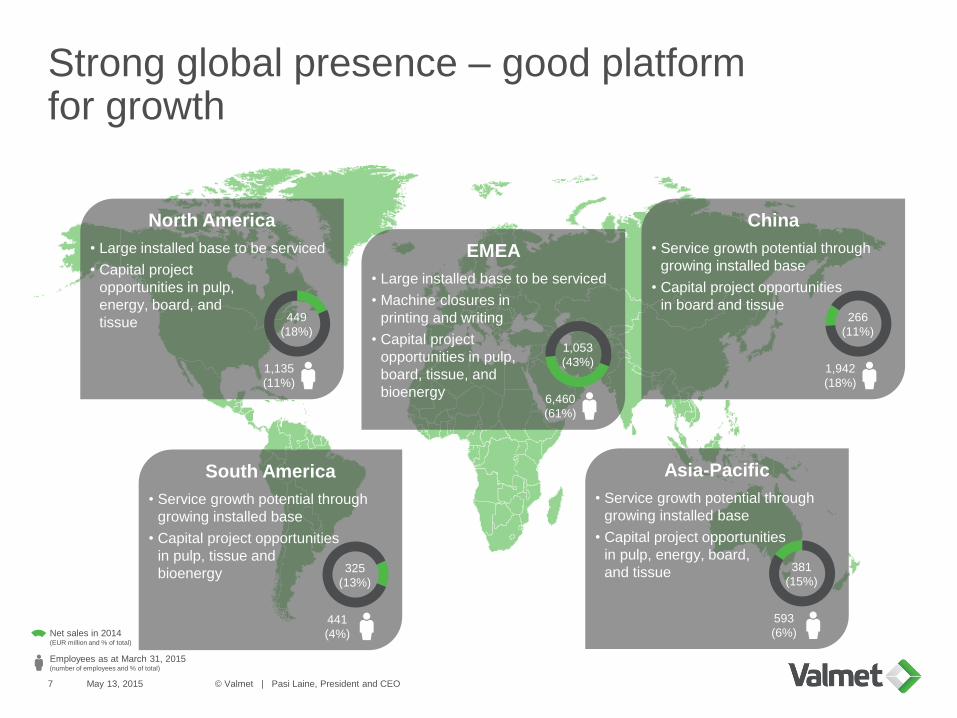
Strong global presence – good platformfor growth
May 13, 2015 © Valmet | Pasi Laine, President and CEO7
Net sales in 2014(EUR million and % of total)
Employees as at March 31, 2015(number of employees and % of total)
North America
• Large installed base to be serviced
• Capital project
opportunities in pulp,
energy, board, and
tissue 449
(18%)
1,135
(11%)
South America
• Service growth potential through
growing installed base
• Capital project opportunities
in pulp, tissue and
bioenergy 325
(13%)
441
(4%)
EMEA
• Large installed base to be serviced
• Machine closures in
printing and writing
• Capital project
opportunities in pulp,
board, tissue, and
bioenergy
1,053
(43%)
6,460
(61%)
China
• Service growth potential through
growing installed base
• Capital project opportunities
in board and tissue266
(11%)
1,942
(18%)
Asia-Pacific
• Service growth potential through
growing installed base
• Capital project opportunities
in pulp, energy, board,
and tissue 381
(15%)
593
(6%)

Global customer base
May 13, 2015 © Valmet | Pasi Laine, President and CEO8
80% of Process Automation
Systems’ sales to Valmet’s current
customer industriesValmet is a registered trademark of Valmet Corporation. Other trademarks appearing here are trademarks of their respective owners.
Pulp Paper Energy Process
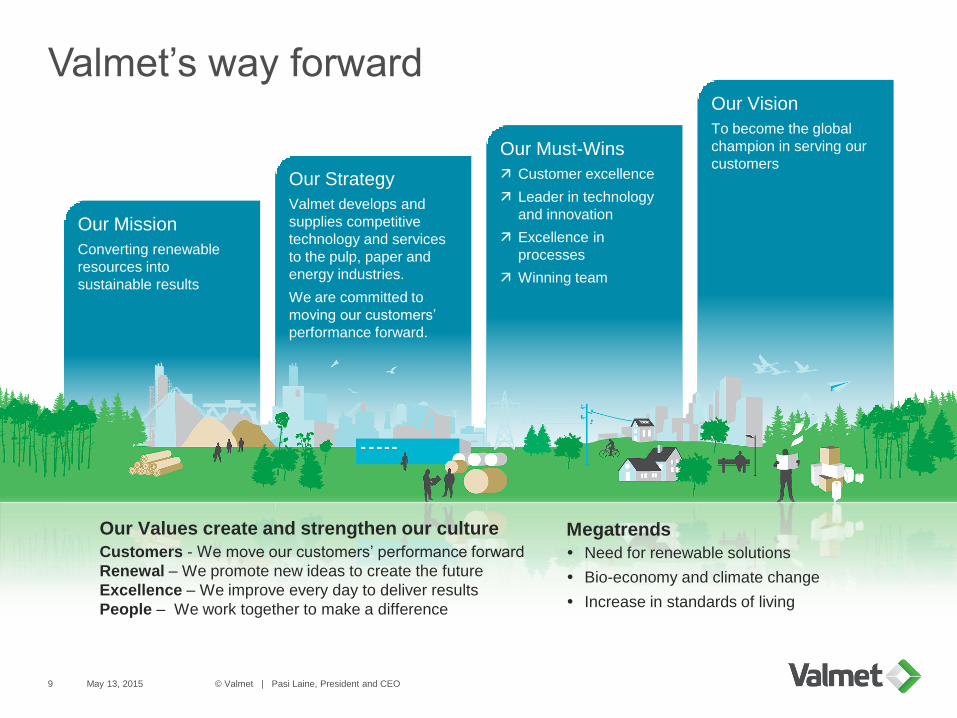
Valmet’s way forward
© Valmet | Pasi Laine, President and CEO9 May 13, 2015
Our Must-Wins
Customer excellence
Leader in technology
and innovation
Excellence in
processes
Winning team
Our Vision
To become the global
champion in serving our
customersOur Strategy
Valmet develops and
supplies competitive
technology and services
to the pulp, paper and
energy industries.
We are committed to
moving our customers’
performance forward.
Our Mission
Converting renewable
resources into
sustainable results
Our Values create and strengthen our culture
Customers - We move our customers’ performance forward
Renewal – We promote new ideas to create the future
Excellence – We improve every day to deliver results
People – We work together to make a difference
Megatrends
Need for renewable solutions
Bio-economy and climate change
Increase in standards of living
Q1/2015 in brief

May 13, 2015 © Valmet | Pasi Laine, President and CEO11
Q1/2015 in brief
• Orders received decreased in Pulp and Energy, and Paper business lines from the high levels in Q1/2014
• Net sales increased in Pulp and Energy and decreased in Paper compared with Q1/2014
Orders received decreased and net sales increased in capital business
• Services orders received increased compared with Q1/2014
• Net sales increased compared with Q1/2014 in Services
Orders received and net sales increased in services
• Gross profit increased by EUR 16 million compared with Q1/2014
• SG&A1 expenses increased by EUR 3 million compared with Q1/2014
• EBITA2-margin improved but is below targeted level
Focus on profitability improvement
Strong balance sheet, negative cash flow provided by operating activities
• Net debt EUR -134 million, and gearing -17%
• Cash flow provided by operating activities EUR -20 million
• Order backlog EUR 66 million higher than at year-end 2014
Order backlog at EUR 2.1 billion
1) Selling, general and administrative expenses before non-recurring items
2) EBITA = Earnings before interest, taxes and amortization and non-recurring items
May 13, 2015 © Valmet | Pasi Laine, President and CEO12
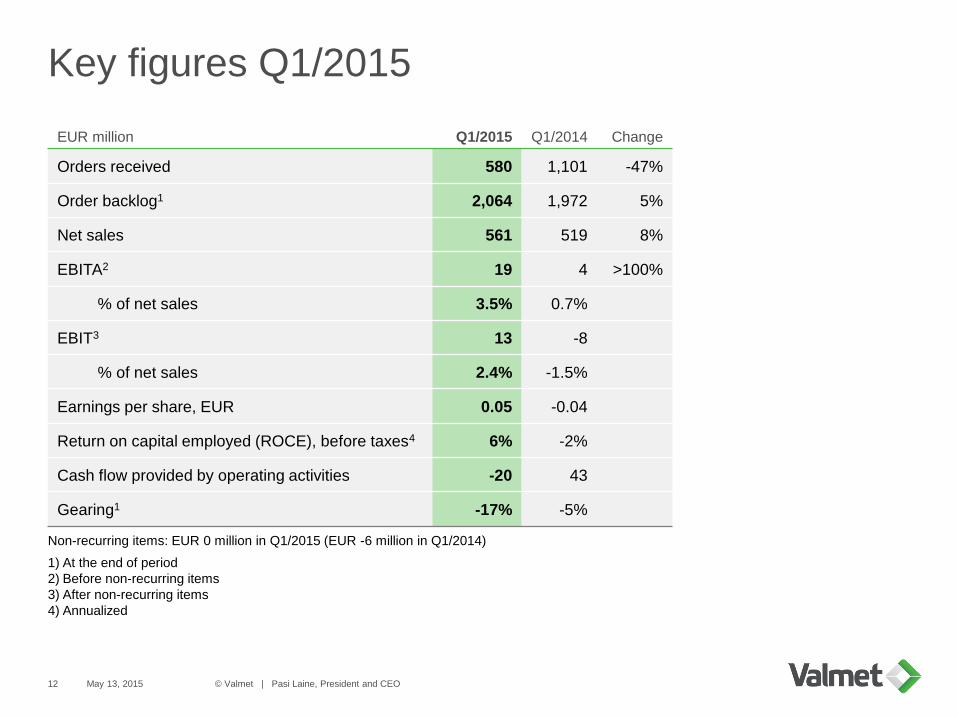
Key figures Q1/2015
EUR million Q1/2015 Q1/2014 Change
Orders received 580 1,101 -47%
Order backlog1 2,064 1,972 5%
Net sales 561 519 8%
EBITA2 19 4 >100%
% of net sales 3.5% 0.7%
EBIT3 13 -8
% of net sales 2.4% -1.5%
Earnings per share, EUR 0.05 -0.04
Return on capital employed (ROCE), before taxes4 6% -2%
Cash flow provided by operating activities -20 43
Gearing1 -17% -5%
Non-recurring items: EUR 0 million in Q1/2015 (EUR -6 million in Q1/2014)
1) At the end of period
2) Before non-recurring items
3) After non-recurring items
4) Annualized

May 13, 2015 © Valmet | Pasi Laine, President and CEO13
Orders received declined from the high level in Q1/2014
267 273 242 273 293
622 560
96 66138
212190
128 142149
1,1011,023
466 480580
0
500
1,000
1,500
2,000
2,500
3,000
3,500
0
200
400
600
800
1,000
1,200
1,400
Q1/14 Q2/14 Q3/14 Q4/14 Q1/15
Services (LHS) Pulp and Energy (LHS)
Paper (LHS) Last 4 quarters (RHS)
18582 135 88
18924 194 23 40
50
437
567
189 277202
35
121
5435 54
42059
66 41 85
1,1011,023
466 480 580
0
500
1,000
1,500
2,000
2,500
3,000
3,500
0
200
400
600
800
1,000
1,200
1,400
Q1/14 Q2/14 Q3/14 Q4/14 Q1/15
North America (LHS) South America (LHS)EMEA (LHS) China (LHS)Asia-Pacific (LHS) Last 4 quarters (RHS)
• Orders received increased in Services
• Orders received decreased in Pulp and Energy
• Orders received decreased in Paper
• Orders received increased in South America and China
Orders received (EUR million),
by business line
Orders received (EUR million),
by area
May 13, 2015 © Valmet | Pasi Laine, President and CEO14
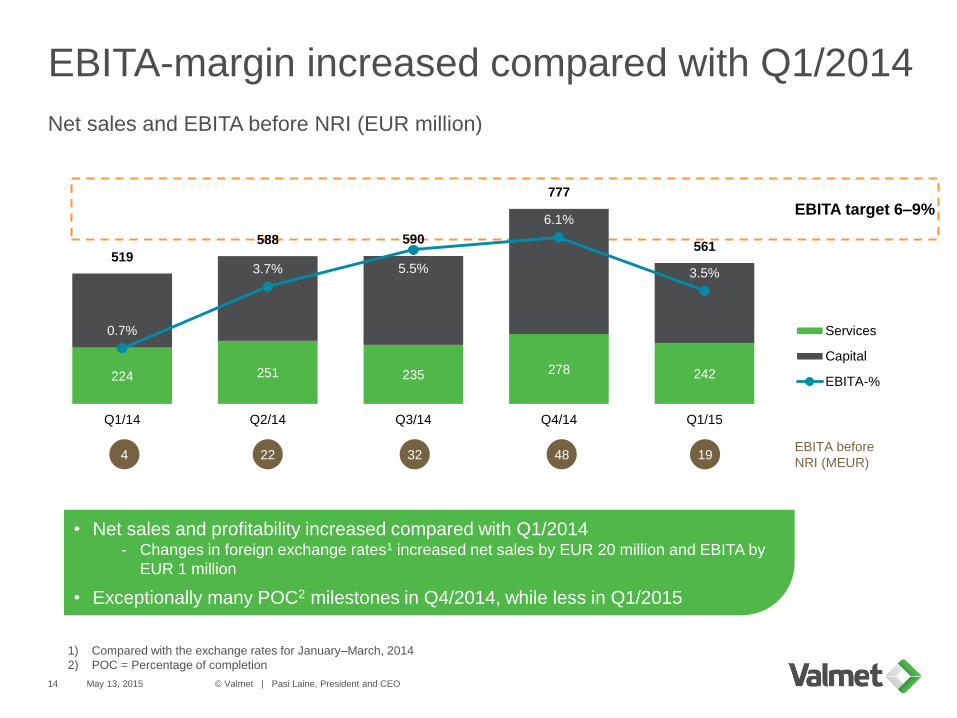
EBITA-margin increased compared with Q1/2014
Net sales and EBITA before NRI (EUR million)
224 251 235 278 242
519
588 590
777
561
0.7%
3.7% 5.5%
6.1%
3.5%
Q1/14 Q2/14 Q3/14 Q4/14 Q1/15
Services
Capital
EBITA-%
EBITA target 6–9%
• Net sales and profitability increased compared with Q1/2014- Changes in foreign exchange rates1 increased net sales by EUR 20 million and EBITA by
EUR 1 million
• Exceptionally many POC2 milestones in Q4/2014, while less in Q1/2015
EBITA before
NRI (MEUR)194 22 32 48
1) Compared with the exchange rates for January–March, 2014
2) POC = Percentage of completion
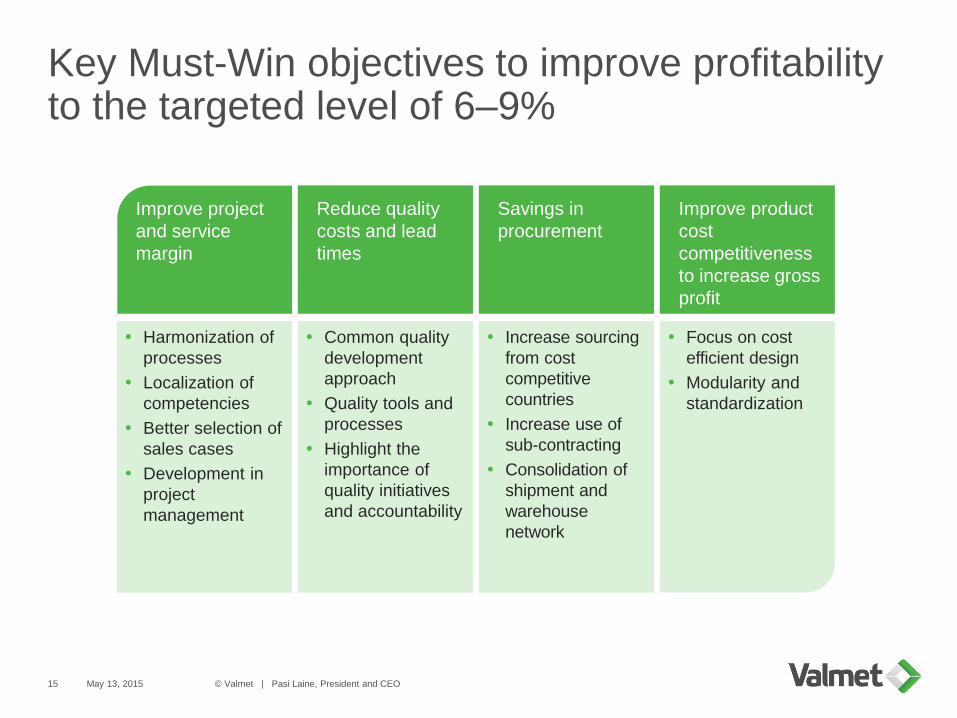
Key Must-Win objectives to improve profitability to the targeted level of 6–9%
May 13, 2015 © Valmet | Pasi Laine, President and CEO15
Improve project
and service
margin
Harmonization of
processes
Localization of
competencies
Better selection of
sales cases
Development in
project
management
Common quality
development
approach
Quality tools and
processes
Highlight the
importance of
quality initiatives
and accountability
Reduce quality
costs and lead
times
Increase sourcing
from cost
competitive
countries
Increase use of
sub-contracting
Consolidation of
shipment and
warehouse
network
Savings in
procurement
Improve product
cost
competitiveness
to increase gross
profit
Focus on cost
efficient design
Modularity and
standardization
May 13, 201516 © Valmet | Pasi Laine, President and CEO
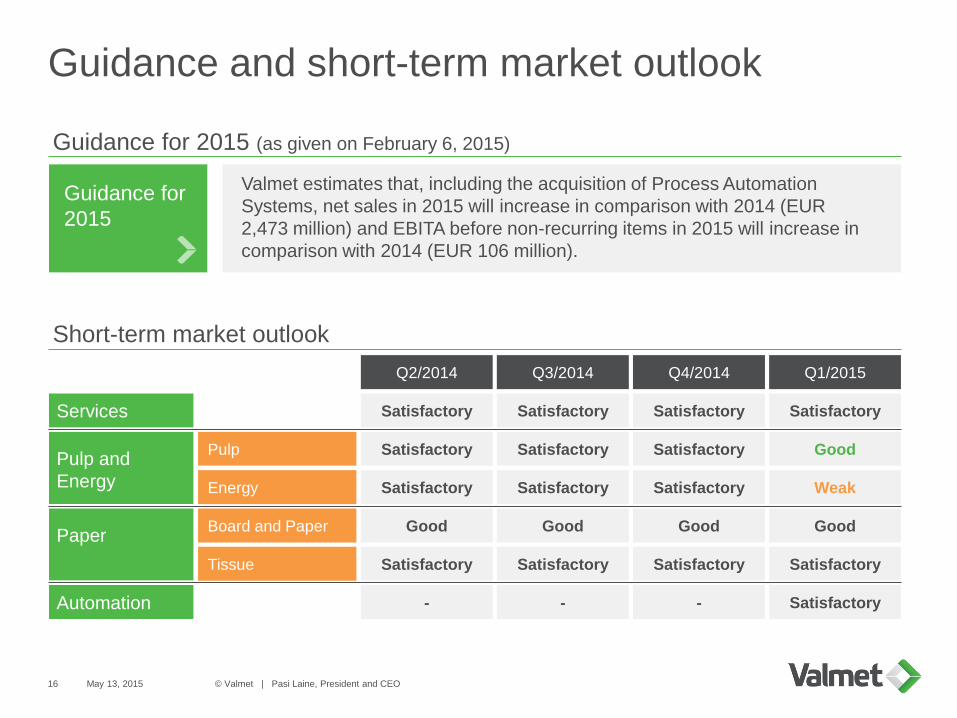
Guidance and short-term market outlook
GoodPulp and
Energy
Paper
Satisfactory
Pulp
Energy
Board and Paper
Tissue
Guidance for
2015
Services
Short-term market outlook
Guidance for 2015 (as given on February 6, 2015)
Satisfactory
Satisfactory
Good
Satisfactory
Satisfactory
Satisfactory
Satisfactory
Good
Satisfactory
Q2/2014 Q3/2014
Satisfactory
Satisfactory
Satisfactory
Good
Satisfactory
Q4/2014
Satisfactory
Weak
Good
Satisfactory
Q1/2015
Valmet estimates that, including the acquisition of Process Automation
Systems, net sales in 2015 will increase in comparison with 2014 (EUR
2,473 million) and EBITA before non-recurring items in 2015 will increase in
comparison with 2014 (EUR 106 million).
- - - SatisfactoryAutomation
Automation
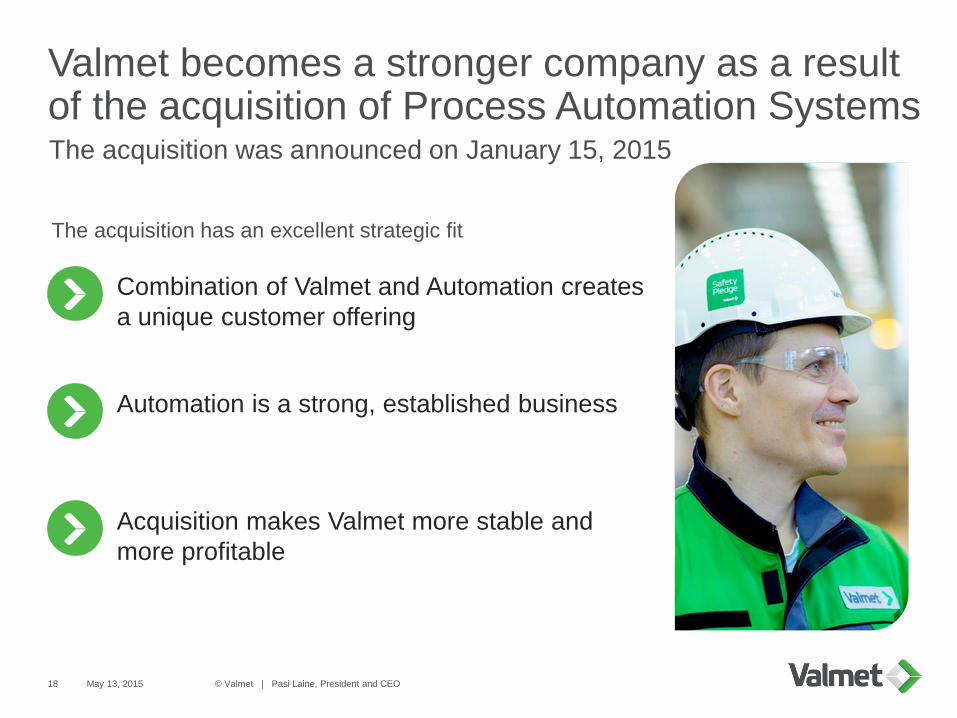
Valmet becomes a stronger company as a result of the acquisition of Process Automation SystemsThe acquisition was announced on January 15, 2015
May 13, 2015 © Valmet | Pasi Laine, President and CEO18
The acquisition has an excellent strategic fit
Automation is a strong, established business
Combination of Valmet and Automation creates
a unique customer offering
Acquisition makes Valmet more stable and
more profitable
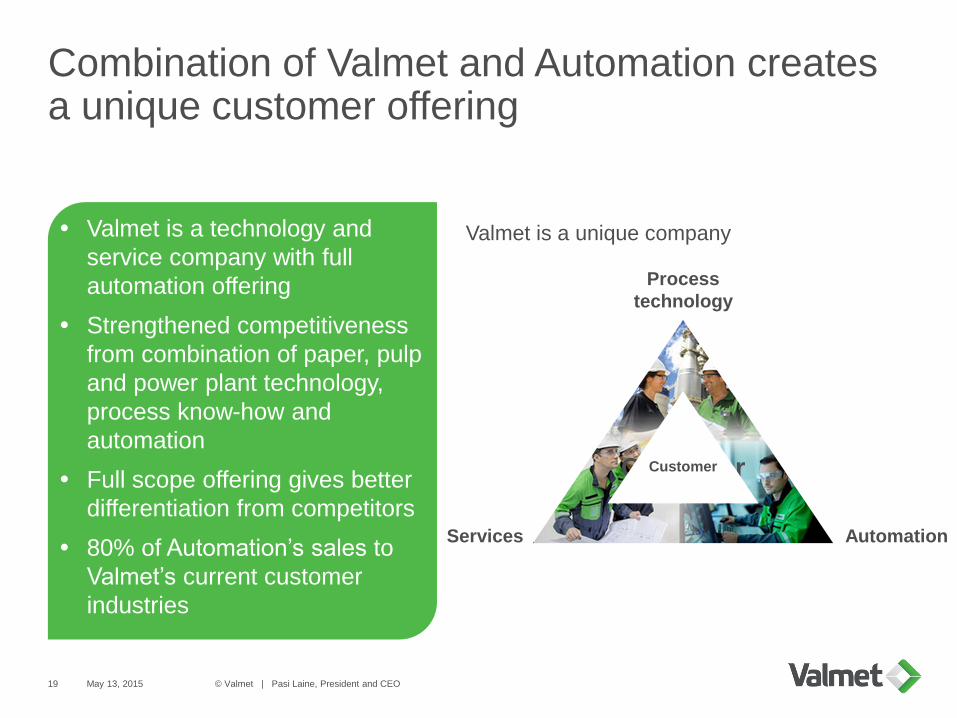
Combination of Valmet and Automation creates a unique customer offering
May 13, 2015 © Valmet | Pasi Laine, President and CEO19
Valmet is a technology and
service company with full
automation offering
Strengthened competitiveness
from combination of paper, pulp
and power plant technology,
process know-how and
automation
Full scope offering gives better
differentiation from competitors
80% of Automation’s sales to
Valmet’s current customer
industries
Valmet is a unique company
Services
Process
technology
Automation
CustomerCustomer
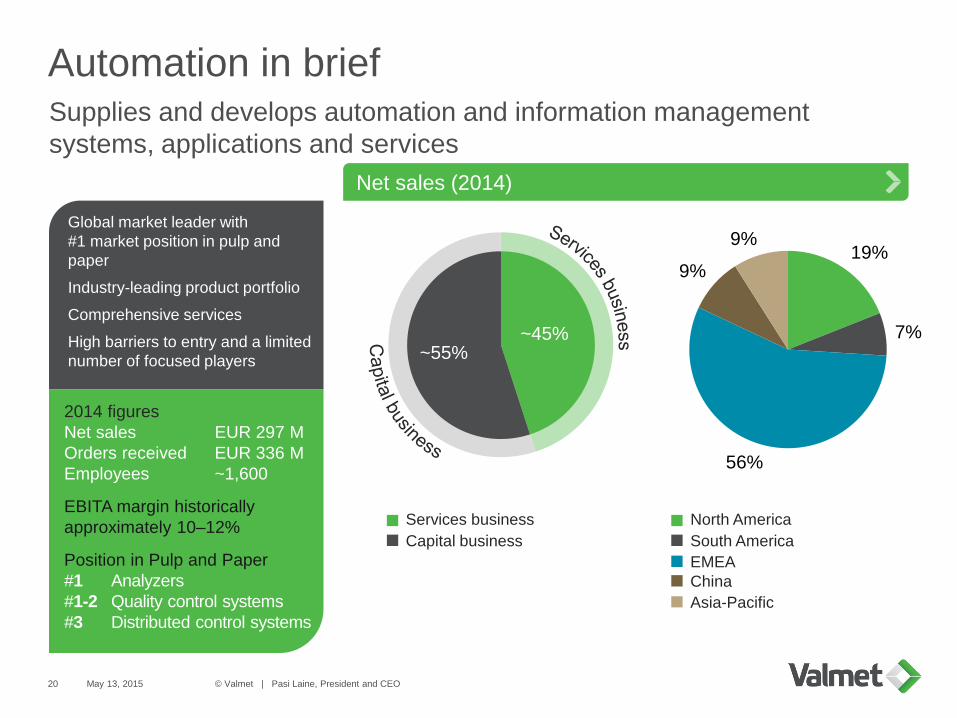
Automation in brief
May 13, 2015 © Valmet | Pasi Laine, President and CEO20
Supplies and develops automation and information management
systems, applications and services
Net sales (2014)
Global market leader with
#1 market position in pulp and
paper
Industry-leading product portfolio
Comprehensive services
High barriers to entry and a limited
number of focused players
19%
7%
56%
9%
9%
~55%~45%
2014 figures
Net sales EUR 297 M
Orders received EUR 336 M
Employees ~1,600
EBITA margin historically
approximately 10–12%
Position in Pulp and Paper
#1 Analyzers
#1-2 Quality control systems
#3 Distributed control systems
North America
EMEA
South America
Asia-Pacific
China
Services business
Capital business
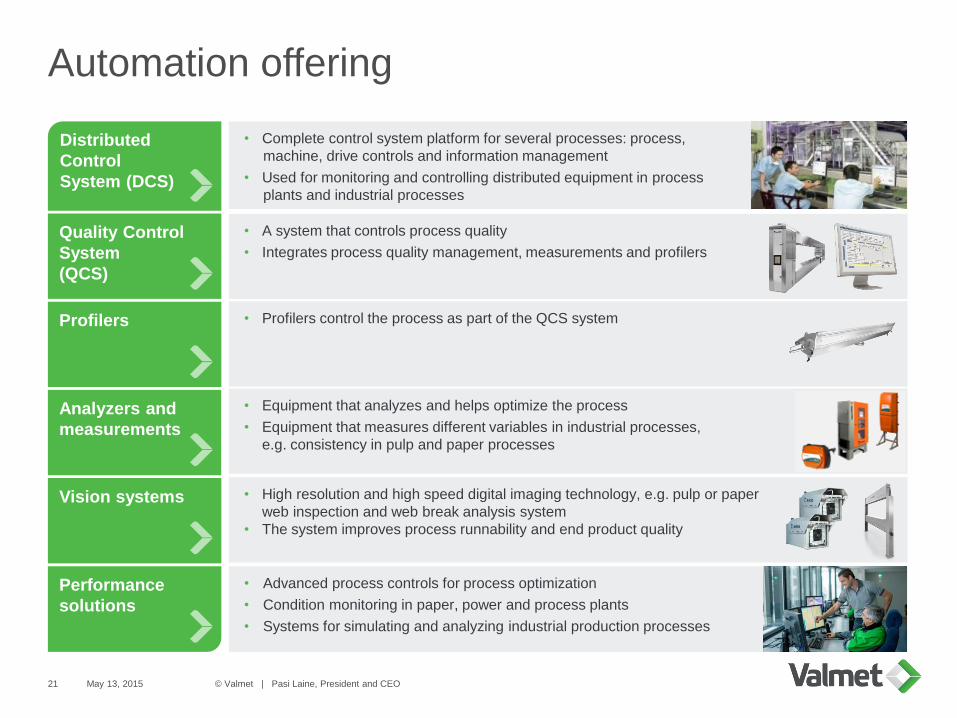
Automation offering
May 13, 2015 © Valmet | Pasi Laine, President and CEO21
• Complete control system platform for several processes: process,
machine, drive controls and information management
• Used for monitoring and controlling distributed equipment in process
plants and industrial processes
• Advanced process controls for process optimization
• Condition monitoring in paper, power and process plants
• Systems for simulating and analyzing industrial production processes
Distributed
Control
System (DCS)
• A system that controls process quality
• Integrates process quality management, measurements and profilers
Quality Control
System
(QCS)
• Profilers control the process as part of the QCS systemProfilers
• Equipment that analyzes and helps optimize the process
• Equipment that measures different variables in industrial processes,
e.g. consistency in pulp and paper processes
Analyzers and
measurements
• High resolution and high speed digital imaging technology, e.g. pulp or paper
web inspection and web break analysis system
• The system improves process runnability and end product quality
Vision systems
Performance
solutions
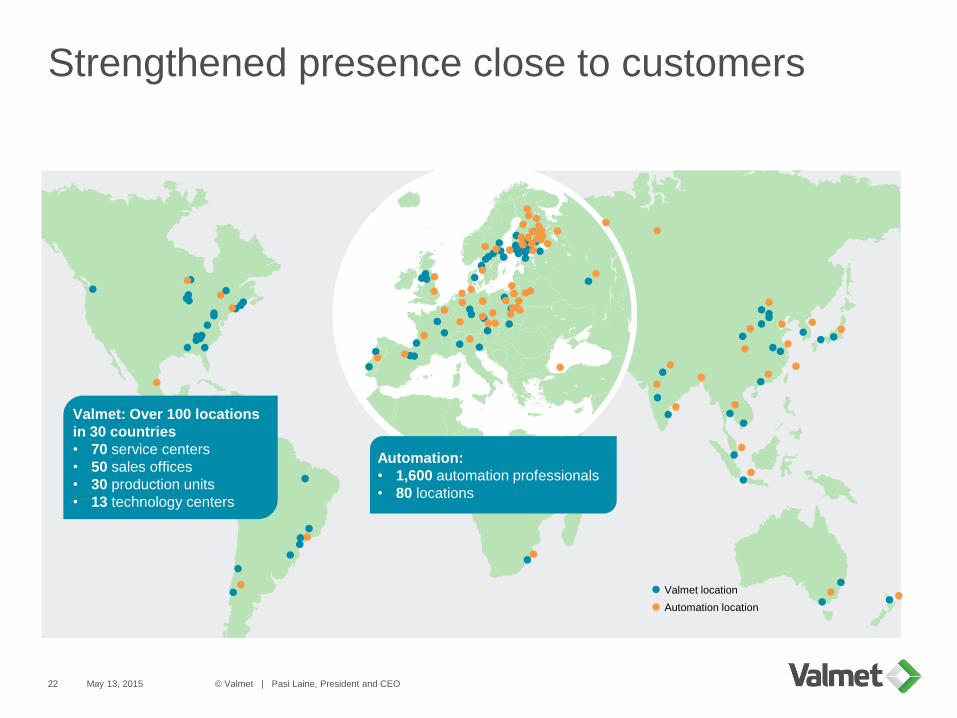
Strengthened presence close to customers
May 13, 2015 © Valmet | Pasi Laine, President and CEO22
Automation location
Valmet location
Automation:
• 1,600 automation professionals
• 80 locations
Valmet: Over 100 locations
in 30 countries
• 70 service centers
• 50 sales offices
• 30 production units
• 13 technology centers

Investment highlights
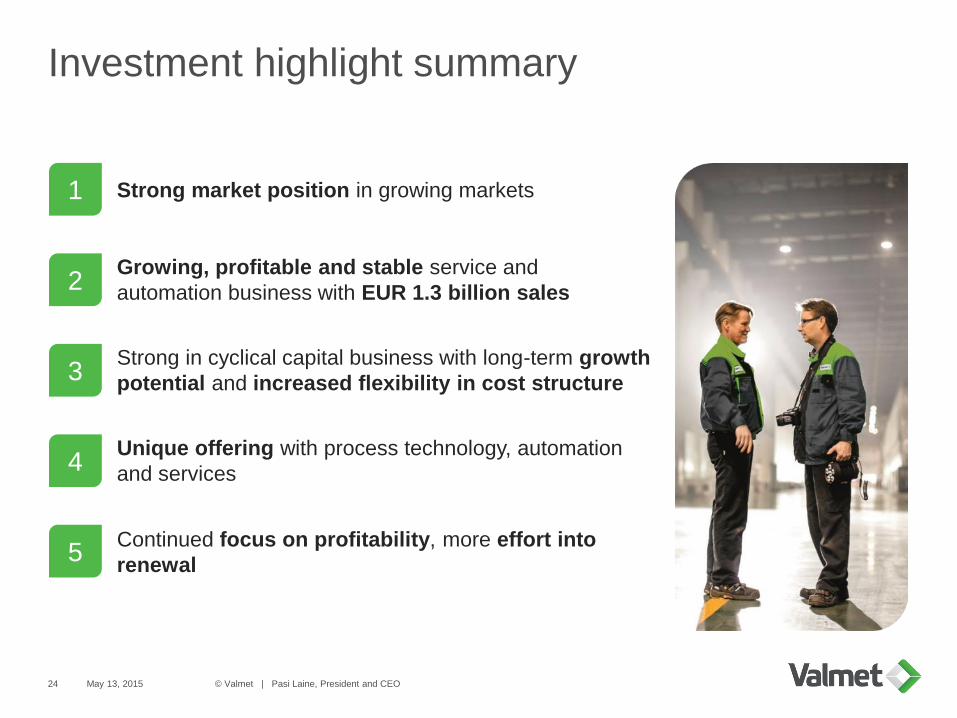
Investment highlight summary
© Valmet | Pasi Laine, President and CEO24
Strong market position in growing markets
Growing, profitable and stable service and
automation business with EUR 1.3 billion sales
Strong in cyclical capital business with long-term growth
potential and increased flexibility in cost structure
Unique offering with process technology, automation
and services
Continued focus on profitability, more effort into
renewal
1
2
3
4
5
May 13, 2015
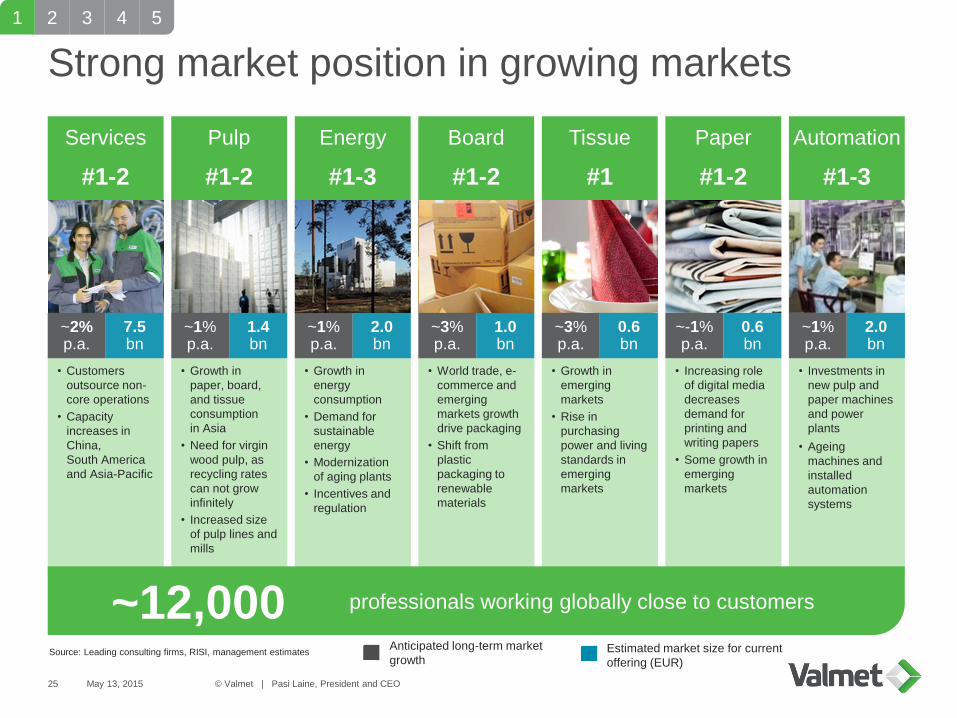
Services
#1-2
Strong market position in growing markets
May 13, 2015 © Valmet | Pasi Laine, President and CEO25
• Customers
outsource non-
core operations
• Capacity
increases in
China,
South America
and Asia-Pacific
Energy
#1-3
Board
#1-2
Paper
#1-2
Pulp
#1-2
• Growth in
energy
consumption
• Demand for
sustainable
energy
• Modernization
of aging plants
• Incentives and
regulation
• Growth in
paper, board,
and tissue
consumption
in Asia
• Need for virgin
wood pulp, as
recycling rates
can not grow
infinitely
• Increased size
of pulp lines and
mills
• World trade, e-
commerce and
emerging
markets growth
drive packaging
• Shift from
plastic
packaging to
renewable
materials
• Growth in
emerging
markets
• Rise in
purchasing
power and living
standards in
emerging
markets
Tissue
#1
Automation
#1-3
• Increasing role
of digital media
decreases
demand for
printing and
writing papers
• Some growth in
emerging
markets
• Investments in
new pulp and
paper machines
and power
plants
• Ageing
machines and
installed
automation
systems
Estimated market size for current
offering (EUR)
Anticipated long-term market
growth
~2%p.a.
7.5bn
~1%p.a.
2.0bn
~1%p.a.
1.4bn
~3%p.a.
1.0bn
~3%p.a.
0.6bn
~-1%p.a.
0.6bn
~1%p.a.
2.0bn
~12,000 professionals working globally close to customers
2 3 4 5
Source: Leading consulting firms, RISI, management estimates
1

Growing, profitable and stable service and automation business with EUR 1.3 billion sales
26 May 13, 2015 © Valmet | Pasi Laine, President and CEO
2 3 4 5
Growing Services net sales growth on average
over 3% p.a. during the last 5 years
Slight growth in Automation net sales
over the last 10 years
Profitable Relatively stable margins in Automation
during the last 10 years, EBITA margin
10–12%
Stable Services and Automation together
approximately EUR 1.3 billion of stable
business
1
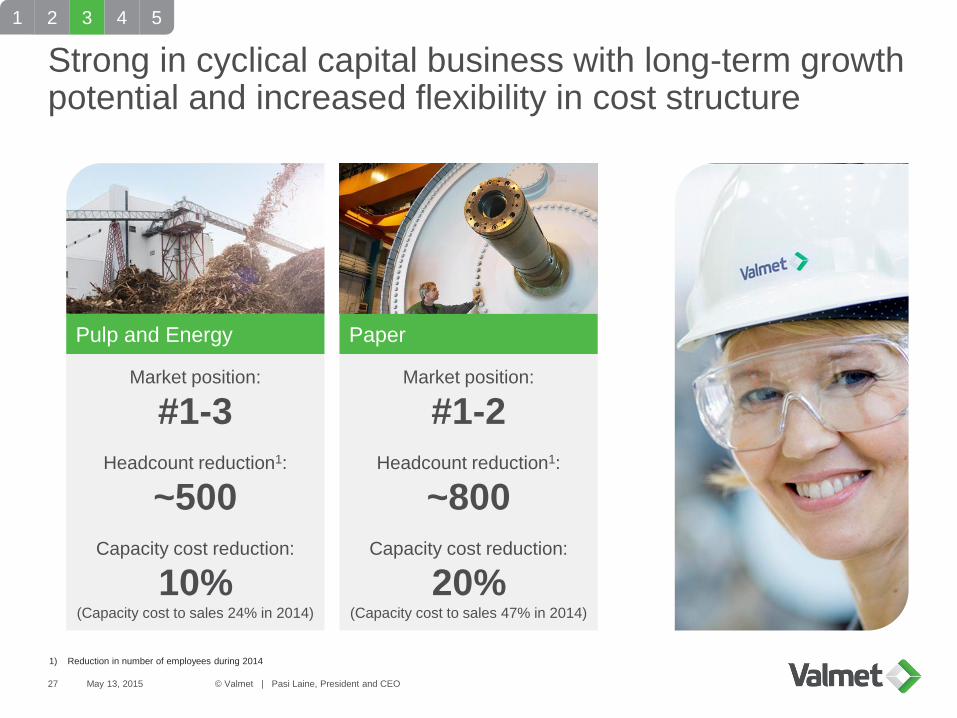
Market position:
#1-2
Headcount reduction1:
~800
Capacity cost reduction:
20%(Capacity cost to sales 47% in 2014)
Market position:
#1-3
Headcount reduction1:
~500
Capacity cost reduction:
10%(Capacity cost to sales 24% in 2014)
Strong in cyclical capital business with long-term growth potential and increased flexibility in cost structure
27 May 13, 2015 © Valmet | Pasi Laine, President and CEO
2 3 4 5
1) Reduction in number of employees during 2014
Pulp and Energy Paper
1
May 13, 2015 © Valmet | Pasi Laine, President and CEO28
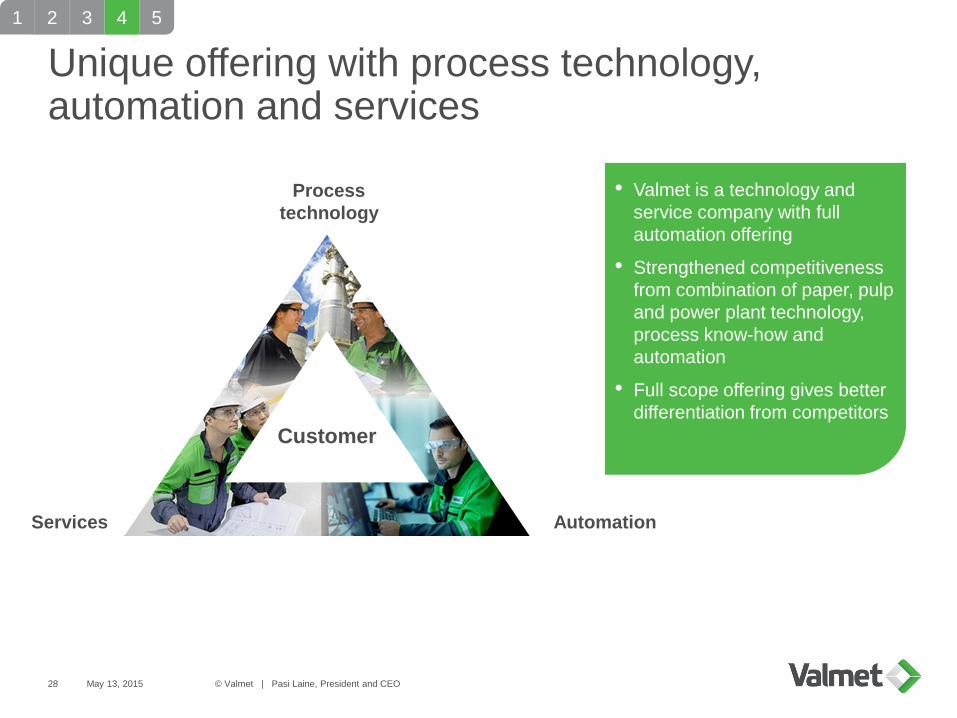
Unique offering with process technology, automation and services
2 3 4 5
Services
Process
technology
Automation
• Valmet is a technology and
service company with full
automation offering
• Strengthened competitiveness
from combination of paper, pulp
and power plant technology,
process know-how and
automation
• Full scope offering gives better
differentiation from competitors
1
CustomerCustomer
May 13, 201529 © Valmet | Pasi Laine, President and CEO
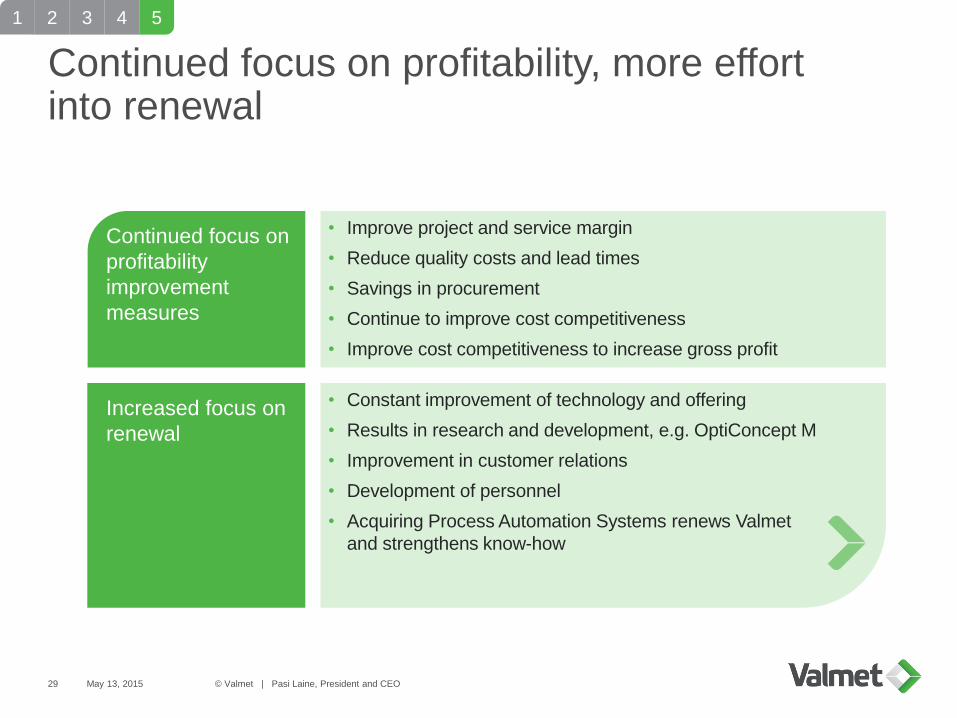
Continued focus on
profitability
improvement
measures
Continued focus on profitability, more effort into renewal
• Improve project and service margin
• Reduce quality costs and lead times
• Savings in procurement
• Continue to improve cost competitiveness
• Improve cost competitiveness to increase gross profit
Increased focus on
renewal
• Constant improvement of technology and offering
• Results in research and development, e.g. OptiConcept M
• Improvement in customer relations
• Development of personnel
• Acquiring Process Automation Systems renews Valmet
and strengthens know-how
2 3 4 51

Customer cases
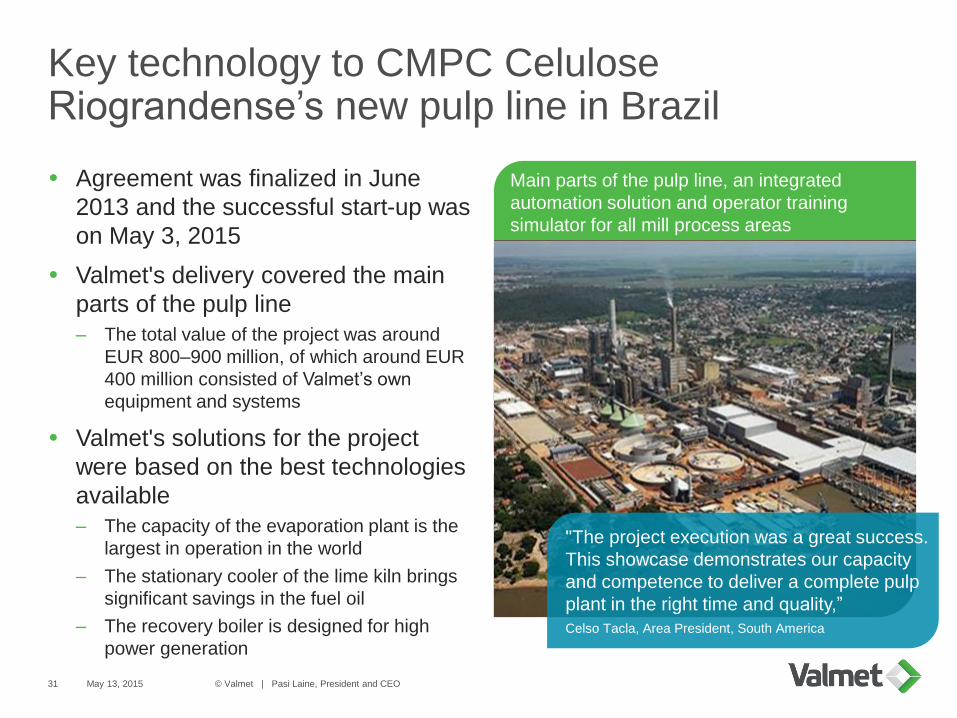
Key technology to CMPC CeluloseRiograndense’s new pulp line in Brazil
Agreement was finalized in June
2013 and the successful start-up was
on May 3, 2015
Valmet's delivery covered the main
parts of the pulp line
– The total value of the project was around
EUR 800–900 million, of which around EUR
400 million consisted of Valmet’s own
equipment and systems
Valmet's solutions for the project
were based on the best technologies
available
– The capacity of the evaporation plant is the
largest in operation in the world
– The stationary cooler of the lime kiln brings
significant savings in the fuel oil
– The recovery boiler is designed for high
power generation
Main parts of the pulp line, an integrated
automation solution and operator training
simulator for all mill process areas
May 13, 2015 © Valmet | Pasi Laine, President and CEO31
"The project execution was a great success.
This showcase demonstrates our capacity
and competence to deliver a complete pulp
plant in the right time and quality,”
Celso Tacla, Area President, South America
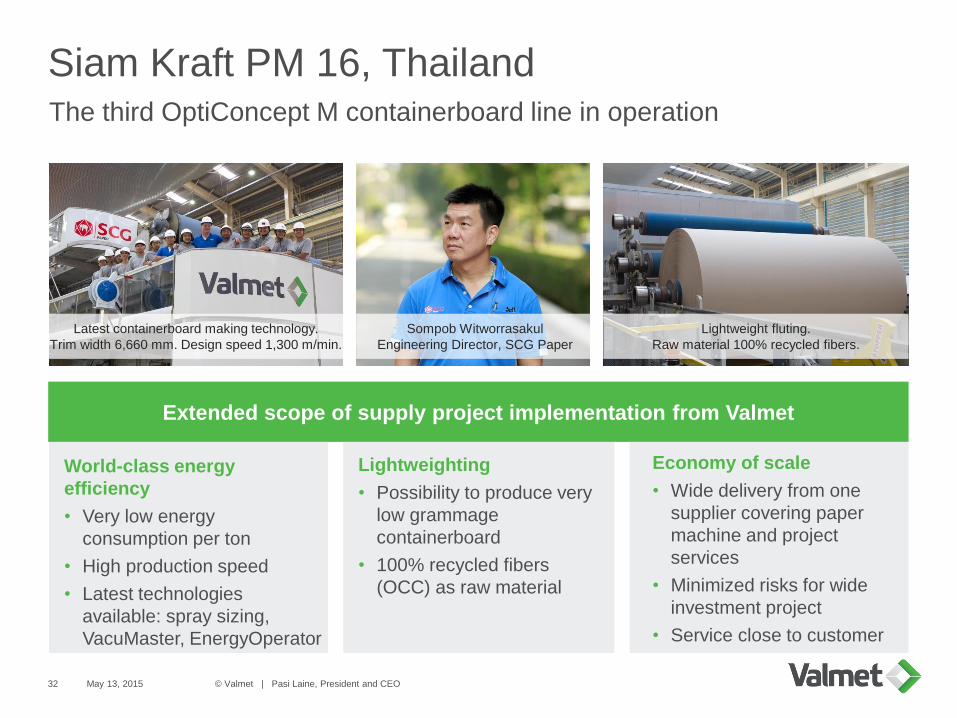
Siam Kraft PM 16, ThailandThe third OptiConcept M containerboard line in operation
May 13, 2015 © Valmet | Pasi Laine, President and CEO32
Extended scope of supply project implementation from Valmet
World-class energy
efficiency
• Very low energy
consumption per ton
• High production speed
• Latest technologies
available: spray sizing,
VacuMaster, EnergyOperator
Lightweighting
• Possibility to produce very
low grammage
containerboard
• 100% recycled fibers
(OCC) as raw material
Economy of scale
• Wide delivery from one
supplier covering paper
machine and project
services
• Minimized risks for wide
investment project
• Service close to customer
Sompob Witworrasakul
Engineering Director, SCG Paper
Lightweight fluting.
Raw material 100% recycled fibers.
Latest containerboard making technology.
Trim width 6,660 mm. Design speed 1,300 m/min.
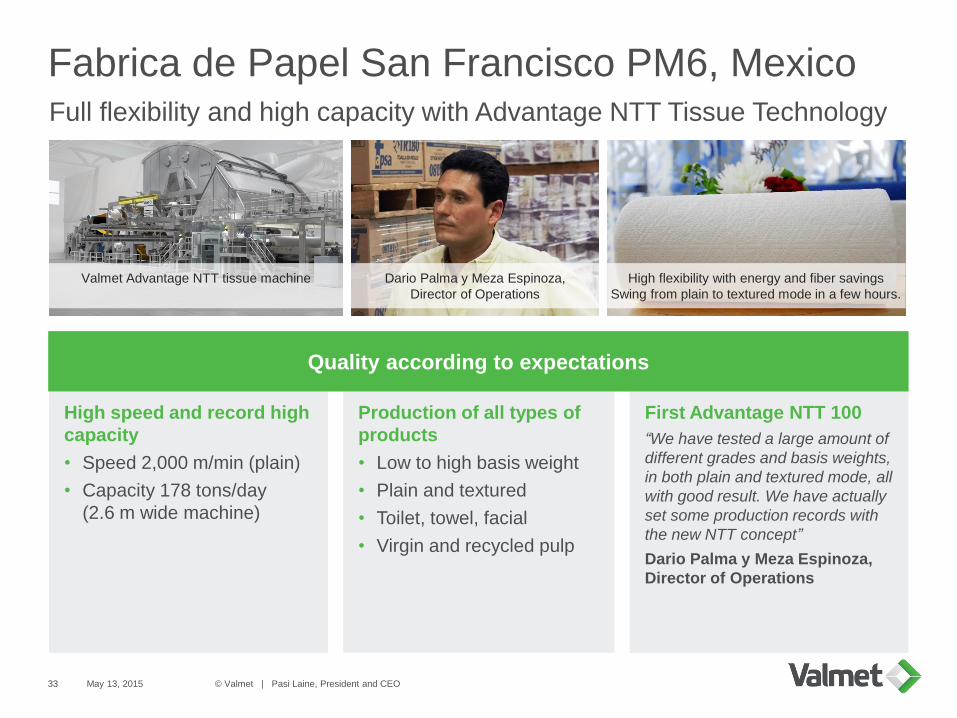
Fabrica de Papel San Francisco PM6, MexicoFull flexibility and high capacity with Advantage NTT Tissue Technology
May 13, 2015 © Valmet | Pasi Laine, President and CEO33
Quality according to expectations
High speed and record high
capacity
• Speed 2,000 m/min (plain)
• Capacity 178 tons/day
(2.6 m wide machine)
Production of all types of
products
• Low to high basis weight
• Plain and textured
• Toilet, towel, facial
• Virgin and recycled pulp
First Advantage NTT 100
“We have tested a large amount of
different grades and basis weights,
in both plain and textured mode, all
with good result. We have actually
set some production records with
the new NTT concept”
Dario Palma y Meza Espinoza,
Director of Operations
Dario Palma y Meza Espinoza,
Director of Operations
High flexibility with energy and fiber savings
Swing from plain to textured mode in a few hours.
Valmet Advantage NTT tissue machine
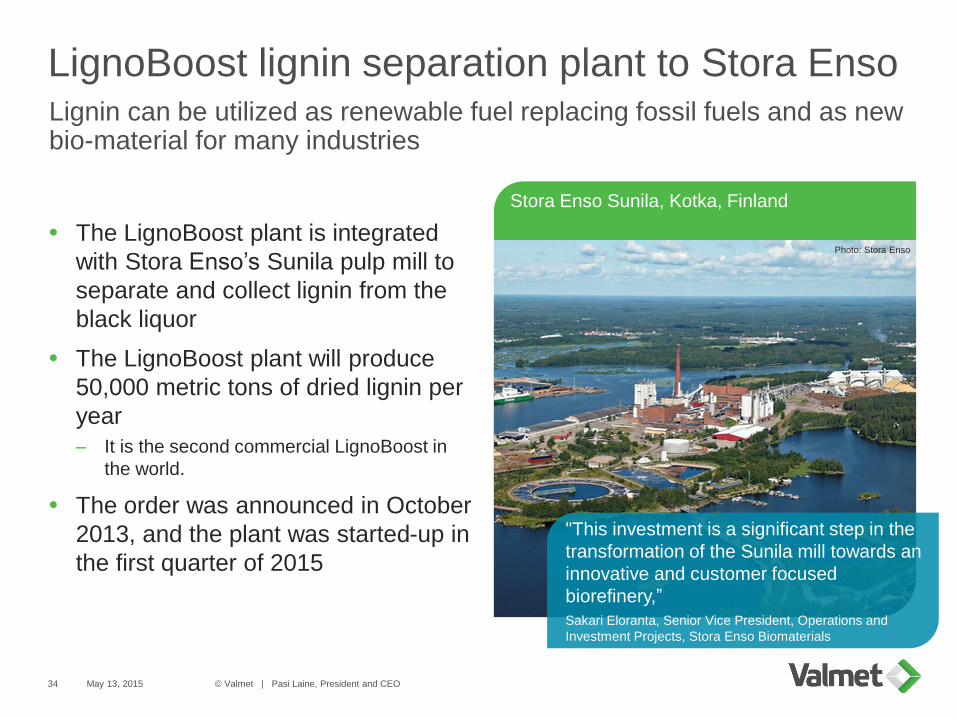
LignoBoost lignin separation plant to Stora Enso
The LignoBoost plant is integrated
with Stora Enso’s Sunila pulp mill to
separate and collect lignin from the
black liquor
The LignoBoost plant will produce
50,000 metric tons of dried lignin per
year
– It is the second commercial LignoBoost in
the world.
The order was announced in October
2013, and the plant was started-up in
the first quarter of 2015
Stora Enso Sunila, Kotka, Finland
May 13, 2015 © Valmet | Pasi Laine, President and CEO34
"This investment is a significant step in the
transformation of the Sunila mill towards an
innovative and customer focused
biorefinery,”
Sakari Eloranta, Senior Vice President, Operations and
Investment Projects, Stora Enso Biomaterials
Lignin can be utilized as renewable fuel replacing fossil fuels and as new bio-material for many industries
Photo: Stora Enso
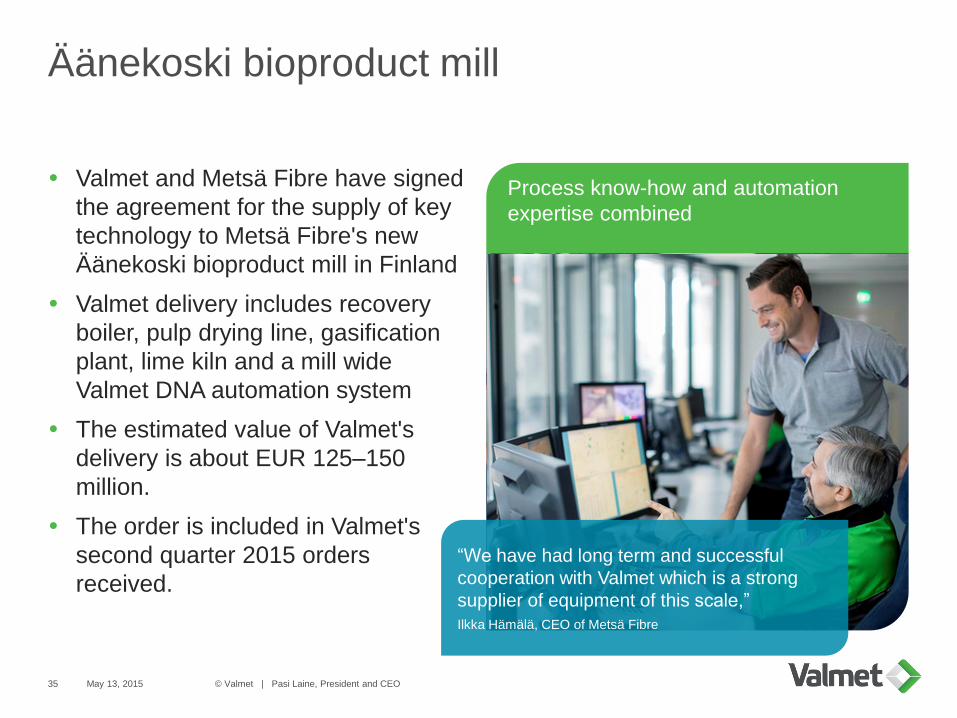
Äänekoski bioproduct mill
Valmet and Metsä Fibre have signed
the agreement for the supply of key
technology to Metsä Fibre's new
Äänekoski bioproduct mill in Finland
Valmet delivery includes recovery
boiler, pulp drying line, gasification
plant, lime kiln and a mill wide
Valmet DNA automation system
The estimated value of Valmet's
delivery is about EUR 125–150
million.
The order is included in Valmet's
second quarter 2015 orders
received.
Process know-how and automation
expertise combined
May 13, 2015 © Valmet | Pasi Laine, President and CEO35
“We have had long term and successful
cooperation with Valmet which is a strong
supplier of equipment of this scale,”
Ilkka Hämälä, CEO of Metsä Fibre

Conclusion

Investment highlight summary
© Valmet | Pasi Laine, President and CEO37
Strong market position in growing markets
Growing, profitable and stable service and
automation business with EUR 1.3 billion sales
Strong in cyclical capital business with long-term growth
potential and increased flexibility in cost structure
Unique offering with process technology, automation
and services
Continued focus on profitability, more effort into
renewal
1
2
3
4
5
May 13, 2015
Important notice
May 13, 2015 © Valmet | Pasi Laine, President and CEO38
It should be noted that certain statements herein which are not historical facts, including, without
limitation, those regarding expectations for general economic development and the market situation,
expectations for growth, profitability and investment willingness, expectations for company development,
growth and profitability and the realization of synergy benefits and cost savings, and statements
preceded by “anticipates”, “believes”, ”estimates”, “expects”, ”foresees” or similar expressions, are
forward-looking statements. Since these statements are based on current decisions and plans, estimates
and projections, they involve risks and uncertainties which may cause the actual results to materially
differ from the results currently expressed. Such factors include, but are not limited to:
1) general economic conditions, including fluctuations in exchange rates and interest levels which
influence the operating environment and profitability of customers of the company or economic growth in
the company’s principal geographic markets.
2) industry conditions, intensity of competition situation, especially potential introduction of significant
technological solutions developed by competitors, financial condition of the customers and the
competitors of the company,
3) the company’s own operating factors, such as the success of production, product development and
project management and the efficiencies therein including continuous development and improvement
4) the success of pending and future acquisitions and restructuring.

Appendix
May 13, 2015 © Valmet | Pasi Laine, President and CEO41
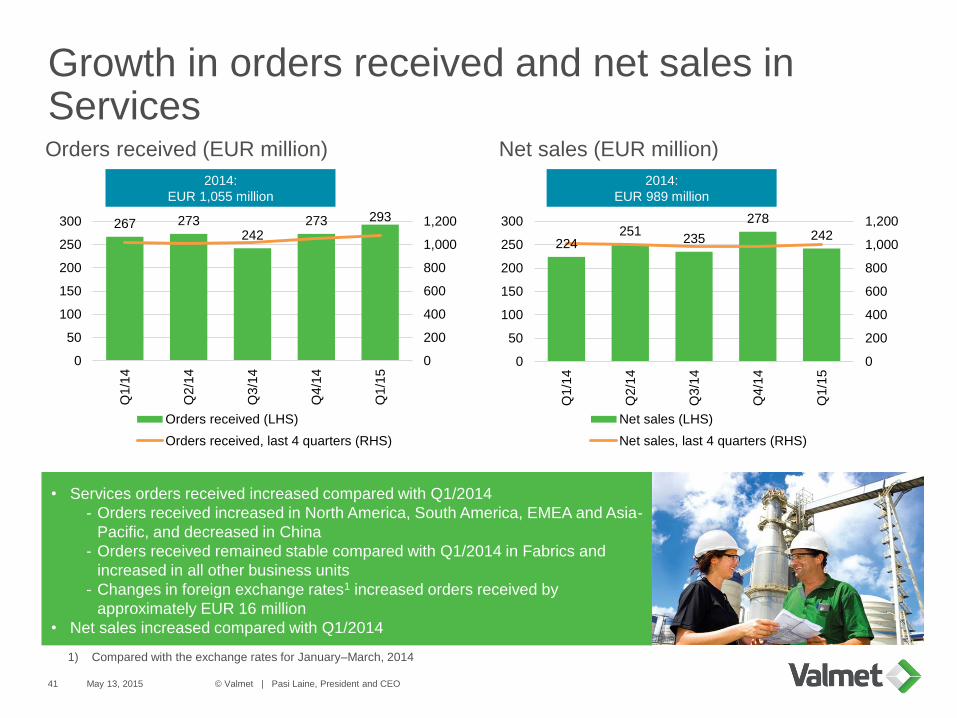
Growth in orders received and net sales in Services
224251
235
278
242
0
200
400
600
800
1,000
1,200
0
50
100
150
200
250
300
Q1/1
4
Q2/1
4
Q3/1
4
Q4/1
4
Q1/1
5
Net sales (LHS)
Net sales, last 4 quarters (RHS)
Net sales (EUR million)Orders received (EUR million)
• Services orders received increased compared with Q1/2014
- Orders received increased in North America, South America, EMEA and Asia-
Pacific, and decreased in China
- Orders received remained stable compared with Q1/2014 in Fabrics and
increased in all other business units
- Changes in foreign exchange rates1 increased orders received by
approximately EUR 16 million
• Net sales increased compared with Q1/2014
2014:
EUR 1,055 million
2014:
EUR 989 million
267 273242
273 293
0
200
400
600
800
1,000
1,200
0
50
100
150
200
250
300
Q1/1
4
Q2/1
4
Q3/1
4
Q4/1
4
Q1/1
5
Orders received (LHS)
Orders received, last 4 quarters (RHS)
1) Compared with the exchange rates for January–March, 2014

May 13, 2015 © Valmet | Pasi Laine, President and CEO42
Orders received decreased and net sales increased in Pulp and Energy
622560
96 66138
0
200
400
600
800
1,000
1,200
1,400
1,600
0
100
200
300
400
500
600
700
800
Q1/1
4
Q2/1
4
Q3/1
4
Q4/1
4
Q1/1
5
Orders received (LHS)
Orders received, last 4 quarters (RHS)
181
229 234
312
222
0
200
400
600
800
1,000
1,200
1,400
1,600
0
50
100
150
200
250
300
350
400
Q1/1
4
Q2/1
4
Q3/1
4
Q4/1
4
Q1/1
5
Net sales (LHS)
Net sales, last 4 quarters (RHS)
Net sales (EUR million)Orders received (EUR million)
• Orders received decreased compared with Q1/2014
- Orders received increased in South America and North America, and
decreased in other areas
- Orders received decreased in both Pulp and Energy
• Net sales increased compared with Q1/2014
2014:
EUR 956 million
2014:
EUR 1,344 million
May 13, 2015 © Valmet | Pasi Laine, President and CEO43
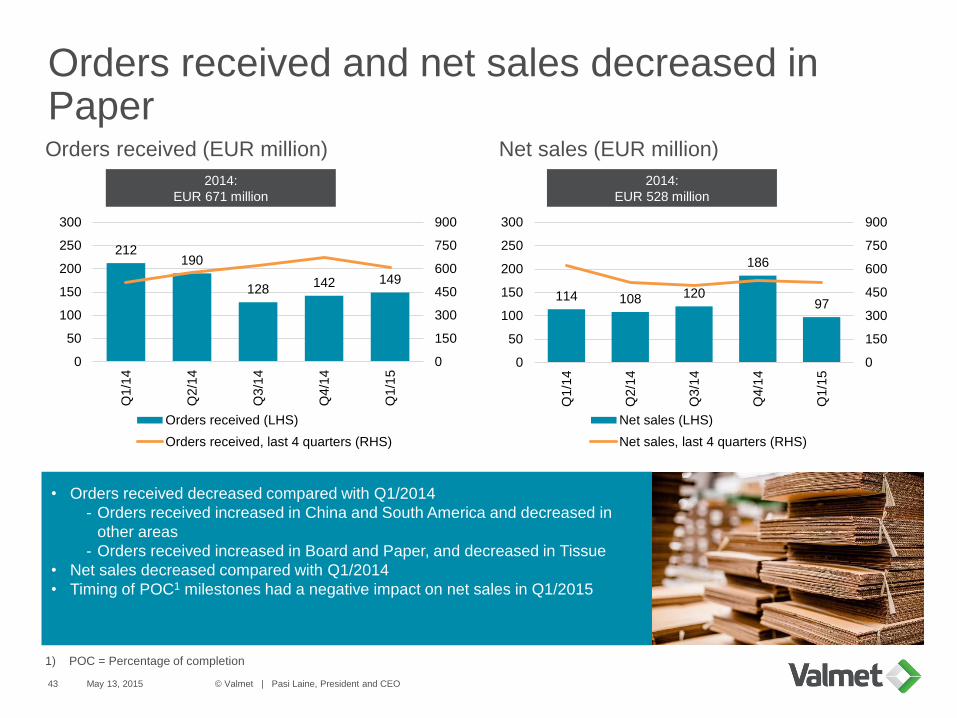
Orders received and net sales decreased in Paper
212190
128142 149
0
150
300
450
600
750
900
0
50
100
150
200
250
300
Q1/1
4
Q2/1
4
Q3/1
4
Q4/1
4
Q1/1
5
Orders received (LHS)
Orders received, last 4 quarters (RHS)
114 108 120
186
97
0
150
300
450
600
750
900
0
50
100
150
200
250
300
Q1/1
4
Q2/1
4
Q3/1
4
Q4/1
4
Q1/1
5
Net sales (LHS)
Net sales, last 4 quarters (RHS)
Net sales (EUR million)Orders received (EUR million)
• Orders received decreased compared with Q1/2014
- Orders received increased in China and South America and decreased in
other areas
- Orders received increased in Board and Paper, and decreased in Tissue
• Net sales decreased compared with Q1/2014
• Timing of POC1 milestones had a negative impact on net sales in Q1/2015
2014:
EUR 528 million
2014:
EUR 671 million
1) POC = Percentage of completion