EVALUATING GREEN INFRASTRUCTURE: A COMBINED SEWER OVERFLOW CONTROL ALTERNATIVE FOR LONG TERM CONTROL PLANS Commissioner Bob Martin JANUARY 2018 New Jersey Department of Environmental Protection Division of Water Quality
Transcript
EVALUATING GREEN INFRASTRUCTURE:
A COMBINED SEWER OVERFLOW CONTROL
ALTERNATIVE FOR LONG TERM CONTROL PLANS
Commissioner Bob Martin
JANUARY 2018
New Jersey Department of Environmental Protection Division of Water Quality
CONTENTS
Acknowledgements
Executive Summary
Chapter 1: Introduction and Overview Chapter 2: Locating and Assessing the Feasibility of Green Infrastructure Chapter 3: Green Infrastructure Implementation and Performance Monitoring Chapter 4: Maintenance Considerations Chapter 5: CSO Reduction Potential of Green Infrastructure Chapter 6: Cost Benefit Analysis Methodologies Chapter 7: Financing Green Infrastructure Closing Statement
Appendix A: Recommended GI Plant Information References
Recommended Audience for Chapters:
Ch. 1 Ch. 2 Ch. 3 Ch. 4 Ch. 5 Ch. 6 Ch. 7
Permittee X X X X X X X
Engineer X X X X X
Planner X X X X X
Department of
Public WorksX X X
Municipal Manager X X X
Icon ReaderChapter of Interest
ACKNOWLEDGEMENTS The Department would like to thank the Environmental Infrastructure Trust for its contribution to this document. The Department would also like to acknowledge the contractors, Mott MacDonald and the Center for Watershed Protection, for their role in the creation of this document. We would also like to thank the NJPDES CSO permittees and stakeholders for their insight and feedback. Finally, the Department would like to acknowledge the contributions of the following NJDEP staff members:
Gabriel Mahon
Julie Krause
Maxwell Brekke
Susan Rosenwinkel
Timothy Ebersberger
Adriana Caldarelli
Lisa Schaefer
Armando Alfonso
Steven Corey Anen
Dwayne Kobesky
Joseph Mannick
Nancy Kempel
Heather Knizhnik
Evaluating GI: A CSO Control Alternative for LTCPs January 2018
Executive Summary Page 1
EXECUTIVE SUMMARY
The intent of this document is to provide guidance to Combined Sewer Overflow (CSO) permittees within the State of New Jersey to evaluate green infrastructure (GI) as part of their Long Term Control Plans (LTCPs). In 2015, the Department issued New Jersey Pollutant Discharge Elimination System (NJPDES) CSO permits to 25 permittees that require, among other things, the development of an LTCP to address CSOs. LTCPs include a system-wide evaluation of sewage infrastructure and the hydraulic relationship between the sewers, precipitation, treatment capacity and overflows. As part of the LTCP, the permittee must evaluate alternatives that will reduce or eliminate the CSO discharges, and develop a plan and implementation schedule. GI is one of the seven specific CSO control alternatives that must be evaluated for the purposes of the LTCP pursuant to Part IV.G.4 of the NJPDES CSO permits.
Combined sewer systems (CSS) collect both sanitary sewage and stormwater in the same underground pipe networks. During dry weather all wastewater flows are conveyed to a sewage treatment plant where it receives appropriate treatment before it is discharged to the waterway. However, during heavy rainfall or significant snowmelt, the additional flow exceeds the capacity of the system resulting in a discharge of untreated sewage and stormwater to the waterway; this discharge is referred to as a combined sewer overflow. The volume reduction or detention provided by GI helps to minimize or delay the flow entering a CSS, resulting in fewer overflow events, shorter-duration overflow events, or reduced volume of overflow.
GI is a broad term that generally refers to engineered systems that manage runoff close to where it is generated by incorporating natural features into the design of the system. The volume reduction and/or stormwater detention achieved using GI is particularly important in areas with CSSs. GI allows stormwater to infiltrate into the ground, be treated by vegetation or soils and slowly released into the sewer system, or be stored for reuse. For the purpose of this document, GI refers to methods of stormwater management that reduce stormwater volume, or that result in changes to the characteristics of stormwater flow into the combined and/or separate storm sewers, or surface waters.
In urban areas, space for stormwater management is often a limiting factor. GI is generally designed to manage small, frequent storm events and may be appropriate for these space-limited areas. GI may be designed to manage a number of rain events from less than an inch to, in some circumstances, significantly larger events. In New Jersey, GI is often designed to manage the New Jersey Department of Environmental Protection Water Quality Design Storm (WQDS), which is defined as 1.25 inches of rainfall over a two-hour period. Approximately 90% of the rain events in New Jersey, on an annual basis, are 1.25 inches or less. Therefore, GI designed to manage this rain event can reduce or detain a large portion of the volume of stormwater that enters a CSS on an annual basis. The widespread use of GI can have a cumulative effect of reducing flows to the CSS and ultimately reduce CSOs. Examples of GI include, but are not limited to, bioretention systems, pervious paving systems, vegetative filter strips, green roofs, cisterns, tree plantings, grass swales, infiltration basins, sand filters, and dry wells.
Evaluating GI: A CSO Control Alternative for LTCPs January 2018
Executive Summary Page 2
LTCP implementation will be a long and expensive process. Many of the alternatives that will ultimately be implemented to address CSOs will be built on publicly owned land, the cost of which will be borne primarily by the rate payer. GI, however, can and should be implemented both on publicly and privately owned land, allowing the cost of GI to be shared by both the rate payers and private developers. The State Stormwater Management (SWM) rules at N.J.A.C. 7:8 require all municipalities to adopt a stormwater control ordinance to address stormwater on individual development sites. The SWM rules set minimum design and performance standards; however, municipalities have the authority to adopt more stringent stormwater control ordinances to address local needs. Many CSO municipalities across the country have used stormwater control ordinances to require GI on new and redevelopment projects to minimize the amount of stormwater that enters their CSS and help meet the CSO permit obligations, without incurring additional cost to the permittee or the rate payers. New Jersey municipalities can and have developed local ordinances to promote the use of GI on public and private land.
This guidance is not intended to be the sole resource for evaluating this alternative. Additionally, this document is not intended to provide detailed design guidance for GI as this guidance can be found in the New Jersey Stormwater Best Management Practices Manual (see http://www.njstormwater.org/bmp_manual2.htm) nor is intended to be an endorsement of any proprietary software or work product. This guidance provides case studies, links, and resources to assist a CSO permittee with including GI as part of its CSO Long Term Control Plan.
Evaluating GI: A CSO Control Alternative for LTCPs January 2018
Chapter 1 Introduction and Overview Page 1
1 INTRODUCTION AND OVERVIEW Overview of Green Infrastructure Guidance
The intent of this document is to provide guidance and direction to New Jersey Combined Sewer Overflow (CSO) permittees for assessing the implementation of green infrastructure (GI) in the development of Long Term Control Plans (LTCPs). This guidance references New Jersey Pollutant Discharge Elimination System (NJPDES) CSO permit requirements as they relate to GI. GI implementation will impact the sewerage authority, municipal government, and the entire community and therefore, this document applies to all these entities. This document also covers a wide range of topics relating to GI, some of which extend beyond the
specific NJPDES CSO permit requirements. Therefore, each chapter explains the relevance of the
guidance document to the NJPDES CSO permit.
The NJPDES CSO permit requires each permittee to establish a public participation and education process that, among other things, discusses CSO control alternatives including the feasibility of GI. The public participation process must actively involve the affected public and stakeholders throughout the development of the LTCP. Because GI may be new to municipalities and sewerage authorities, it may require adjustments to standard design processes currently being followed for sewer infrastructure. In some cases, it can require a cultural shift in traditional stormwater management thinking. Educational programs and outreach are critical components to inform both internal and external stakeholders of the challenges and benefits of GI. This document is divided into primary sections that include the following:
▪ Chapter 2 - Locating and Assessing the Feasibility of Green Infrastructure: This chapter discusses methodologies for geographically evaluating and siting GI to maximize stormwater capture.
▪ Chapter 3 - Green Infrastructure Implementation and Performance Monitoring: This chapter provides insight into implementation and performance monitoring and how the GI program can continually be reviewed, adapted, and improved.
▪ Chapter 4 - Maintenance Considerations: A significant part of the lifecycle costs and success of a GI program depend on operation and maintenance. This chapter discusses the typical maintenance needs for GI for consideration by permittees and responsible parties.
▪ Chapter 5 – CSO Reduction Potential of Green Infrastructure: This chapter reviews the primary steps for evaluating GI for CSO volume reduction potential.
▪ Chapter 6 - Cost Benefit Analysis Methodologies: This chapter reviews available information pertaining to costs associated with various GI practices, quantifying benefits, and use of GI in an
Evaluating GI: A CSO Control Alternative for LTCPs January 2018
Chapter 1 Introduction and Overview Page 2
integrated manner with gray infrastructure at a large scale in comparison with overflow reduction goals.
▪ Chapter 7 - Financing Green Infrastructure: This chapter reviews available funding and alternative financing mechanisms including grants and low interest loans. This chapter also discusses practices to incentivize private GI practices.
Long Term Control Plan Permit Requirements
When located strategically within a sewer system, GI practices can capture a significant volume of stormwater on an annual basis, eliminate or remove mass pollutants, and reduce the number of overflow events. GI is one of the seven CSO control alternatives that are required to be evaluated as part of the NJPDES CSO permit. The Evaluation of Alternatives at Part IV.G.4.e of the permit compels permittees to evaluate a range of CSO control alternatives predicted to accomplish the requirements of the Clean Water Act. In its evaluation of each potential CSO control alternative, the permittee will use NJDEP approved hydrologic, hydraulic and water quality models to simulate the existing conditions and conditions that are expected to exist after construction and operation of the chosen alternative(s). The permittee will evaluate the practical and technical feasibility of the proposed CSO control alternative(s) the water quality benefits of constructing and implementing various remedial controls and the combination of such controls. The various controls include, but are not limited to: GI; increased storage capacity in the collection system; expansion and/or storage at the sewage treatment plant; infiltration/inflow reduction; sewer separation; treatment of the CSO discharge; and CSO related bypass at the sewage treatment plant.
Importance of Green Infrastructure
The NJDEP supports the use of a comprehensive approach when evaluating the various sources of pollution and managing stormwater runoff within the permittees’ sewersheds. GI integrated with gray infrastructure and broader watershed-based projects has been demonstrated to achieve improvements to water quality at a faster rate than either alone because GI can be implemented in an incremental fashion. That reduces overflows more quickly. Also, because of the flexibility of GI in design performance, GI can serve to reduce and mitigate localized flooding and sewer back-ups while also reducing CSOs. An integrated plan that addresses both overflows and flooding can often be more cost-effective than addressing these issues separately. In addition to meeting CSO reduction goals in New Jersey, the use of GI throughout the sewershed is considered to be one of the key practices to build resilience to large storm events and should be used to promote sound stormwater management. In June of 2012, the US EPA issued an Integrated Municipal Stormwater and Wastewater Planning Approach Framework (https://www3.epa.gov/npdes/pubs/integrated_planning_framework.pdf) which highlighted the use of innovative technologies for States and local governments to develop effective integrated plans under the Clean Water Act. This framework includes GI as one of the four overarching principles which specifically states: “Innovative technologies, including green infrastructure, are important tools that can generate many benefits, and may be fundamental aspects of municipalities’ plans for integrated solutions.” GI is widely recognized as a tool that municipalities consider in meeting Clean Water Act obligations.
Evaluating GI: A CSO Control Alternative for LTCPs January 2018
Chapter 1 Introduction and Overview Page 3
Major cities with combined sewer systems, including New York, Chicago, Milwaukee, Philadelphia, Washington DC, Seattle, Cincinnati, and Pittsburgh have found a way to integrate GI into their planning process and as part of CSO reduction efforts. Strategic implementation of GI involves utilizing an approach that is based on sustainable principles and manages stormwater as a resource instead of a nuisance. In the above referenced framework, EPA has committed to working closely with State and local governments to incorporate GI. The EPA released “Community Solutions for Stormwater Management: A Guide for Voluntary Long-Term Planning,” a draft guidance for states and local governments preparing long-term stormwater plans.
Overview of Benefits of Green Infrastructure
Benefits that result from the implementation of GI can include environmental, economic, and social
benefits. While these benefits are ancillary to the reduction of CSOs, they should be considered when
incorporating GI as part of an integrated plan and aligning a GI program with other community plans.
Typical benefits that occur as part of a GI program include the following:
Environmental Benefits - The driving force behind GI development in CSO sewersheds is stormwater runoff control. In addition to mitigating CSOs, GI can also help to mitigate other urban environmental issues such as surface and basement sewage flooding and urban heat island effect. GI can also offset air quality pollution, wildlife habitat loss and degradation, and effects from climate change.
Social Benefits - Before GI was viewed as a solution towards CSO control, it was viewed as an opportunity to beautify the city. For example, ‘Green streets’ in New York City were originally used for aesthetic improvements before the city began focusing on stormwater concerns. GI can be viewed as an opportunity to provide green space for recreation, attract businesses and visitors to the area, and improve traffic dynamics, particularly in the case of traffic islands and stormwater curb bump outs.
Economic Benefits - GI provides economic benefits such as improved property value, reduced need for traditional gray infrastructure, reduced risk and costs from environmental damage due to surface and basement sewage flooding, and the creation of green jobs. Selection of GI types may depend on aesthetics, habitat potential, recreational needs, community acceptance, public visibility, and education/demonstration potential. Often GI programs must be consistent with and can help to catalyze other programs in the community which may include:
▪ Sustainability Plans ▪ Neighborhood Plans ▪ Street Revitalization ▪ Urban Planning and Renewal Plans ▪ Natural Resources Inventories ▪ Recreational Parks and Green Acres
GI can be built into these other existing programs to provide additional benefits and potential funding
sources. Supplementing other programs also allows the implementation of GI in a holistic manner that
can serve as a cooperative effort with other community goals.
Evaluating GI: A CSO Control Alternative for LTCPs January 2018
Chapter 1 Introduction and Overview Page 4
Planning Approach for Green Infrastructure
Several different methodologies for evaluating GI have been examined across the country. The
suggested high-level planning approach described below has been informed by an evaluation of the
various methodologies used throughout the country. This approach is an iterative process and some
steps may need to be re-evaluated as additional information is gathered. While a suggested order is
included below, these steps do not necessarily need to be conducted in this order. Additional detail on
each step is provided throughout the document.
Step 1: Evaluate land uses, drainage areas and other community specific drivers and benefits to
establish the goals and milestones for the GI program.
▪ Complex methods will utilize various data layers to identify strategic locations. Develop multiple
scenarios integrating green infrastructure with gray infrastructure and optimal use of existing
infrastructure. Vary the levels of green and gray control utilized to see the combined effect that
a green/gray solution has on CSO frequency and volume.
▪ Identify potential locations for green infrastructure in various property categories including the
right-of-way, public property, private property and vacant parcels.
▪ Prioritize locations based on the amount of stormwater managed and other community specific
environmental, social and economic criteria.
Step 2: Identify program needs for GI implementation. This may include development of:
▪ Changes to local ordinances to require or encourage GI;
▪ A community vision or coordinated GI plan with existing community plans;
▪ Stakeholder and community outreach and education including development of materials,
presentations, and a webpage;
▪ GI advisory committee to help inform decision making;
▪ Planning, design and construction standards;
▪ Supply chains for obtaining GI construction materials;
▪ Maintenance needs/equipment;
▪ A project tracking system to assist with maintenance and asset management;
▪ A skilled workforce; and
▪ Pre and post installation monitoring program requirements.
Step 3: Evaluate the expected performance of GI with and without integration of strategic gray
infrastructure with the sewer system model.
▪ Determine suitability of current model to analyze the effects of green infrastructure on CSO
reduction. Update or add detail to the model if necessary.
▪ Select green infrastructure practices and the appropriate design criteria for analysis with the
model. Incorporate green infrastructure in the sewer system model and determine the
Evaluating GI: A CSO Control Alternative for LTCPs January 2018
Chapter 1 Introduction and Overview Page 5
amount(s) of impervious area needed to be managed to meet the goals and milestones as
described above. Perform this analysis with and without the use of strategic gray infrastructure
to develop a range of performance needed to meet the goals.
reduction from GI as compared to the selected goals.
Step 4: Determine lifecycle costs associated with the selected scenarios and relate to the water
quality benefits and local community benefits achieved in order to identify the optimal scenario.
▪ Determine capital, operation and maintenance, and replacement costs.
▪ Conduct triple bottom line analysis.
▪ Compare lifecycle costs to total benefits to determine cost benefit ratio.
Step 5: Identify opportunities/strategies for funding and/or means to incentivize GI development.
▪ Evaluation of opportunities for GI projects to align with community redevelopment or renewal
plans or other infrastructure projects.
▪ Modification of stormwater management regulations and ordinances for private development
and redevelopment. This can include innovative approaches including public-private
partnerships and credit trading.
▪ Establishment of a capital program for GI.
▪ Identification of Federal or state funding programs/grant and loan programs.
GI can often be incorporated as a component into other infrastructure projects and can be implemented
at various scales and timelines. In some cases, it may be possible to plan, design, and construct GI in a
shorter schedule than larger infrastructure projects. If GI is selected as a CSO control alternative, the
LTCP should include identification of measurable metrics for interim milestones. It is not expected that
the design and location of every GI practice will be identified in the LTCP. However, some metric must
be included in the LTCP to estimate GI’s impact on overflows as well as an estimated implementation
schedule. These metrics may include such things as:
▪ Acres of impervious area managed at the end of 5, 10, 15, 25, and 30 years
▪ Gallons of stormwater captured at the end of 5, 10, 15, 25, and 30 years
Refer to the Adaptive Management section in Chapter 3 for a case study regarding milestones and
adaptations for GI incorporated into a LTCP.
Green Infrastructure to Manage Disconnected Stormwater Inflow
While this document focuses on evaluating GI as a CSO control alternative, it is important to note that GI can play an important role in a permittee’s strategy for addressing illicit stormwater inflow into its system. In some sewer systems, there are separately-sewered areas where roof leaders are illicitly connected to the sanitary sewers. During storm events, these areas function like combined systems and
Evaluating GI: A CSO Control Alternative for LTCPs January 2018
Chapter 1 Introduction and Overview Page 6
may impact downstream combined communities resulting in overflows or backups. Generally, the simplest option to address these situations is to connect these flows directly to the separate storm sewers; in cases where this is not feasible, roof leaders can be disconnected from the sanitary line and be managed by GI. Whenever roof leaders are disconnected it is critical that the stormwater is managed in such a way that it does not create new or exacerbate existing flooding, result in downstream waterway hydromodification, and/or create a new water quality issue. GI’s design versatility makes it an effective way to manage stormwater that is newly disconnected from the sanitary sewer.
Evaluating GI: A CSO Control Alternative for LTCPs January 2018
Chapter 2 Locating and Assessing the Feasibility of GI Page 1
2 LOCATING AND ASSESSING THE FEASIBILITY OF
GREEN INFRASTRUCTURE Overview
This chapter discusses the wide range of topics involved in assessing the overall feasibility of green infrastructure (GI) and how to locate potential GI sites. An example stepwise process is provided and discussed throughout this chapter, with several supporting case studies from across the United States. Regarding the location of GI sites and volume reductions that can be anticipated, this information can be used to meet the requirements of the NJPDES CSO requirements related to the evaluation of GI. Inevitably, the process of assessing the feasibility of GI, locating potential project sites, and determining which projects to implement, is specific to each community. As such, each community may find benefit in adapting this example process, and information gained from the case studies, into the identification and ranking of projects that fit its specific needs. Each CSO permittee is required to implement a public participation process through the development of the LTCP in accordance with its CSO permit. As it is crucial to garner public support for the implementation of GI as early in the process as possible, the chapter concludes with a brief discussion of, followed by several case studies specific to, public outreach.
Evaluating GI: A CSO Control Alternative for LTCPs January 2018
Chapter 2 Locating and Assessing the Feasibility of GI Page 2
Work Flow Process
A work flow process for locating and assessing the feasibility of GI projects is detailed in Figure 2-1:
Figure 2-1: Example Process for Assessing the Feasibility, Locating, and Prioritizing GI Practices
Step 1: Know Your System
The first step, “Know Your System”, involves the important background information required to assess the feasibility of GI. This includes information such as the number of CSO outfalls, the extent of the CSS, the interconnectivity of the system, and the response of the CSS to rainfall. The system characterization materials generated as part of the NJPDES CSO permit requirement should be evaluated as a first step in collecting this information.
Step 2: Compile a GIS Database for GIS Parameters
GIS analysis can be used to determine where multiple parameters align and identify optimal GI site locations. Some of this information may have already been developed as part of the System
Evaluating GI: A CSO Control Alternative for LTCPs January 2018
Chapter 2 Locating and Assessing the Feasibility of GI Page 3
Characterization requirements of the NJPDES CSO permit. Using GIS technology, permittees can assess the feasibility of GI installation, and target the most advantageous locations. The following are common GIS parameters used to evaluate the potential for GI practices.
Topography
Topography, along with surface features and sewer infrastructure, dictates the direction of stormwater runoff. Analysis can be specific to GI practices or at a much larger scale to understand the movement of runoff within the entire community.
Impervious surface coverage
When locating potential GI sites, a crucial parameter is the community’s impervious surface coverage. Targeting large areas of impervious surface coverage often allows for the greatest pollutant removal and stormwater volume reduction potential. Combining this analysis with topography assists in identifying prime locations for GI implementation. For example, areas with large amounts of connected impervious surface coverage and ground slope that allows for runoff to drain towards one location, provide excellent opportunities to capture and manage stormwater.
Depth to Groundwater and Bedrock
As discussed further in Step 3, the New Jersey Stormwater Best Management Practices (BMP) Manual states that infiltration practices must have a distance of 2-feet from the bottom elevation to the seasonal high water table (SHWT) or bedrock. Also, systems with underdrains must have a distance of 1-foot from the bottom elevation to the SHWT or bedrock. Understanding the depth of soils to restrictive features is crucial in determining the feasibility of GI practices within a community.
Sewer Infrastructure
Existing storm sewer or combined sewer infrastructure along with surface features and topography dictate the direction of stormwater runoff. Knowledge of the existing sewer infrastructure is key to locating GI practices and for designing for safe conveyance of GI overflows. Additionally, the sewer infrastructure is vital to the hydraulic and hydrologic modeling discussed in Step 4.
Cautionary Note: In urban communities, it may be necessary to have GI practices installed near existing buildings and structures (e.g. a tree trench in front of a building). Water that is infiltrated by a GI practice can make its way into nearby building basements and foundations without careful planning and design. To avoid this, permittees should perform groundwater mounding analysis for proposed locations. The United States Geological Survey (USGS) provides a model using the Hantush equation for groundwater mounding. As an alternative, the GI practices can be designed with liners to prevent the infiltration of stormwater that could seep into basements.
Evaluating GI: A CSO Control Alternative for LTCPs January 2018
Chapter 2 Locating and Assessing the Feasibility of GI Page 4
Sewershed Boundaries
Sewershed boundaries are crucial to understanding the flow of water within the community, determining target areas of GI implementation, and performing hydraulic and hydrologic modeling.
Utilities
Understanding the location of utilities (e.g., water mains, gas lines) will greatly assist in determining ideal locations for GI implementation during the desktop analysis that is further described in Step 3.
Parcel Data
GIS parcel information can assist in determining the location of GI practices by providing a visual representation of property boundaries.
Soil Infiltration Potential
Understanding the soil infiltration potential, or hydrologic soil groups, within the community is important for locating, and designing GI practices. Soils with the greatest infiltration potential, namely hydrologic soil groups A and B, are ideal opportunities for GI practices that will yield the greatest CSO volume reductions. Hydrologic soil group information can be found at www.websoilsurvey.nrcs.usda.gov.
Flood Prone Areas
Reduced flooding is a benefit easily recognized by the public and can be an important aspect of a GI program. Several factors can attribute to flooding, such as impervious surface coverage, topography, infrastructure capacity, and the characteristics of local waterways.
For example, the City of Hoboken, New Jersey, did an analysis to investigate flood prone areas (Figure 2-2). The analysis determined that sewershed interconnections (Figure 2-3) resulted in the identification of stormwater flows migrating between sewersheds during storm events that exceeded the sewer infrastructure capacity. The analysis of flood prone areas played a critical role in locating and prioritizing GI practices in the City of Hoboken.
Cautionary Note: Identifying the infiltration rates of soil in proposed GI locations is crucial to avoiding failed systems. Foregoing soil investigation can result in systems that have standing water longer than desired (this can lead to mosquito and human health concerns). Additionally, this can preclude the attainment of CSO reduction goals. If GI practices are installed in an area with less than ideal infiltration rates, they should be designed with an underdrain system to ensure that water can leave the system.
Evaluating GI: A CSO Control Alternative for LTCPs January 2018
Chapter 2 Locating and Assessing the Feasibility of GI Page 5
Figure 2-2: Analysis of Flood Prone Areas (Excerpt from the Hoboken GI Strategic Plan)
Figure 2-3: Interconnections of Sewersheds (Excerpt from the Hoboken GI Strategic Plan)
Evaluating GI: A CSO Control Alternative for LTCPs January 2018
Chapter 2 Locating and Assessing the Feasibility of GI Page 6
Existing Stormwater BMP Locations
Existing stormwater BMPs are important to include in a GIS analysis. Depending upon the type of BMP, they may have the potential for cost effective retrofits to increase BMP performance. Alternatively, they may be identified as sites to avoid, since they are already high-functioning BMPs. Either way, existing BMPs should be documented and included in the hydrologic and hydraulic modeling described in Step 4.
Municipal Facilities, Parks, and Rights-of-Way
Municipally owned properties, including facilities, parks, and right-of-ways, can provide excellent opportunities for retrofitting with GI practices as property transfer, easements, and maintenance agreements can be much simpler. Parks in particular have high public visibility which can help increase public awareness. In communities that have accepted NJDEP Green Acres Program funding, the Green Acres Program should be consulted early in the planning stage of any GI project to ensure the planned measures meet Green Acres requirements. While many GI projects are allowable on Green Acres restricted properties, some are not. Whether or not the property is Green Acres restricted, GI projects on parks and open spaces should be designed to respect, improve or supplement, and not replace, existing park facilities.
Vacant Parcels
Vacant properties and underutilized parcels can be prime locations for GI. However, soil reconditioning may be required for optimal GI performance, and must be considered in the design and implementation of GI on the site. The EPA guidance document entitled, “Evaluation of Urban Soils: Suitability for GI or Urban Agriculture” (EPA Publication Number 905R1103) discusses soil evaluation and reconditioning strategies. The document also discusses the potential need for communities to develop and implement contract/bid specifications for demolition work that leave these sites amenable to GI.
Contaminated Properties
GI practices that rely on infiltration may still be considered during the remediation and redevelopment of contaminated properties; however, it is important to have stormwater and remediation goals align. Careful site analysis and planning is necessary before implementing GI on contaminated properties, and must always be performed in consultation with the Licensed Site Remediation Professional (LSRP) or the NJDEP. For example, detailed analysis involving all parties may demonstrate that infiltration would accelerate pollutant mobilization towards the zone of influence of extraction wells used for groundwater remediation, and therefore could assist in expediting or enhancing remediation efforts. Or, if the remediation strategy is natural attenuation, all parties may agree that infiltrating stormwater without contamination may aid the process.
If it is determined that infiltration is not feasible at a particular site, practices that promote retention, filtration, evapotranspiration, or harvesting may be more appropriate. Examples include bioretention systems with an impermeable liner and an underdrain, green roofs, and cisterns.
For additional information, please see the EPA guidance document, “Implementing Stormwater Infiltration Practices at Vacant Parcels and Brownfield Sites” (EPA Publication Number 905F13001).
Evaluating GI: A CSO Control Alternative for LTCPs January 2018
Chapter 2 Locating and Assessing the Feasibility of GI Page 7
Locations of Planned Municipal Upgrades
Integrating GI practices into planned municipal projects such as Americans with Disabilities Act (ADA) improvements, streetscape improvements, or infrastructure upgrades (e.g. road and utility work) may be much more cost effective than building stand-alone GI projects. Please refer to the section entitled Integrating Green Infrastructure to Reduce Costs in Chapter 6: Cost Benefit Analysis Methodologies for more information.
Example GIS Analysis for Determining a Potential Site for Green Infrastructure Implementation
Figure 2-4 below is an example of a basic GIS analysis that considers the following parameters: high risk flood areas, municipally owned properties, impervious surfaces, and hydrologic soil groups to analyze the soil infiltration potential. The analysis yields at least one potential GI site at the location designated “A”. Site A is a municipally owned property with a large amount of impervious surface area to mitigate, that sits on hydrologic soils group A and B, which are indicative of high infiltration potential. Further, the site contains an existing stormwater BMP that can potentially be retrofitted to increase performance.
Evaluating GI: A CSO Control Alternative for LTCPs January 2018
Chapter 2 Locating and Assessing the Feasibility of GI Page 8
Figure 2-4: GIS Analysis for Determining a Potential Site for GI Implementation
Evaluating GI: A CSO Control Alternative for LTCPs January 2018
Chapter 2 Locating and Assessing the Feasibility of GI Page 9
A
Evaluating GI: A CSO Control Alternative for LTCPs January 2018
Chapter 2 Locating and Assessing the Feasibility of GI Page 10
Step 3: Identify Sites Meeting Green Infrastructure Practice Criteria
Using the GIS database compiled from Step 2, the next step is to identify sites that meet specific GI practice criteria. In order to do so, it is necessary to understand the uses of, and parameters governing, the array of GI tools.
Green Infrastructure Toolbox
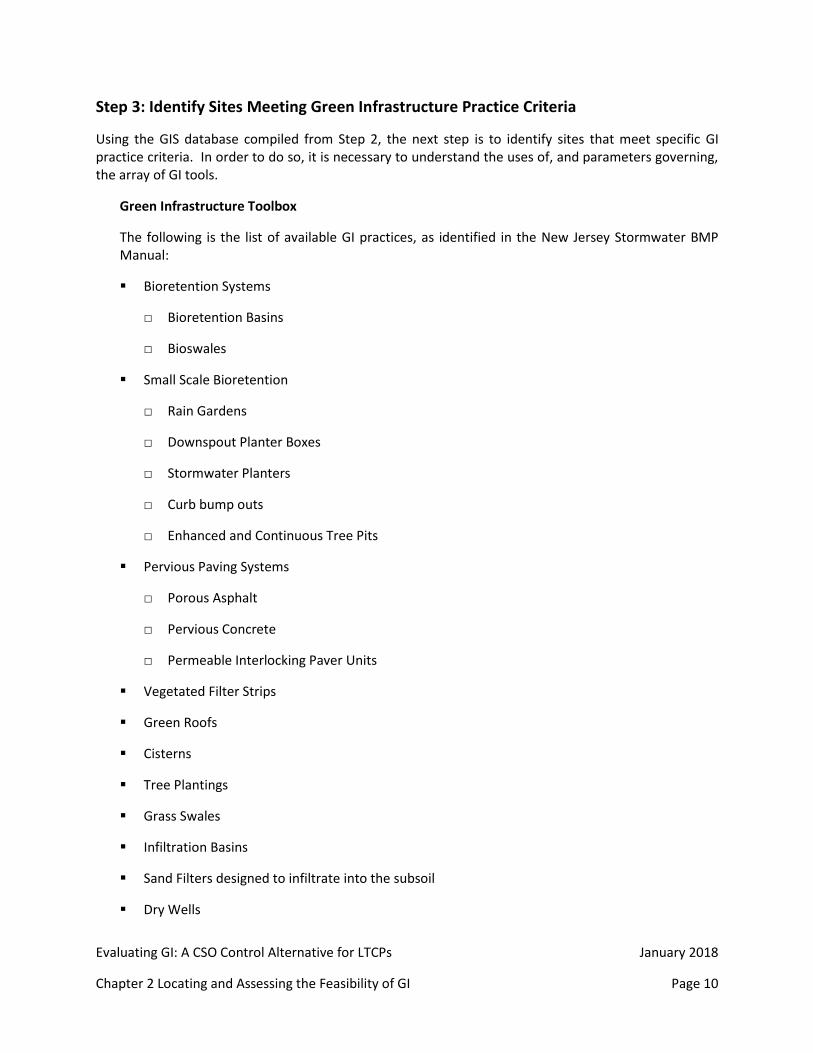
The following is the list of available GI practices, as identified in the New Jersey Stormwater BMP Manual:
▪ Bioretention Systems
□ Bioretention Basins
□ Bioswales
▪ Small Scale Bioretention
□ Rain Gardens
□ Downspout Planter Boxes
□ Stormwater Planters
□ Curb bump outs
□ Enhanced and Continuous Tree Pits
▪ Pervious Paving Systems
□ Porous Asphalt
□ Pervious Concrete
□ Permeable Interlocking Paver Units
▪ Vegetated Filter Strips
▪ Green Roofs
▪ Cisterns
▪ Tree Plantings
▪ Grass Swales
▪ Infiltration Basins
▪ Sand Filters designed to infiltrate into the subsoil
▪ Dry Wells
Evaluating GI: A CSO Control Alternative for LTCPs January 2018
Chapter 2 Locating and Assessing the Feasibility of GI Page 11
While all of these GI practices will have benefits in terms of both water quantity and quality, their characteristics and suitability for particular environments vary greatly. For example, infiltration practices can provide excellent runoff reduction, but can only be utilized in certain soil types. Whereas filtering practices do not require well-draining soils and provide less volume reduction benefit, they do retain and slowly release runoff which can still be of benefit to the system. The New Jersey Stormwater BMP Manual includes discussion on the benefits, requirements, and applications of each of the GI practices.
Among the variety of GI practices included in the GI toolbox, there are a few important overarching criteria to be considered when choosing an appropriate practice for a potential site.
▪ Infiltration practices must have a distance of at least 2-feet from the bottom elevation to the seasonal high water table (SHWT) or bedrock,
▪ Systems with underdrains, or water quality practices must have a distance of at least 1-foot from the bottom elevation to the SHWT or bedrock, and
▪ All practices except cisterns must have a maximum 72-hour drawdown time.
Enhanced GI
GI can be enhanced using additional engineering measures that will maximize the amount of stormwater captured and detained. This type of approach to GI provides additional storage in the form of stone, plastic media storage, underground arch concrete structures and/or stormwater chambers, or similar storage options. A series of perforated pipes can be utilized to distribute water throughout the system and provide a route for water to leave and be slowly released back to the sewer system if infiltration into subgrade soils is limited or not feasible. CSO communities are typically in urban areas with limited room for GI. Thus, it can be useful to make the most of each practice by maximizing volume storage while minimizing GI footprint. GI designed in this manner is often referred to as enhanced GI. Many GI practices listed above can be modified to be enhanced GI, such as:
▪ Rain Gardens
▪ Stormwater Planters
▪ Bioswales
▪ Tree Pits
▪ Pervious Paving Systems
▪ Infiltration Basins
▪ Sand Filters
The distributed storage should be designed to capture the desired volume based upon the following:
▪ Depth of storage typically limited to 4-feet from final surface or as available grade allows,
Evaluating GI: A CSO Control Alternative for LTCPs January 2018
Chapter 2 Locating and Assessing the Feasibility of GI Page 12
▪ Length and width of storage will vary per location; separate cells can be used to avoid utility conflicts (separate cells are typically within 30-feet from each other), and
▪ Loading ratios can be higher, depending on the goals. Ranges can be 15:1 to 30:1 when possible. Higher loading ratios than noted in Table 2-1 will require justification through engineering calculations.
Site Specific Work
Site specific investigation is required to determine which GI practice is appropriate for a particular site. Site specific work is performed using a focused desktop analysis, including an assessment of loading ratios, coupled with field reconnaissance and post field processing. Desktop analysis can be used to estimate issues such as the GI practices drainage area, and to size the practice using loading ratios. Field reconnaissance is used to verify items observed during desktop analysis and determine if any potential conflicts exist that could only be ascertained once in the field (e.g. utilities, undocumented stormwater structures, and possible sources of contamination).
Loading Ratios
The GI practice loading ratio is the directly connected impervious area that drains to the practice, divided by the footprint of the practice. The optimal function of infiltration or retention practices occurs when the runoff is dispersed as evenly as possible, and at as shallow a depth as possible, within the practice. As a common cause of GI practice failure is overloading runoff volume and pollutants (particularly sediment) into a small footprint, maximum loading ratios are utilized to determine the appropriate practice size.
Loading ratios are crucial to the successful design, performance, maintenance, and safe operation of GI practices. In general, the larger the practice loading ratio:
▪ the more often the practice will need to be maintained due to scour or sediment accumulation (surface practices with vegetation are easier to maintain than subsurface practices due to access),
▪ the deeper the surface ponding (the maximum allowable surface ponding for bioretention practices is 12 inches), and
▪ the longer the practice will take to drain the collected runoff (the maximum allowable drawdown time is 72 hours).
Green infrastructure installations that are associated with “major development”, as defined in the municipality’s stormwater control ordinance, the Residential Site Improvement Standards (RSIS) at N.J.A.C. 5:21 (if the GI is associated with a project subject to those standards), and/or the Stormwater Management rules at N.J.A.C. 7:8 (if the GI is associated with a project that requires a permit from the NJDEP Division of Land Use Regulation) should follow the design guidelines in the New Jersey Stormwater BMP Manual. The New Jersey Stormwater BMP Manual contains design and guidelines that, when followed, result in stormwater BMPs that are presumed to be able to meet the requirements contained in local stormwater control ordinances, the RSIS, and the Stormwater Management rules. The New Jersey Stormwater BMP Manual does not specifically recommend maximum loading ratios for most GI practices, however, maximum loading ratios can be
Evaluating GI: A CSO Control Alternative for LTCPs January 2018
Chapter 2 Locating and Assessing the Feasibility of GI Page 13
back-calculated from other requirements, such as maximum ponding depths. For example, bioretention basins that are designed to infiltrate typically have a loading ratio of about 12:1, while infiltration basins typically have a loading ratio of about 24:1, and pervious paving systems have a limit of 4:1, when designed for the NJDEP Water Quality Design Storm (WQDS) of 1.25 inches of rainfall. Note that a loading ratio for a GI practice that will infiltrate back-calculated using the maximum ponding depth will vary depending on infiltration rate through the practice. Practices in areas with low infiltration rates will require larger GI practice surface area to maintain the same ponding depth when compared to an equivalent GI practice in an area with higher infiltration rates. Thus, GI practices with lower infiltration rates will have lower loading ratios. While there are no required loading rates for GI practices within this document, please be advised that loading ratios back-calculated from the guidelines in the New Jersey Stormwater BMP Manual are recommended maximums, unless justification is presented to support higher loading ratios. Please see the chart below showing maximum recommended loading ratios back-calculated from the New Jersey Stormwater BMP Manual.
Table 2-1: Recommended Loading Ratios for Infiltration into Subgrade
GI Practice
Typical Loading Ratio
(SF of Area Managed to SF of GI Practice)
Bioretention Basins 12.0 – 22.0
Rain Gardens 12.0 – 22.0
Downspout Planter Boxes 12.0 – 22.0
Stormwater Planters 12.0 – 22.0
Bioswales 9.0 – 20.0
Enhanced Tree Pits 12.0 – 22.0
Permeable Asphalt 4.0
Pervious concrete 4.0
Permeable Interlocking Paver Units
4.0
Vegetated Filter Strips 4.0
Green Roofs 1.0
Cisterns N/A
Grass Swales N/A
Infiltration Basins 24.0 – 37.0
Sand Filters 24.0 – 27.0
Dry Wells N/A
Evaluating GI: A CSO Control Alternative for LTCPs January 2018
Chapter 2 Locating and Assessing the Feasibility of GI Page 14
Field Reconnaissance
Field reconnaissance may follow desktop analysis to verify key issues that influence GI implementation and design. The level of detail involved in field reconnaissance will be dependent on the area being evaluated and the extent of potential GI proposed. It is recommended that a thorough field evaluation be completed for initial pilot projects and in cases where it is feasible to review several sites as part of the planning process. However, it may not be feasible to complete detailed field evaluation in early stages of planning for all sites; in this case, evaluation can be completed in the planning process.
The following are a few key recommendations to assist in the preliminary field reconnaissance process:
▪ Use or develop standardized forms for field staff to consolidate information into one format and ensure that all necessary data is collected at each site.
▪ Determine that location allows for capture of stormwater based on visual inspection of topography.
▪ Identify potential utility locations in the field via visual inspection.
▪ Identify all other constraints that could affect the feasibility of the GI practice, including land uses, permitting requirements, community impacts, etc.
The following are recommendations to assist in the field reconnaissance process once basic field information above has been gathered and potential sites have been identified:
▪ Determine the best location for each proposed practice and verify the drainage area obtained from desktop analysis. Document the location and drainage area of each practice once field work is complete.
▪ Take photographs of each potential GI location.
▪ Ensure that there is sufficient depth for practices that require an underdrain.
▪ Perform borings and infiltration testing of native soils.
For further information to assist in the field reconnaissance and site evaluation process see the Center for Watershed Protection’s “Urban Stormwater Retrofit Practices” Chapter 4: The Search For Storage – Finding Retrofit Opportunities at the Subwatershed Level.
With the information obtained from the desktop analysis, the GI practice size as estimated from the appropriate loading ratio, and the crucial information field verified, the next step is to consolidate and process this information. The potential GI practices can be included in the GIS database and the key parameters governing its function should be formatted for efficient input into the hydrologic
Evaluating GI: A CSO Control Alternative for LTCPs January 2018
Chapter 2 Locating and Assessing the Feasibility of GI Page 15
and hydraulic model used in Step 4. The parameters may vary depending upon the model used.
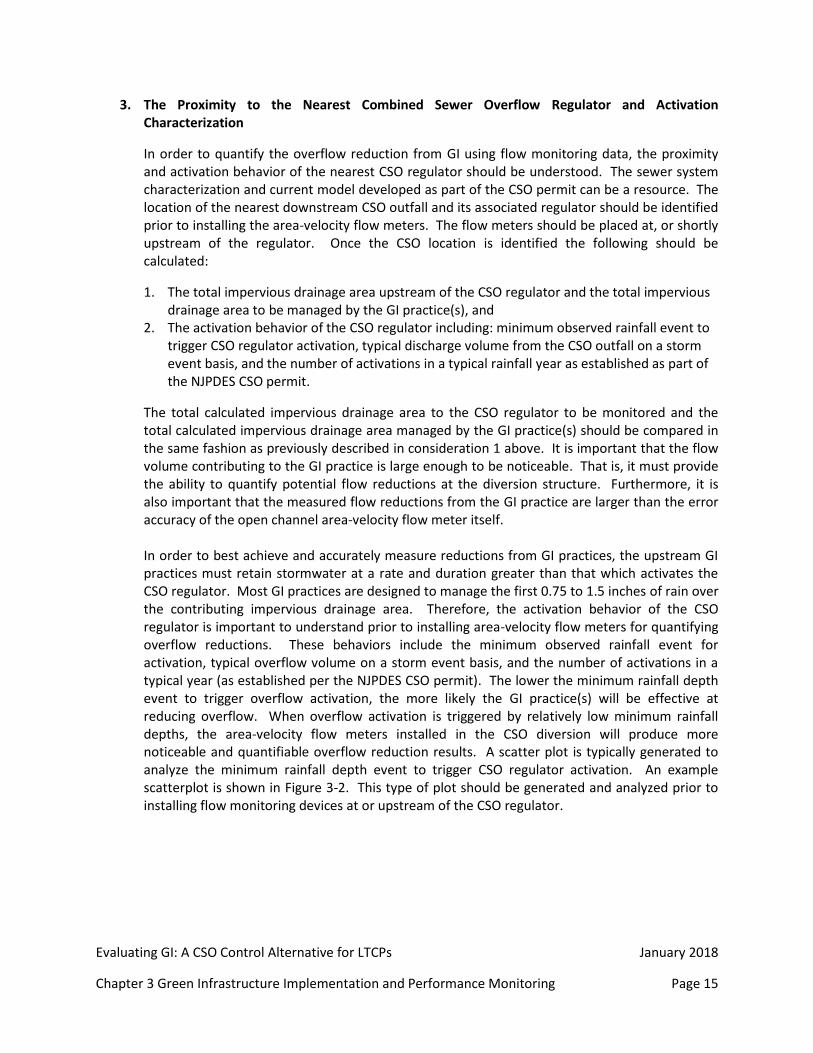
Step 4: Hydrologic and Hydraulic Modeling
With the inclusion of the proposed GI practices in the GIS database, and the field verified GI practice parameters organized in a concise format, the next step is to perform hydrologic and hydraulic modeling. The purpose of the modeling effort is to calculate not only both the individual effects of the proposed GI practices in terms of volume reduction and retention, but also the combined effects of the GI practices on the CSS. This section covers three tools as examples that can assist with hydrologic and hydraulic modeling for GI practices. Arc Hydro can help identify GI locations and organize GIS information for ease of use with other models. SWMM and Infoworks are two other models commonly used to evaluate and model GI practices in CSSs.
Arc Hydro
GIS Database Organization for Water Resource Models
Arc Hydro is a GIS data structure that standardizes hydrologic datasets for efficient integration into water resource models. Arc Hydro tools can generate and populate a geodatabase from vector and raster data sources, establish relationships between core spatial layers, and use an XML data exchange framework for data integration with external models. Recommended GIS layers for Arc Hydro evaluation include: parcel layers, sewer pipe infrastructure and manholes, impervious surface coverage, and the sewershed boundaries.
Catchment Delineation
Arc Hydro can also perform advanced water resource functions such as catchment delineation and land-use characterization to assist in determining optimum location of GI sites based on stormwater runoff volume capture potential. Using Arc Hydro, the drainage area to each stormwater inlet can be delineated by incorporating a digital elevation model with GIS layers such as sewershed boundaries, impervious surface coverage, and inlet locations. The inlets and drainage areas can then be ranked from highest to lowest based on the contributing impervious and pervious drainage area statistics.
Based on the contributing drainage area results for each inlet and Arc Hydro drainage area, the highest ranking stormwater volume locations can be identified and serve as an excellent planning level assessment to further investigate the potential for GI installation. The GI locations would then be incorporated into a hydrologic and hydraulic sewer system model to determine resultant CSO reduction benefits. An example of ranking stormwater inlets and Arc Hydro areas for a study in the City of Pittsburgh using contributing impervious drainage area is shown in Figure 2-5.
Evaluating GI: A CSO Control Alternative for LTCPs January 2018
Chapter 2 Locating and Assessing the Feasibility of GI Page 16
Figure 2-5: Highest Ranking Delineated Arc Hydro Inlet Areas Based on Tributary Impervious Area in an Example Sewershed in the City of Pittsburgh
SWMM
A widely used method for modeling hydrologic systems is the U.S. EPA’s Storm Water Management Model (SWMM). SWMM is a dynamic rainfall-runoff simulation model that can be used for both single-event and long-term simulation of surface and subsurface hydrology. In 2009, the USEPA updated SWMM with GI practices (referred to as Low Impact Development (LID) controls in the model) such as bioretention cells, infiltration trenches, porous pavements, rain barrels, and vegetated swales. The LID Control Editor, as shown in Figure 2-6, provides adjustable parameters to allow for more accurate simulation of site specific characteristics. The model and LID controls estimate the reduction in runoff volume, analyze the timing and peak flow attenuation of the stormwater flows into the CSS, and determine the ultimate effects on the CSO volume and frequency.
Evaluating GI: A CSO Control Alternative for LTCPs January 2018
Chapter 2 Locating and Assessing the Feasibility of GI Page 17
Figure 2-6: User interface in SWMM 5 Showing the Bio-Retention LID Control with the Adjustable Parameters (EPA SWMM V. 5.1)
The calculations and algorithms used in EPA SWMM have been incorporated into many third party private software packages including PCSWMM, InfoSWMM, and XPSWMM. These programs incorporate other features such as GIS, 2D surface modeling, and real-time simulation capabilities with the base SWMM calculation engine to allow for multifaceted analytical models.
Infoworks
Another commonly used hydrologic and hydraulic modeling package is Infoworks. With the release of Infoworks ICM, the model now includes the same LID Control components that are included in EPA SWMM. The design of these structures can be specified and then the number and type of each Sustainable Urban Drainage System (SUDS)/LID control structure can be specified on a sewershed by sewershedbasis. Infoworks ICM includes the Sustainable Urban Drainage System (SUDS) elements from the previous version (InfoWorks CS) which can also be used to simulate GI. SUDS controls are represented by a combination of vertical layers whose properties are defined on a per-unit-area basis. Using parameters such as the surface layer, soil layer, storage layer, underdrain system, and the infiltration coefficients, Infoworks ICM calculates the system performance and determines the infiltration losses from GI practices.
Evaluating GI: A CSO Control Alternative for LTCPs January 2018
Chapter 2 Locating and Assessing the Feasibility of GI Page 18
Step 5: Apply a Site Scoring System that Incorporates Community Considerations
Once potential GI practices have been determined from Steps 2 and 3, and modeled for volume/pollutant reduction in Step 4, the final step is to develop and apply a project scoring system. The scoring system can assist communities by prioritizing projects according to community-specific needs and values. While each scoring system may be different based on local values, the following are examples of common factors considered in a scoring system:
▪ Cost per runoff volume managed,
▪ CSO reduction potential,
▪ Feedback from public outreach and coordination,
▪ Flood/sewer back-up alleviation,
▪ Public visibility,
▪ Public amenity value (e.g. extending greenways with public trail systems),
▪ Environmental justice considerations raised during the public participation process,
▪ Catchment properties (tributary catchment slope, depth to groundwater and bedrock),
▪ Available open space or vacant land that can be used for GI construction,
▪ Localized underlying soils data for identifying high potential infiltration locations,
▪ Consistency with local planning,
▪ Ease of implementation,
▪ Available funding opportunities,
▪ Proximity to other planned infrastructure and utility projects (e.g., road reconstruction) and cost sharing,
▪ Partnership opportunities with private entities, and
▪ Potential for local triple bottom line benefits (e.g. localized social and economic uplift).
The project ranking system may be basic or complex, qualitative and/or quantitative. If multiple factors are considered, the ranking system may employ a “weighting system” that seeks to prioritize certain factors above others and be informed through the public participation process. The weighting system is an opportunity for the community to prioritize issues of importance as they choose. For example, a community may be most concerned about the cost per runoff volume managed, but also seek to actively add public amenity value for all of the projects considered. Therefore, the community may provide the highest multiplier in the weighted equation to cost per runoff volume managed, and provide the second highest to projects that add public amenity value.
Evaluating GI: A CSO Control Alternative for LTCPs January 2018
Chapter 2 Locating and Assessing the Feasibility of GI Page 19
Case Studies in Locating and Assessing the Feasibility of Green Infrastructure
The following case studies from across the United States highlight successful elements of GI feasibility assessment.
City of Hoboken, New Jersey
In 2013, the City of Hoboken created the Hoboken GI Strategic Plan. The City performed an analysis based on impervious area, topography, depth of soils to restrictive features, and areas of known flooding. The analysis yielded three distinct zones within the City (Figure 2-7):
▪ Gray Zone – contains conditions that do not favor infiltration, and therefore above ground solutions such as cisterns and green roofs were recommended,
▪ Green Zone – contains conditions favorable for infiltration allowing for solutions such as rain gardens, swales, trees, etc., and
▪ Blue Zone – contains the low lying area of the City best suited for detention.
Further analysis of the flood prone areas of the City determined that there are sewershed interconnections that contributed greatly to the identified flooding problems. The City sought to reduce flooding and to prioritize flooding projects by examining critical assets such as emergency response facilities, hospitals, schools, and key transit routes.
Evaluating GI: A CSO Control Alternative for LTCPs January 2018
Chapter 2 Locating and Assessing the Feasibility of GI Page 20
Figure 2-7: Three Distinct GI Zones within the City of Hoboken (Excerpt from the Hoboken GI Strategic Plan)
Project Prioritization Case Study: Northeast Ohio Regional Sewer District (NEORSD)
With a goal of reducing its CSO volume by 44 million gallons, NEORSD decided to focus its GI implementation only in areas with high CSO overflow volumes. However, NEORSD also wanted to prioritize projects where land ownership was amenable to GI installation and in areas where GI could provide socioeconomic benefits (e.g. low income housing and environmental justice areas). To rate projects based on these goals, a GI Index scoring system was created using a two-pronged analysis:
1. A Baseline Index which rates projects on opportunity, space, and potential effectiveness using the following parameters:
▪ Available land ▪ Development Opportunities ▪ Greenways (existing open spaces) ▪ Imperviousness ▪ Parks > 3 Acres ▪ Partnership Opportunities – Large privately owned parcels, campuses of hospitals and
Evaluating GI: A CSO Control Alternative for LTCPs January 2018
Chapter 2 Locating and Assessing the Feasibility of GI Page 21
2. A Target Index which rates projects based on potential volume reduction towards their 44 million-gallon goal in drainages areas that lead to CSOs with high residual overflow volume. Volume reduction was determined based partially on an analysis of hydraulic responsiveness and directly connected impervious area.
The Baseline and Target Indexes were both based on a 10-point scale, and the points were added together for a total potential score of 20 points. Using this methodology, NEORSD determined 38 GI priority areas and developed a conceptual level design with cost estimation for each GI priority area. https://www.neorsd.org/I_Library.php?a=download_file&LIBRARY_RECORD_ID=5526
City of Lancaster, Pennsylvania
The City of Lancaster’s GI Plan describes the selection process for the installation of 20 initial demonstration projects. The process targeted City owned properties such as parks, parking lots, and streets for cost-effective and timely implementation. The City will use the projects to gather location- specific feasibility, cost, and performance data to apply toward long term implementation. The demonstration projects often contain multiple GI practices. For example, one park is designed to incorporate a porous asphalt play court, a bioretention system, a pervious concrete sidewalk, and a bioretention tree trench system. Green street retrofits are also proposed where the City targeted the nearly 20 blocks of streets that required ADA ramp upgrades or general repair. The City determined that when incorporating GI into projects from the beginning of the planning phases, or into already planned but not built projects, GI implementation can be much more cost effective. Based on the estimated volume and pollutant reductions from the initial demonstration projects, the City of Lancaster created a conceptual 5-year implementation scenario and a long-term 25-year implementation scenario. The City of Lancaster will use the cost and performance data from the initial demonstration projects to continually refine the 5-year and 25-year scenarios.
The City and County of San Francisco determined that the baseline CSO volume for the typical rainfall year was 1,470 million gallons. GI practices that were applicable for the City and County of San Francisco were chosen, such as green roofs, bioretention, street tree, permeable paving systems, roof rainwater harvesting, and stream daylighting and diversion. Siting constraints were then developed for each practice. For example, bioretention constraints were defined as slope, soils, depth to bedrock, and depth to the water table. Permeable paving systems were subject to the same constraints but also considered vehicle weight, traffic volume, access for disabled persons, and sediment/pollutant load. GIS analysis was used to create an infiltration zone map that demonstrated there was very low infiltration potential in San Francisco, and no opportunities for stream daylighting when compared to the site constraints defined for each GI practice. Therefore, GI designs that did not rely on infiltration (for example, green roofs, street trees, roof disconnection, lined bioretention systems, and lined
Evaluating GI: A CSO Control Alternative for LTCPs January 2018
Chapter 2 Locating and Assessing the Feasibility of GI Page 22
permeable paving systems) were selected to be modeled using the software InfoWorks. A 30-year target and a long-term ultimate target were established. Each target contained implementation goals for each of the modeled GI practices. For example, the 30-year target contained a goal of 5% of the maximum potential green roof area to be established with green roofs. http://sfwater.org/index.aspx?page=614
Case Studies in Public Support, Outreach, and Coordination
Public awareness of the negative impacts of combined sewer overflows, as well as the positive “stackable” benefits of GI, is crucial to the success of GI implementation. The results from public engagement can be used to score and prioritize projects during Step 5 of the example process, entitled “Apply a Site Scoring System that Incorporates Community Considerations.” Coordination with both external and internal agencies can greatly assist to align GI program efforts within communities. Internal partner agencies, such as the public works and parks department, should be engaged as early in the GI development process as possible. The institutional knowledge and skill sets of these internal agencies can provide for much more cost effective GI planning and implementation. Further internal groups or committees can be engaged or created with the goals of amending community ordinances, revising stormwater design standards, creating informational materials, and developing a website.
The following information presents summaries of case studies that provide examples of public outreach programs that were utilized in assessing locations of GI sites.
Northern Kentucky Sanitation District No. 1 (SD1)
SD1 developed a robust community outreach and education program. From the start of its wet weather programs, SD1 designed and built a Public Service Park that educates children and adults on the journey of a drop of water. SD1 partnered with the local school districts to develop school curriculum for 4th through 6th grades that incorporated the Public Service Park and various stormwater lessons. As part of the Watershed Plans Development, SD1’s public participation program was focused on educating stakeholders on the issues facing Northern Kentucky to ensure that the Watershed Plans reflected the goals and concerns of the community and it obtained input and feedback on the proposed approach for improving Northern Kentucky’s waterways. The watershed-based approach presented a unique opportunity to educate the public on larger water quality issues (beyond sewer overflows) and focus on the relationships between different pollution sources, environmental impacts of pollution, and the cost-effectiveness of controls to address the various sources. Primary components of SD1’s community engagement and education program included:
▪ Watershed Summit – At the start of the Watershed Plans Development, SD1 hosted a summit inviting all of Northern Kentucky’s stakeholder groups including the conservation districts, EPA, and the Sierra Club to engage in the development of the Watershed Plans.
▪ Watershed Community Council – The purpose of the Council was to share information and help facilitate open, thoughtful discussion on the watershed planning process throughout the development of the Watershed Plans. The Council was comprised of 53 members from a
Evaluating GI: A CSO Control Alternative for LTCPs January 2018
Chapter 2 Locating and Assessing the Feasibility of GI Page 23
diverse group of stakeholders, including environmental organizations, home builders, the development community, local government and citizens. SD1 also established an online blog to provide an opportunity for discussions between the meetings and solicit feedback.
▪ Community Values Survey – SD1 conducted a Community Values Survey to provide input during the development of the Watershed Plans. The survey assessed community values, local environmental values, the importance of specific project criteria, and the willingness to pay for upgrades to the sanitary sewer system.
▪ Innovative Stormwater Design Workshop – SD1 hosted an Innovative Storm Water Design Workshop, which involved a series of public meetings to discuss how GI approaches could be utilized in Northern Kentucky to protect water resources. The focus of the workshop was reducing storm water runoff to help mitigate CSOs. Public workshops, roundtable discussions with key constituent groups and individual stakeholder interviews were held to gather input on issues relating to GI, water resource protection, storm water management, combined sewer overflows, growth and development and quality of life in Northern Kentucky.
▪ Regular presentations at community council and mayor’s meetings – SD1 was focused on developing Watershed Plans that would provide local community benefits. To achieve this goal, SD1 became a fixture in the Northern Kentucky community presenting and discussing whenever possible to educate the public and local leaders on their mission and how source controls using GI through a holistic approach could maximize improvement to Northern Kentucky’s waterways.
Metropolitan Sewer District of Greater Cincinnati (MSDGC)
In support of the public outreach program, MSDGC pursued four distinct approaches to engage, educate and solicit feedback from interested parties:
▪ Steering Committee – This committee was composed of representatives from organizations throughout the community and was convened on eight occasions.
▪ Public education – A meeting was held at which MSDGC presented general information to attendees.
▪ Public comment - Open houses were held on two (2) occasions which focused not only on providing more specific details by watershed, but also on collecting feedback from attendees.
▪ Design Workshops – A series of design workshops were held with the local community members for the Revised Original Lower Mill Creek Partial Remedy project to present the project components and solicit feedback on certain design elements.
Evaluating GI: A CSO Control Alternative for LTCPs January 2018
Chapter 3 Green Infrastructure Implementation and Performance Monitoring Page 1
3 GREEN INFRASTRUCTURE IMPLEMENTATION AND
PERFORMANCE MONITORING Overview
This chapter discusses the importance of performance monitoring with respect to green infrastructure (GI) implementation. While not specifically required by the CSO permit, performance monitoring is integral to assessing whether or not GI practices are performing as designed and understanding how information gained can be applied on a larger scale. This chapter outlines the development of performance criteria, performance monitoring at the site scale, monitoring and adjustments to hydraulic models, pilot projects, and adaptive management. Finally, this chapter describes community engagement and education for performance monitoring and provides case studies.
Development of Performance Criteria
Performance criteria should be identified to adequately evaluate GI, select design parameters, guide initial design efforts, and determine its effectiveness. Factors affecting performance include: impervious areas managed, storm size managed, infiltration rates, storage volume, detention slow release, detention overflow control, loading ratio, ponding depth, depth to groundwater / bedrock, material / soil / stone standards and vegetation. These criteria can be modified later as part of an adaptive management program. A description of each of these suggested performance criteria is as follows:
Impervious Area Managed
The first step when designing a GI practice is to understand the amount of stormwater that it will manage. To determine this, the contributing drainage area and the impervious portion of the drainage area should be determined. In general, GI practices will be placed at topographic low points to the contributing impervious area; however, it is also possible to hydraulically connect impervious areas to a GI site with pipes and catch basins.
Storm Size Managed
Establishing a target design storm that will be managed by GI is important for identifying minimum design standards required to properly size a GI practice. The New Jersey Stormwater Best Management Practices (BMP) Manual sets forth design practices to capture the NJDEP Water Quality Design Storm (WQDS), which is defined as 1.25 inches of rain over a two-hour period. Capturing the NJDEP WQDS would equate to managing approximately 90% of the rain events in New Jersey during an average year. An estimate of the total volume the GI practice should be able to store can be determined using the design storm rainfall depth. Peak rainfall intensities can be used to determine the size of the conveyance requirements of the system. For example, inlets, catch basins, and pipes that may lead into the GI practice should all be sized to convey these peak flows without causing backups or bypass of the GI practice.
Evaluating GI: A CSO Control Alternative for LTCPs January 2018
Chapter 3 Green Infrastructure Implementation and Performance Monitoring Page 2
The target precipitation managed will be dependent on local precipitation patterns and characteristics of the sewer system. Please review the following examples on calculating total runoff volume and peak runoff flow rate.
▪ Example Total Runoff Volume Calculation:
□ Using the NJDEP WQDS as an example, the total Depth of Rainfall would be 1.25 inches.
□ The runoff depth (which is always less than rainfall depth) can be calculated using the
procedure outlined in Part 630 Chapter 10 of the National Engineering Handbook, as shown
here.
𝑄 = (𝑃 − 0.2𝑆)2
(𝑃 + 0.8𝑆) , where 𝑄 = runoff depth,
𝑃 = rainfall depth and
𝑆 = maximum retention.
𝑆 = 1000
𝐶𝑁 − 10, where CN = Runoff Curve Number, which is 98 for impervious surfaces.
Runoff curve numbers for other surfaces can be found in many widely available resources, such as Part 630 Chapter 9 of the National Engineering Handbook.
Inserting the known values in the equations will yield:
𝑆 = 1000
𝐶𝑁 − 10 =
1000
98 − 10 = 0.204 𝑖𝑛𝑐ℎ𝑒𝑠
𝑄 = (𝑃 − 0.2𝑆)2
(𝑃 + 0.8𝑆) =
(1.25 − 0.2 ∗ 0.204)2
(1.25 + 0.8 ∗ 0.204) = 1.03 𝑖𝑛𝑐ℎ𝑒𝑠
Managed (cf) = 𝑅𝑢𝑛𝑜𝑓𝑓 𝐷𝑒𝑝𝑡ℎ (𝑖𝑛)
12 𝑖𝑛
𝑓𝑡
∗ 𝐼𝑚𝑝𝑒𝑟𝑣𝑖𝑜𝑢𝑠 𝐴𝑟𝑒𝑎 𝑀𝑎𝑛𝑎𝑔𝑒𝑑 (𝑠𝑓)
= 1.03 (𝑖𝑛)
12 𝑖𝑛
𝑓𝑡
∗ 𝐼𝑚𝑝𝑒𝑟𝑣𝑖𝑜𝑢𝑠 𝐴𝑟𝑒𝑎 𝑀𝑎𝑛𝑎𝑔𝑒𝑑 (𝑠𝑓)
Total Volume
Evaluating GI: A CSO Control Alternative for LTCPs January 2018
Chapter 3 Green Infrastructure Implementation and Performance Monitoring Page 3
Example Peak Runoff Rate Calculation:
□ Peak flow rates to inlets are typically calculated using the Rational Method as:
□ Using the NJDEP WQDS as an example storm,
The Runoff Coefficient (also known as C) for the rational method can be found in numerous references. For impervious surface, a value between 0.95 and 0.99 is generally used.
The peak rainfall intensity can be obtained from intensity-duration-frequency (IDF) curves, which are available through the National Oceanic and Atmospheric Administration’s National Weather Service. The procedure to obtain those curves from the NOAA website is outlined following this example. The intensity-duration curve for the NJDEP WQDS is available in Chapter 5 of the New Jersey Stormwater BMP Manual. The peak rainfall intensity taken from the curve should be for the storm duration that is equal to the time of concentration (often referred to as Tc) for the impervious area managed by the GI practice. The minimum time of concentration that can be used with the Rational Method is 10 minutes, and for most small impervious areas a calculated time of concentration will be less than 10 minutes, resulting in using the minimum time of concentration of 10 minutes for selecting the peak rainfall intensity from the IDF curve. However, for larger areas the time of concentration can be calculated following the procedure in Chapter 3 of National Resource Conservation Service’s (NRCS) Technical Release 55 (TR-55), or using stormwater modeling software. Free software capable of performing this calculation, called WinTR-55, is available through the NRCS.
□ Example Storm = NJDEP WQDS
Assuming the impervious area managed is relatively small, the minimum time of concentration of 10 minutes would be used to determine the peak intensity. Using the intensity-duration curve in Chapter 5 of the New Jersey Stormwater BMP Manual, the peak rainfall intensity is determined to be 3.2 inches/hour.
Conservatively assuming a runoff coefficient of 0.99 for the impervious area to be managed, the values can be substituted into the equation above to yield:
Impervious Area Managed
Impervious Area Managed (acres)
Peak Design Flow Rate (cfs)
Rational Method Runoff Coefficient
Peak Rainfall Intensity (in/hr) * = *
* Impervious Area Managed (acres)
Peak Design Flow Rate (cfs)
0.99 3.2 (in/hr) = *
= 3.17 *
Evaluating GI: A CSO Control Alternative for LTCPs January 2018
Chapter 3 Green Infrastructure Implementation and Performance Monitoring Page 4
Determining Rainfall Depth and Intensity for Other Storm Events
The National Oceanic and Atmospheric Administration’s (NOAA) National Weather Service Precipitation Data Server (PDS) provides data for both precipitation depth and intensity. Figure 3-1 shows an example precipitation intensity curve retrieved from NOAA’s National Weather Service for Trenton, NJ:
Figure 3-1: Rainfall Intensity-Duration-Frequency Curves for Trenton NJ
Source: hdsc.nws.noaa.gov
PDS-based intensity-duration-frequency (IDF) curves and precipitation depth information can be obtained for any location in NJ by visiting the following website: http://hdsc.nws.noaa.gov/hdsc/pfds/
Choose NJ from the map, then the following outlines how to retrieve the information for your site:
Step 1: Select Data Type and Station Location
Choose either precipitation depth or rainfall intensity for data type. Use one of the three available methods to determine the nearest station location.
Evaluating GI: A CSO Control Alternative for LTCPs January 2018
Chapter 3 Green Infrastructure Implementation and Performance Monitoring Page 5
Step 2: Select Method to View Information
The data can be displayed in graphical form, which is how to obtain the IDF curve if you are obtaining precipitation intensity data, or displayed in tabular form, which is often the easiest way to view rainfall depth data. Select the appropriate tab from the top to view the data in the desired form.
Infiltration Rates
Infiltration of stormwater within a GI practice is an effective approach to reducing stormwater entering
Evaluating GI: A CSO Control Alternative for LTCPs January 2018
Chapter 3 Green Infrastructure Implementation and Performance Monitoring Page 6
the sewer system since flow is discharged to the groundwater instead of the sewer system, thereby reducing both the volume and, potentially, the number of overflows. The following recommendations can be used to determine the ability of the site to infiltrate as described in Appendix E: Soil Testing Criteria in the New Jersey Stormwater BMP Manual:
▪ A safety factor of two (2) is recommended to be applied to the lowest measured permeability rate when determining a design infiltration rate.
▪ The maximum recommended design infiltration rate is 10 in/hr, even if testing produced higher rates.
▪ The minimum recommended design infiltration rate is 0.5 in/hr (i.e. a minimum measured permeability rate of 1.0 in/hr with a safety factor of 2).
Additionally, the potential effects of groundwater mounding should be considered, as a groundwater mound can cause reduced infiltration rates as it approaches the bottom of a GI practice.
In cases where native soils between the bottom of the GI practice and the groundwater do not meet the minimum infiltration rates, soil replacement can be considered. If soil replacement is proposed, the soil layer not meeting the minimum infiltration rate should be entirely excavated and replaced with more permeable soil. Where infiltration is not possible, the GI practice can be designed for subsurface storage and detainment. GI practices for detainment are designed with underdrain systems that slowly release the water back into the sewer system. While this will not achieve the same volume reductions as infiltration, detention can still provide CSO reductions by allowing time for downstream sewer systems to regain capacity. If infiltration rates are determined to be excessively high (greater than 20 in/hr), further investigation should be considered to ensure the infiltrated water is not draining into an underground structure such as an adjacent building or back into the sewer system through a building lateral or mainline sewer.
If infiltration is used, the estimated total storage volume calculated in accordance with the procedure on page 2 can be refined using hydrologic modeling to account for the volume of stormwater that will infiltrate during the design storm.
Storage Volume
The storage of the system is the volume of water the practice can hold. This is a combination of the ponding area volume plus the effective porosity of the subsurface storage (stone, media, etc.) and soils.
Since CSO communities are typically in urban areas with limited room for GI, it may be useful to utilize enhanced GI to maximize storage volume. Refer to the Enhanced GI discussion beginning on page 10 of Chapter 2 for more information.
Evaluating GI: A CSO Control Alternative for LTCPs January 2018
Chapter 3 Green Infrastructure Implementation and Performance Monitoring Page 7
Detention Slow Release
Water detained within a GI practice should be designed to draw down using a slow release system within 48 to 72 hours to avoid public health concerns. The release rate should also consider a minimum duration for detention in order to reduce the peak flows entering the combined sewer system and potentially reduce overflows. A slow release orifice can be used to achieve the desired draw down time.
Determining the optimal release rate for the system depends on the flow conditions of the sewer system receiving the released flow. Hydraulic and hydrologic modeling of the sewer system can help determine acceptable release rates for a particular detention system.
Detention Overflow Control
During larger rain events, the GI practices can overflow so it is important to consider how the system will respond. In many cases, a GI practice will overflow back into the sewer system. The main design concern is to ensure the practice does not restrict flow, resulting in flooding of the practice or nearby streets. The GI practice should be designed to allow flows from larger storm events to bypass the practice and flow into the sewer system. This can be done using control measures such as overflow structures or spillways that allow the system to function for stormwater control during smaller rain events while not restricting flows during larger events. Careful attention should be taken during construction to ensure that overflows are installed at the correct elevation. An overflow installed lower than designed can result in design storms bypassing the system, thereby reducing performance. The New Jersey Stormwater BMP Manual provides design guidance for overflow control structures for different GI practices.
Loading Ratio
The hydraulic loading ratio of an infiltration based GI practice is an important factor to consider to ensure consistent infiltration over the practice’s lifetime. In general, the loading ratio relates the size of the infiltration area in the practice to the runoff area of the drainage area it receives. Total infiltration will be higher when spread out over a larger surface area. Additionally, having a larger infiltration area reduces the risk of clogging the pores of the native soil which can reduce the infiltration rates of the system over time. Refer to the section on loading ratios in Chapter 2 for more information on typical loading ratios for GI practices.
𝐿𝑜𝑎𝑑𝑖𝑛𝑔 𝑅𝑎𝑡𝑖𝑜 =𝐶𝑎𝑡𝑐ℎ𝑚𝑒𝑛𝑡 𝐴𝑟𝑒𝑎 (𝑠𝑓)
𝐼𝑛𝑓𝑖𝑙𝑡𝑟𝑎𝑡𝑖𝑜𝑛 𝐴𝑟𝑒𝑎 (𝑠𝑓)
Ponding Depth
The ponding depth provides an opportunity to store stormwater, however, excessive depths can create hazards to pedestrians. Typically, GI practices that are located where pedestrians are present should have ponding depths in the range of approximately 2-inches to 6-inches. When a practice has a ponding zone in a pedestrian area, a guard or fence should be installed around the perimeter of the practice for fall protection. Practices that are located in remote locations where there is no hazard to the public can be deeper. Refer to the New Jersey Stormwater BMP Manual for ponding depth ranges for different practices. Embankment slopes in the GI practice should not exceed a 3:1 slope.
Evaluating GI: A CSO Control Alternative for LTCPs January 2018
Chapter 3 Green Infrastructure Implementation and Performance Monitoring Page 8
Depth to Groundwater / Bedrock
Infiltration based GI will not function well if groundwater levels are high. GI practices that are designed to infiltrate into the subsoil should have a 2-foot minimum separation from the seasonal high water table. Practices designed with an underdrain should have a 1-foot minimum separation. Additionally, bedrock in close proximity to the base of GI practices can often result in poor infiltration rates. Soil exploration should be performed at each potential GI site to assess these factors.
Material / Soil / Stone Standards
It is important to ensure that materials used in construction of a GI practice meet all the hydrologic and hydraulic design specifications. Consideration of criteria such as the conductivity of various sands, soils, and stone is important to ensure that the design storage and infiltration rates are maintained. The New Jersey Stormwater BMP Manual provides more detail on materials to be used in GI practices.
Vegetation
Vegetation chosen for GI should be native to the state of New Jersey. Planting non-native species can result in one type of vegetation taking over the practice. Heartier vegetation such as shrubs, grasses, and trees can provide more resilience to the potentially adverse growing conditions that may exist in GI practices located in urban environments where CSO communities are typically located. See Appendix A for information on plants that can be used in GI practices. This list is intended as a useful reference, and is not intended to be a comprehensive list of acceptable plants.
Green Infrastructure Performance Monitoring at the Practice Scale
Understanding GI performance at the practice scale is a fundamental step towards addressing questions of feasibility on the large scale. A GI practice is typically designed to either capture and infiltrate stormwater into the subsoil or attenuate stormwater runoff rates. Such a design results in a reduction of hydraulic loading in sewers and on receiving waterways. In small sewersheds, GI practices positioned at low points maximize capture of runoff from the drainage area of the site. Runoff from the contributing drainage area enters the practice where it begins to infiltrate into the soil. The soil voids and ponding area of the practice provide storage to retain water. After the storm subsides, evapotranspiration and deep infiltration recharge the system by freeing the storage voids. Runoff from the contributing drainage area during larger rain events can bypass the practice once capacity is reached. While the fundamental hydrologic mechanics are well understood, the actual performance of GI may differ because of the site-specific nature of each practice. Performance monitoring of a GI practice can help address this uncertainty while providing useful lessons for future design.
Evaluating GI: A CSO Control Alternative for LTCPs January 2018
Chapter 3 Green Infrastructure Implementation and Performance Monitoring Page 9
Figure 3-2: Water Budget of a Stormwater Planter
In Figure 3-2, runoff that enters the stormwater planter will either infiltrate, be captured as storage, or overflow if capacity is reached. Stormwater will leave the GI practice after the storm through evapotranspiration or deep infiltration. Each component provides a monitoring opportunity. Monitoring of the practice also allows for greater understanding of the water balance.
When designing a monitoring plan for a GI practice there are a few key questions to address to ensure a successful study:
▪ What are the monitoring goals of the study?
□ The goals of the study will determine the direction of the entire study. Questions such as: “what effect will a particular GI practice have on the sewer?”, “what infiltration rates or system storage is important in the design?”, “what designs are important to ensuring inflow to the GI practice and avoiding bypass?”, or “what water quality performance data are of interest?”, etc.
▪ What parameters will be measured?
□ Determine what parameters must be measured in order to meet the goals of the study. For example, sewer flow monitoring may be needed to determine the effect of the GI practice on the sewer system. Measuring infiltration rates and rainfall may be necessary to determine the effectiveness of individual GI practices.
Evaluating GI: A CSO Control Alternative for LTCPs January 2018
Chapter 3 Green Infrastructure Implementation and Performance Monitoring Page 10
▪ How will the monitoring plan be managed and maintained?
□ Many GI practice monitoring plans require wireless remote monitoring. Ensuring that sensors are giving accurate measurements is critical to the integrity of the study. Because most studies occur over seasons rather than days, a long-term maintenance plan should be developed. Many sensors can be damaged in freezing temperatures, therefore having a means of temporarily removing and re-installing the devices should be considered. Additionally, work safety considerations should be addressed, such as making sure monitoring locations are in areas with safe access for maintenance. When sewer monitoring is involved, a Health and Safety Plan is crucial for a safe working environment.
▪ What makes the site unique?
□ Choosing an appropriate site to monitor is another important decision to be made. One of the assumptions of a monitoring study when related to hydrologic models is that the results from the monitoring will be applicable in other scenarios. Understanding site-specific details such as infiltration rates and other sewershed characteristics helps put the study into perspective. For example, drainage areas with steep slopes may require an energy dissipating device such as a weir or flume ahead of monitoring equipment for accurate measurements.
▪ What is the plan to implement monitoring?
□ A monitoring plan is best implemented when it is incorporated into the original design of the GI practice. Installing the sensors, wires, monitoring wells, and other mounting devices during or near the end of site construction may be easier than after completion of construction. Implementing a plan to retrofit pre-existing practices with monitoring equipment can come with unique challenges.
□ An effective monitoring plan, at minimum, will outline the roles and responsibilities of field staff, including expected field activities (documentation with photos, field notes, etc.) and frequency; incorporate as-built drawings of the practices; identify location(s) of monitoring equipment; and provide monitoring equipment guidelines and manufacturer’s information.
▪ What is the time-frame of the study?
□ Depending on the goals of the study, the time-frame to collect the data required for analysis may be critical to the study’s success. Most studies tend to monitor a practice over seasons or even years, so it is important to ensure that resources are available for the entire duration. It may also be the case that the goals of the study require monitoring of site conditions both before and after the installation of the GI practice to compare any differences in conditions. In this case, coordination of the monitoring schedule to the construction schedule is essential.
▪ What monitoring techniques are needed?
□ Depending on the GI practice and the intended goals to be accomplished by the practice, a number of different measurements will be needed to ensure optimal performance. Measurements to properly assess performance, such as infiltration rate, storage capacity,
Evaluating GI: A CSO Control Alternative for LTCPs January 2018
Chapter 3 Green Infrastructure Implementation and Performance Monitoring Page 11
and evapotranspiration, will require the use of certain devices and sensors. Table 3-1 summarizes this information.
Table 3-1: Monitoring Techniques
Measurement Device Typical Sensor
Infiltration Piezometers / soil moisture
sensors / reflectometers Pressure Transducer
Groundwater Groundwater Well Pressure Transducer
Ponding Shallow Wells Pressure Transducer
Rainfall Rain Gage Tipping Bucket Rain Gage
Climate Climate Station Temperature/Relative Humidity
Sensor, Radiometer, etc.
Inflow to GI Practice Flume / Weir Pressure Transducer
Sewer Flow Sewer mounted data logger / open flow monitoring sensor
Area-Velocity Sensor
Evapotranspiration Lysimeter / Climate Station Varies
Storage Soil Moisture Sensor Soil Moisture Sensor
Underdrain from GI Practice
Low Flow Pipe Weir Inserts Pressure Transducer
Recording Data Data-Logger Varies
Monitoring and Adjustments to Hydraulic Models
Determining the effect that GI will have on urban hydrology is typically assessed through a combination of hydrologic modeling and in-situ monitoring. When developing a monitoring strategy, the most important step is to clearly define the goals of each study. At the site scale, monitoring will typically measure one or more components of the water budget. At the larger scale (within a sewershed), monitoring will typically be addressed using sewer flow monitoring. While not required, including a monitoring plan for GI is recommended, particularly if a large-scale GI initiative is being planned. Understanding the dynamic between site scale monitoring, sewer flow monitoring, and the hydraulic models is necessary to develop an appropriate plan. Additionally, monitoring data in the early stages of
Evaluating GI: A CSO Control Alternative for LTCPs January 2018
Chapter 3 Green Infrastructure Implementation and Performance Monitoring Page 12
a large-scale GI initiative can provide data necessary to determine if the GI designs are performing as expected; if not, the designs can be adjusted to ensure that the investment made in GI is providing the anticipated volume reduction. This section reviews each component in a monitoring strategy, including how it informs future design, and how to further refine and calibrate the parameters of the hydrologic and hydraulic models used in future planning.
Pre-Installation Monitoring
The objective of performing pre-installation monitoring is to characterize the hydrologic stormwater runoff response. Characterizing the stormwater runoff before any GI installation provides an important representation of the baseline conditions of the sewersheds. The data collected from pre-installation monitoring allows for a direct hydrologic performance comparison of the sewershed with and without GI. Information from the performance comparison can potentially be extrapolated throughout the sewershed.
Some or all the useful pre-installation monitoring may have been completed during the system modeling and calibration required under the CSO permit. However, data on the GI drainage area level may not be available and additional pre-installation monitoring may be useful. The development of a pre-installation monitoring study would generally follow these steps:
1. Define the contributing drainage area of sewershed to the proposed GI 2. Understand the neighboring sewer piping network and hydraulics servicing the GI 3. Identify required monitoring equipment based on site conditions 4. Prepare a pre-installation monitoring plan 5. Install monitoring equipment and perform regular maintenance 6. Collect the data and perform QA/QC 7. Perform data analysis 8. Quantify baseline stormwater runoff flows and volumes
The City of Milwaukee developed a hydrologic simulation to represent five (5) acres of residential and city blocks to evaluate baseline sewer conditions followed by post-green infrastructure conditions. The simulation showed that combining GI implementation with rooftop downspout disconnections from the sewer would reduce peak sewer flows by 5-36% and CSO volumes by 12-38% (EPA Greening CSO Plans 2014).
In 2012, Kansas City completed a 100-acre pilot GI program in a combined sewer area along the Middle Blue River Basin including development of green streets, bioswales, bioretention, and pervious paving systems to capture runoff. In a joint effort between the U.S. EPA and the University of Missouri-Kansas City, runoff monitoring was maintained in the systems. Relative to a control watershed, the hydraulic model predicted the pilot project to reduced flow by 70% (Kansas City Water Services 2013).
Evaluating GI: A CSO Control Alternative for LTCPs January 2018
Chapter 3 Green Infrastructure Implementation and Performance Monitoring Page 13
Generally, it is recommended that pre-installation monitoring occurs for a 6-month period prior to the beginning of construction of the proposed GI practice(s) to allow a sufficient timeframe to collect data for developing a typical hydrologic characterization. Representative rainfall conditions must occur during this period.
Under most cases, water quality monitoring should not be performed prior to the installation of the GI. Quantifying the effectiveness of pollutant removal of GI should be done using inlet and outlet water quality sampling results within the GI during the same storm event. It is not recommended to use different storm events, or varying rainfall event patterns to determine pollutant removal effectiveness of GI.
Selected precipitation monitoring equipment should be installed in an open area away from obstructions and potential wind shear effects from structures; and in a safe location away from potential vandalism and tampering. Flow measurement devices should be installed in a favorable location with minimal turbulence and smooth laminar flows. All data loggers on the proposed site should be configured using an identical time clock with the same day light savings time setting. Rainfall monitoring should clearly distinguish whether total liquid equivalent (rain + snow) precipitation or only liquid rainfall is being measured.
Appropriate Locations for Monitoring Flow Reduction and Quantifying Green Infrastructure Collection System Flow Reduction Benefits
Assessing flows and the potential reductions from GI within collection systems is primarily done using open channel area-velocity flow meters within the neighboring sewer collection system. Area-velocity flow meters continuously monitor the change in water level and velocity in a pipe at a desired recording time increment. The recorded area and velocity readings can be converted to a corresponding flow rate using the continuity equation, Q=VA, where Q = flow rate, V = volume, and A = cross-sectional area.
Prior to installing area-velocity flow meters to quantify collection system flow reductions, it is critical to identify locations that are most conducive to successful data collection and providing meaningful results. While no two GI locations are identical, it is important to understand the following conditions prior to installing flow meters:
1. The size of the GI drainage area desired for monitoring compared to the total flow monitoring drainage area of the upstream service collection system,
2. The hydraulics and connectivity of the collection system that services the GI practice(s), and 3. The distance to the nearest CSO outfall from the GI practice(s) and the size and duration of
rainfall events which trigger activation of the CSO (if monitoring CSO reduction effectiveness).
The following discusses each of the three considerations listed above, and the most suitable conditions for successful and meaningful collection system flow data collection.
1. The Size of the Green Infrastructure Practices Compared to the Total Flow Monitoring Drainage Area
Understanding the size of the drainage area to be managed by the GI practice and the total contributing drainage area to the collection system at the proposed metering location is critical for assessing the effectiveness of GI at reducing flows within the collection system. To assess
Evaluating GI: A CSO Control Alternative for LTCPs January 2018
Chapter 3 Green Infrastructure Implementation and Performance Monitoring Page 14
this performance, the following should be calculated:
1. The total impervious drainage area managed by the GI practice(s), and 2. The total impervious area that contributes to the collection system at the open channel
area-velocity flow meter.
The total calculated impervious drainage area of the GI and the total calculated impervious drainage area of the collection system flow monitor should be compared. Most manufacturers of open channel area-velocity flowmeters report accuracies of ± 5% within the velocity sensors. Therefore, when assessing the effectiveness of GI at reducing flows within a collection system, the impervious area to be managed by GI practices should be greater than or equal to 10% of the total impervious area discharging into the collection system area-velocity flow meter. It is important that the flow volume contributing to the GI practices is large enough to be noticeable within the downstream collection system flow meter and larger than the error accuracy of the open channel area-velocity flow meter itself. This will ensure that meaningful and quantifiable results from the GI installed are collected by the area-velocity flowmeter.
2. The Hydraulics and Connectivity of the Collection System Targeted for Monitoring
The hydraulics of the portion of the sewer collection system that services the GI practice should be fully understood before proceeding with the installation of area-velocity flow meters. The collection system hydraulics should be suitable for collecting accurate area-velocity flow measurements with minimal turbulence. Preferable conditions should include the following:
▪ Water level sensor readings should be greater than 1 inch,
▪ Velocity sensor readings should be between 2 and 8 feet per second,
▪ Monitoring drop manholes should be avoided,
▪ Areas of observed or suspected turbulence in the collection system should be avoided. Examples include incoming drops from side connections, offset joints, bends in sewer, or other flow turbulences caused pipe/manhole deficiencies,
▪ Areas with observed or suspected heavy debris should be avoided,
▪ Monitoring inlet sewers of manholes is preferable over the outlet sewer of manholes,
▪ In challenging flow locations, such as CSO structures with weirs, leaping weirs and gate structures, redundant depth sensors and/or multiple flow meters may be required.
Before installing an area-velocity flow meter, the conditions described in the above bulleted list should be investigated within the part of the collection system proposed for flow monitoring. If necessary, flow monitoring expertise from outside flow monitoring companies should be consulted. If any of the above conditions are not met, the proposed flow monitoring location should be reconsidered for collecting flow data.
Evaluating GI: A CSO Control Alternative for LTCPs January 2018
Chapter 3 Green Infrastructure Implementation and Performance Monitoring Page 15
3. The Proximity to the Nearest Combined Sewer Overflow Regulator and Activation Characterization
In order to quantify the overflow reduction from GI using flow monitoring data, the proximity and activation behavior of the nearest CSO regulator should be understood. The sewer system characterization and current model developed as part of the CSO permit can be a resource. The location of the nearest downstream CSO outfall and its associated regulator should be identified prior to installing the area-velocity flow meters. The flow meters should be placed at, or shortly upstream of the regulator. Once the CSO location is identified the following should be calculated:
1. The total impervious drainage area upstream of the CSO regulator and the total impervious drainage area to be managed by the GI practice(s), and
2. The activation behavior of the CSO regulator including: minimum observed rainfall event to trigger CSO regulator activation, typical discharge volume from the CSO outfall on a storm event basis, and the number of activations in a typical rainfall year as established as part of the NJPDES CSO permit.
The total calculated impervious drainage area to the CSO regulator to be monitored and the total calculated impervious drainage area managed by the GI practice(s) should be compared in the same fashion as previously described in consideration 1 above. It is important that the flow volume contributing to the GI practice is large enough to be noticeable. That is, it must provide the ability to quantify potential flow reductions at the diversion structure. Furthermore, it is also important that the measured flow reductions from the GI practice are larger than the error accuracy of the open channel area-velocity flow meter itself. In order to best achieve and accurately measure reductions from GI practices, the upstream GI practices must retain stormwater at a rate and duration greater than that which activates the CSO regulator. Most GI practices are designed to manage the first 0.75 to 1.5 inches of rain over the contributing impervious drainage area. Therefore, the activation behavior of the CSO regulator is important to understand prior to installing area-velocity flow meters for quantifying overflow reductions. These behaviors include the minimum observed rainfall event for activation, typical overflow volume on a storm event basis, and the number of activations in a typical year (as established per the NJPDES CSO permit). The lower the minimum rainfall depth event to trigger overflow activation, the more likely the GI practice(s) will be effective at reducing overflow. When overflow activation is triggered by relatively low minimum rainfall depths, the area-velocity flow meters installed in the CSO diversion will produce more noticeable and quantifiable overflow reduction results. A scatter plot is typically generated to analyze the minimum rainfall depth event to trigger CSO regulator activation. An example scatterplot is shown in Figure 3-2. This type of plot should be generated and analyzed prior to installing flow monitoring devices at or upstream of the CSO regulator.
Evaluating GI: A CSO Control Alternative for LTCPs January 2018
Chapter 3 Green Infrastructure Implementation and Performance Monitoring Page 16
Figure 3-3: CSO Activation Plot for a Low Rainfall Event Activation CSO and a High Rainfall Event Activation CSO
By plotting the overflow activation events, one can easily determine if the CSO outfall is a good candidate for quantifying reductions from GI. Data in Figure 3-3 shows that the blue CSO outfall would potentially yield more noticeable and quantifiable overflow reduction results than the green CSO outfall. This prediction is reached because: 1) there are many more events less than 1 inch in rainfall that produce overflow activation in blue, 2) the minimum rainfall event which triggers a CSO activation is much smaller for blue than green, and 3) the total CSO discharge volume during the typical year is much greater for blue than green. This is not to say that the CSO outfall represented in green cannot be monitored, but it must be taken into account that the overflow activations are not as prevalent and larger rainfall events are required for activation. Longer monitoring periods may be necessary to quantify results which could lead to greater study costs. To generate plots such as the one shown in Figure 3-3, it is recommended that an existing conditions typical year hydrologic and hydraulic model simulation from a calibrated and validated model be performed for the CSO diversion considered for monitoring. The overflow results from the typical year simulation should be disaggregated for each simulated rain event
Evaluating GI: A CSO Control Alternative for LTCPs January 2018
Chapter 3 Green Infrastructure Implementation and Performance Monitoring Page 17
within the typical year. The modeled overflow volume and associated total rainfall depth for each rain event can then be plotted.
The ultimate goal of a GI monitoring program is to evaluate the effectiveness of constructed GI practices at reducing stormwater runoff entering the sewer system and discharges from CSO outfalls. However, it is rare that rainfall event characteristics and patterns during the post-installation GI monitoring phase will match those in pre-installation phase. The discrepancy in rainfall event characteristics often leads to a distorted correlation when comparing raw monitoring data for pre- and post- GI installation. Two methods are presented below for comparing pre- and post-installation monitoring data to quantify runoff reductions.
Method 1: Develop Hydrologic and Hydraulic Model for GI
Method 1 involves the development of a calibrated and validated model of the sewershed using the pre-installation monitoring data. The pre-installation model is calibrated and validated to the measured pre-installation sewershed flows. After the GI is installed, the post-installation sewershed flows are monitored and the model is recalibrated and validated to the post-installation flows. The pre-installation model and the post-installation model can then be simulated for a common set of observed rainfall events, such as the typical year rainfall period, and a direct comparison of the hydrologic performance can be made between the post-installation and pre-installation of GI. It is recommended that at least three rainfall events of varying event sizes are used for model calibration and at least two separate rainfall events are used for model validation. The number of calibration and validation events may need to be increased depending on the effects of infiltration/inflow and antecedent moisture conditions on the sewer system to understand the seasonal flow effects. The following hydrograph in Figure 3-4 represents how the pre-installation model would assess the impact of GI on the volume and rate of stormwater entering a catch basin.
Figure 3-4: Pre-Installation Model and Post-Installation GI Performance
GI
Installation Model
Evaluating GI: A CSO Control Alternative for LTCPs January 2018
Chapter 3 Green Infrastructure Implementation and Performance Monitoring Page 18
Using the results from the model, the volume and peak flow reductions can be quantified and directly applied to the larger SWMM model or Infoworks for the sewershed to determine resultant CSO benefits.
Method 2: Pre-Installation and Post-Installation Monitoring Direct Comparison Performance Reduction Assessment
Method 2 involves directly comparing pre- and post-installation monitoring data against each other by normalizing the flow data by the rainfall observed and the known drainage area. First calculate the runoff volume under the hydrograph for each observed rainfall event for both the pre-installation and post-installation conditions and convert that total volume to an average depth of runoff by dividing the volume of runoff by the drainage area. The runoff depth for each rainfall event should be normalized by the respective total rainfall over the flow meter contributing drainage area. This value is often referred to as the “effective rainfall” or “R-Coefficient” of the drainage area. The R-Coefficients from pre-installation and post-installation can be statistically compared to determine the flow reduction benefits of the GI practice. Caution should be applied when using this method to ensure that antecedent conditions and the particular season of pre- and post-installation monitoring are similar. For example, if summer data pre-installation is compared to spring data post-installation, the performance of the practices may be skewed.
The Relationship between Monitoring and Hydrologic/Hydraulic Models
Often the primary objective of GI practice performance monitoring is to confirm assumptions and results produced via hydrologic and hydraulic models. It is important to confirm the relationship between model results and monitored results and to further refine model performance to real-world observations. Hydrologic and hydraulic models are a “best guess” approximation until their results can be verified or calibrated to monitored data.
When collecting and assessing GI practice performance monitoring data, a direct comparison of the monitored results with the predicted model results is recommended. If the performance monitoring data differs substantially from the existing model, it is recommended to re-calibrate the model to the observed monitoring data. Verifying the model performance is especially effective when done using sewer flow monitoring positioned at key points in the network. Once a model of a sewershed is calibrated, planning of future GI projects can be viewed in the context of the entire network. This approach allows for constant refinement of the model performance to local conditions and leads to better future designs of GI practices based on those local conditions.
Evaluating GI: A CSO Control Alternative for LTCPs January 2018
Chapter 3 Green Infrastructure Implementation and Performance Monitoring Page 19
Figure 3-5: Model Recalibration Diagram
The EPA’s Storm Water Management Model (SWMM) is one of many hydrologic and hydraulic modeling software available. This model refers to GI as Low Impact Development (LID). The LID input conditions can be adjusted to better match the monitored results of a study site. Individual LID controls should be calibrated in a SWMM model to monitored results in order to build confidence in the model when future planned GI projects are being considered.
Step-By-Step Procedure for Evaluating Collection System Flow Reduction from Green Infrastructure
The following section outlines two methodologies for quantifying collection system flow reduction benefits from the installation of GI practices.
Method 1: Post-Installation Hydraulic and Hydrologic Modeling Performance Reduction Assessment
The following section provides a general step-by-step process for quantifying flow reduction benefits in the collection system from the installation of GI practices where pre-installation data is not available.
Step 1: Select a single GI practice or a collection of practices to monitor in the sewershed being evaluated. This should be determined based on the size of the sewershed, the number of GI practices, and how the results from monitoring indivual practices can be extrapolated to the entire sewershed.
Step 2: Determine where to place area-velocity flow meters in the sewer collection system based on the information gathered. Consider placing meters upstream of the GI, downstream
1. Collect Monitoring
Data
2. Confirm Modeling Results
3. Recalibrate Model (if needed)
Evaluating GI: A CSO Control Alternative for LTCPs January 2018
Chapter 3 Green Infrastructure Implementation and Performance Monitoring Page 20
of GI, and several thousand feet downstream from area managed (maybe near the CSO diversion or the diversion structure itself). The goal is to understand the change in volume in the sewer collection system for the proposed monitoring locations. This process is described above in the section entitled “Appropriate Locations for Monitoring Flow Reduction and Quantifying Green Infrastructure Collection System Flow Reduction Benefits” on page 13 of this chapter.
Step 3: Install flow meters in a favorable hydraulic location; recommended monitoring duration should be for at least 6 months or multiple rainfall events.
Step 4: Update existing hydrologic and hydraulic model calibration and validation with the collected flow monitoring data and the GI practices. – “Modeled Post-Installation”
Step 5: Simulate the typical year rainfall with the post-installation hydrologic and hydraulic model from Step 4 to determine post-installation flow reduction performance.
Step 6: Create pre-installation model without the GI by replacing the GI input data with runoff estimates from directly connected impervious drainage area to the collection system. – “Modeled Pre-Installation”
Step 7: Simulate the typical year rainfall for the pre-installation hydrologic and hydraulic model from Step 6 to determine pre-installation flow reduction performance.
Step 8: Compare the model output from the pre-installation model and post-installation model to evaluate performance of the GI and the flow reductions realized within the collection system.
Method 2: Pre-Installation and Post-Installation Monitoring Direct Comparison Performance Reduction Assessment
The following section provides a general step-by-step process for quantifying flow reduction benefits in the collection system from the installation of GI practices using a direct comparison of flow data collected both before and after-installation of GI.
Step 1: Prior to the installation of the GI practices, select appropriate location for the placement of area-velocity flow meters in the collection system based on the information gathered. Consider placing meters upstream of the planned GI, downstream of the GI, and several thousand feet downstream from area (maybe near the CSO diversion or the diversion structure itself). Goal is to best understand the change in volume for the proposed monitoring locations. This process is described above in the section entitled “Appropriate Locations for Monitoring Flow Reduction and Quantifying Green Infrastructure Collection System Flow Reduction Benefits” on page 13 of this chapter.
Step 2: Install flow meters in a favorable hydraulic location to characterize the flow contribution to the collection system during pre-installation conditions; recommended pre-installation monitoring duration should be for at least 6 months or multiple rainfall events.
Step 3: Construct and install GI in the planned monitoring area. Leave pre-installation flow meters installed during construction and post-installation phases to characterize the flow contributions during post-installation conditions; recommended post-installation monitoring
Evaluating GI: A CSO Control Alternative for LTCPs January 2018
Chapter 3 Green Infrastructure Implementation and Performance Monitoring Page 21
duration should be for at least 6 months or multiple rainfall events.
Step 4: Calculate the runoff generated for the pre-installation and post-installation conditions for each observed rainfall event and normalize total runoff by the total rainfall over the flow meter drainage area. This value is often referred to as the “effective rainfall” or “R-Coefficient” of the drainage area.
Step 5: Directly compare the R-Coefficients from pre-installation conditions and from post-installation conditions to determine the collection system reduction benefits of total runoff removed from the system.
Step 6: Update the existing hydrologic and hydraulic model for both the collected pre-installation and post-installation flow data. Simulate the typical year rainfall in the model under both pre-installation and post-installation conditions to determine additional collection system benefits such as peak flow reduction and CSO reduction (if CSO not directly monitored).
Adaptive Management
Adaptive management is a useful approach to maximize the effectiveness of a GI plan, as the intent is to learn as you build in a sequential implementation of GI practices. As projects are built, monitoring techniques discussed in the previous section can be employed to evaluate the performance of the practices. This information can provide insight for improving the GI plan and effectively locating, designing and constructing future GI practices.
Figure 3-6: Adaptive Management Process Diagram
Source: U.S. Department of the Interior (DOI), 2009
Assess problem
Design
Implement
Monitor
Evaluate
Adjust
Evaluating GI: A CSO Control Alternative for LTCPs January 2018
Chapter 3 Green Infrastructure Implementation and Performance Monitoring Page 22
GI performance can be difficult to predict since many factors (e.g. temperature, rainfall patterns, pollutant loads, native soil infiltration, etc.) can vary between different sites. Monitoring performance of GI practices as they are installed can provide valuable “lessons learned.” With these “lessons learned,” proper modifications can be made to the plan to ensure desired performance goals are being met. Continuously adapting the plan will help mitigate uncertainties and risks that may arise with GI implementation.
The components for an adaptive management approach include, but are not limited to:
▪ Identify uncertainties (e.g. survival of vegetation, drain down of practices, volume reductions, pollutant removal, ancillary benefits, etc.)
▪ Involve stakeholders
▪ Prepare a comprehensive monitoring plan to evaluate expected outcomes, include site specific and sewershed scale monitoring
▪ Prepare interim goals and evaluate performance (e.g. CSO volume reductions, pollutant removal performance, triple bottom line benefits, etc.)
▪ Adjust LTCP as needed
Evaluating GI: A CSO Control Alternative for LTCPs January 2018
Chapter 3 Green Infrastructure Implementation and Performance Monitoring Page 23
Pilot Projects
A useful means of evaluating the effectiveness of green infrastructure is through the implementation of pilot projects. Conducting pilot projects allows a focus on a smaller number of green infrastructure projects where the lessons learned can be applied on a larger scale. Feedback loops from the lessons learned should be created and built into the workflow process so that there is continually informed progress and streamlined implementation. Pilot GI projects also provide a learning opportunity for future projects as well as a tool to facilitate public outreach and community engagement. A pilot program can be used to help inform decision making as part of LTCP development and updates. In general, a pilot project should be developed using the Triple-Bottom-Line approach which provides a holistic perspective to help guide the project and its goals. The main goals of pilot projects are discussed in this section.
Site Selection:
Determining where to implement a pilot project involves many factors. Beside typical site restrictions, often projects will be located in a priority watershed or keys parts of the city that contribute highly to
Case Study: In the City of Philadelphia’s Program for Combined Sewer Overflow Control, the Philadelphia Water Department (PWD) outlined interim milestones for 20 years at 5-year intervals for its adaptive management approach to GI. The PWD had the following expected milestones that would be compared to actual progress every 5 years:
Year 5
• 5.5% impervious cover managed target, at least one project in each of the green program categories
Year 10
• 13.3% impervious cover managed by GI target, using projects in each of the green program categories deemed cost effective
Year 15
• 22% impervious cover managed by GI target, using projects in each of the green program categories deemed cost effective
Year 20
• 34% impervious cover managed by GI target, using projects in each of the green program categories deemed cost effective
During each 5-year assessment, the PWD will make upgrades to its plan for the most efficient green infrastructure practices.
Evaluating GI: A CSO Control Alternative for LTCPs January 2018
Chapter 3 Green Infrastructure Implementation and Performance Monitoring Page 24
CSOs. As discussed later, community engagement and support are critical to the success of a pilot project, so often sites will be selected based on that support network. Allowing for public input in the decision making can also increase public interest in the project and draw attention to other urban problems that GI can help to address. Engineering constraints and project budget may limit the options, therefore, the added value considered in the Triple-Bottom-Line approach helps to strategically select appropriate sites.
Monitoring:
The novelty of the pilot project provides lessons learned to be applied in future design and implementation. A monitoring program to assess the performance of a practice can inform future design as well as other benefits (described in the Monitoring and Adjustments to Hydraulic Models earlier in this Chapter). In addition, keeping track of other aspects, such as understanding maintenance issues and challenges, can offer foresight into what will be required during larger GI implementation, including the associated costs.
Feedback Loops:
One of the main reasons to conduct pilot projects is to learn lessons that will improve future project design and implementation. Creating feedback loops keeps the process dynamic and adaptable. As an example, the pilot project may show that the stormwater inlet to a particular facility routinely gets clogged and needs to be frequently maintained. This lesson should be considered and adapted in future designs to avoid the need for such frequent maintenance. The following feedback loops should be considered:
▪ Source of materials (understanding where construction materials or other landscape features will come from – local sources tend to be preferred)
▪ Cost estimating (collecting contractor bid data to aid in future estimates)
▪ Constructability challenges (particular designs or coordination between agencies during construction can come with unique challenges)
Coordination:
Many agencies, institutions, and community entities share an interest in GI development and the larger goals of GI development. This interest creates an incentive and opportunity for collaboration and coordination between entities. Additionally, a pilot project is an opportunity to test potential relationships and workload sharing between agencies with parallel missions. As an example, in New York City, the Department of Parks and Recreation collaborates with the Department of Environmental Protection in maintaining GI practices and performance monitoring.
The goals of any pilot project should be made clear to the parties it will affect. Many communities already have structures and missions in place that coincide with the missions of GI, such as:
▪ Watershed protection associations
Evaluating GI: A CSO Control Alternative for LTCPs January 2018
Chapter 3 Green Infrastructure Implementation and Performance Monitoring Page 25
▪ Resources conservationists
▪ Parks and recreation departments
▪ Wildlife conservationists
▪ Environmental commissions
▪ Greenway programs
▪ Preservation groups
▪ Urban tree groups
Bringing all parties together provides an opportunity to gain community ‘buy-in’. Often the success of a GI pilot project depends on the support, input, and engagement from the community it serves.
Outside the scope of testing the coordination required for pilot projects, sharing the results of completed pilot projects between groups, such as among CSO permittees, is highly recommended as lessons learned by one community can often be applied in others, especially when those communities are in close proximity. For example, a community may determine that it has difficulty obtaining a sufficient quantity of a particular plant species and needs to remove or minimize the number of that species in the designs of GI practices. This same difficulty would apply to the neighboring community and the lesson learned could be applied there as well, but only if the results of those pilot projects are shared.
Evaluating GI: A CSO Control Alternative for LTCPs January 2018
Chapter 3 Green Infrastructure Implementation and Performance Monitoring Page 26
Community Engagement and Education
The visibility of GI can spur a desire in the community to become educated about the importance of clean water and how to maintain water as a valuable resource. Pilot projects are a valuable opportunity to promote community engagement and education. GI is a relatively new approach for many municipalities and typically unfamiliar to most of the public. Because GI practices are usually visible and require a footprint area, public outreach and education is critical to the success of a pilot program. Partnerships within the community can assist not only with education and outreach but can also provide a public forum for feedback on aspects of a program. There may be grant opportunities that are not available to public entities but could be secured by a partner. These partners could consist of watershed associations, environmental groups, neighborhood associations, local business alliances, community gardens, in addition to many others. Hosting public presentations or workshops and developing educational materials is recommended but it is also necessary to provide opportunities to gather input from the public. Successful programs create unity within a community by fostering a collaborative environment that conveys the benefits of GI, which can be accomplished by holding design workshops for specific projects to engage stakeholders.
Case Study: WATERWASH constructed wetland located along the Bronx River adjacent to the ABC Carpet & Home Warehouse Outlet in New York City. During design of the wetland, community outreach to the outdoor recreational and youth advocacy group ‘Rocking the Boat’ resulted in a collaboration where high-school students help maintain the site and aid in the performance monitoring related to the wetland. (Photos by Joachim Cotten) http://www.lillianball.com/waterwash/waterwash-abc.html
Evaluating GI: A CSO Control Alternative for LTCPs January 2018
Chapter 3 Green Infrastructure Implementation and Performance Monitoring Page 27
Successful GI programs often rely on volunteer resources to maintain the landscaping in GI. A permittee or municipality could partner with stewardship groups such as local tree tenders or horticultural societies. It is also essential that a GI program aligns with other local initiatives and municipal or state requirements or codes. Therefore, GI programs need to be well coordinated with the appropriate officials from departments of transportation (DOTs), public works and parks. Finally, it is important to manage public perception and expectations of a GI program. Several initiatives that can be used for an outreach program are listed below with examples of successful use in existing GI programs.
Presentations and Workshops: Holding presentations and workshops enables staff to meet individual members of the community and better understand and meet community needs. For example, New York City’s Department of Environmental Protection makes presentations to community boards and other civic and environmental organizations, in addition to elected officials and their staff about the city’s GI Program.
Media Campaigns: Kansas City engaged in an extensive media campaign involving interviews on television and the radio, as well as advertisements and articles in local newspapers. These media campaigns reached an estimated three million people in 2007. In 2013, New York City’s Department of
Case Study: Prior to finalizing the design, the Pittsburgh Water & Sewer Authority (PWSA) held a Build‐your‐own‐Bioswale workshop with the local residents. This workshop educated community members on the purpose and function of the GI practices while also giving them the opportunity to convey their concerns, and weigh‐in on certain aspects such as planting selection. This process was intended to engage the community and build a sense of ownership within the community for the constructed systems.
Evaluating GI: A CSO Control Alternative for LTCPs January 2018
Chapter 3 Green Infrastructure Implementation and Performance Monitoring Page 28
Environmental Protection created an educational video on the GI Program which described some of the environmental challenges caused by CSOs as well as some GI solutions such as green roofs, rain gardens, and permeable interlocking paver units. In the state of Maryland, the Clean Water, Healthy Families coalition created a radio ad with a catchy song to combat opponents who had labeled stormwater fees as a "rain tax."
Websites: In 2013, New York City’s Department of Environmental Protection launched a new website that provides information on the City’s GI Program, including the most common types of GI practices as well as a map of priority areas for GI installation. Community members can use the site to see if their neighborhood will receive GI installations and to better understand the practices. Kansas City’s 10,000 Rain Gardens initiative created a website offering residents and other audiences a clearinghouse of information pertaining to the program and to stormwater management more generally, and received more than 100,000 visits per year even after the main media campaign had ended.
Written Materials: Written materials such as brochures and surveys can be effective means of engaging the public and partner agencies about stormwater management practices and the permittee’s use of GI. For example, New York City’s Department of Environmental Protection developed a brochure that explains the siting and construction process for projects in the right-of-way, answers frequently asked questions, and describes the co-benefits of GI. Similarly, Seattle Public Utilities (SPU) used parking surveys to better understand and meet the needs of the community for its Street Edge Alternatives Program. The surveys revealed community concerns about reductions in parking from reduced street width as a result of GI projects. SPU responded to this concern by installing occasional angled parking clustered along the street.
Inter-Agency Partnerships: Creating partnerships between agencies can help to efficiently and effectively implement GI practices. By pooling the resources, expertise, and knowledge of different agencies, inter-agency partnerships are formed that can be crucial to successful pilot programs. These partnerships can exist to aid in any stage of the process, including planning, installation, maintenance, and monitoring. For example, in New York City, the Departments of Environmental Protection and Parks and Recreation have worked together to develop the GI Maintenance Program in order to allocate appropriate resources for the long-term maintenance of DEP’s GI projects.
Engaging the community and developing partnerships is important to ensure broad support for GI installation and thus the long term success of the GI program. This engagement will allow the program to address the community’s concerns with the GI program, which may include both perceived and real negative impacts. Since GI practices will be installed in public and private domains, it is important to ensure the public is aware of projects, has the ability to participate in the planning process, and has their concerns adequately addressed. Perceived negative impacts can include things like mosquito breeding. While the public may perceive that these types of issues would arise from GI, they generally do not from properly functioning GI systems, and these concerns can, generally, be alleviated through education. If these concerns persist even after educating the public, designs can be revised to alleviate the concern, such as reducing the time water will be ponded in the system. While a 72 hour drain time is sufficient to prevent mosquito breeding, the drain time could be reduced to 36 hours to alleviate concerns. Real negative impacts can include issues such as loss of parking spaces in a neighborhood. Since a GI installation may actually result in the loss of parking spaces, this concern cannot be fully resolved through education. However, education, such as explaining why the GI is needed and the benefits it will provide, can still be an important tool in overcoming concerns with real negative impacts. Involving the
Evaluating GI: A CSO Control Alternative for LTCPs January 2018
Chapter 3 Green Infrastructure Implementation and Performance Monitoring Page 29
public and any entities partnering in a green endeavor early in the planning process can mitigate friction during design and, especially, construction. A GI partnership that is the lead on engaging with the public and any outreach or education can be useful. A partnership that operates in this capacity can prove to be a valuable asset for all types of stormwater infrastructure design and implementation throughout a community as it can be a way to connect various types of green infrastructure projects and the local residents. These projects could include road improvements, commercial and residential development, or other infrastructure improvements. The partnership can allow the community to be educated on stormwater related manners as well as allow them the opportunity to discuss how different types of projects within their communities can assist with dealing with stormwater related issues. Another valuable aspect of this type of partnership is that the partnership can educate residents on how they can change their daily activities to have a positive impact in their community.
An example of such an alliance is the Camden SMART (Stormwater Management and Resource Training) Initiative. The partnership involves many key entities such as government agencies, universities, the Camden County Municipal Utilities Authority and non-profit organizations providing a dynamic approach to community involvement in green efforts throughout the City of Camden.
Partnerships can also provide financial benefits. A few examples are provided below:
▪ Milwaukee, WI works with other local organizations to implement green projects that include education and outreach, cost-share or matching funding partnerships. “Greenseams” is a notable partnership with The Conservation Fund to purchase easements on land along waterways and wetlands. Greenseams has protected 3,383 acres of flood-prone areas across 28 communities. Milwaukee and The Conservation Fund further partnered with local and federal entities to restore Greenseam properties to their native habitat. This has resulted in the planting of 102,862 trees over 500 acres, which enhances the capture of stormwater in the greater Milwaukee area, ultimately reducing stormwater flow to the City. By increasing the surrounding areas’ ability to slow peak flows to the City, through conservation and restoration, Milwaukee is improving water quality, protecting from future flood events, and providing residents with access to recreate in a natural setting.
▪ NYC implements a Public-Private cost-share/partnership. These partnerships have resulted in contributions of $1.6B and $900M from public and private investments, respectively with an estimated $139M - $418M in benefits through reduced energy bills, increased property values, improved health and mitigation of CO2 emissions.
▪ In Philadelphia, PA the Green Stormwater Infrastructure Partners (GSI Partners), an initiative by Sustainable Business Network (SBN), is a network of engineering firms, landscape architects, maintenance firms, contractors and suppliers that work together to move GI forward in the Greater Philadelphia Area.
▪ Onondaga County, NY partnered with Courts4Kids Foundation to install new porous asphalt basketball courts. Courts4Kids provided funding for all non-green aspects of the basketball courts.
Evaluating GI: A CSO Control Alternative for LTCPs January 2018
Chapter 3 Green Infrastructure Implementation and Performance Monitoring Page 30
A partnering plan should be developed early on. Some examples of initiatives that can help are listed below:
1. Develop and manage a list of key partners and volunteers. 2. Develop partnerships and volunteer efforts to implement an urban tree canopy project. 3. Develop a GI page on partners’ websites. 4. Develop a homeowner’s guide to GI. 5. Provide GI fact sheets and education materials. 6. Develop a public outreach plan, and timeline for execution of the outreach plan. 7. Leverage community education and outreach by utilizing local and state stakeholders.
Evaluating GI: A CSO Control Alternative for LTCPs January 2018
Chapter 4 Maintenance Considerations Page 1
4 MAINTENANCE CONSIDERATIONS Overview
As with all other CSO control alternatives, a key component to the longevity and success of green infrastructure (GI) is a thorough maintenance program. GI provides volume reduction primarily through uptake by vegetation, infiltration into the subsoil or retention in soil pores and as such it is critical that GI is properly maintained to ensure plant establishment, plant survival, and the preservation of soil permeability. Additionally, routine maintenance can extend the life of the GI system and prevent costly repairs. Just like any chosen CSO control alternative, GI is required to be incorporated into the system’s operation and maintenance plan as required by the NJPDES CSO permit. A maintenance plan for GI includes specific maintenance tasks and schedules, cost estimates, and identifies the entities responsible for the maintenance. This chapter describes components necessary for an effective GI maintenance plan. Maintenance considerations vary for each type of GI practice and a specific maintenance plan should be tailored for each installation. Specific maintenance guidance is available in the New Jersey Stormwater Best Management Practices (BMP) Manual. Maintenance responsibilities, inspection frequency and costs should be evaluated during the design phase of each GI practice. Because of the different types of maintenance needs for each GI practice, annual maintenance costs and replacement costs should be included in any evaluation of the feasibility of GI. In order to ensure the proper performance of the GI practice, maintenance plans should identify responsible parties over the lifetime of the GI practice and agreements should be put in place, as necessary, to ensure proper and regular maintenance of GI. Throughout the lifetime of the GI practice, different types of maintenance are expected based on the current performance of the GI practice, age of the assets, environmental factors and other possible unexpected circumstances. The different types of maintenance can be categorized into reactive, predictive and proactive maintenance and each type of maintenance should be included and addressed in the GI maintenance plans.
1. Reactive Maintenance
Reactive maintenance occurs as a response to an unexpected circumstance. Reactive maintenance may occur after an environmental impact such as a large storm or snowfall, a complaint, or an observed unexpected decrease in performance of the system. Although a specific expense and/or time allocation may be difficult to predict, a standard cost should be integrated into the maintenance plan for reactive maintenance situations.
2. Predictive Maintenance
Predictive maintenance is the periodic maintenance that is expected over the lifetime of a GI program. This type of maintenance is driven by observations made during planned inspections and performance indicators included in the maintenance plan. Predictive
Evaluating GI: A CSO Control Alternative for LTCPs January 2018
Chapter 4 Maintenance Considerations Page 2
maintenance activities should be scheduled into the maintenance workplan and should coincide with the appropriate season.
3. Proactive Maintenance
Proactive maintenance are measures that are not initially anticipated when the GI practice is installed, but incorporated later based on the performance of the GI practice. Proactive maintenance adapts over the lifetime of the GI program and the maintenance plan should be continuously updated to reflect proactive maintenance. Proactive maintenance can help to decrease the instances of reactive and predictive maintenance by identifying potential problem areas of the system and the need for additional predictive maintenance.
Maintenance Plans
Development of Maintenance Plans
The development of a maintenance plan is essential to the successful operation of GI practices over the lifetime of the GI installation. The maintenance plan should account for the three categories of maintenance and, specifically, the organizations or individuals responsible for maintenance activities, specific agreements between owners and agencies, the design and intent of the GI, the training required to be able to successfully implement a maintenance plan and estimated costs. In addition to these considerations, the maintenance plan should identify the following items based on the type of GI:
▪ Inspection schedule
▪ Training required
▪ Personnel and equipment needed
▪ Additional considerations such as overall design, location and land use
Additional details are outlined in the next section for various types of maintenance needs required for each type of system. The typical maintenance discussed in this document is general, for more detailed maintenance needs refer to the New Jersey Stormwater BMP Manual. The frequency of maintenance can be significantly reduced by adding components to the design to address issues that are likely to occur based on the location of the GI practice or the nature of the inflow. For example, for those practices that collect runoff from roadways and sidewalks, such as rain garden bump outs or bioretention islands, the addition of filter bags at the upstream end can significantly reduce the amount of trash, debris or excess sediment that enters the system. For those GI practices that are expected to receive flow either from large drainage areas or areas with significant slopes, the inclusion of a rip rap apron at the entrance of a system that reduces runoff velocity can significantly reduce erosion and washouts of the GI practices. Specific maintenance plans should be developed based on the intended use and expected performance of each system. Outlined below are typical maintenance procedures for various types of GI assets. Inspections and maintenance specification should not be limited to these recommendations. General protocols for all types of GI are as follows:
Evaluating GI: A CSO Control Alternative for LTCPs January 2018
Chapter 4 Maintenance Considerations Page 3
▪ All components of a system used to collect/trap sediment and debris should be inspected for clogging after every storm event exceeding one inch of rain or at least quarterly.
▪ Sediment and debris removed from these systems should be properly disposed compliant with local, state and federal guidelines.
▪ The inspection of all structural components, such as inlets, outlets, curb cuts, manholes etc., at least annually for cracking, subsidence, spalling, erosion and deterioration.
▪ GI practices should not be used for stockpiling of snow or ice, compost or any other material.
More frequent maintenance and inspection may be prudent in the first year after installation to gain a greater understanding of site specific maintenance needs.
Example Protocols for Green Infrastructure
The general maintenance protocols listed below include the specific maintenance tasks that should be undertaken for all types of GI. However, each individual type of GI has additional tasks that are required. The example below lists all of the maintenance tasks for a bioretention system. This information is taken from the New Jersey Stormwater BMP Manual, which should be referred to in order to see the maintenance requirements for the other types of GI. Bioretention systems include GI practices such as bioretention basins, rain gardens, downspout planter boxes, stormwater planters, bioswales and enhanced and continuous tree pits. Maintenance for a bioretention system includes: General Maintenance
▪ Proper and timely maintenance is essential for continuous, effective operation; therefore, an access route should be incorporated into the design, and it should be properly maintained.
▪ All structural components should be inspected, at least once annually, for cracking, subsidence, spalling, erosion and deterioration.
▪ Components expected to receive and/or trap debris and sediment should be inspected for clogging at least four times annually, as well as after every storm exceeding 1 inch of rainfall.
▪ Removal of accumulated sediment should take place when all runoff has drained from the planting bed and the basin is dry.
▪ Disposal of debris, trash, sediment and other waste material should be done at suitable disposal/recycling sites and in compliance with all applicable local, state and federal waste regulations.
▪ In systems with underdrains, the underdrain piping should be connected, in a manner that is easily accessible for inspection and maintenance, to a downstream location.
Evaluating GI: A CSO Control Alternative for LTCPs January 2018
Chapter 4 Maintenance Considerations Page 4
▪ Access points for maintenance should be included on all enclosed areas within a bioretention system; these access points must be clearly identified in the maintenance plan. In addition, any special training required for maintenance personnel to perform specific tasks, such as confined space entry, should be included in the plan.
▪ GI practices should not be used for stockpiling of plowed snow and ice, compost, or any other material.
Vegetated Areas
▪ Bi-weekly inspections should occur when establishing/restoring vegetation.
▪ A minimum of one inspection during the growing season and one inspection during the nongrowing season should occur to ensure the health, density and diversity of the vegetation.
▪ Mowing/trimming of vegetation should be performed on a regular schedule based on specific site conditions; perimeter grass should be mowed at least once a month during the growing season.
▪ Grasses within the bioretention system should be carefully maintained with lightweight equipment, such as a hand-held line trimmer, in order to maintain the permeability of the system.
▪ Vegetative cover should be maintained at 85%; damage in excess of 50% should be addressed through replanting in accordance with the original specifications.
▪ Vegetated areas should be inspected at least once annually for erosion, scour and unwanted growth; any unwanted growth should be removed with minimum disruption to the remaining vegetation.
▪ All use of fertilizers, pesticides, mechanical treatments and other means to ensure optimum vegetation health should not compromise the intended purpose of the bioretention system.
Drain Time
▪ The planting bed should be inspected at least twice annually to determine if the permeability of the bed has decreased.
▪ The design drain time for the maximum design storm runoff volume should be indicated in the maintenance manual.
▪ If the actual drain time is longer than the design drain time, the components should be evaluated and appropriate measures taken to return the bioretention system to the original tested as-built condition.
▪ If the bioretention system fails to drain the NJDEP Water Quality Design Storm (WQDS) within 72 hours, corrective action should be taken and the maintenance manual revised accordingly to prevent similar failures in the future.
Evaluating GI: A CSO Control Alternative for LTCPs January 2018
Chapter 4 Maintenance Considerations Page 5
Maintenance Agreements
Municipal ordinances or sewer connection requirements that encourage or mandate the use of GI should include the assignment of maintenance responsibilities. These responsibilities should be memorialized in a stormwater management maintenance agreement, which should be signed and recorded as part of the property deed. Maintenance responsibilities would be transferrable with the sale of the property. An essential aspect of the success of a GI maintenance program is identifying the owner or agency responsible for maintaining the system. Usually the maintenance responsibility falls to the owner of the system, though other agencies can also take that responsibility. If an agency other than the owner is identified as responsible for the maintenance of the GI practice, an agreement needs to be established between the owner and responsible party. Any revisions made to the GI practice throughout the life of the program should be recorded in the deed of record for each property on which the maintenance occurs. Consideration should be made to the responsible party’s understanding and capabilities of performing the maintenance required for the system along with the possibility of ownership transfer over the lifetime of the program.
Types of Maintenance Agreements
▪ Ownership Maintenance Agreements – Public
Ownership maintenance agreements are often for public agencies. Public ownership usually includes ownership by a governmental entity (e.g., municipality) or public authority (e.g., sewerage authority). These groups are often directly responsible for the installation of the system and have a general knowledge of the system’s goals and function. This firsthand knowledge can provide for a successful maintenance program.
▪ Ownership Maintenance Agreements – Private
Ownership maintenance agreements can also be for private entities. Examples of private ownership can include commercial developers, homeowner associations, or private individuals. An evaluation of the capabilities of private owners should occur early on in the program and appropriate training should be provided when needed. Specific consideration should be made to determine if the owner understands the expected performance and design goals of the system, maintenance needs and costs required over time.
▪ Non-ownership Maintenance Agreements
Instances can occur when the responsibility for maintenance of the practice is with an entity other than the owner such as a municipality maintaining the GI within its boundaries that are owned by the sewerage authority. In these circumstances, a maintenance agreement is essential. The maintenance agreement should include details on the types of maintenance to be performed and by whom, define access requirements, and identify details on the organization or individual responsible for the maintenance costs and eventual cost of replacement.
Evaluating GI: A CSO Control Alternative for LTCPs January 2018
Chapter 4 Maintenance Considerations Page 6
Enforcement of Maintenance Agreements
If a CSO permittee includes GI on property that it does not own as part of its Long Term Control Plan, the permittee should ensure it has established a mechanism to enforce maintenance of the GI practices. The project owner or person who will be responsible for maintenance of the GI must agree to the following:
1. To undertake in a timely manner all necessary measures to ensure proper operation of the GI practice,
2. To make available, upon request by any public entity with administrative health, environmental or safety authority over the site, the maintenance plan, applicable agreements and documentation, such as inspection logs, and
3. To provide access to the property on which the GI practice is installed at reasonable times to any agency with enforcement authority over approval and maintenance of GI practice to verify that the proper maintenance and upkeep is met.
These conditions should be reflected in the permit or other approval document for the GI project, and should also be required to be incorporated into a deed notice for property.
Legal authority to approve and enforce GI and other stormwater control measures may be found in various statutes. For example, the Sewerage Authorities Law, N.J.S.A. 40:14A-1, the Municipal and County Utilities Authorities Law, N.J.S.A. 40:14B-1 et seq. and the Water Pollution Control Act (WPCA), N.J.S.A. 58:10A-1 et seq. provide broad authority to utilities to act to prevent untreated discharges within their respective service areas and to require commitments by their member communities to develop and implement maintenance programs for their own systems as a condition of the sewer use agreements between the authority and its members. Under the Sewerage Authorities Law, N.J.S.A. 40:14A-26(c), member communities must prevent their own systems from malfunctioning, leaking, or overflowing and ensure that all flow reaches the authority’s sewer system. To enforce this requirement, authorities are given the ability to enter upon any portion of the hydraulically connected system within the authority’s district. Similarly, municipalities have the authority through the Municipal Land Use Law (N.J.S.A. 40:55D-1 et seq), though the passing of specific ordinances, or modifying existing ordinance, outlining the requirements and the municipalities inspection and entry authority may be required. Local agencies also have broad powers under the WPCA to ensure compliance with State and Federal water pollution control regulations. The WPCA authorizes sewerage authorities to exercise the same right of entry, inspection, and sampling, and to impose the same remedies available to the Department to enforce state and federal pollution control requirements against all those who contribute flow to the local agency’s treatment works. Under N.J.S.A. 58:10A-6(i), utilities can require proper operation and maintenance of conveyance systems by their member communities, including those without CSO permits.
Evaluating GI: A CSO Control Alternative for LTCPs January 2018
Chapter 5 CSO Reduction Potential of Green Infrastructure Page 1
5 CSO REDUCTION POTENTIAL OF GREEN
INFRASTRUCTURE Overview
Green infrastructure (GI) practices are designed to capture stormwater runoff prior to reaching a sewer system. Capturing stormwater reduces the volume and peak flow of stormwater in a sewer system, ultimately reducing the number and volume of CSO discharges. Also, a reduction in volume and peak flow reduces the size and cost of gray infrastructure that may be used to manage CSO. To perform an evaluation of GI as a CSO alternative, modeling and other procedures can be utilized to identify the CSO reduction potential of GI. Typically, it is more efficient to determine CSO reductions from GI on a sewershed basis rather than by the performance of an individual GI practice, as the CSO reduction potential will be minor per practice.
Procedures to Determine CSO Reduction Potential
To determine the CSO reduction potential it is required to assess the drainage areas being captured, typical year storms, and the sewer collection system’s hydraulics and associated downstream interceptors. To measure and compare the reduction potential, a standard measurement unit must be selected. Below are two common ways to represent CSO reduction potential:
▪ CSO Reduction Volume per Percent (%) Area Managed by GI (Gallons / % Area Managed)
▪ CSO Reduction Volume per Stormwater Runoff Volume Captured by GI (Gallons CSO / SW Gallon Captured)
These values will vary between sewer systems due to hydraulic capacity differences.
An evaluation of GI's CSO reduction potential for a sewer system can be accomplished by employing a step-by-step approach that accounts for specific land use characteristics, system hydraulics, and impervious cover. The approach can take the following general steps:
1. Determine Baseline Hydraulic Conditions of Sewersheds 2. Determine Priority Sewersheds for GI 3. Evaluate GI Impacts on Baseline Conditions 4. Summarize Results
Step 1: Determine Baseline Hydraulic Conditions of Sewersheds
As required by the CSO permit, an extensive sewer system characterization must be performed in order to understand existing conditions and to determine under what conditions the system overflows or surcharges. The required sewer system characaterization includes the location of the CSOs, the number of acres and landuse types within a sewershed, the volume of overflows,
Evaluating GI: A CSO Control Alternative for LTCPs January 2018
Chapter 5 CSO Reduction Potential of Green Infrastructure Page 2
and the magnitude and frequency of storm events that result in overflows. This characterization is particularly important in determining the baseline hydraulic conditions of a sewershed and for evaluation of the CSO reduction potential of GI.
Step 2: Determine Priority Sewersheds for GI
Perform hydrologic and hydraulic (H&H) model runs for the sewer system with different percentages of reduced impervious area (e.g. 5, 10, 15, 20, 25, and 30 percent) to determine a relationship between runoff reduction and CSO volume reduction. The relationship will vary between sewersheds, so this type of analysis can be used to determine in what sewershed reducing the volume of runoff with GI will result in the largest reduction in CSO. For example, modeling a 5% reduction in an impervious area in three different similarly sized sewersheds may result in a 3% reduction in CSO volume in sewershed 1, a 5% reduction in sewershed 2, and an 8% reduction in sewershed 3. In such a case, sewershed 3 would be the priority sewershed, as the capital investment in the GI program in sewershed 3 will result in the largest reduction in CSO volume. It is important to note that reductions in impervious area in one sewershed may have impacts on reductions in CSOs in other sewersheds. This could occur when the cause for overflow is outside of an invidiual sewershed, such as capacity of a downstream pipe or pump station, or the sewage treatment plant. The reduction in volume and flow rate of stormwater entering the system resulting from GI frees up capacity in the system. Another example is a condition where sewersheds may be distinctly separate during average conditions, but be interconnected via overland flow during heavy rain events. In other cases, removing large amounts of impervious area tributary to a CSO may have little impact on local CSO reduction due to limitations of existing interceptor capacities. Therefore, when performing this modeling, it is recommended that the entire collection system H&H model be run to understand overall system hydraulic capacities and overflow reduction performance. This step is meant to approximate the benefits of GI in managing stormwater runoff by developing a relationship between impervious area/stormwater runoff removed and CSO reduction. These results then allow for selecting an initial target for impervious area management with GI and for prioritizing sewersheds for implementation as discussed in Chapter 2. This step is meant to simulate GI indirectly by simulating the effects of reduced impervious area. GI practices that do not infiltrate into subsoil, collect and slowly release runoff rather than remove the runoff. Therefore, more impervious area managed will likely be needed to account for the GI practices that do not infiltrate into subsoil.
Step 3: Evaluate GI Impacts on Baseline Conditions
The results of Step 2 provide the initial targets for the amount of impervious area to be managed with GI. A targeted range of impervious area managed should then be selected for simulating the GI in the model to meet the desired performance goals and/or volume reductions. GI can be represented in an H&H model in various manners depending on the model software used. It is important to select the amount of stormwater runoff that the GI will capture, i.e., the first 1 inch, 1.5 inches, or 2 inches of runoff.
Evaluating GI: A CSO Control Alternative for LTCPs January 2018
Chapter 5 CSO Reduction Potential of Green Infrastructure Page 3
Another important sizing parameter is the drain down time for the GI practice. Drain down time is defined as the time it takes for the practice to empty after the end of a rain event. If all the runoff captured will not be infiltrated, the GI practices should be modeled to include an underdrain to detain and slowly release the captured runoff back into the sewer system. It is not necessary to assume that the GI practices must infiltrate all of the runoff to benefit CSO reduction. Practices such as rain gardens with underdrains can retain a portion of stormwater and can be designed to slowly release the detained stormwater back into the sewer system. This is typically dependent on the time it takes for downstream sewer capacity to return to dry weather flows after storm events. Typical design drain down times are 48 - 72 hours. A range of infiltration rates should also be simulated in conjunction with the drain down times to understand how the performance of GI on CSO reduction changes with infiltration capacity. Once the target range of impervious area to be managed and GI modeling parameters are selected, model runs can be performed to determine the GI performance on resultant overflow reductions and reduced flooding.
Step 4: Summarize Results
Tabulate the following information from the H&H models performed in Step 3. This is typically done by sewershed:
▪ Impervious area managed with GI – percent and acres ▪ Resultant CSO reduction ▪ Annual stormwater runoff reduced – percent and gallons ▪ Annual stormwater volume infiltrated ▪ Annual stormwater volume captured and returned to the sewer system for subsequent
treatment
Upon tabulating this information, a stormwater runoff volume managed to CSO volume reduction ratio can also be created. Typically, this is expressed as for every gallon of stormwater managed, a fraction of a gallon of CSO is reduced. Typical ranges observed in other communities are 0.4 – 0.7 gallons of CSO reduced per 1 gallon of stormwater managed. However, these ratios are site specific and should be confirmed based on the steps above.
Evaluating GI: A CSO Control Alternative for LTCPs January 2018
Green infrastructure (GI) mitigates CSO discharges while providing environmental, economic, and social benefits. Determining the cost to implement GI without consideration of other life-cycle costs provides an incomplete foundation for decision making. The true cost of GI, like other CSO control alternatives, includes life-cycle costs such as capital, operation and maintenance, and replacement costs. A significant benefit of GI is that it reduces stormwater flow into the existing combined system, which frees up capacity for sewage. At the same time GI can improve the system’s resiliency to storm events and potentially reduce the operation and maintenance costs of existing stormwater management systems. GI has many additional benefits that are not represented by a dollar amount analysis. A complete cost-benefit analysis should be utilized to consider additional benefits of GI and the benefits that are most valuable to your community. For example, this may include:
• Improved air quality
▪ Reduced carbon emissions
▪ Reduced heat island effect
▪ Property value uplift
▪ Cost-effective water quality improvements
▪ Energy savings
▪ Recreational improvements
▪ Reduced surface flooding
▪ Reduced basement sewage flooding
The benefits with GI are extensive, however, placing a monetary value on them can be difficult. These ancillary benefits should be identified and incorporated into the decision-making process using the weighting factors discussed in Chapter 2. While gray infrastructure is an essential component in a LTCP, GI integrated with gray infrastructure can provide a more balanced solution to CSO mitigation and also provide ancillary benefits that gray infrastructure alone typically does not. A green-gray approach can also provide incremental CSO reductions that occur faster; since gray infrastructure projects typically have longer implementation times and require a complete installation before CSO reductions or surface and basement sewage flooding reductions can occur. Conversely, a GI plan can be installed incrementally and in targeted optimized locations thereby reducing CSO and flooding as each piece of the plan is completed.
Evaluating GI: A CSO Control Alternative for LTCPs January 2018
The true cost of GI requires an assessment of capital, operation and maintenance, and replacement costs, often referred to as life-cycle costs. The true cost must also take into account additional stormwater management problems, beyond just overflow reduction, that GI can mitigate. As previously stated, GI is intended to manage small, frequent storm events. When GI is used in areas that experience frequent localized flooding, it can prevent runoff from leaving the site during small storm events; as a result, allowing the existing infrastructure to convey flows downstream without the added burden of additional stormwater flow. During larger storm events, the amount of runoff captured by GI is unlikely to significantly affect overflows, however, using a combination of GI and gray infrastructure can address overflows at a significantly lower cost with the added ancillary benefits provided by GI. While initial construction costs are a starting point, they are just a small piece of the big picture. Operation and maintenance set forth in a GI plan is a vital component for success and overall effectiveness, thus the associated costs must be considered. Planning, design, and construction services costs for GI must also be incorporated when determining total capital costs. While efforts should be made during planning, design, and construction to maximize the useful life of GI practices, eventual replacement will be necessary, therefore, costs for replacements must also be added to the analysis. In order to determine GI life-cycle costs a time-frame must be selected to perform the analysis, typically ranging from 20 years to 50 years. Capital costs are a one-time investment, while operation and maintenance and replacement costs are reoccurring items throughout the time-frame of the analysis. These costs should then be compared to the additional environmental, economic, and social benefits provided by GI when making decisions.
1. Capital Costs
The first step in determining capital costs for GI is quantifying the amount of stormwater volume reduction required to be captured, i.e., the first 1-inch, first 1.5 inches, etc. to achieve the goals of the project. It is important to consider that capturing and managing one gallon of stormwater does not necessarily equate to one gallon of overflow reduction. For example, experience in some communities has indicated each gallon of stormwater managed equates to 0.4 to 0.7 gallons of CSO reduced. This reduction is due to multiple factors including local sewer hydraulics, design of the GI, ability of local soils to infiltrate, and the amount of infiltrated water that ends up back in the sewer system as inflow and infiltration (I/I). It should also be recognized that GI can be used in different operational modes to reach the desired performance goals. Often, GI’s primary benefit is from infiltration of the captured stormwater into the ground. However, GI can also be used to detain the captured stormwater and then slowly return the water back into the combined sewer or storm sewer systems. Under the detain and return operational mode, GI can provide benefits even in areas of soil that infiltrate poorly, or in areas where infiltrated stormwater may re-enter the system as I/I. In determining the design for detain and return type GI, hydraulic analyses of the downstream sewer system should be used to determine the appropriate release rate. Typically, detain and return GI is designed to capture the first 1 to 1.5 inches of stormwater runoff and release the captured stormwater back into the sewer system over a period of 48 to 72 hours. However, these design parameters should be evaluated based on the specifics of the local sewer system.
Evaluating GI: A CSO Control Alternative for LTCPs January 2018
Capital costs are defined as the fixed, one-time expenses to bring a project to completion which include the cost of the land, construction, and design. Capital costs also typically include an appropriate contingency based on the planning or design level of the project. There is no single way to represent capital costs for GI, and depending on the approach, one or a combination of representations can be utilized throughout the cost-benefit analysis. The following are common ways to represent capital costs for GI practices that have been used by others:
▪ Unit Cost per Square Footage of GI Practice ($/SF GI Footprint)
▪ Unit Cost per Square Footage of Drainage Area Managed ($/Acre Managed)
▪ Unit Cost per gallon of Stormwater Volume Captured ($/Gal Captured)
▪ Unit Cost per gallon of Overflow reduced ($/Gal OF Reduced)
The representations can be used to compare gray infrastructure and other alternatives or to compare amongst different types of GI practices. The unit costs of GI practices can vary based on location, site characteristics, amount of stormwater managed and design limitations. For example, a bioretention system in front of a municipal building or in the center of town may need a more aesthetically pleasing appearance as compared to one that is hidden from public viewing even though they are designed to manage the same volume of stormwater. A more aesthetically pleasing system may require more design time to incorporate a visually appealing vegetative cover. Another example is a pervious paving system installed in an area with soils that drain poorly, which would require additional design features such as underdrains, compared to a pervious paving system installed in well drained soils. These factors should be considered while choosing potential locations and assessing the feasibility of GI and should be carried over into cost estimating. See Table 6-1 below for a range of approximate construction costs in 2017 dollars for GI practices constructed in the United States.
Table 6-1: Approximate Construction Costs for GI Practices
GI Practice Low Range Cost High Range Cost
($1/Acre Managed) ($1/Acre Managed)
Bioretention $299,000 $449,000
Permeable Paving Systems $232,000 $348,000
Enhanced Tree Pits $305,000 $458,000
Green Roofs $792,000 $1,200,000
Infiltration Systems $132,000 $198,000
Combination of GI Practices $248,000 $371,000
Sources: PWD Green Projects, Philadelphia, PA (Construction Costs) Save The Rain Green Projects, Onondaga County, NY (Construction Costs) 1In 2017 dollars
Evaluating GI: A CSO Control Alternative for LTCPs January 2018
Refer to the following references for more detail regarding unit cost ranges for GI:
▪ The University of New Hampshire Stormwater Center
▪ San Francisco’s LTCP Technical Memorandum No. 807
▪ The Center for Technology’s Green Values National Stormwater Management Calculator
▪ Philadelphia Water Department Long Term Control Plan Update, Volume 3: Basis of Cost Opinions
Diminishing returns for GI refers to a point at which the amount of rainfall captured becomes less cost-effective. Designing GI to capture large storm events is often less cost effective since there will be unused storage for the majority of storm events. GI sized for the 2-year storm, for example, has only a fifty percent chance of utilizing its full storage in any given year. GI sized for even larger storms will utilize their full storage even less frequently. Usually, sizing GI for a larger design storm will increase the cost of the GI practice. Because the additional storage for higher storm events will be utilized less frequently, it may be less cost effective to build GI sized for storm events greater than the 2-year storm than building additional GI installations that are sized for smaller, more frequent storm events. A GI practice sized for the NJDEP Water Quality Design Storm (WQDS) (1.25 inches of rainfall) would be sized to manage about 90% of the rain events in an average year, which may represent a good starting point for determining the point of diminishing returns. However, this point will vary depending on system characteristics, the number of locations available for GI installations, the available budget, and other factors. Therefore, the design storm should be determined with these factors in mind for each sewershed or possibly each GI practice.
Bottom-Up Cost Estimation
GI practices can vary widely in cost due to a host of factors, including design criteria, familiarity of designers and contractors, local costs for materials and labor, etc. Because of this cost variability, it is recommended that a bottom-up construction cost estimate for each GI practice be tailored to the local community and design criteria. A bottom-up cost estimate includes the specific design criteria and local unit costs for materials and labor. Table 6-2 below provides an example of the components to include in a bottom-up construction cost estimate for a bioretention system capturing runoff generated by the NJDEP WQDS (1.25 inches) from 10,000 SF of paved road surface (refer to pg. 16 of Chapter 9.1 of the New Jersey Stormwater Best Management Practices (BMP) Manual for more detail). The following design assumptions are included in the example:
▪ Pipe diameters and material: 6-inch diameter PVC for overflow, 6-inch diameter PVC for connection to sewer, and 8-inch diameter PVC for inflow pipe
▪ Pipe lengths are estimated from diagrams in New Jersey Stormwater BMP Manual
Case Study: The Milwaukee Metropolitan Sewerage District (MMSD) determined that the same volume can be stored by capturing 0.5 inches of rainfall from 4 acres as capturing 2 inches from 1 acre. Thus, capturing 0.5 inches from 4 acres will utilize storage for more storms and increase cost effectiveness.
Evaluating GI: A CSO Control Alternative for LTCPs January 2018
▪ Rip-rap protection is estimated from diagrams in New Jersey Stormwater BMP Manual
▪ Loading Ratio = 11.6
Table 6-2: Bottom-Up Example Construction Cost Estimate for a Bioretention System
Item Description Qty Unit Unit Price
Total Price
1 Temporary Erosion and Sediment Controls 1 LS
2 Stormwater Catch Basin 2 EA
3 8" Dia. PVC Inflow Pipe 15 LF
4 Inflow Structure 1 EA
5 Rip-Rap Stone 5 CY
6 Bioretention Media 50 CY
7 Vegetation (materials) 1,540 SF
8 Filter Fabric 300 SF
9 Overflow Riser with Debris Cap 1 EA
10 6" Dia. PVC Riser Pipe for Overflow 2 LF
11 6" Dia. PVC Pipe to Connect Overflow to Sewer 15 LF
12 Excavation 70 CY
13 Material Disposal 70 CY
14 Landscaping (planting, grading, etc.) 1,805 SF
Subtotal
Contingency
Total *Table to be completed with local unit costs for area
Table 6-3 below provides an example of a bottom-up construction cost estimate for a permeable asphalt parking lot. In this example, the parking lot is capturing runoff generated by the NJDEP WQDS (1.25 inches) for 1.25 acres of impervious surface (refer to pg. 18 of Chapter 9.7 of the New Jersey Stormwater BMP Manual for more detail). The following design assumptions are included in the example:
▪ Pipe diameters and materials: 6-inch diameter PVC for rooftop connections, 6-inch diameter half-perforated PVC for underdrain, 8-inch diameter PVC for connection to sewer
▪ Pipe lengths are estimated from diagrams in the New Jersey Stormwater BMP Manual
Evaluating GI: A CSO Control Alternative for LTCPs January 2018
Table 6-3: Bottom-Up Construction Cost Estimate for a Permeable Asphalt Parking Lot
Item Description Qty Unit Unit Price
Total Price
1 Permeable Asphalt (Surface Course) 110 CY
2 Choker Course 50 CY
3 Storage Bed Stone 485 CY
4 Outlet Control Structure 3 EA
5 Manhole 1 EA
6 Inspection Port 4 EA
7 Overflow Surface Catchment 12 EA
8 4" Dia. Half-Perf. PVC Pipe for Underdrain 330 LF
9 8" Dia. PVC Pipe for Sewer Connection 125 LF
10 4" Dia. PVC for Roof Connections 20 LF
11 Excavation 1,010 CY
12 Material Disposal 1,010 CY
13 Paving 21,780 SF
14 Striping 1 LS
Subtotal
Contingency
Total
*Table to be completed with local unit costs for area
2. Operation and Maintenance Costs
As with all constructed infrastructure, GI practices require operation and maintenance (O&M) to perform as designed. One approach to estimating O&M cost requires a determination of total footprint of each GI practice being employed throughout the program. As the footprint of each GI practice increases each year as more implementation occurs, the annual O&M costs of the entire GI program will increase accordingly. This must be accounted for to provide an accurate analysis for the desired time-frame. See Table 6-4 below for some typical O&M costs.
Evaluating GI: A CSO Control Alternative for LTCPs January 2018
1Houle et al, “Comparison of Maintenance Cost, Labor Demands, and System Performance for LID and Conventional Stormwater Management,” Journal of Environmental Engineering July 2013: 932-938. 2State of Delaware and DNREC, “Appoquinimink River Watershed Plan” February 2011 http://www.dnrec.delaware.gov/swc/wa/Documents/AppoPCSdocs/Appendix%20E%20-%20Cost%20Calculations.pdf 3A Report of the United States General Services Administration “The Benefits and Challenges of Green Roofs on Public and Commercial Buildings” May 2011 https://www.gsa.gov/portal/mediaId/158783/fileName/The_Benefits_and_Challenges_of_Green_Roofs_on_Public_and_Commercial_Buildings
Since there are variations in GI design and local conditions that affect operation and maintenance, a bottom-up cost estimate for annual operation and maintenance should be performed. This approach should evaluate the operation and maintenance procedures for each GI practice, including length and frequency, as well as local material, equipment, and labor costs. Specific maintenance procedures can be found in Chapter 4 of this document and in Chapter 9 of the New Jersey Stormwater BMP Manual. Length and frequency for each procedure can be estimated from similar work done by others. Equipment costs and unit labor costs can be determined from local sources. The operation and maintenance hour estimations can be for total footprint of practice or per impervious area managed. Table 6-5 below provides an example of a bottom-up operation and maintenance cost estimation for bioretention systems.
Table 6-5: Bioretention Bottom-Up O&M Cost Estimate Example
Item Maintenance Procedure Frequency (Visits Per
Year)
Hours Per Visit
Total Hours
per Year
Unit Labor Cost
Total Cost
1 Inspect structural components for cracking, subsidence, spalling, erosion, and deterioration
1
2 Inspect inlets and remove accumulated debris, leaves, sediment that may impede flow
4
3 Removal sediment, debris, and litter from GI footprint and inlets
12
4 Remove any unwanted growth/weeds
12
5 Inspect vegetation to ensure health and replace as needed
2
6 Inspect planting beds for erosion, scour, and unwanted growth
1
7 Inspect infiltration rate and verify drain down time of system
2
8 Inspect underdrain 1
9 Add/replace mulch 1
10 Inspect outlet structure and remove any debris
2
Subtotal
Contingency
Total *Table to be completed with local unit costs for area
Using GI will reduce the amount of other CSO alternatives needed, such as gray infrastructure practices, which also require operation and maintenance. Operation and maintenance procedures are necessary for all infrastructure projects, thus the avoided costs of maintaining those structures by using GI should be noted in the cost-benefit analysis.
3. Replacement Costs
Once a GI practice reaches the end of its useful life, many of the components will need to be rehabilitated or replaced. The lifetime expectancies can vary based on design and location. Replacement costs can be determined through the bottom-up cost estimation approach. For example, a bioretention system will need replacement of the soil bed and the filter fabric around the sides of the bed. The vegetation, mulch, and rip-rap will also need to be removed and replaced. Any structural feature (e.g. inflow and overflow
Evaluating GI: A CSO Control Alternative for LTCPs January 2018
structures, concrete structural walls, curb inlets, etc.) will need to be inspected to determine if replacement or rehabilitation is necessary. Table 6-6 below provides an example of a bottom-up replacement cost estimate for bioretention systems and Table 6-7 provides typical life expectancies experienced in the United States.
Table 6-6: Bioretention Example Bottom-Up Replacement Cost Estimate Example
Item Replacement Task Qty Unit Unit Price
Total Price
1 Remove rip rap and inflow/outflow structures (keep for re-installation if in good condition)
HR
2 Excavate/remove vegetation and mulch CY
3 Excavate bioretention media from soil bed CY
4 Replace filter fabric around soil bed SF
5 Install new bioretention media CY
6 Install new layer of mulch (if present) CY
7 Inspect/remove and replace storage gravel or plastic storage boxes (is applicable)
CY
8 Inspect/clean underdrain (if applicable) HR
9 Install new vegetation SF
10 Install new/re-install rip rap and inflow/overflow structures
HR
Subtotal
Contingency
Total *Table to be completed with local unit costs for area
Evaluating GI: A CSO Control Alternative for LTCPs January 2018
Table 6-7: Typical Life Expectancy Ranges for GI Practices
GI Practice Type Life Expectancy (years)
Bioretention4 30
Pervious Paving Systems 4 30
Vegetative Filter Strip4 30
Green Roof4 30
Cistern5 20-50 depending on material type
Tree Plantings4 40
Grass Swales4 30
Infiltration Basins4 30
Sand Filters6 Filter media needs to be replaced about every 5 years
Dry Wells 15
4 “Save the Rain Program, GI Maintenance Manual” Onondaga County, NY April 2013. 5 Environmental Services City of Portland “Cisterns” July 2006 https://www.portlandoregon.gov/bes/article/127468. 6 Urbonas, Ben R. “Stormwater Sand Filter Sizing and Design a Unit Approach” http://uwtrshd.com/assets/sand-flt-paper.pdf 7 Maine Department of Environmental Protection “Maine Stormwater Management Design Manual, Technical Design Manual Volume III” May 2016 http://www.maine.gov/dep/land/stormwater/stormwaterbmps/vol3/chapter6.pdf
Integrating Green Infrastructure to Reduce Costs
Integrating GI into planned capital improvement projects can provide project savings and can be a cost-effective way to manage stormwater. The integration of GI into other planned projects can be less expensive than the total costs of implementing the conventional capital improvement project and a GI project separately. For example, repaving a parking lot with permeable asphalt rather than conventional asphalt could cost less than paving a parking lot with conventional asphalt and implementing a standalone GI project to manage the same quantity of stormwater that the permeable asphalt would manage. In determining the cost effectiveness, it is important to include the benefits associated with the GI
component of the project. Thus, one would compare the added cost of the GI component to the benefits achieved from the GI component of the project. In such a comparison, the benefits achieved compared to those costs will likely be higher than the benefits achieved compared to the cost of a separate standalone GI project. In fact, the monetary value of the benefits may actually exceed the added cost of the GI project when it is incorporated into another construction project. The following are examples of how GI can be incorporated as part of other construction projects and required capital improvements:
▪ Repaving a parking lot with permeable asphalt rather than conventional asphalt
▪ Replacing antiquated pedestrian walkways with a pervious paving system (pervious concrete or permeable interlocking paver units) rather than conventional concrete
▪ Upgrading a street with integrated GI such as tree pits, bioretention, and permeable paving systems rather than a conventional street replacement
▪ Implementing a traffic calming strategy by installing bioretention curb bump-outs
▪ Enhancing park aesthetics by using native landscaping and soil amendments
▪ Replacing an antiquated roof with a green roof rather than traditional roof replacement
Economies of Scale
Economies of scale is a concept where cost savings can be achieved as the scope of construction increases. In construction, some examples are the ability to purchase materials in bulk, reducing number of mobilizations, and improving efficiency of labor. As savings can be achieved through incorporating GI into other capital improvements, savings can also be gained as the amount of GI practices implemented
The Milwaukee Metropolitan Sewer District (MMSD)
The MMSD Regional GI Plan analyzed the incremental GI cost compared to the cost of stand-alone projects. MMSD found that the cost of its GI Plan would be reduced by 40% if GI is incorporated into planned capital projects. This 40% cost savings equates to nearly $850 million.
The City of Lancaster
A case study for the City of Lancaster, Pennsylvania concluded that the incremental cost for including GI into planned capital improvement projects over the next 25 years is estimated to be $77 million compared to $141 million for installing standalone GI. In other words, incorporating GI into other construction projects could reduce the cost of implementing the plan by 45%.
Evaluating GI: A CSO Control Alternative for LTCPs January 2018
increases. A single GI practice will have a small effect on CSO volume reduction; however, many practices installed throughout a sewer system can have a cumulative effect, resulting in a significant impact on CSO reduction. Thus, GI installed as part of a long term control plan for CSO reduction will likely see the benefits of economies of scale due to the need for large scale implementation. Additionally, GI is a relatively new endeavor and may be unfamiliar to contractors. As familiarity rises amongst contractors, construction costs of GI may potentially decline.
Benefits of Green Infrastructure
The benefits associated with GI can either be economic, social, or environmental. Simply comparing the capital costs of green vs. gray infrastructure does not provide the complete picture for decision makers, the public, and ratepayers. The numerous added benefits of GI are expansive; however, many can be difficult to assign a dollar value. The collection of these benefits is known as the triple bottom line (TBL). Figure 6-1 illustrates the overlapping of economic, social, and environmental benefits as they converge towards sustainability.
Figure 6-1: Triple Bottom Line Analysis
A TBL analysis is a crucial component in making an informed decision and should be examined in the decision-making process for GI. The TBL benefits will benefit the overall community and the ratepayers. Below is a list of benefits expected with GI implementation. This list is not intended to be exhaustive, and local communities may identify additional TBL benefits that they may want to quantify:
Evaluating GI: A CSO Control Alternative for LTCPs January 2018
▪ Optimizes scale of gray or traditional infrastructure
Social
▪ Improves aesthetics and quality of life
▪ Increases recreational opportunities
▪ Promotes public cohesion and education
▪ Increases urban green spaces
▪ Reduces stress
▪ Reduces urban heat island effect
Environmental
▪ Improves water quality by reducing pollutant loadings
▪ Improves air quality
▪ Reduces carbon emissions
▪ Increases groundwater recharge
▪ Reduces surface and basement sewage flooding
▪ Reduces salt use (pervious paving systems impede frost layers forming)
▪ Provides wildlife habitat
There are several benefit calculation methods, as well as, different calculation software commercially available to help quantify TBL benefits. It is encouraged to become familiar with the available software and calculation methods. One example is the Envision™ framework which is becoming an increasingly used and industry-wide approach to evaluating TBL benefits. Utilizing a defined rating or evaluation system allows users to assess a project according to a common sustainability framework. TBL companion software to Envision™, such as AutoCase or other examples, may be used to quantify the associated TBL
Evaluating GI: A CSO Control Alternative for LTCPs January 2018
benefits. In some cases, custom calculations specific to the local community may need to be used. Representing these benefits as a monetary value can vary in complexity and may first require a general approach:
Step 1: Quantify the Benefit
▪ Calculate the quantity of the benefit, typically on an annual basis. For example:
□ Volume of stormwater reduced each year
□ Reduction in energy usage each year
□ Number of GI related jobs created each year
□ Number of acres of impervious area managed by GI
□ Number of acres of GI practices to be implemented
□ Acres of increased urban green spaces
Step 2: Determine Procedure to Monetize the Benefit
▪ Determine the procedures for calculating the monetary value of the benefit. For example:
□ Avoided cost per gallon to treat/pump wastewater ($/gal)
□ Avoided energy costs ($/kWh)
□ The economic value of increased jobs
□ Reduction in air pollution and carbon emissions costs
□ Reduction in cost damages from reduced surface and basement sewage flooding
□ The social value of increased green spaces
Step 3: Calulate the Monetary Value of the Benefit
▪ Using the information determined in steps 1 and 2, a monetary value can be estimated. As discussed, commercial software is available to calculate monetary values of the TBL benefits or manual calculations can be performed.
▪ A summary of the overall TBL benefits, both monetized and non-monetized, where applicable, should then be provided.
A variety of benefits should be evaluated to accurately depict the monetary benefits that can be seen with the implementation of GI. While addressing computation methods for all of the benefits listed is beyond the scope of this guidance document, assessment of the following benefits is suggested and is discussed below.
Evaluating GI: A CSO Control Alternative for LTCPs January 2018
GI, most notably vegetated practices, can sequester carbon and remove air pollutants from the air. This removal of air pollutants such as carbon monoxide (CO), carbon dioxide (CO2), sulfur dioxide (SO2), nitrogen dioxide (NO2), ozone (O3) and fine particulate matter with diameters 2.5 micrometers or less (PM2.5) provides environmental and social benefits. Additionally, GI can provide reductions in energy usage by reducing surrounding air temperatures or providing insulation, thus resulting in avoided electricity, natural gas, propane and diesel. The reduced energy usage also contributes to reductions in carbon and air pollutant emissions and improvement in air quality.
Heat Island Mortality Reduction
GI can reduce temperatures in urban environments by replacing impervious covers with vegetation. The reduction in heat can be estimated as well as the avoided deaths over the length of the project from the heat reductions. Utilizing the EPA’s Value of Statistical Life (VSL) Method which assigns value to lives saved, a financial benefit can be determined.
Recreational Use Benefit
GI projects that provide additional green space for recreational use provide an added social benefit to the community. By estimating the increased total user days after implementation and multiplying this value with the Willingness to Pay (WTP) of users, a benefit can be calculated. Upon implementation, these numbers can be improved with actual survey data or site specific recreational usage data. It should be noted that only the GI which increases recreational usage should be quantified. For example, bioretention system in a parking lot island does not increase recreational space.
Property Value Uplift
Managing runoff from impervious surfaces and improving aesthetics can provide an increase in property value. In order to assess property value increase, the following information needs to be obtained:
▪ City population
▪ Average persons per household
▪ Average property value
▪ Total acres of GI
▪ Total city area in acres
This information can be used to determine a scaling factor represented as a ratio of GI practice footprint to city area. Double counting of value uplift can occur when accounting for other TBL benefits, so accounting for this double counting appears to be standard procedure when performing this calculation. Others have assumed a 50% discount rate in the property value uplift calculation to avoid double counting. Uplift factors from various sources as a result of GI can be seen in Table 6-8 below.
Evaluating GI: A CSO Control Alternative for LTCPs January 2018
Table 6-8: Summary of Impacts on Property Prices from LID (GI) Projects
Reference Uplift Value from 100% Low Impact
(GI) Design
Low Expected High
Ward et. al. (2008) 3.5% 4.3% 5.0%
Shultz and Schmitz (2008) 0.7% 1.1% 2.7%
Wachter and Wong (2006) - 2.0% -
Anderson and Cordell (1988) 3.5% 4.0% 4.5%
Braden and Johnston (2003) 0.0% 2.5% 5.0%
As an example: A City of 100,000 people and 2.6 person per household = 40,000 households. An average property value of $100,000 is assumed. If there are 10 acres of GI in the 1000-acre city area this would give a scaling factor of 1%. For a property uplift factor of 2.5% and a 50% possible double counting, the uplift is 1.25%. The calculation would be:
40,000 ∗ $100,000 ∗ 1% ∗ (2.5% ∗ 50%) = $500,000
Reference Documents for Benefit Calculation
The Center for Neighborhood Technology’s The Value of Green Infrastructure: A Guide to Recognizing Its Economic, Environmental, and Social Benefits provides detailed calculation approaches for the following benefits:
The Natural Resources Defense Council (NRDC) released The Green Edge: How Commercial Property Investment in GI Creates Value in December 2013. This report outlines the potential benefits (quantifiable and non-quantifiable) to property owners that implement GI. The report provides examples of methods to determine quantified benefits such as energy savings, avoided conventional/replacement costs, and increased rental income.
As stormwater runs over different surfaces (fertilized lawns, roadways, parking lots, etc.) it gathers anthropogenic pollutants (e.g. phosphorus from fertilizer application, oils, greases, metals, etc.) along with naturally occurring pollutants (e.g. total suspended solids). Properly designed GI mimics natural hydrologic processes that can reduce some of these pollutants. The removal potential for each pollutant will vary for different kinds of GI practices. Further, pollutant removal potential can also vary based on site-specific conditions such as rainfall patterns, local soil conditions, and design components.
GI practices provide multiple mechanisms to remove pollutants including, but not limited to: sedimentation and filtration, sorption and precipitation, biological degradation and vegetative uptake.
Sedimentation and Filtration
Sedimentation is a process driven by gravity that settles suspended particles out of the water. Filtration removes particles through a physical process that only allows the passage of water and certain sized particles. A number of parameters have effects on removal potential such as particle size, detention time and filter material (e.g. bioretention media, stone, soil). The pollutants targeted are:
▪ Total Suspended Solids (TSS)
▪ Metals, organics, and pathogens absorbed to soil particles (e.g. polychlorinated biphenyls (PCBs))
▪ Suspended phosphorus
Sorption and Precipitation
Sorption encompasses adsorption (physical process of molecules adhering together) and absorption (process of molecules entering another substance). Factors within the GI practice such as pH, chemical and organic content, and available treatment surface areas can have effects on removal potential. The pollutants targeted are:
▪ Dissolved metals and organics
▪ Orthophosphate
▪ Ammonia
▪ Pathogens
Biological Degradation
Biological degradation involves any microbial process that breaks down organic and inorganic compounds found in stormwater runoff. Examples include nitrification and denitrification processes within the GI practice soil profile. Factors that influence the removal capabilities of microbial communities are oxygen concentrations, available nutrients and organic material, temperature and salinity (e.g. influenced by road salting or in tidal areas). The pollutants targeted are:
▪ Organic and inorganic compounds
Evaluating GI: A CSO Control Alternative for LTCPs January 2018
In GI practices with vegetation, plant roots soak up pollutant-laden stormwater, removing the pollutants from the water. The types of vegetation used will cause some variation in removal potential. The pollutants targeted are:
▪ Excess nutrients (e.g. fertilizers)
▪ Heavy metals
▪ Hydrocarbons
Quantifying Water Quality Improvement with Green Infrastructure
In CSO communities, reducing the amount of stormwater that enters the sewer system provides major benefits to water quality; as this will ultimately reduce CSO discharge volumes to nearby waterbodies. The pollutant removal capabilities of GI can also improve water quality by helping to treat the stormwater before it reenters the sewer system, thereby reducing the pollutant loading to the treatment plant. Generally, the pollutants of focus associated with stormwater runoff are total suspended solids, total phosphorous, total nitrogen, and heavy metals. Removing these pollutants from stormwater discharges to nearby waterbodies can also improve wildlife habitat, prevent eutrophication, and improve aquatic ecosystems. Quantifying the pounds of each pollutant potentially removed annually should follow this general approach:
Utilize a computer-based model to delineate the different land covers in the sewer system. Determine an annual loading rate for each type of land cover and calculate an annual loading mass in pounds per year to the sewer system. See Table 6-9 for pollutant loadings for total phosphorus, total nitrogen, and TSS.
Evaluating GI: A CSO Control Alternative for LTCPs January 2018
Table 6-9: Pollutant Loadings by Land Use Category
Land Cover Total Phosphorus
(lbs/acre/yr) Total Nitrogen (lbs/acre/yr)
Total Suspended Solids (lbs/acre/yr)
High, Medium Density Residential
1.4 15 140
Low Density, Rural Residential
0.6 5 100
Commercial 2.1 22 200
Industrial 1.5 16 200
Urban, Mixed Urban, Other Urban
1.0 10 120
Agriculture 1.3 10 300
Forest, Water, Wetlands
0.1 3 40
Source: New Jersey Stormwater BMP Manual
Step 2: Determine Pollutant Removal Potentials
Unlike in a wastewater treatment facility where the environment is controlled, GI practices operate under constantly changing environmental conditions (temperature, moisture, etc.) making pollutant removal capabilities difficult to predict. Nonetheless, it is important to determine a reasonable removal potential for GI practices. Refer to the NJ Stormwater BMP Manual for pollutant removal potentials.
Step 3: Determine Annual Pollutant Removals
With the annual loadings and respective pollutant removal potentials determined, the final step will be to determine how much of each pollutant will be removed annually.
Utilize the following equation to determine the annual pollutant loadings that will be treated by GI:
The amount of pollutant removed annually (lb/year) can be determined by taking the annual loading calculated above for each pollutant and multiplying against the relevant pollutant removal potentials for the GI practice being employed. For example, consider an infiltration basin with a TSS removal efficiency of 80% that captures 0.5 acres of commercial land use cover. The amount of TSS removed will be calculated as follows:
Evaluating GI: A CSO Control Alternative for LTCPs January 2018
Once the pollutant loads removed annually are calculated, a percent reduction of annual pollutant loading for the sewershed can be determined for each pollutant. There are additional benefits associated with avoided wastewater treatment costs that were discussed on a volume basis. These avoided costs can be taken a step further by considering the avoided costs to treat the pollutant loads specifically ($/lb. Pollutant Treated).
Green-Gray Infrastructure Integration Analysis Example
Implementation of green integrated with gray infrastructure can provide a solution to CSO mitigation while also providing ancillary benefits. In order to understand how GI can be used to complement gray infrastructure it is important to evaluate both types of infrastructure in an integrated fashion. One root cause of CSOs is limited wet weather treatment capacity at the wastewater treatment plant (WWTP). Often, the existing installed conveyance capacity exceeds the wet weather treatment capacity at the WWTP, which leads to elevated hydraulic grade lines upstream of the treatment facility resulting in overflows. If the existing installed conveyance capacity is then matched by adding additional wet weather treatment capacity at the WWTP (or in some cases at remote locations), these green-gray integrated solutions can then result in low cost per gallon of overflow reduction solutions. Integrating and coupling these types of increased wet weather treatment capacity solutions with GI can then allow the GI to be optimized to capture a part of the difference in overflow volume to meet the target wet weather sewage volume capture. Below is an example of the hydraulic analysis that can be conducted to integrate green and gray infrastructure to reduce overflow volume. The example shows a range of wet weather treatment capacities at a hypothetical WWTP. This analysis could also be performed for remotely located wet weather treatment depending on the local system hydraulics. Figure 6-2 represents a performance curve for a number of wet weather treatment capacities at a hypothetical WWTP. These treatment capacities are then coupled with different amounts of GI to reach the target wet weather volume capture. The vertical axis is the amount of overflow volume and the two horizontal axes represent the amount of GI implemented; shown as both impervious acres managed and percentage of impervious area managed by GI. Each line on the graph represents a wet weather treatment capacity ranging from 250 MGD up to the theoretical maximum capacity. The horizontal dashed lines represent example levels of wet weather volume capture ranging from 75% to 95% capture. The purple line then represents the GI construction cost associated with the amount of impervious area managed under each wet weather treatment capacity indicated.
Evaluating GI: A CSO Control Alternative for LTCPs January 2018
▪ Increasing the wet weather treatment capacity from 250 MGD to 480 MGD with no GI reduces overflow volume from approximately 3,100 MG to 2,500 MG.
▪ Increasing the wet weather treatment capacity from 250 MGD to 600 MGD with no GI reduces overflow volume from approximately 3,100 MG to 1,700 MG.
▪ At a 480 MGD WWTP wet weather treatment scenario (green line), to meet 85% wet weather volume capture, the level of GI investment would be approximately 47% of the existing impervious area managed with GI (~1,800 impervious acres). Then reading up from the green line to the purple cost line, the associated GI capital cost would be approximately $550M.
▪ At a 600 MGD WWTP wet weather treatment scenario (orange line), to meet 85% wet weather volume capture the level of GI investment would be approximately 8% of the existing impervious area managed with GI (~350 impervious acres). Then reading down from the orange line to the purple cost line, the associated GI capital cost would be approximately $100M.
▪ At a 600 MGD WWTP wet weather treatment scenario (orange line), to meet 90% wet weather volume capture, the level of GI investment would be approximately 45% of the existing impervious area managed with GI (~1,600 impervious acres) at a GI capital cost of approximately $500M.
▪ Under the theoretical maximum wet weather treatment scenario (red line), 85% wet weather volume capture could be achieved with no GI investment required. 90% wet weather volume capture could be achieved by managing approximately 1,250 impervious acres with GI at a capital cost of approximately $390M.
It should be noted that Figure 6-2 is for illustration purposes only. The GI costs and wet weather capture percentages indicated are just examples and do not supersede local costs and regulatory requirements.
Evaluating GI: A CSO Control Alternative for LTCPs January 2018
Analyzing the cost-benefits of GI integrated with gray infrastructure can be performed by developing performance curves like this example. Since this analysis only includes the capital costs of the GI program, it is necessary to calculate the total costs associated with the GI program by adding in operation and maintenance costs and replacement costs. The results of the triple bottom line benefit analysis can then be compared to the total cost information to give a more robust understanding of the cost-benefit relationship of the GI program. This information can then be used in the decision-making process when comparing the various alternatives in the development of the LTCP.
Evaluating GI: A CSO Control Alternative for LTCPs January 2018
Chapter 7 Financing Green Infrastructure Page 1
7 FINANCING GREEN INFRASTRUCTURE Overview
Green infrastructure (GI) projects and programs can be funded by a wide-range of financing strategies due in part to the many sources of funding that the benefits of green infrastructure attract. Traditional financing methods such as loans and bonds may be utilized, as well as GI standards for development or redevelopment projects or rebates and incentives for residential and commercial property owners that install GI directly. This chapter provides a summary of potential financing methods, as well as website references and case studies of possible funding strategies and resources. The figure below illustrates the different financing methods:
Development Standards and/or Ordinances
Development Standards
Development standards imposed by the municipality or sewer authority can help achieve desired LTCP goals. The advantage to imposed development standards is that it requires the owner to pay the capital cost for GI rather than the sewer authority to treat the stormwater that originates from their site. The municipality or sewer authority should review its existing stormwater regulations and identify opportunities to modify the existing sewer connection requirements and the stormwater management
Evaluating GI: A CSO Control Alternative for LTCPs January 2018
Chapter 7 Financing Green Infrastructure Page 2
design criteria so to target reducing combined sewer overflows. This may entail different requirements for new development and redevelopment projects. For redevelopment projects that have challenges managing stormwater on site, the municipality could consider offering stormwater credits or a Fee in Lieu so that equivalent or greater stormwater management can be achieved offsite. In cases where the sewer authority cannot directly pass ordinances, the sewer connection conditions may be revised to require GI.
Case Study: The North Hudson Sewerage Authority owns and operates the combined sewer system within Hoboken, Weehawken, and portions of West New York and Union City, New Jersey. The Authority is requiring applicants who wish to connect or modify their permitted connection to the sewer to provide stormwater treatment that is more stringent than the State requirements set forth in N.J.A.C. 7:8. An online tool, illustrated below, has been developed which assists the applicant in determining necessary stormwater detention volume and control requirements. This tool encourages the use of GI through a credit system. It remains in draft format and is pending adoption by the Authority’s Board of Commissioners.
Evaluating GI: A CSO Control Alternative for LTCPs January 2018
Chapter 7 Financing Green Infrastructure Page 3
Ordinances
The Stormwater Management rules at N.J.A.C. 7:8, require every municipality to have an adopted stormwater control ordinance. The ordinance must be consistent with, and at least as stringent as, the regulations at N.J.A.C. 7:8. However, municipalities are able to adopt stormwater control ordinances more stringent than the state-wide regulations, which can be a mechanism to advance GI as a CSO control solution. Additionally, municipalities may grant a variance to projects subject to their municipal stormwater control ordinance that are not able to meet the design and performance standards on site, provided that the municipality has a stormwater management mitigation plan. Pursuant to N.J.A.C. 7:8, the mitigation plan must identify the measures necessary to offset the deficit created relative to the design and performance standards that would result from granting the variance or exemption on a given project. Mitigation plans must be adopted into the Municipal Stormwater Management Plan and a pool of specific mitigation projects should be developed so they can be selected by an applicant to offset the requested variance or exemption. An applicant can either perform a project from the mitigation plan or can provide financing for one of the projects when stormwater measures cannot be addressed on site. A well thought out mitigation plan could include GI projects that can also help to address a community’s CSO goals. Additional guidance for the development of municipal mitigation plans can be found here: http://www.nj.gov/dep/stormwater/pdf/munimitipplan030706.pdf.
Incorporating GI into New Development and Redevelopment Plans in the Community
Large-scale redevelopment can provide a unique opportunity for sharing the cost of GI between a private entity and a municipality.
Public Funding Programs
GI projects can be incorporated into other development or infrastructure projects to manage stormwater. By bundling GI into other projects, multiple funding sources can be leveraged and total project costs can be reduced through construction efficiencies. For example, small-scale GI practices such as street tree trenches could be incorporated into a street restoration project. Utility replacement projects that involve street or sidewalk restoration may also provide an opportunity to incorporate GI as an amenity to the
Case Study: Pittsburgh Water and Sewer Authority (PSWA) has created a stormwater GIS overlay map that identifies target priority areas throughout the city for managing stormwater to address both overflows and surface and basement sewage flooding. This overlay district is being used by the City of Pittsburgh’s planning department and other city departments in coordination with PWSA to coordinate stormwater management with responsible redevelopment in areas of the city. The overlay then allows for identifying ways to share the costs of GI and stormwater source controls between the private developers and the sewer ratepayers. Information can be found here: http://www.pgh2o.com/going-green.
Evaluating GI: A CSO Control Alternative for LTCPs January 2018
Chapter 7 Financing Green Infrastructure Page 4
community. Incorporating natural stormwater features into a street restoration project can also enhance urban corridors.
Public – Private Collaboration
Public-Private collaboration is an important tool to leverage funding and resources for the development and implementation of GI projects. Public agencies may be interested in collaborating on GI projects that involve parks, schools, recreation activities, or other public sites. Opportunities to collaborate with private institutions such as businesses or other private property owners may allow for the private sector involvement in capital financing, planning, and maintenance of GI features. These programs typically require a contractual agreement that addresses each party’s involvement and responsibilities.
Incentives
Local government incentives, such as grants or loans, may encourage property owners to install GI on privately owned property. These incentives may be one of the best approaches to spur the installation of GI in highly developed areas that are not likely to experience redevelopment projects. In Lexington Kentucky, the city offers grants for infrastructure that improves stormwater quality, reduces runoff or educates the public on the importance of treating stormwater. More information can be found at this link: https://www.lexingtonky.gov/incentive-grant-program.
Case Study: A community based private-public partnership was developed in Prince George's County, MD. The County entered into a 30-year agreement with Corvias Solutions and formed the Clean Water Partnership to meet the requirements of the Chesapeake Bay TMDL and the County’s MS4 permit. Through this partnership, Corvias is responsible for the design, construction, and maintenance of the stormwater assets. The County will be retrofitting approximately 15,000 acres of impervious surfaces at a cost of $1.2 Billion. More information can be found at the links below: https://www.epa.gov/G3/prince-georges-county-maryland-clean-water-partnership and https://thecleanwaterpartnership.com/.
Evaluating GI: A CSO Control Alternative for LTCPs January 2018
Chapter 7 Financing Green Infrastructure Page 5
Rebates
Since the majority of property in municipalities is privately owned, GI installation on private property can be critical in helping to meet GI goals. One way to encourage this is to offer rebates to homeowners to offset a portion of the cost of GI installation. For properties within targeted CSO overflow basins, the City of Seattle offers resources to residents to manage stormwater at their homes. The City of Seattle provides full rebates to eligible properties within the targeted areas of its CSO community to install approved stormwater control systems including rain gardens and cisterns. http://www.700milliongallons.org/rainwise/
Montgomery County Maryland has a Rainscape Rebate Program which is funded by the County and issues rebates up to $2,500 for residential projects and $10,000 for commercial projects that meet the Program design criteria. Funded features have included water harvesting projects, pervious paving systems, pavement removal, and conservation landscaping. https://www.montgomerycountymd.gov/water/rainscapes/index.html
Case Study: In Washington DC, the Riversmart Program encourages homeowners to reduce stormwater runoff. The program requires the homeowner to meet with the city inspector to discuss ways to improve stormwater management on their property. Homeowners provide a co-payment directly to a certified contractor for the installation of one or more approved stormwater features, including use of rain gardens, pervious paving systems, bayscaping, and shade tree planting. The contractor is paid by the program for the remainder of the service cost. https://doee.dc.gov/service/riversmart-homes-overview
Case Study: The Rutgers Cooperative Extension (RCE) Water Resources Program partnered with the New Jersey Water Supply Authority (NJWSA) to implement a rain garden rebate program piloted in Somerville, Bridgewater, Raritan, and Hillsborough in NJ. Provided that homeowners attend a community workshop, a technical workshop for rain garden design assistance, and install the rain garden, they are then qualified to apply for a rebate of $3 per square foot of garden up to $450. Homeowners also have the option to design their own garden and have it approved by the RCE Water Resources Program. Twenty-nine rain garden have been installed on homeowners’ properties since the start of the program. For more information, visit: http://water.rutgers.edu/Projects/RGRebate/RGRebate.html
Evaluating GI: A CSO Control Alternative for LTCPs January 2018
Chapter 7 Financing Green Infrastructure Page 6
General Funds
Nationally, most municipal stormwater and GI programs are funded by general revenues which come from the local real estate or property taxes that are collected based on property value. Reserving these funds for GI will greatly depend on local needs. The funding allocation will typically change annually which makes it difficult to ensure the continuity of a GI program.
Bonds
Selling bonds is a traditional approach for funding infrastructure projects. Green Bonds are like traditional bonds; however, all investments are specifically for environmentally sustainable programs. Green bonds are also backed by credit ratings through Moody’s Investors Service, Standard & Poor’s and Fitch Ratings. The stipulations for funding and credit rating of each program varies. The World Bank green bond is geared to support environmental projects. As of November 2016, the World Bank has raised over 500 million dollars to finance environmental projects including watershed management and infrastructure to prevent flood damage. Information can be found at this link: http://treasury.worldbank.org/cmd/htm/World-Bank-USD-500-Million-Green-Bonds-Support-Global-Climate-Action.html
Federal & State Funding Sources
Federal and State funding supports numerous programs and agencies, subject to annual budgeting allocations. A listing of relevant federal and state funded programs is included below.
State Revolving Fund Program Loans
The Clean Water State Revolving Fund (CWSRF) is a well-known federal-state partnership that provides communities a long-term source of low-interest financing for a wide range of water quality infrastructure projects. In New Jersey, the CWSRF federal-state partnership is administered jointly through the NJDEP and the New Jersey Environmental Infrastructure Trust as the New Jersey Environmental Infrastructure Financing Program (NJEIFP). The interest rate on the loans, provided by this program, is approximately one-fourth the market rate for a 20-year loan or 30-year loan term. Applications are accepted on a rolling basis. A letter of intent and project planning and design documentation are required.
In State Fiscal Year 2018, the financing package for CSO Green Infrastructure or Abatement projects consists of 50% principle forgiveness, 25% zero interest loan, and 25% market rate loan. With the grant-like principle forgiveness, this financing package provides a project savings of approximately 57%, which can be passed along to rate payers. There a number of ways that GI can be incorporated into a project. It can be:
• a centralized GI project, such as a resiliency park or green street project;
• a group of practices distributed throughout an area, such as rain gardens and street trees;
• a stand-alone project, such as replacement of impervious pavement with pervious paving systems;
Evaluating GI: A CSO Control Alternative for LTCPs January 2018
Chapter 7 Financing Green Infrastructure Page 7
• included as part of a green/grey project with other necessary infrastructure upgrades. For example, stormwater pipe replacement, removal of buried utilities, and construction of street tree planters and pervious concrete sidewalk;
• included as part of a private development project, through a municipality or utility authority as a conduit via a public/private partnership.
The funding of these projects has historically been selected on a priority ranking basis. The funding available for these projects is approved each year by the NJDEP. Additional information about the program and application process can be found on their website at http://www.nj.gov/dep/grantandloanprograms/er_eifp.htm.
Case Study: Camden County Municipal Utilities Authority (CCMUA), collaborating with Camden Stormwater Management and Resource Training (SMART) Initiative, obtained funding from the New Jersey Environmental Infrastructure Financing Program (NJEIFP) for green infrastructure projects in Camden, NJ. The loans were approximately $4 million each; for each loan $2 million in principal forgiveness was received and the remaining balances were funded with a 20-year loan at less than 1% interest. These projects included rain gardens, stormwater planters, pervious paving systems, downspout planter boxes, cisterns, infiltration trenches, and tree pits implemented on public and municipal property. In phase 2 of the project, Phoenix Park (two phases), Von Nieda Park and Baldwin’s Run Stream Daylighting Project were implemented. For more information on these projects visit: www.camdensmart.com
Source: Rutgers Cooperative Extensions Water Resources Program
Evaluating GI: A CSO Control Alternative for LTCPs January 2018
Chapter 7 Financing Green Infrastructure Page 8
Environmental Protection Agency Funding Programs
General EPA funding programs cover a large range of environmental initiatives. The EPA maintains a website which summarizes financial tools available to communities for funding water infrastructure programs and projects: https://www.epa.gov/waterfinancecenter/water-finance-clearinghouse. A useful reference for EPA related grants is on their website: https://www.epa.gov/grants. The EPA also maintains an additional website that provides additional information on GI funding. https://www.epa.gov/green-infrastructure/green-infrastructure-funding-opportunities Funding for GI projects through EPA specific programs is case specific and can include additional program requirements, as described in a few EPA programs below.
EPA Urban Waters Small Grants
Since its inception in 2012, this program has awarded over 100 communities small grants up to $60,000 to support community urban water quality in underserved communities, including GI programs. New Jersey specific awards have been granted to the City of Elizabeth and City of Newark for non-CSO related projects. https://www.epa.gov/urbanwaters/urban-waters-small-grants
Clean Water Act, Section 319(h) Grants
This program is supported through the Clean Water Act, which allocates funding to each state to reduce water quality impairment through non-point source pollution control. The NJDEP manages the monetary disbursement. As mandated by the federal rule, the state is required to distribute at least one-half of the funding received to projects with approved watershed plans. Approved watershed plans can be found at http://www.nj.gov/dep/wms/bears/npsrestgrants.html. A request for proposals is issued each year which details the specific NJDEP annual funding goals. Historically, the NJDEP holds workshops prior to the upcoming application deadline to provide additional guidance. As reported on the NJDEP website, applicants whose projects are considered to be eligible, and best align with funding priorities are selected. This program distributes approximately $2.5 million in grants, annually, subject to federal funding allocations. http://www.nj.gov/dep/wms/bears/npsrestgrants.html.
Evaluating GI: A CSO Control Alternative for LTCPs January 2018
Chapter 7 Financing Green Infrastructure Page 9
HUD Community Development Block Grant Program
The U.S. Department of Housing and Urban Development (HUD) Community Development Block Grant (CDBG) program allocates grants for entitlement communities. These entitlement grants are approved for communities which meet criteria for low- and moderate-income persons. A directory of links to the
sites of HUD CDBG approved entitlement communities in New Jersey is as follows: https://portal.hud.gov/hudportal/HUD?src=/states/new_jersey/community/njentitlements. The CDBG grant program includes funding for infrastructure and public improvements in addition to expansion of economic opportunities. CDBG-financed projects can incorporate components of GI. For example, The City of Chicago used CDBG funding to put a new green roof on its historic Cultural Center. A directory of links to the sites of HUD CDBG Entitlement Communities in New Jersey is as follows: https://portal.hud.gov/hudportal/HUD?src=/states/new_jersey/community/njentitlements. The New Jersey-based CDBG grant program is administered through the New Jersey Department of Community Affairs. Information can be found at http://www.nj.gov/dca/divisions/dhcr/offices/cdbg.html.
Case Study:\Between 2009 and 2011 the City of Newark partnered with the Rutgers Cooperative Extension Water Resources Program to implement green infrastructure training programs and complete four green infrastructure projects in the City of Newark, through a 319(h) grant of $200,000. Resulting from the initial efforts to promote green infrastructure, a community based green infrastructure initiative, Newark Doing It Green (Newark DIG) was formed. Subsequent funding of $312,518 received in 2013 through the grant program helped to advance the community green infrastructure program and install green infrastructure at community areas, residential sites, and schools.
Source: Rutgers Cooperative Extension Water Resources Program
Evaluating GI: A CSO Control Alternative for LTCPs January 2018
Chapter 7 Financing Green Infrastructure Page 10
Other Potential Grant Funding
Private grant funding may also be available for GI projects. One example of a private grant opportunity is through the SURDNA Foundation. This funding program specifically targets urban water management and pilot projects that demonstrate innovative stormwater practices. See more information at the link below: http://www.surdna.org/what-we-fund/sustainable-environments/urban-water-management.html.
Evaluating GI: A CSO Control Alternative for LCTPs January 2018
Closing Statement Page 1
CLOSING STATEMENT Successful use of green infrastructure as part of a long term control plan will require public and stakeholder education and a holistic approach to stormwater management and CSO abatement. While not directly related to the permit requirements, the social, economic, and additional environmental benefits that result from green infrastructure can drive implementation when coordinated with other immediate and long-term capital improvements and community planning and revitalization efforts. A thorough understanding and optimization of the existing combined and separate sewer systems in conjunction with strategically managing stormwater at the source with green infrastructure can result in reduced peak flows, CSO reduction, and reduced surface and basement sewage flooding while also yielding triple bottom line benefits for the local community. The natural processes used by green infrastructure can reduce, detain, infiltrate and harvest stormwater runoff to manage rainfall close to its source thereby reducing runoff and preventing pollutants from being collected and concentrated in discharges to the downstream water resources. There is ample public interest in green infrastructure and numerous funding opportunities and financing mechanisms available to permittees. Incentivizing stormwater management on private property and enforcing maintenance of those practices can be an essential component of the long term control plan. When using combinations of green and grey infrastructure, an adaptive management strategy to meeting long term control plan goals should be considered. While the implementation and maintenance of green infrastructure may be unfamiliar early on, development of standards and workflows can facilitate, expedite, and reduce the costs of green infrastructure planning, design, and construction. In addition, maintenance protocols can be continually improved and results from pre and post-construction monitoring programs via adaptive management can inform and enhance the design and construction of future projects.
APPENDIX A: RECOMMENDED GI PLANT INFORMATION
Recommended GI Plant Information
Common Name Genus Species Height
Bloom Color
Bloom Start
Bloom End
Spicebush, Wild allspice Lindera benzoin 6 – 12’
white, yellow April April
Marsh marigold, Yellow marsh marigold, Cowslip Caltha palustris 1 – 3’ yellow April May
Kinnikinnick, Red bearberry Arctostaphylos uva-ursi 1 – 3’ white, pink March June
Common Winterberry Ilex verticillata 6 – 12’
white flowers, red berries April July
Highbush blueberry Vaccinium corymbosum 6 – 12’ pink, white May June
Arrowwood Viburnum dentatum 6 – 12’ white May July
Harlequin blueflag, Northern blue flag,
Large blue iris Iris versicolor 1 – 3’ blue, purple May August
Sweet fern Comptonia peregrina 3 – 6’ white, green May August
Deertongue Dichanthelium clandestinum 3 – 6’ green stems May September
Cardinal flower Lobelia Cardinalis 3 – 6’ red May October
Allegheny monkeyflower, Monkeyflower, Square-stemmed monkeyflower Mimulus ringens 1 – 3’ blue, purple June September
Common Buttonbush Cephalanthus occidentalis 6 – 12’ white, pink June September
Inkberry Ilex glabra 6 – 12’ white flowers, black berries June September
Woolgrass, Cottongrass bulrush Scirpus cyperinus 3 – 6’ green, brown June September
Swamp milkweed, Pink milkweed Asclepias incarnata 3 – 6’ pink, purple June October
Blue vervain, Swamp verbena Verbena hastata 3 – 6’ blue, purple June October