Valuation 11: Benefit Transfer and Meta- Analysis • Why benefit transfer? • Different types of benefit transfer – Value transfer – Function transfer • Validity and sources of error • Examples
Transcript
Valuation 11: Benefit Transfer and Meta-
Analysis• Why benefit transfer?• Different types of benefit transfer
– Value transfer– Function transfer
• Validity and sources of error• Examples
Last weeks we looked at
• Various methods to estimate the value of environmental goods and services not traded on markets
• Also, some empirical examples were shown• It turned out that it is actually very hard to
reliably estimate prices – one needs many assumptions, good data, and smart statistics, and even then all sorts of things may go wrong
What is benefit transfer?
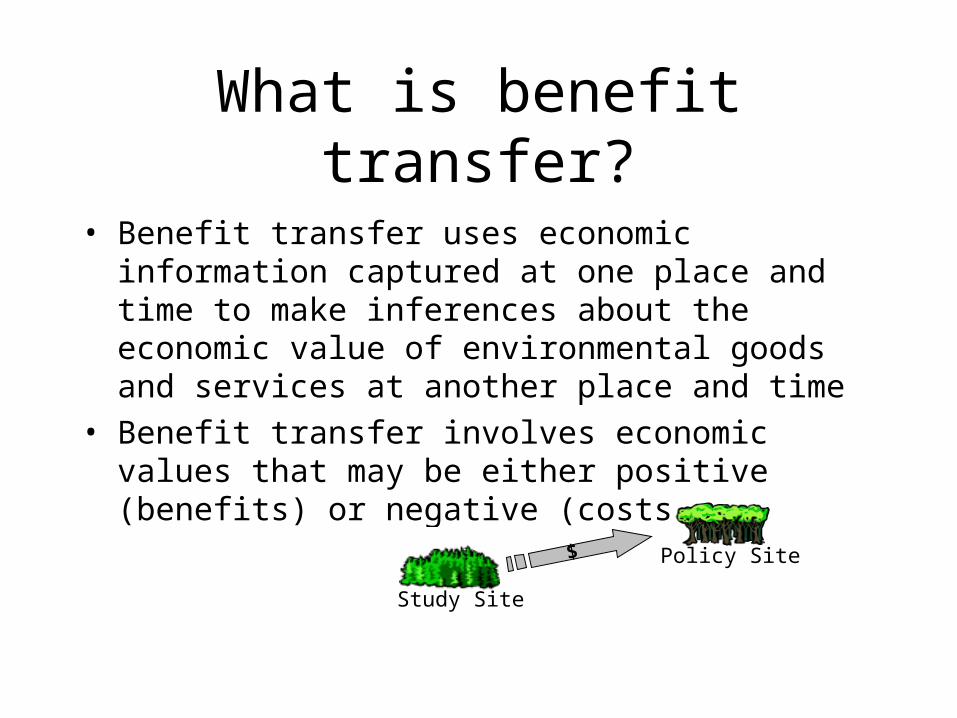
• Benefit transfer uses economic information captured at one place and time to make inferences about the economic value of environmental goods and services at another place and time
• Benefit transfer involves economic values that may be either positive (benefits) or negative (costs)
Study Site
Policy Site$
Why benefit transfer?• Valuation is hard• As a result, applied valuation studies are
expensive• A small hedonic pricing study, for instance, costs
about a year of a PhD student – that is, after the data have been collected and digitised
• Ditto for travel costs• A contingent valuation study is more expensive• Monetary values are also hard needed• Wouldn't it, therefore, be nice if we could take the
estimated values of case 1 and apply them to case 2?
History• Environmental benefit transfer came into being
only once the non-market literature itself grew large enough to allow comprehensive synthesis and cross-study comparison
• In 1973, the U.S. Water Resources Council began publishing unit day estimates for recreation activities relates to water projects
• In 1980, the U.S. Forest Service began publishing Resources Planning Act values for recreation (per person per day)
• First synthesis study mid to late 1980s• Today, applied to issues involving values for
recreation, water quality, fishing, air quality, wetlands, biodiversity
Value Transfer
Single point transfer
Measure of central tendency
Single point transfer adm. approved
Benefit/ Demand Function
Meta-Analysis Function
Use estimate at policy site
Adapt function to policy site
Use tailored estimate at policy site
Function Transfer
Types of BT
The basis for any benefit transfer analysis
• The basis is a formal literature review • The original research studies are screened for
– relevance– how well they correspond to the policy context– the quality of research– what kind of information is provided
• Advantages include a much larger sample of data, different analytical techniques, and different analysts
• The main disadvantage is that one typically only has access to published results, which are always incomplete
Value transfer: Point estimates
• Point estimate transfer typically uses a single measure
• Example: The U.S. Army Corps of Engineers was considering the removal of four dams on the Lower Snake River from its confluence with the Columbia River
• One of the benefits would be the restoration of spawning habitat for native salmon populations (by about 47,500 fish)
• The agency was interested in the passive use value based on per household annual WTP
• The literature search found four studies that provided values for salmon population
Study Study Site Context
I ncrease in
salmon
population
Sample
f rame
WTP per
HH (1998$)
Marginal
passive use
value per fi sh
Olsen et al.
(1991)
Doubling of Columbia
river basin salmon and
steelhead population
2,500,000 I D, MT,
OR, WA
$32.52 $163
Hanemann et al.
(1991)
I ncreasing salmon
population on the San
J oaquin river
14,900 CA $221.96 $186,829
Loomis (1996) I ncreasing salmon
population on the Elwha
River due to dam
removal
300,000 WA $76.48 $3,197
Layton et al.
(1999)
I ncreasing anadromous
fi sh population on the
Columbia River
1,000,000 WA $119.04 $1,492
Layton et al.
(1999)
I ncreasing anadromous
fi sh population on the
Columbia River
250,000 WA $227.64 $11,420
Other value transfer
• The measure of central tendency entails using a mean, median or other measures of central tendency based on all or a subset of original research outcomes– Same example as above; great disparity between
average marginal passive use value ($40,620) and median value ($3,197)
• Administratively approved estimate transfer is the simplest approach– Estimates are derived from empirical evidence in the
literature, expert judgment, and political screening– Problems: Criteria for political screening are
unknown, selection might be biased and only updated every so often
Function transfer• Value transfer requires a strong similarity
between the study site and the policy site is required
• Function transfers are generally considered to perform better than value transfers
• Unlike value transfers, they may be tailored to fit some of the characteristics of the policy site
• Function transfers entails the application of a statistical function that relates the summary statistics of original research to the specifics of the study site
• There are two types of function transfers– Demand/Benefit function transfer– Meta-regression analysis
Demand/benefit function transfer
• For benefit function transfer additional information is required
• We need a function that models the statistical relationship between the summary measures of interest and characteristics of the original site
• This function is then adjusted to specific characteristics of the policy site
( , , )environmentpopulation goodWTP f X Y Z
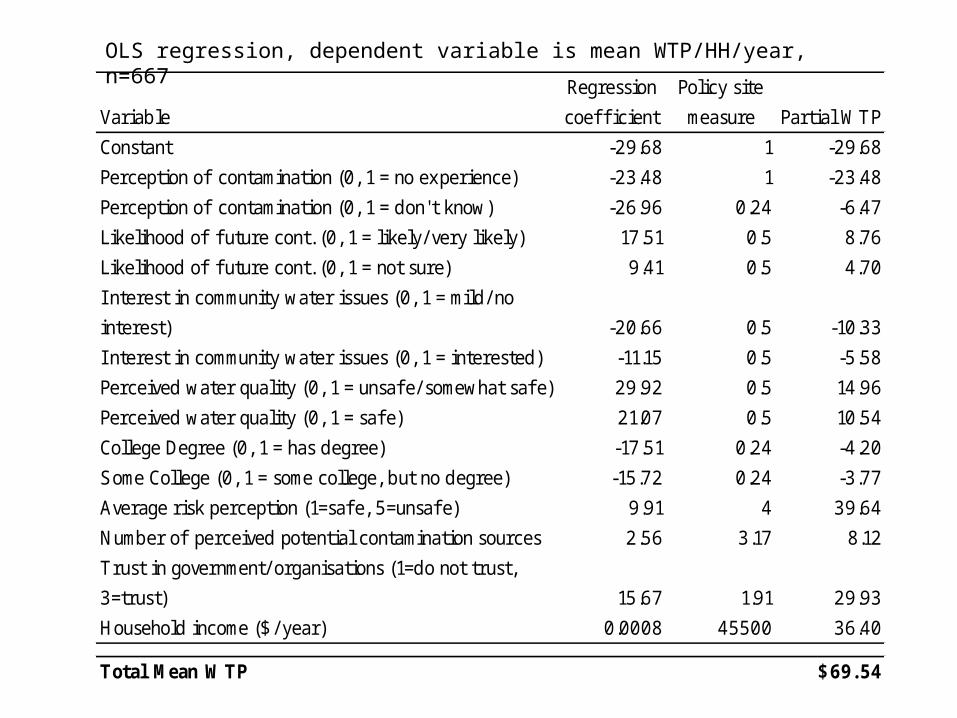
Example• Case study by VandenBerg, Poe and Powell
(2001) estimates the benefits of improving groundwater quality used for drinking to a very safe level in 12 towns in New York, Massachusetts, and Pennsylvania
• The authors use a contingent valuation survey with a payment card question format
• To perform the benefit function transfer all of the survey data except for one town are pooled and a WTP equation is estimated
Variable
Regression
coeffi cient
Policy site
measure Partial WTP
Constant -29.68 1 -29.68
Perception of contamination (0, 1 = no experience) -23.48 1 -23.48
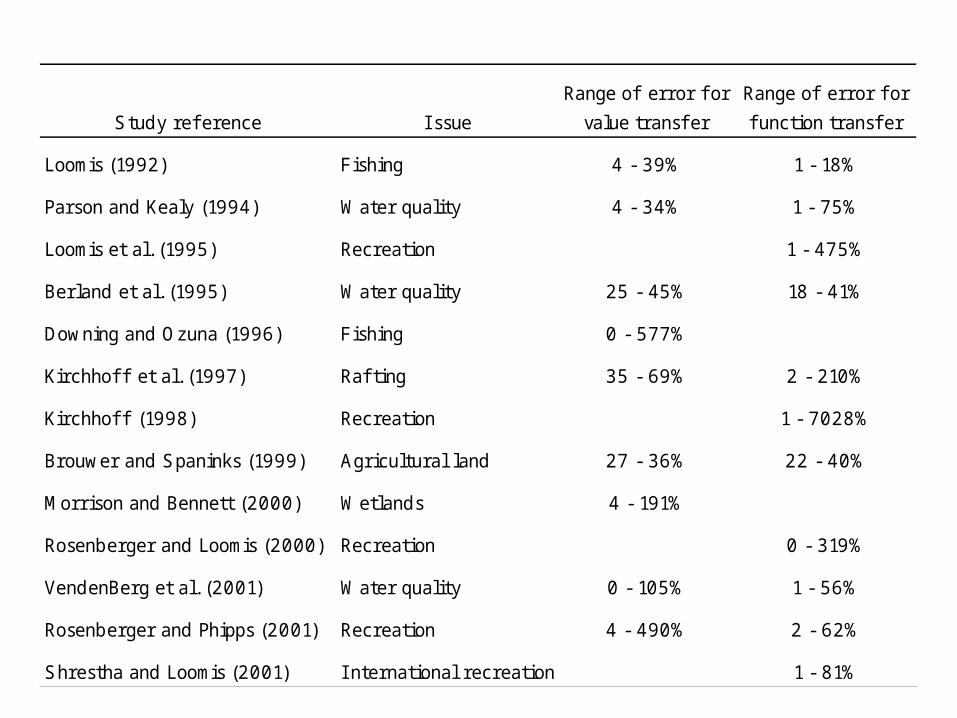
Shrestha and Loomis (2001) I nternational recreation 1 - 81%
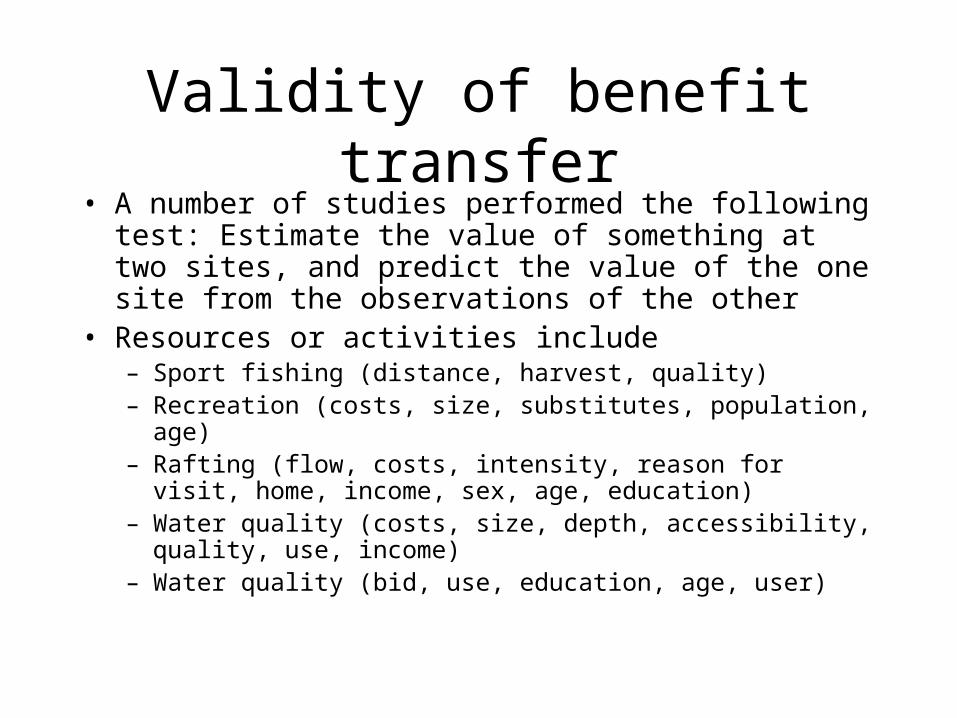
Sources of error• Generalisation error
– When estimates from study sites are adapted to represent different policy sites
– The error is inversely related to the degree of correspondence between the sites
• Measurement error– Occurs when researcher’s decision affect the accuracy of
the transferability of values– Methodological choices, non-reporting of study
characteristics
• Publication selection error– There is a preference for publishing statistically significant
results that conform theoretical expectations
• Authorship effect
Meta-regression analysis• A drawback of the demand function transfer is the
assumption that the statistical relationship between the dependent and independent variables are the same for both study as well as policy site
• Also, demand function transfer relies mostly on a single study
• Meta-regression analysis summarises and syntheses outcomes from several studies
• Meta-analysis not only provides a rigorous synthesis of the literature, it is also able to explain the variation found across empirical studies and to identify outlier studies, knowledge gaps, and priors for further analysis
• Meta-analysis is a technique that originates in medical science
Meta-regression analysis (2)• Some of the variation in value estimates may be due to
identifiable characteristics among the different studies themselves– valuation method, survey mode, geographic location,
time etc.• These characteristics are not explanatory variables in
the original studies as they are constant• Advantage of the method: it does not prejudge research
findings on the basis of the original study‘s quality (input) , while it avoids a differential subjective weighting of studies in the interpretation of findings (output side)
• However, the publication selection error still applies
Example: Meta-regression analysis
• Brouwer, Langford, Bateman and Turner (1999) is one of the early applications of meta-regression analysis
• Analysis covers 30 studies of the WTP per person for wetland preservation in temperate climate zones in developed economies in North America and Europe
• In total, 103 data points as some studies reported more than one observation (split sample)
• Wetlands were made comparable by looking at their types and functions: flood control, water supply, water purification, and nature/recreation
• Each observation was associated with one or more functions
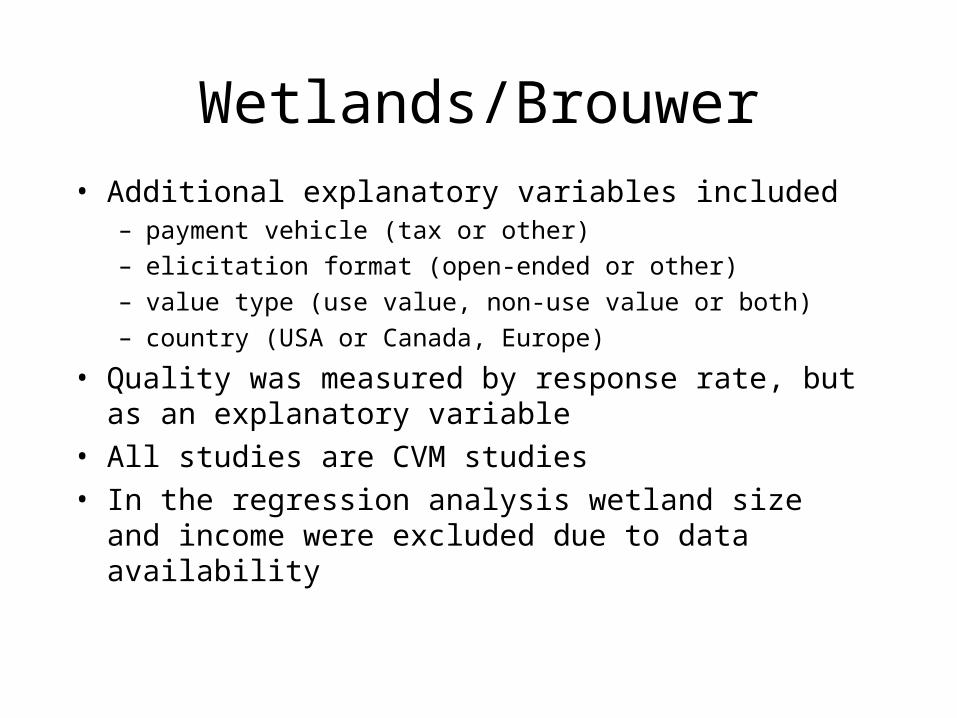
Wetlands/Brouwer• Additional explanatory variables included
– payment vehicle (tax or other)– elicitation format (open-ended or other)– value type (use value, non-use value or both)– country (USA or Canada, Europe)
• Quality was measured by response rate, but as an explanatory variable
• All studies are CVM studies• In the regression analysis wetland size and
income were excluded due to data availability
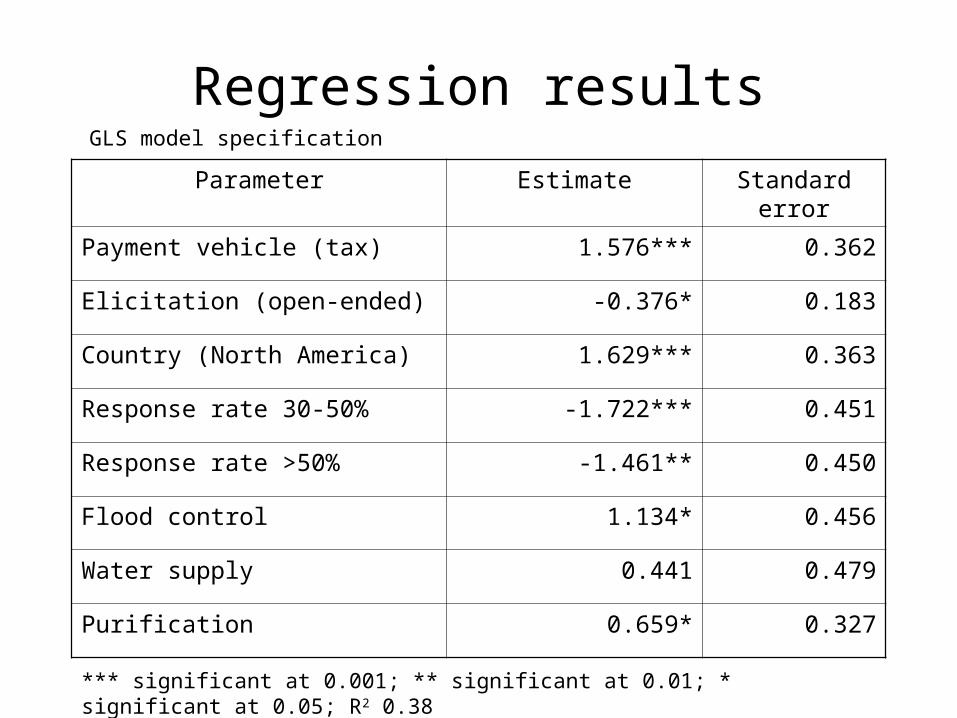
Regression results
Parameter Estimate Standard error
Payment vehicle (tax) 1.576*** 0.362
Elicitation (open-ended) -0.376* 0.183
Country (North America) 1.629*** 0.363
Response rate 30-50% -1.722*** 0.451
Response rate >50% -1.461** 0.450
Flood control 1.134* 0.456
Water supply 0.441 0.479
Purification 0.659* 0.327
*** significant at 0.001; ** significant at 0.01; * significant at 0.05; R2 0.38
GLS model specification
Wetlands/Brouwer (2)• On average, people are willing to pay
$93/person/year for wetland preservation• Note that the median is only $51• Taxes attract higher contributions• Open ended questions lead to smaller
answers• North Americans are willing to pay more• Higher response rates imply lower values• Less differences between functionality of
wetlands
Conclusion• Benefit transfer can perform no better than the
quality of original studies• The underlying questions of accuracy and
appropriateness of non-market methods are not solved in benefit transfer
• However, some type of benefit estimates are subject to less controversy
• Benefit transfers are defensible as long as they are based on organised research agenda and seek to expand knowledge
• There‘s a great deal of pragmatism in policy-decision making – not all decisions require the same level of accuracy