Draft Confidential - Attorney Client Privilege Valuation of NEM Solar: A Wholesale Power Market Perspective November 21, 2019 Jon Olson, Director Energy Trading & Contracts November 21, 2019 1
Transcript
Draft Confidential - Attorney Client Privilege
Valuation of NEM Solar: A Wholesale Power Market Perspective
November 21, 2019
Jon Olson, DirectorEnergy Trading & Contracts
November 21, 2019 1
Agenda – NEM solar valuation, a wholesale power market perspective
2
• Glossary
• Background information - the grid and NEM solar integration
• Operational characteristics of NEM solar
• Factors to consider in wholesale power market valuation: - Energy- Capacity- Financial risk management
• Examples illustrating the factors using SMUD metered data*
• Summary* Actual metered energy production data from utility scale solar and large scale, NEM solar commercial customers are used to present concepts. Examples are provided to illustrate the valuation of all resources solely from the wholesale power market perspective, and the wholesale power market perspective is just one of several aspects of NEM solar valuation.
November 21, 2019
Glossary
3
• Ancillary services – Market products that are used to maintain grid stability and reliability• Automatic Generation Control (AGC) – Equipment that automatically adjusts power output of generating units to
maintain system reliability• Balancing Authority – The responsible entity that integrates resource plans ahead of time, maintains demand and
resource balance within a Balancing Authority Area, and supports interconnection frequency in real time• Balancing Authority of Northern California (BANC) – An entity providing balancing services to 7 organizations• California Public Utility Commission (CPUC) – An entity that regulates privately owned utility companies in California• Capacity – The maximum output an electricity generator, demand-side resources or batteries can deliver to a grid over a
specific period of time, measured in megawatts (MW) or kilowatts (kW)• Enhanced day ahead market (EDAM) - A market in development that seeks to maintain reliability, as the penetration of
variable energy resources increases• Energy Imbalance Market (EIM) - a real-time bulk power trading market that improves the integration of variable energy
resources because of its wide geographic area and its 5 minute real-time dispatch • Electricity – A form of energy • Energy – The amount of electricity produced by a generator, consumed by a customer, or stored by a battery over a
specific period of time and measured in megawatt-hours (MWh) and kilowatt-hours (kWh)• Federal Energy Regulatory Commission (FERC) – An agency that regulates the energy industry• Financial risk management – The process of understanding and managing financial risks that a business faces• Generator, electricity – An asset that converts energy into electricity (e.g. hydro-electric generators, wind turbines, solar
generators and natural gas generators)• NEM – Net energy metering• North American Electric Reliability Corporation (NERC) - A regulatory body that assures grid reliability and security• Power – The output an electricity generator, demand resources or batteries deliver to a grid, measured in megawatts (MW)
or kilowatts (kW)• Power Plant – An asset that provides electricity to the grid • Power portfolio – SMUD owned power plants, transmission lines, contracts and retail electricity consumption obligations
managed by SMUD to provide safe, reliable electricity at affordable rates to SMUD customers • Resource adequacy capacity–Capacity requirements set by the CPUC to ensure sufficient capacity to meet peak demand• Regulation down – An ancillary service in which a generator receives an automated signal to decrease output• Regulation up – An ancillary service in which a generator receives an automated signal to increase output• System demand – The amount of power provided by SMUD to meet customer electricity use, including electricity travel
losses, over a specific time interval measured in megawatts or kilowatts • System supply – A portfolio of assets available to meet system demand • Western Electricity Coordinating Council (WECC) – An organization that has been delegated to assure grid reliability
and security of the Western Interconnection’s Bulk Power System• Western Interconnection Bulk Power System – This system includes more than 35 balancing authorities and spans 14
western states and parts of Mexico and CanadaNovember 21, 2019
Background information
November 21, 2019 4
80 kW installed near SMUD’s electric charging station
What is the grid?
November 21, 2019 5
SMUD’s grid is part of the Western Interconnection’s Bulk Power System
November 21, 2019 6
Western InterconnectionBalancing Authority
of Northern California (BANC)
SMUD
NEM Solar
To reliably meet system demand, SMUD balances supply and demand every 4 seconds
November 21, 2019 7
System supply
System demand=
Hydro-electric and natural gas power plants have automatic generation control (AGC) to automatically maintain supply and demand balance.
Similar to cruise control on a car, the speed is set, and the motor adjusts to maintain the speed.
hydro-electric
naturalgas
wind
solar
NEM
Operational characteristics of NEM solar
November 21, 2019 8
12 kW installed at SMUD’s Customer Service Center
As the sun rises, solar energy increases, power system demand decreases
November 21, 2019 9
Power system demand
Power systemsupply
When NEM solar produces energy, SMUD’s power system demand
decreases To balance the system, SMUD’s power plants
reduce energyproduction
To meet reliability standards
demand = supply
As the sun sets, solar energy decreases, power system demand increases
November 21, 2019 10
To balance the system, SMUD’s power plants
increase energy production
Power system demand
Power systemsupply
NEM solar energy production decreases,
increasing power system demand
To meet reliability standards
demand = supply
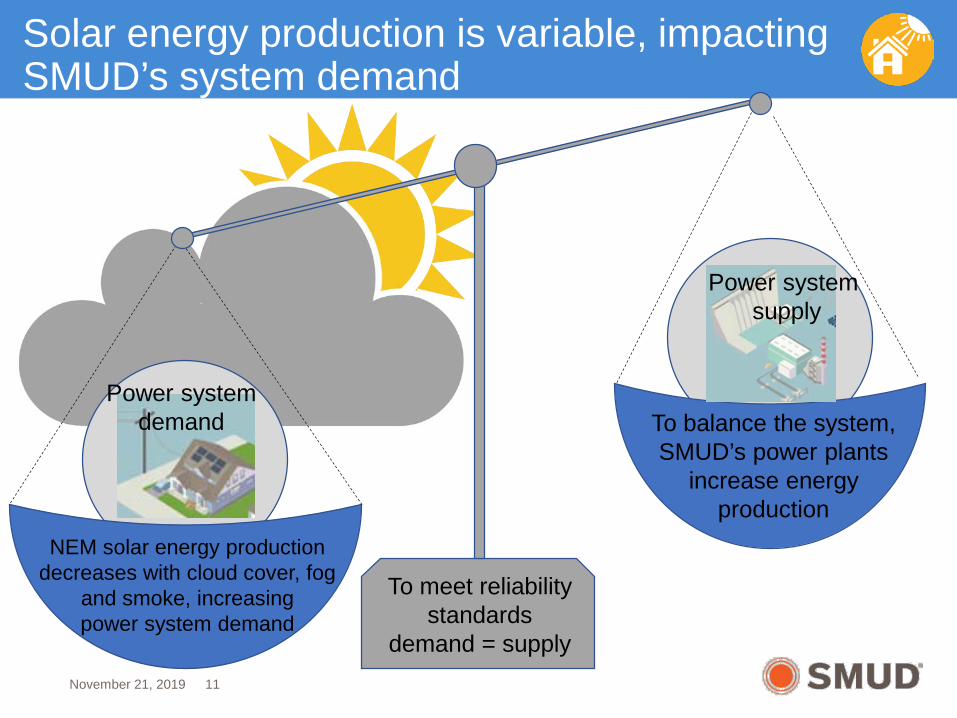
Solar energy production is variable, impacting SMUD’s system demand
November 21, 2019 11
To balance the system, SMUD’s power plants
increase energy production
Power system demand
Power systemsupply
NEM solar energy production decreases with cloud cover, fog
and smoke, increasing power system demand
To meet reliability standards
demand = supply
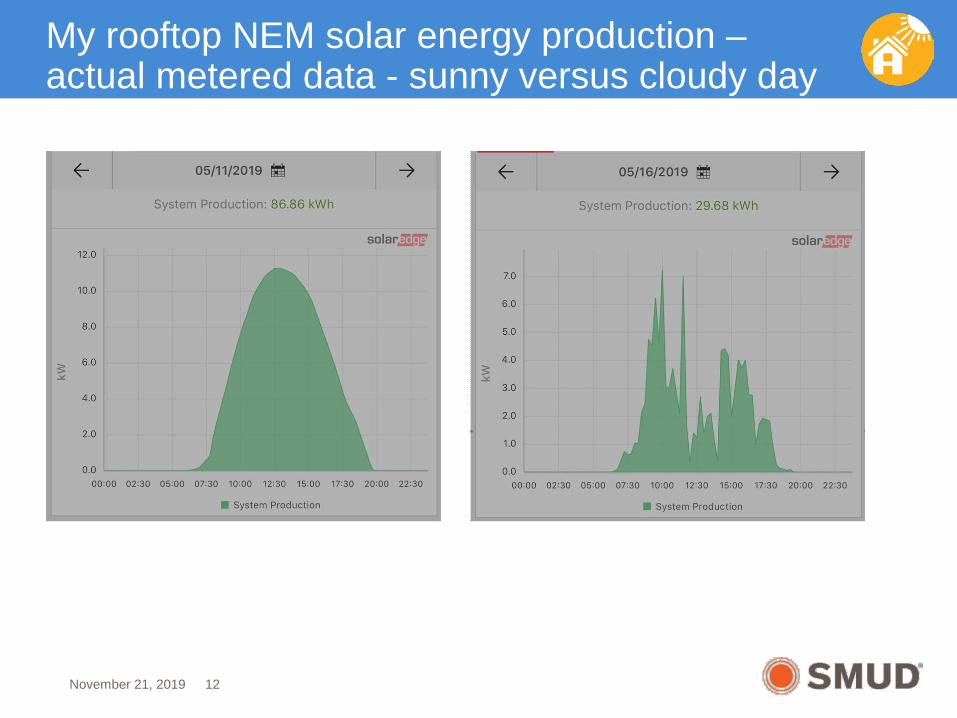
My rooftop NEM solar energy production –actual metered data - sunny versus cloudy day
12November 21, 2019
Like car engines, generators that ramp up and ramp down incur costs
Requires more gas for each mile Requires less gas for each mile
City driving costs more than highway driving
It costs more to operate a power grid
that has variable energy resources.
Power market valuation of NEM solar
November 21, 2019 14
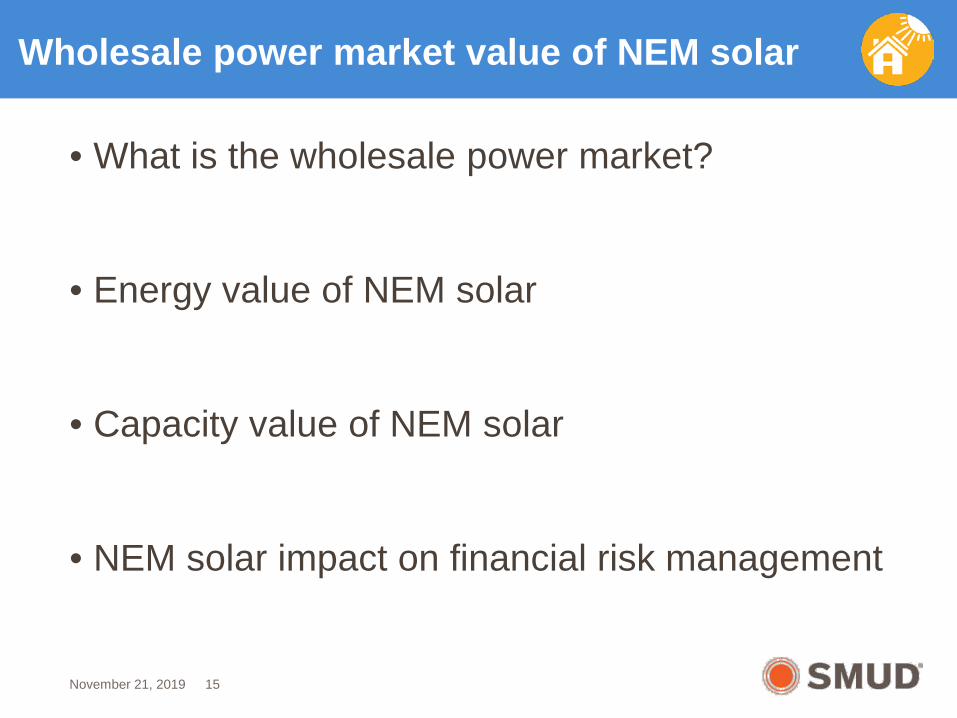
Wholesale power market value of NEM solar
15
• What is the wholesale power market?
• Energy value of NEM solar
• Capacity value of NEM solar
• NEM solar impact on financial risk management
November 21, 2019
The wholesale power market is key to managing SMUD’s power portfolio
November 21, 2019 16
Transmission linesnatural
gaswindsolar
hydro-electric
SMUD owned assets
The wholesale power market
Customer energy demand
Available productsEnergyCapacityAncillary Services(Regulation up/regulation down)
NEM
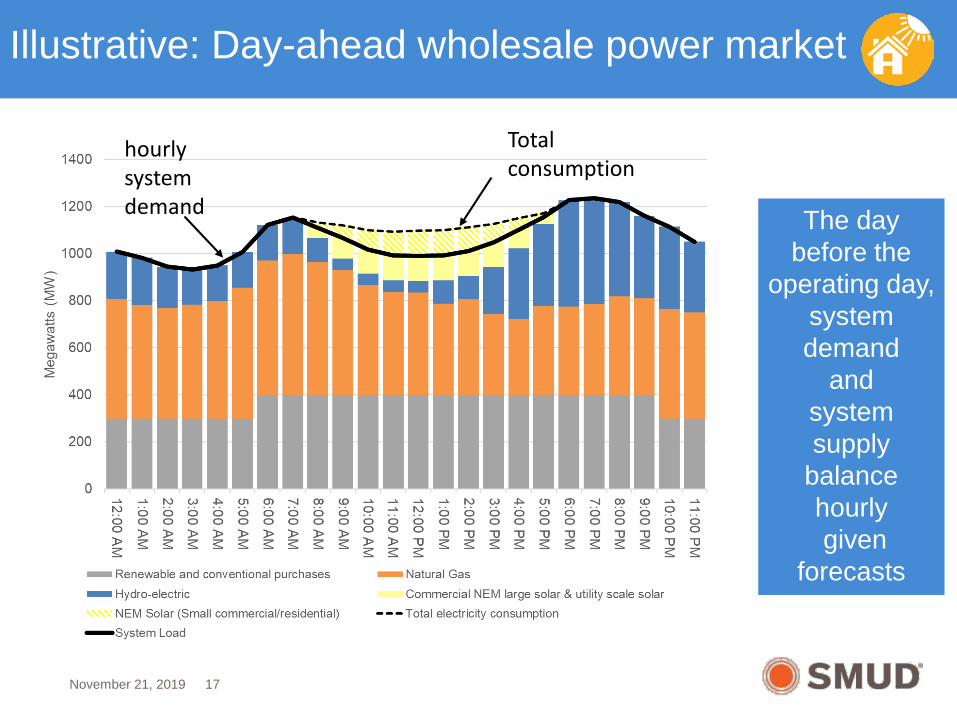
Illustrative: Day-ahead wholesale power market
November 21, 2019 17
hourlysystemdemand The day
before the operating day,
system demand
and system supply
balance hourlygiven
forecasts
Total consumption
During the operating day, conditions vary from the forecast and the portfolio is rebalanced
November 21, 2019 18
Factors impacting Demand Factors impacting SupplyTemperature Temperature
Clouds Clouds
Wind Wind
Distribution outages Power plant outages
Smoke Natural gas prices
Customer behavior Hydro runoff
Transmission Limitations
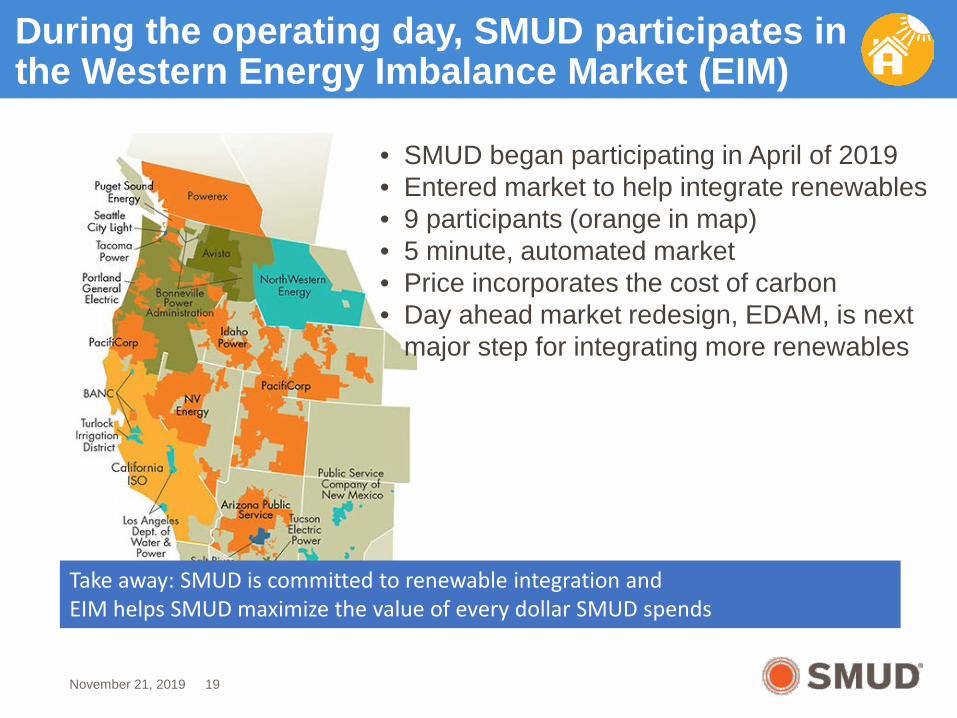
During the operating day, SMUD participates in the Western Energy Imbalance Market (EIM)
19
• SMUD began participating in April of 2019• Entered market to help integrate renewables• 9 participants (orange in map)• 5 minute, automated market• Price incorporates the cost of carbon• Day ahead market redesign, EDAM, is next
major step for integrating more renewables
EIM market participants – orange are current
Take away: SMUD is committed to renewable integration and EIM helps SMUD maximize the value of every dollar SMUD spends
November 21, 2019
Net wholesale power market energy value
20
Wholesale power market energy value
NEM energy ongoing
integration costs
Net wholesale
power market energy value
Benefit Cost
November 21, 2019
Illustrative benefit: energy imbalance market valuation of delivered energy given 5 minute prices
21November 21, 2019
0.00
0.01
0.02
0.03
0.04
0.05
0
50
100
150
200
250
300
350
400
450
500
11:00 AM
11:05 AM
11:10 AM
11:15 AM
11:20 AM
11:25 AM
11:30 AM
11:35 AM
11:40 AM
11:45 AM
11:50 AM
11:55 AM
Energy imbalance m
arket price ($/kWh)
Ener
gy (
kW)
10/16/2019 NEM commercial customer energy production(500 kW installed capacity)
Energy Production 5 minute wholesale energy price
Illustrative cost - ongoing integration costs of solar
22
City driving versus
highway driving
November 21, 2019
0
50
100
150
200
250
300
350
400
450
500
11:00 AM
11:05 AM
11:10 AM
11:15 AM
11:20 AM
11:25 AM
11:30 AM
11:35 AM
11:40 AM
11:45 AM
11:50 AM
11:55 AM
Ener
gy (
kW)
Solar energy production variesCustomer electric consumption is flat
SMUD power plants ramp up and ramp down to balance
Solar energy consumed by customer SMUD supplied energy consumed by customer
Solar surplus energy fed back to grid Illustrative customer electric consumption
Net wholesale power market capacity value
23
Less resource adequacy capacity
More intra-hour
flexible capacity
Net wholesale
power market
capacity value
Benefit Cost
November 21, 2019
Illustrative benefit: resource adequacy capacity need is less with NEM solar
November 21, 2019 24
Jan Feb Mar Apr May Jun Jul Aug Sep Oct Nov Dec
Mon
thly
Res
ourc
e A
dequ
acy C
apac
ity N
eed
(MW
)
Residual resource adequacy capacity need NEM solar contribution
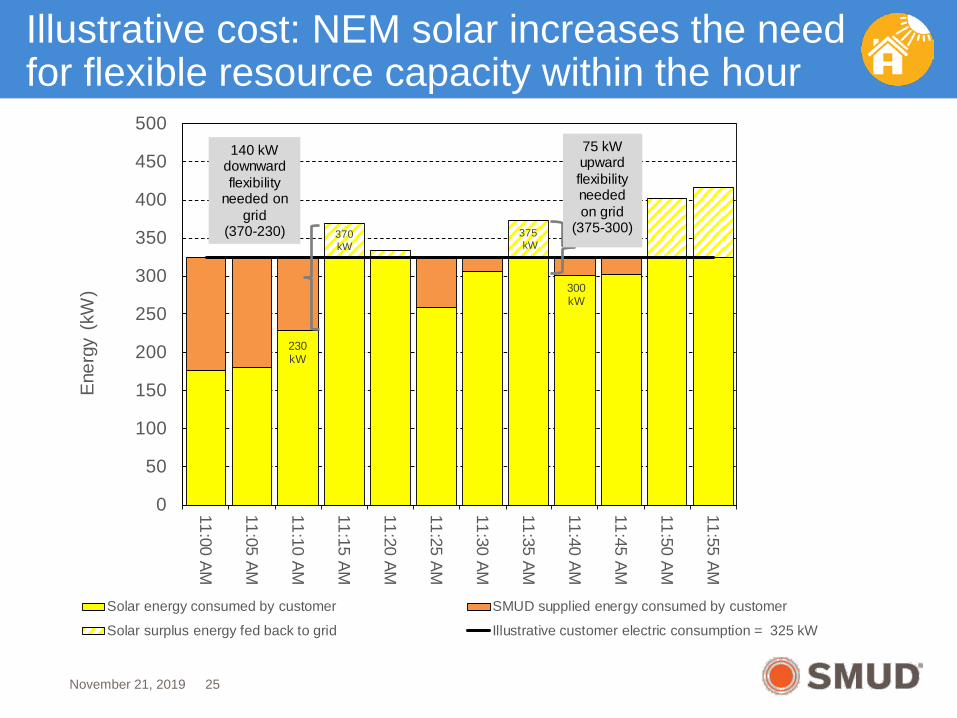
Illustrative cost: NEM solar increases the need for flexible resource capacity within the hour
November 21, 2019 25
230kW
300kW
370kW
375kW
0
50
100
150
200
250
300
350
400
450
500
11:00 AM
11:05 AM
11:10 AM
11:15 AM
11:20 AM
11:25 AM
11:30 AM
11:35 AM
11:40 AM
11:45 AM
11:50 AM
11:55 AM
Ener
gy (
kW)
Solar energy consumed by customer SMUD supplied energy consumed by customer
Solar surplus energy fed back to grid Illustrative customer electric consumption = 325 kW
140 kW downward flexibility
needed on grid
(370-230)
75 kW upward flexibility needed on grid
(375-300)
NEM solar impacts SMUD’s management of financial risk
November 21, 2019 26
Fuel price risk
Energy price volatility & higher cost investment
plan
Risk DecreasesRi
sk in
crea
ses
Fuel price risk: NEM solar energy reduces SMUD’s financial exposure to fuel prices
November 21, 2019 27
Financial risk to the price of natural gas of portfolio #1
Financial risk to the price of natural gas of portfolio #2
More solar energy production = More fuel diversity
SolarSolar
Natural Gas
WindHydro
WindHydro
Natural Gas
>
Energy risk impact: NEM solar energy increases energy price risk
November 21, 2019 28
Price
Quantity
Solar energy production is variable, increasing price volatility
Supply curve
Demand curveat 5:00 pm
Demand curveat 6:00 pm
P2P1
Q2Q1
12
Energy risk impact: NEM solar energy increases energy price risk
November 21, 2019 29
Price
Quantity
Supply curve
Demand curve at12:00 pm on asunny May day
Demand curve at 6:00 pm$ 0
P3
Q43
4
Energy prices go negative when power plants that are needed to meet system demand later in the day cannot reduce output and are forced to bid lower than their marginal cost
P4Q3
Illustrative: wholesale energy prices do go negative, May 5, 2019
November 21, 2019 30
When prices go negative, SMUD pays
twice
Once to produce the energy, and once to sell it into the
market-0.02
-0.01
0
0.01
0.02
0.03
0.04
0.05
0.06
0.07
0.08
0.09
0
5,000
10,000
15,000
20,000
25,000
30,000
35,000
40,000
45,000
50,000
55,000
1:00 AM
2:00 AM
3:00 AM
4:00 AM
5:00 AM
6:00 AM
7:00 AM
8:00 AM
9:00 AM
10:00 AM
11:00 AM
12:00 PM
1:00 PM
2:00 PM
3:00 PM
4:00 PM
5:00 PM
6:00 PM
7:00 PM
8:00 PM
9:00 PM
10:00 PM
11:00 PM
12:00 AM
Energy P
rice ($/kWh)ki
low
att-h
ours
(kW
h)
Forecast energy - large commercial NEM solar (kWh)Actual energy - large commercial NEM solar (kWh)Energy price ($/kWh)
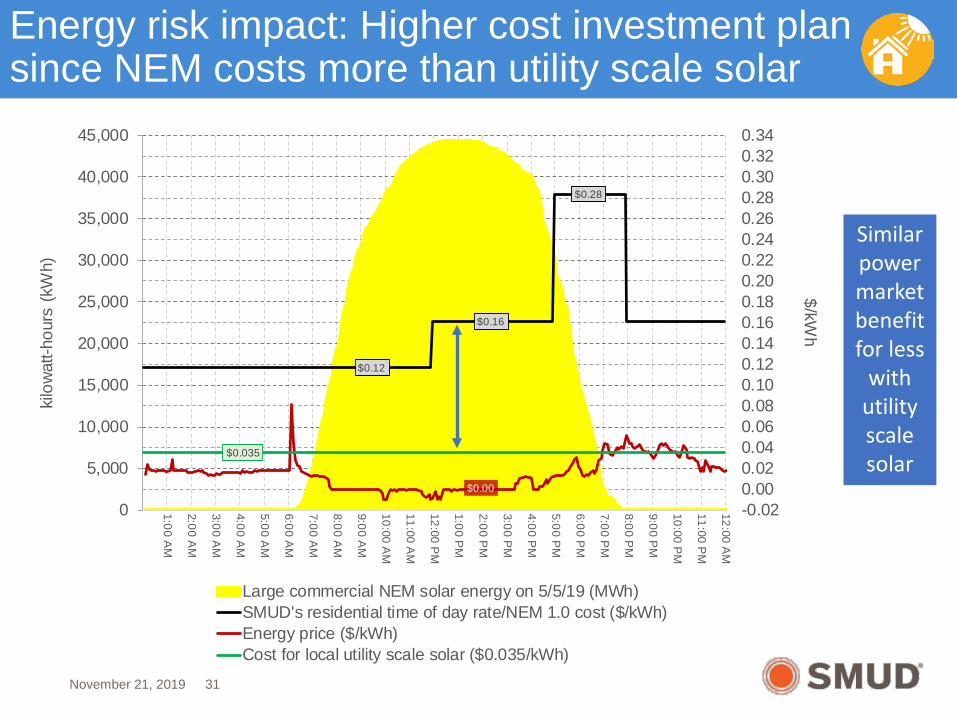
Large commercial NEM solar energy on 5/5/19 (MWh)SMUD's residential time of day rate/NEM 1.0 cost ($/kWh)Energy price ($/kWh)Cost for local utility scale solar ($0.035/kWh)
Energy risk impact: Higher cost investment plan since NEM costs more than utility scale solar
November 21, 2019 31
Similarpower market benefitfor less
withutility scale solar
Examples using metered data from large scale solar to illustrate valuation factors
November 21, 2019 32
15 kW installed at SMUD’s Customer Service Center
Examples that illustrate factors that capture the power market value of NEM solar
November 21, 2019 33
0
200
400
600
800
1,000
1,200
1,400
12:00AM
06:00AM
12:00PM
06:00PM
12:00AM
06:00AM
12:00PM
06:00PM
12:00AM
06:00AM
12:00PM
06:00PM
Syst
em D
eman
d (M
W)
All other supply System demand
October 14, 2019 October 15 October 16
0
200
400
600
800
1,000
1,200
1,400
12:00AM
06:00AM
12:00PM
06:00PM
12:00AM
06:00AM
12:00PM
06:00PM
12:00AM
06:00AM
12:00PM
06:00PM
Syst
em D
eman
d (M
W)
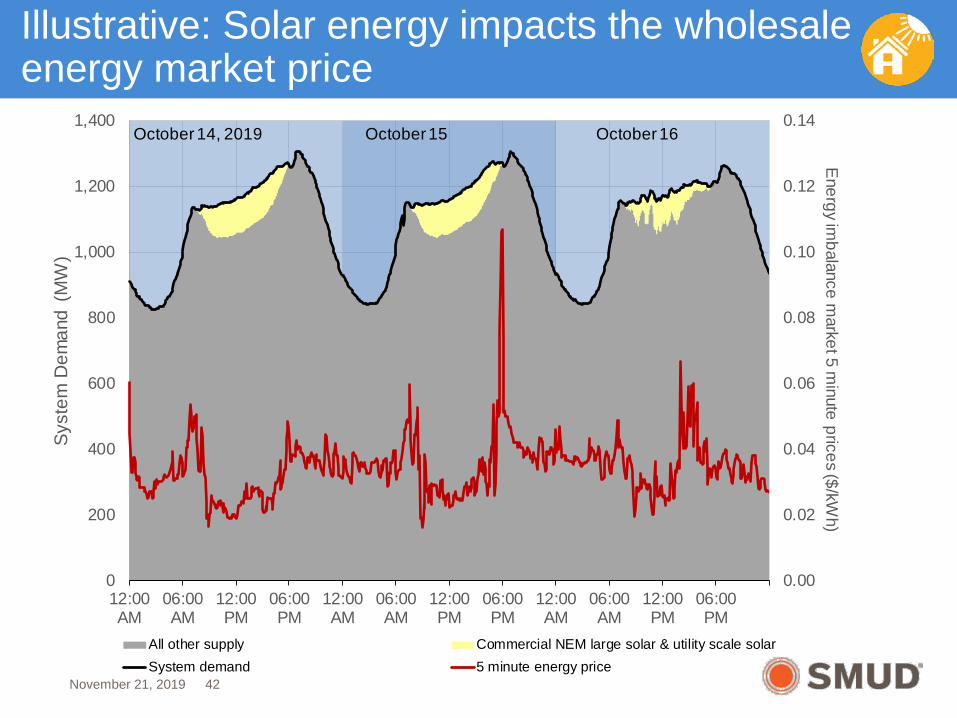
All other supply Commercial NEM large solar & utility scale solar System demand
October 14, 2019 October 15 October 16
Illustrative: Large scale solar energy production varies
November 21, 2019 34
1% drop in solar
energy production
from October 14
41% drop in solar
energy production
from October 15
Illustrative: Other plant adjusts output to counterbalance solar energy variability
November 21, 2019 35
0
200
400
600
800
1,000
1,200
1,400
12:00AM
06:00AM
12:00PM
06:00PM
12:00AM
06:00AM
12:00PM
06:00PM
12:00AM
06:00AM
12:00PM
06:00PM
Syst
em D
eman
d (M
W)
Flexible power plant All other supply less flexible resource
Commercial NEM large solar & utility scale solar System demand
October 14, 2019 October 15, 2019 October 16
Energy production from a flexible power plant decreases during solarenergy production
Illustrative: NEM integration costs are captured by the change in plant efficiency
November 21, 2019 36
6.6
6.8
7.0
7.2
7.4
7.6
7.8
8.0
0
100
200
300
400
500
600
700
800
12:00AM
06:00AM
12:00PM
06:00PM
12:00AM
06:00AM
12:00PM
06:00PM
12:00AM
06:00AM
12:00PM
06:00PM
Plant efficiency (MM
Btu/MW
h)
Plan
t out
put f
rom
bal
anci
ng p
lant
(M
W)
Flexible power plantPlant heat rate - the amount of natural gas required for each unit of energy
October 14, 2019 October 15 October 16
Less efficient energy
production & higher
marginal carbon
emissions
More efficient energy
production & lower
marginal carbon
emissions
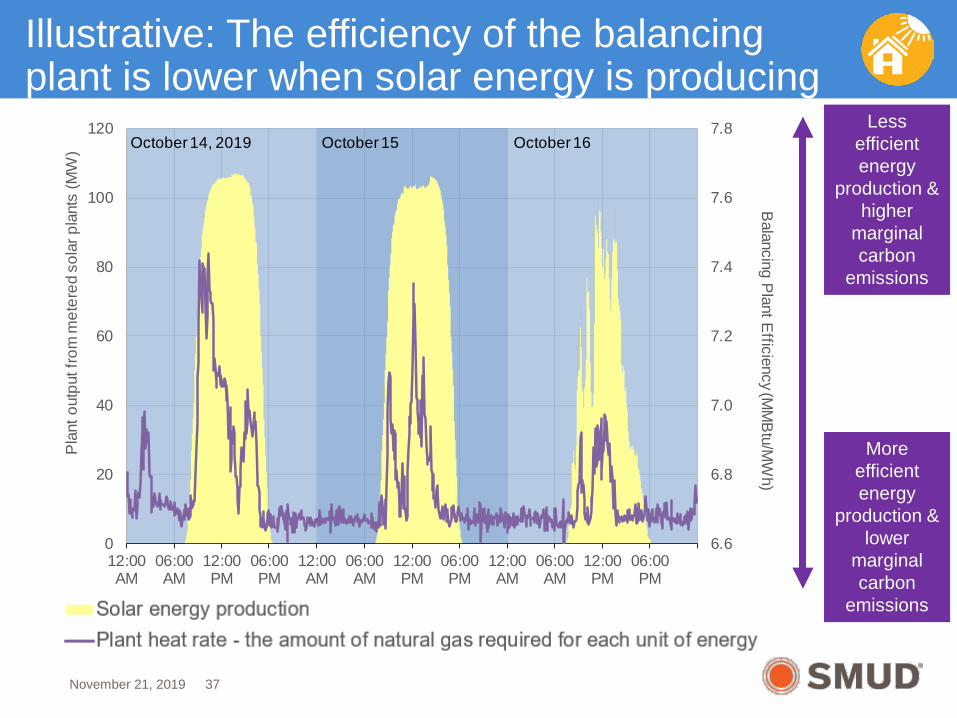
Illustrative: The efficiency of the balancing plant is lower when solar energy is producing
November 21, 2019 37
6.6
6.8
7.0
7.2
7.4
7.6
7.8
0
20
40
60
80
100
120
12:00AM
06:00AM
12:00PM
06:00PM
12:00AM
06:00AM
12:00PM
06:00PM
12:00AM
06:00AM
12:00PM
06:00PM
Balancing P
lant Efficiency (M
MB
tu/MW
h)
Pla
nt o
utpu
t fro
m m
eter
ed s
olar
pla
nts
(MW
) October 14, 2019 October 15 October 16Less
efficient energy
production & higher
marginal carbon
emissions
More efficient energy
production & lower
marginal carbon
emissions
Lower plant efficiency increases energy production costs and carbon emissions