Great Lakes Herald Page 64 Vol 7, No 2, September 2013 VALUE ADDED AND PROFITABILITY: ROLE OF HUMAN RESOURCE Abhash Kumar & Basu Raghunathpur College, West Bengal Phalguni Mukherjee J.K.College, West Bengal Abstract.Money, equipment and other assets require human application to generate value which ultimately contributes to the profit of a business entity. Human Capital with high degree of productivity is the key competitive advantage finally adding to the bottom line. Present study endeavors to explore the relationship between contribution made by workforce in terms of values and performance of the enterprise-operating profit. With the help of secondary data of BHEL and Infosys as case study and using multiple regression analysis, this study proves that the interdependence between operating profit and human resource on one hand and between OP and working capital on the other is very significant. Using ANOVA tool it also proves that the impact of other factors excepting these two is negligible. So policy prescription needs more orientation to human resource improvement. Key Words: Value Added, Human Resource or Human Capital, Operating Profit, Workers Surplus, Working Capital, Resource-based value. INTRODUCTION An organization has to set up its strategic goals first and then to link such goals with processes. The result of processes is measured in terms of profits. These processes consume resources of different kinds-money, equipment, other facilities and obviously human resource. Equipment and other resources require human efforts for efficient utilization. Improvements and enterprise goals are closely linked with each other. If such linkage is successfully identified, then obvious outcome that can be measured is the value-added. As workforce is the backbone of effective use of all types of resources, measurement of value levered by human capital should be ascertained as bottom-line. Financial results are inescapably connected to the organizational leadership, employee commitment, productivity and internal process. In present economic scenario, no business can truly thrive unless it successfully manages the ‘employee productivity-profitability chain’. An efficient manager will deliberately focus on the key competitive advantage- the human capital which finally adds to the bottom line.
Transcript
Great Lakes Herald Page 64Vol 7, No 2, September 2013
VALUE ADDED AND PROFITABILITY: ROLE OF HUMAN RESOURCEAbhash Kumar & Basu
Raghunathpur College, West Bengal
Phalguni Mukherjee
J.K.College, West Bengal
Abstract.Money, equipment and other assets require human application to generate value which ultimately contributes to the profit of a business entity. Human Capital with high degree of productivity is the key competitive advantage finally adding to the bottom line. Present study endeavors to explore the relationship between contribution made by workforce in terms of values and performance of the enterprise-operating profit. With the help of secondary data of BHEL and Infosys as case study and using multiple regression analysis, this study proves that the interdependence between operating profit and human resource on one hand and between OP and working capital on the other is very significant. Using ANOVA tool it also proves that the impact of other factors excepting these two is negligible. So policy prescription needs more orientation to human resource improvement.
Key Words: Value Added, Human Resource or Human Capital, Operating Profit, Workers Surplus, Working Capital, Resource-based value.
INTRODUCTION
An organization has to set up its strategic goals first and then to link such goals with processes. The result of processes is measured in terms of profits. These processes consume resources of different kinds-money, equipment, other facilities and obviously human resource. Equipment and other resources require human efforts for efficient utilization. Improvements and enterprise goals are closely linked with each other. If such linkage is successfully identified, then obvious outcome that can be measured is the value-added. As workforce is the backbone of effective use of all types of resources, measurement of value levered by human capital should be ascertained as bottom-line.
Financial results are inescapably connected to the organizational leadership, employee commitment, productivity and internal process. In present economic scenario, no business can truly thrive unless it successfully manages the ‘employee productivity-profitability chain’. An efficient manager will deliberately focus on the key competitive advantage- the human capital which finally adds to the bottom line.
Page 65Great Lakes Herald Vol 7, No 2, September 2013
There are a large and increasing number of evidences as shown by different studies which demonstrate a positive linkage between human capital (HC) and organizational performance. The market value of an enterprise depends less on tangible assets but more on intangible assets-especially the human resource (HR). Selecting, recruiting, training and retaining the best employee are the prerequisite. The skill and competence through creating and sharing of knowledge will affect the enterprise performance. That is why the nature of human resource and its impact on enterprise performance have been drawing increasing interest for the managers and the academicians as well.
The resource-based view (RBV) of a firm as proposed by Penrose (1959) and later articulated by Rumlet (1984) and Burney (1991, 1995) and also by Dierickx& Cool (1989) establishes the importance of building a valuable set of resources and bundling them together to attain firm’s success. Competitive advantage is not dependent upon, as traditionally assumed, natural resources, technology or scale economics as these are increasingly easy to imitate. Rather, such competitive advantage is largely dependent on valuable, rare and hard to imitate resource-human capital. HR is inimitable due to two broad reasons-
Casual ambiguity- it is hard to grasp the precise mechanism by which the interplay of HR and policies generate value;
Path dependency-HR system consists of policies developed internally over time and cannot be purchased in the market.
The interlink between HC and performance can be interpreted in two theoretical perspectives:-
i) The resource-based view; and
The expectancy theory of motivation which is composed of three elements-a) value attached to rewards; b) the belief that the employee will receive the reward upon reaching a certain level of performance; and c) the expectation that the employee can achieve the performance.
Labor costs (compensation and benefits) account for a substantial part of total cost of operation. So, HR management principles and policies have a direct impact on achieving profitability. The most primitive HR strategy was to align workforce management goals with enterprise objectives. There should be a conscious vigil on how programs and decisions affect the bottom line. Alignment of labor costs with quality of workforce can remarkably improve financial performance.
Salaries can be one of the greatest dilemmas for management to decide upon. Management cannot discourage high performing employees with low compensation package or otherwise, it would lose them to the competitors. On the contrary, management cannot compromise with profitability by paying too much
Great Lakes Herald Page 66Vol 7, No 2, September 2013
salary. A policy is to be formulated to determine the amount of salary correlated with their value to the organization.
Present study makes an effort to explore the relationship between profitability and surplus value generated by workforce over their compensation package. This analysis will also encompass the joint impact of surplus vale and working capital-the fluctuating component of capital on profitability. Bharat Heavy Electricals Limited (BHEL) and Infosys limited have been considered as the case study.
The study is divided into five parts. Part-I is the study of literature; Part-II explains objectives of the study; Part-III deals with data & methodology; Part-IV summarizes the findings; and Part-V contains the discussion
LITERATURE STUDY
A good many studies have been undertaken on value added (VA), its creation, distribution and its retention as VA has been the focus of both the managers and the academicians. This initiative is still going on.
Karl Marx viewed VA concept in almost similar way to national accounting concept of net national product or net value added. It is the value of gross product less expenditure on constant capital. Taking differently, value added is the sum total of variable capital (laborers’ compensation) and pre-tax profit. He argues that it is the labor force which creates new value that cover both the cost of own wages and surplus value. Marx in his Das Capital has spelled out that workers devote enough labor-time to cover the cost of reproducing their ability to work and do extra work to generate income to the capitalists-landowners and others. As active and conscious factor in the production process-capital goods and gifts from nature (land etc) only facilitates the transformation of raw materials into products, but workers’ physical productivity has the ability to produce (use-value) and to generate value productivity which can be sold for money.
Adam Smith says,”There is one sort of labor which adds to the value of the subject upon which it is bestowed; there is another which has no such effect. The former, as it produces a value, may be called productive; and the latter is, unproductive labor. Thus the labor of a manufacturer adds, generally, to the value of the materials which he works upon, that of his own maintenance and of his master’s profit. The labor of a menial servant, on the contrary, adds to the value of nothing” (Andrew Skinner edition 1974, p. 429-430).
The neoclassical economists, reject the distinction between productive and unproductive labor as arbitrary and irrelevant. All the factors of production (land,
Page 67Great Lakes Herald Vol 7, No 2, September 2013
labor and capital) create wealth and add value; so they are also productive. If the value of a good is just what somebody is prepared to pay for, then regarding some activities as value-creating and others not is a purely subjective matter; any activity which produces anything, or generates an income, could be considered productive, but the question that remains is how productive it is.
Yeung & Berman (1997) have conducted a study on 65 senior HR executives in California to measure the HR effectiveness and impact of HR. They hold that as the business competition increases and corporate resources shrink, all functions (finance, management and HR) require to demonstrate their value added and to seek resources for higher business leverage. It is observed that HR frequently fails to quantify its impact on business performance. There is no well-established linkage between HR and business and as such no accepted policy is there to measure the impact of HR. As a result, a sound policy should be framed to revamp HR to optimize business performance. Philip & Somboon opine that HC is understood to constitute individual’s capability, skill, knowledge and experience as employees and managers. Here HC assumes a wider concept than HR. Most importantly knowledge is emphasized in an individual perspective concerning job related knowledge. Now HC extends beyond the individual and covers a group where knowledge can be shared or exchanged to bring about coherence and to contribute to the financial performance.
Fitz-enzJac (2000) says that the management should develop a system of metrics that describes and predicts costs and productivity of workforce. The existing and popular practice of matching human capital and financial performance at the corporate level has been confined to the single gross measure-revenue per employee. It does not segregate the impact of workforce from leverage of other factors. Most HC metrics are the end point of large number of activities many of which are outside forces. The basic point is that the entire functioning of an organization oscillates around process between corporate goals and HR management. There should be a two-way approach to measure HC and its impact on enterprise performance- To develop a tactical-level metrics to measure improvements in human resource-based functions and to monitor HC impact on business objectives; To formulate a strategic-level metrics to show the impact of HC and corporate goals.
Fitz argues that HC has been acknowledged as organization’s most important asset, yet in the case of evaluation of HC-there is a complete absence of
Great Lakes Herald Page 68Vol 7, No 2, September 2013
quantification of relative value of human factor in profit equation.
Haller & Stolowy (1998) argue that because of the performance aspect of the value added notion, it could be a better option as basis for employee incentive scheme. In France this idea has prompted to adopt a value-added concept in the legal formula on minimum employee profit- sharing. But in Germany there was neither a legal requirement on employee participation, nor was a specific definition of value added. There was a wide variation among German companies regarding profit participation of employees. Although the use of value added as the basis for participation of employees in business performance has been being discussed since 1930s, till now financial income, not the value-added, is being used in this regard. The German trade unions, however, prefer increase in gross value added as a measure for potential increase in salaries.
OBJECTIVES OF THE STUDY
The first step towards establishing a linkage between HC and financial results should not confine to traditional approach of sales per employee metrics. There are several types of employees-full-time, part-time and contingent employees. They should be expressed as full-time-equivalent to consider labor hours worked. Several pertinent metrics have been developed to describe the relationship between HC and financial results. These are:-
Human Economic Value Added (HEVA)- It is originated from the concept of economic value added (EVA). EVA is a measure of financial performance which considers true economic profit. It shows how much true profit is available after paying off all expenses, taxes and also the cost of capital. HEVA is the extended concept of EVA with human capital perspective. HEVA is EVA divided by average headcount.
HEVA= (NOTPAT-Cost of Equity) ÷ Average Headcount.
Human Capital Value Added (HCVA)- Price Water Coopers, Saratoga Institute (PWC) has suggested a measure for computation of HCVA to show the contribution of employees to profitability.
HCVA= [Sales-(Total Costs-Employee Costs)] / Average Headcount.
Total cost can be calculated by deducting Profit before Tax (PBT) from sales.
Then, HCVA= [Sales-{(Sales-PBT)-Employee Cost}] / Average Headcount.
Since PBT is subject to certain items like foreign exchange losses, it is proposed to consider operating profit in place of PBT. In that case the revised form of HCVA takes the form as-
Page 69Great Lakes Herald Vol 7, No 2, September 2013
Or HCVA = (Operating Profit + Employee Cost) / Average Headcount.
Human Capital Return on Investment (HCROI)- It considers Return on Investment (ROI) in terms of profit for monies spent on human capital employment costs.
These financial based HC metrics require the support of a set of human-based metrics. There should be complete data on workforce demographics, number of exempt and non-exempt workers, number of regular and contingent employees etc. Information about workforce turnover and performance of different departments, treated as separate profit centers are necessary.
All these metrics have their base on operating profit without any consideration for value added. But it should be made clear that it is value added which contributes to the operating profit. As such there should be a clear interrelationship between value added and profitability. The more the value added the more will be the operating profit.
Considering such realities, present study explores the interrelationship between surplus value added by employees after covering the cost of employment and side by side the joint impact of such surplus and non-fixed component of capital -- working capital. The objectives are:-
To reconcile between value added and operating profit (after tax)
To explore the correlation between surplus value added by workforce and profitability;
To study the impact of surplus value added by workers and working capital on
DATA & METHODOLOGY
For analysis and study Annual Financial Reports of Bharat Heavy Electricals Limited (BHEL) and Infosys Limited have been considered. A brief note about BHEL and Infosys needs mention here. BHEL is an integrated power plant equipment manufacturer and one of the largest engineering and manufacturing companies in India in terms of turnover. It was established in 1964, to fulfill the requirement of the indigenous Heavy Electrical Equipment industry in India - a dream that has been more than realized with a well-proven track record of performance. The company has been earning
Great Lakes Herald Page 70Vol 7, No 2, September 2013
profits continuously since 1971-72 and paying dividends since 1976-77. The Indian economy is dependent on BHEL in respect to designing, engineering, manufacturing, construction, testing, commissioning and servicing of a wide range of products and services for Power, Transmission, Industry, Transportation (Railway), Renewable Energy, Oil & Gas and Defence. It has 15 manufacturing divisions, two repair units, four regional offices, eight service centers and 15 regional centers. At least 150 projects across India and abroad are in active operation. The (R&D) efforts are on aiming not only at improving the performance and efficiency of existing products, but also at using state-of-the-art technologies and processes to develop new products.
Infosys Limited (NYSE: INFY) was started in 1981 by seven people with US$ 250. Today, it is a global leader in consulting, technology and outsourcing with revenues of US$ 7.231 billion (Q3 FY13). Many of the world’s most successful organizations rely on Infosys to deliver measurable business value. Infosys provides business consulting, technology, engineering and outsourcing services to help clients in over 30 countries. In the journey of over 31 years, it has helped India’s emergence as the global destination for software services talent. It has been pioneering the Global Delivery Model (GDM) and became the first IT Company from India to be listed on NASDAQ. Infosys has a global footprint with 67 offices and 69 development centers in US, India, China, Australia, Japan, Middle East, UK, Germany, France, Switzerland, Netherlands, Poland, Canada and many other countries. Infosys and its subsidiaries had 155,629 employees as on Dec 31, 2012.
Definitions and formulae used
Value Added = Income-(Operating expenses excluding personnel costs + software development & process management expenses + selling & marketing expenses + general & administration expenses) + Non-operating income.
Net Value Added by Workforce = Value Added less (Tax and Depreciation)/ Salary to workers.
The Surplus Value Added by workers per Re.1 of salary paid is reduced by Re.1 to compute Surplus Value Added by worker over Re. 1 salary.
It is weighted by the number of employees to give the effect of employee strength to the surplus value added.
Operating Profit= Income from software services & products less (software development expenses + selling & marketing expenses + general & administration expenses).
Working Capital= Current Assets minus Current Liabilities.
Page 71Great Lakes Herald Vol 7, No 2, September 2013
Current Liabilities = Trade payables + Other current liabilities + Short-term provisions.
Other human capital metrics as HEVA, HCVA and HCROI have been calculated as per formula cited before.
Methodology applied
Initially we have calculated Net Value Added and its applications on the basis of financial information in the form of Audited Accounts of both BHEL and Infosys. Next we have tried to reconcile between Value Added and Net Operating Profit before Tax. This has shown how operating profit is dependent upon net value added. We also sought for exploring the degree of association between these two with the help of correlation coefficient with significance test.
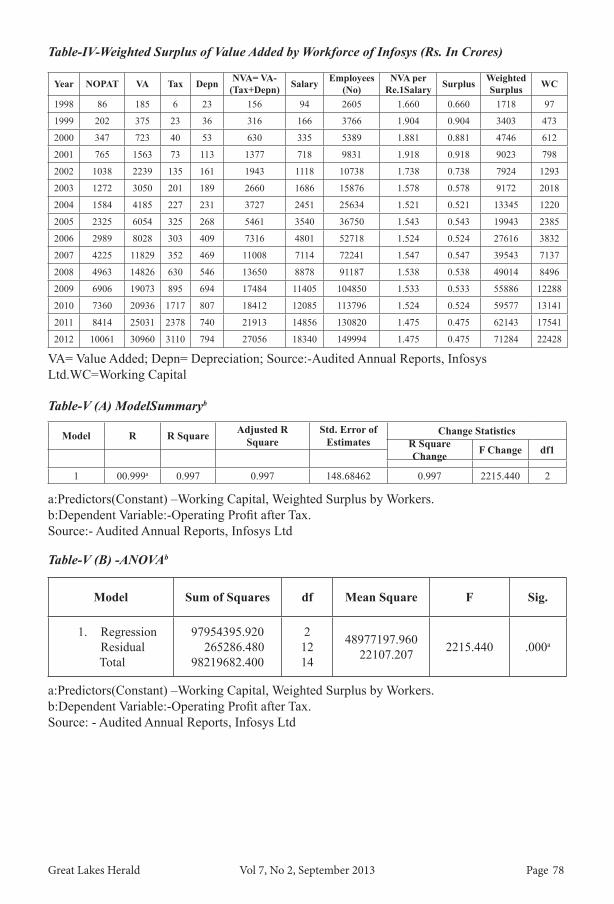
Though a rough idea about the association between Operating Profit and Human Resource and again between Operating Profit and Working Capitalcan be obtained from table, but to know the degree of association as well as the impact of the independent variables on dependent variable, we have applied a multiple regression analysis. In this analysis we have considered Operating Profit as the dependent variable while Human Resource and Working Capital as the independent variables. Here, Human Resource is represented by the ‘Surplus Value Added by Workforce’. The result of regression would be able to explain the impact as well as the degree of association. We have tried to find out through the analysis the existence of any other significant factors influencing operating profit. We have endeavored separate regression analysis for operating profit both before and after taxation with assumption that it will highlight some special findings that the company can take as policy proposition for future development under the choice between HR and WC. In addition to this, we have tried to segregate the impact of HR and WC on operating profit with the help of ANOVA. ANOVA is the method of separating the total variation into different components depending on the choice of factors. If it is found that residual sum of squares is minimum then it will fully support the consideration of the independent variables as taken in our analysis. If our result is significant then it proves that considered variables are appropriate for this analysis.
FINDINGS
Table-I shows the calculation of net value added of BHEL and its applications. Table-I also shows how net profits before tax and net value added are reconciled. It also shows how net operating profit before tax can be arrived at from net value
Great Lakes Herald Page 72Vol 7, No 2, September 2013
added showing distinctly the dependence of profitability on value added. For the purpose of reconciliation, we have Value Added = Operating Profit before Tax + Depreciation + Salary to Employees + Interest on Borrowings.The correlation coefficient between NOPBT (x) and NVA (y), r (x,y) =0.996Null Hypothesis H0: = 0; alternative hypothesis H1: ≠ 0; where n=11 and
r = 0.996, t = or t= ; t =33.57 ≥ 2.82
at 1% level of significance for 9 d.f. Null Hypothesis is rejected and we conclude that NOPAT and NVA are correlated.Operating profit in any production unit is supposed to depend upon human resource (surplus value added by workforce) and working capital. Under this presumption, we make a regression analysis which shows the same coincidence. For understanding we denote the variables as follows:- Operating profit after tax- Variable 01; Human resource (Weighted Surplus value added) - Variable 02; Working capital- Variable 03 Operating profit before tax-Variable 04 The result shows that correlation coefficient between V01 and V02 (r01,02) is 0.995 and that between V01 and V03 (r01,03) is 0.978.We find that (r01,02)issignificant at 1% level of significance ( H0: = 0 ; H1: ≠ 0). The result indicates that operating profit after tax is highly correlated with human resource as well as with working capital. The correlation coefficient between human resource and working capital (r02,03) = 0.958 is very high which indicate the problem of multi-collinearity. Again, the correlation coefficient between V04 and V02 (r04,02) is 0.988 and correlation coefficient between V04 and V03 (r04,03) is 0.986.We find that (r04,02) is significant at 1% level of significance ( H0: = 0 ; H1: ≠ 0). [All relevant data are shown in the tables in Annexure] Our result also shows that the interdependence between operating profit (both before and after tax) and human resource on one hand and between operating profit and working capital on the other is very high. We also find that the value of correlation coefficient of Profit before tax is less than Profit after tax. This implies that if we consider operating profit after taxation and try to relate it with human resource and working capital, it would give us a better result than before taxation. So, the method of defining operating profit after taxation can claim more weight than operating profit before taxation.
Page 73Great Lakes Herald Vol 7, No 2, September 2013
The value of R2 (0.997) is too high explaining the fact that HR and WC are the two major factors responsible for operating profit after tax. Although some other factors are there but the influence of those is negligible. Similar type of inference we can draw when we consider operating profit before tax where R2 is 0.996. Henceforth if we consider HR and WC as defined in our text, then it can explain the probable return regarding operating profit which is treated as an important factor for capital accumulation, the driving power of capitalist development. ‘ANOVA’ table tells us that the impact of HR and WC on operating profit is significant in both the cases of before and after taxation. Interesting Result is that the amount of Value added per Re.1 of salary has declined from 1.660in 1998 to 1.475 in 2012 i.e. by 11% over a period of 15 years. But in respect to the number of employment weighted surplus has increased from Rs.1728 crores in 1998 to Rs.71284 crores in 2012 i.e. by 402.52% on average each year. From this result it can be said that the company is emphasizing not in value addition over time but in the amount of weighted surplus of value added, giving importance to the number of employment, human resource.
DISCUSSION
The study has been conducted on the basis of calculations made in financial reports. Certain confusions may creep in about the modes followed. But to adhere to the reported values these data are strictly pursued. In case of calculations of value added other non-operating income could have been excluded. Another important limitation is that the value added per Re. 1 of salary has showed a declining trend. This may be due to non-segregation of value added made by different departments. In the absence of data about number of employees of and value added by different departments, all employees are taken together. In such a case study each department should have been treated as distinct profit-center, where segregated information regarding value added and compensation could yield some meaningful conclusion.
In spite of limitations, the study has successfully highlighted a basis for group bargaining of compensation. Salary should have a close correlation with the surplus value generated by the workforce. This surplus after meeting the committed costs (finance costs and depreciation) should be awarded to the workforce otherwise there might be scope for high labor turnover and unrest which are prejudicial to the interest of the enterprise. Weighted surplus of value added may be used as a measure for workers contribution to the financial performance of the business.
So, from our study we can conclude that a rational compensation policy for the workforce should take into account the capability of the workers to generate
Great Lakes Herald Page 74Vol 7, No 2, September 2013
value, not confining to merely on profitability or turnover (sales). A sound HR management policy at the same time should focus on development of HR through training, refreshing and retaining the employees with a view to enjoying a competitive advantage over rival concerns through additional profits over the accepted normal.
Page 75Great Lakes Herald Vol 7, No 2, September 2013
REFERENCESYeung A.K., & Berman B. (1997).Adding Value through Human Resources:
Reorienting Human Resource Measurement to Drive Business Performance, Human Resource Management,36(3), Pp. 321–335.
Logozar B. (2012).Adding Value for Greater Profitability in Meat Products, St. Lawrence County Agricultural News, 10(4), p13-14.
Van Staden, C.J. & Vorster, Q. (1998). The Usefulness of the Value-added Statement: A Review of the Literature. Meditari Accounting Research, Vol. 6, 337-351.
Brandt, H (1907). Gewinnbeteiligung und Ertragslohn. Beiträgezur Geschichte und Kritik der Theorienüber die Teilnahme der Arbeiter am Reingewinn, Dresden.
Haller, A. and Stolowy, H. (1998). Value added in financial accounting: A comparative study between Germany and France. Advances in International Accounting, 11(1), 23-51.
Stiles, P. and Kulvisaechana, S. (2003) Human Capital and Performance: A Literature Review, Retrieved on 10th Septemeber 2013 from http://www. bus.tu.ac.th/usr/sab/articles_pdf/research_papers/dti_paper_web.pdf.
J.O. Lawal, O.O. Oduwole, T.R. Shittu And A.A. Muyiwa (2010).Profitability Of Value Addition To Cashew Farming Households In Nigeria, African Crop Science Journal, 19(1), pp. 49 – 54.
Brown, L.M. (2000).The ROI of Human Capital-Measuring the Economic Value of Employee Performance - A Review, Business Book Review, 17(22),p1-9.
Mandal N. & Goswami. S. (2008). Value Added Statement-A Critical Analysis, Great Lakes Herald, 2(2), p98.
Wright, P.M., Gardner, T.M. and Moynihan, L.M. (2003).The impact of HR practices on the performance of business units.Human Resource Management Journal, 13:3, 21-36.
Peacock, L. (2008), Good Human Resources will boost your profits, Personnel Today. Retrieved on 10th Sept 2013 from http://www.personneltoday. com/articles/25/02/2008/44575/good-human-resources-will-boost-your- company-profits-research-proves.htm
Great Lakes Herald Page 76Vol 7, No 2, September 2013
Source: Audited Annual Reports of BHEL.
Year 2001-02
2002-03
2003-04
2004-05
2005-06
2006-07
2007-08
2008-09
2009-10
2010-11
2011-12
Value of Production
( less Excise duty) 6748 6855 7884 10031 13675 17324 20090 27351 33598 41527 47815Less Direct materials,
Power & Fuel and Payment to Contractors 3674 3608 4204 5777 7992 10142 11767 17458 20427 23051 28717