55
Value-Added Dairy Processing Feasibility Report “A Catalyst for Thought” Ray Hammarlund, Cooperative Development Specialist [email protected] July 2003

Value-Added Dairy Processing Feasibility Report
“A Catalyst for Thought”
Ray Hammarlund, Cooperative Development Specialist [email protected]
July 2003

Purpose
Within the dairy industry in Kansas, there has been a rising interest in the area of value-added dairy processing. Whether it is fluid milk or manufactured milk products, individual or group, many producers perceive an opportunity in adding value to their product by further processing or alternative marketing. In response to this rising interest, the Agriculture Marketing Division of the Kansas Department of Commerce has engaged in a study of the opportunities and challenges of value-added processing. This report is the result of this study. Included in this study are an overview of the dairy industry in Kansas, the current trends, and the entire process of dairy processing. Further, fundamental issues of Federal Milk Marketing Orders, seasonality of production and demand are also addressed. Finally, a survey of consumer demands for fluid milk products, in particular organic milk, is included in this study. It is a study of retail demand in Johnson County, Kansas, in the summer of 2001. A summary of that study is included in this document. The entire document is also available on the Kansas Department of Commerce website, entitled, “A Study of Marketing Issues with Organic Milk.” Insights Regarding the Study The conclusions of this study are contained in the section entitled, “Executive Summary.” These are the consensus conclusions of the staff at the Kansas Department of Commerce and those investigators contracted for work on the project. Any user of this information should be mindful of the following caveats:
• This study is not meant to be an all-inclusive template for a business start-up venture. It is a general overview of the marketplace for dairy products and the production and processing mechanics for a value-added venture. Any person or group pursuing such a venture should do additional market research on their own, with the assistance of competent experts in the field with solid, verifiable track records.
• The financial information regarding production and processing is based on a series of assumptions that may not be true to each individual business plan, marketing plan, equipment need and level of capitalization. Persons pursuing value-added ventures in dairy need to do additional work in the financial area of their feasibility and business planning.
• All value-added ventures in agriculture include a considerable amount of risk. This level of risk is additionally intense for value-added dairy ventures. Value-added dairy ventures tend to be capital intensive and require large investments of equity on the part of the principals to establish. Further, dairy products, by their very nature, are perishable and require solid and consistent quality control procedures, which require considerable investments in time, money, research and effort on the part of the business owners.
• The dairy industry in the United States is one of the most regulated industries in agriculture, and for good reason. Again, dairy products, by their very nature, require a marketplace with considerable government oversight to guarantee orderly marketing, balancing seasonal supply and demand, and to assure the quality and consistency of the product on behalf of the consumer. It is imperative that any start-up venture in dairy be well versed in both state and federal regulations in the areas of health, safety, and marketing.
• Finally, no value-added venture in agriculture, be it dairy or otherwise, can hope to succeed without a thorough understanding of the consumer, marketplace and marketing channels, adequate equity investment on the part of the principals, solid legal foundation, and finally, a firm commitment by a team of individuals willing and able to work hard towards a common goal.
ii
Thank You The Agriculture Marketing Division of the Kansas Department of Commerce would like to thank the United States Department of Agriculture, Rural Development/Cooperatives Services for their support in this endeavor. We would also like to thank Dr. Mike Boland and the entire staff of the Arthur Capper Cooperative Center at Kansas State University for their invaluable assistance with this project. In addition, thanks go to the team at Advanced Market Concepts of Manhattan, Kansas, who are responsible for a great deal of the work in this feasibility report. Finally, we would like to thank all those individuals within the Kansas Department of Commerce who contributed their expertise in proofreading, formatting and website management for their contributions to this project.
iii

INTRODUCTION
The economic factors that influence the feasibility of small-scale milk processing in Kansas have changed dramatically over the past several decades. Many of these changes have been brought on by changes in U.S. population demographics, milk production demographics, and significant increases in economies of scale brought on by technology and improved production efficiency. This study examines the changes that have occurred in milk processing and examines the economic feasibility of adding small-scale production capacity in Kansas. Milk processing from fluid milk (bottled milk) to cheese and milk powder are examined in this study. An outline of the numerous product opportunities is detailed, along with many of the steps in the processing. In addition, an evaluation of the marketing opportunities is assessed, along with an examination of the profit opportunities that may be available. Despite the massive changes in milk production and processing that have occurred in the last fifty years, one fact has not changed. Raw milk is a perishable product and it is an expensive product to ship long distances. This fact provides the economic forces that have attempted to keep milk production near major population centers. Environmental concerns, the cost of feed, and the infusion of a large amount of capital to build large commercial dairies has enabled milk production to move away from these population centers and still service these areas with fluid milk. This movement in milk production to different areas of the U.S. has also prompted discussion regarding new opportunities in milk processing and organic milk production in Kansas. This study examines those opportunities and points out the key components in developing a successful (profitable) milk processing operation in Kansas.
1

EXECUTIVE SUMMARY
(Key Conclusions of this Study)
Economies of scale have increased dramatically in milk processing, brought on by improved processing technology, biological engineering, and improved milk quality. This increase in economies of scale has reduced values of many milk products and has resulted in several milk products becoming a generic commodity. Fluid milk, many cheese products, milk powder, condensed milk, and even some ice cream, are all products that have developed a commodity pricing structure throughout the dairy food industry.
Milk production demographics have changed dramatically in the past fifty years with traditional Midwest
production declining, along with production in the Southeastern U.S. California has become the number one producer of milk and large-scale dairies have been developed in California, Southwest U.S., and the U.S. Plains region. Population demographics require large amounts of fluid milk production to move into the Southeast U.S. region during the normal seasonal decline in production that occurs in that region. Overall, milk production facilities are being pushed away from large population centers due to environmental restrictions and the demand for high quality forage at a reasonable price.
The number of milk cows in Kansas hit an “all-time” low in the early 1990’s at 82,000 cows. Since that
time, some growth has occurred, but it has been in the western part of the state, as large dairies have been developed with the infusion of new capital, and smaller dairies in the east have disappeared. The increase in Kansas cow numbers recently has been relatively small compared to the large increases that have been seen in California, Idaho, West Texas, New Mexico, and Arizona.
A key component in the development of any processing facility that would be owned by a group of milk
producers is the understanding of the impact of “balancing” milk use and production. In reality, all processed milk products, other than fluid milk, are simply balancing products. Developing a simple fluid milk business has many inherent risks, as it is difficult to balance the seasonal production volatility with seasonal changes in consumption. Therefore, milk producers are faced with developing a plan to utilize their excess milk production at certain times of the year for other products, or face shortfalls in fluid milk sales during times of improved consumption and decreased production.
Milk-marketing cooperatives in the U.S. have filled many roles since their inception, and there have been
vast changes in the number of cooperatives and their structure. Despite integrating into milk processing businesses and developing other key services for members, the true economic function of a milk-marketing cooperative is the act of balancing. This primarily entails selling raw milk for fluid milk sales (highest priced milk) and then marketing the remaining milk on a daily basis to other milk processors (cheese, powder, condensed, etc). A group of milk producers face the reality of attempting to balance with their own production or simply selling their milk into a cooperative system and re-purchasing the milk for a processing center from the cooperative.
Fluid milk consumption on per-capita basis in the U.S. has been on a steady decline with stiff competition
from carbonated sodas, beer, sports drinks, fruit juices, and most recently, bottled water. With the increase in efficiency with milk bottling companies, along with the decline in the demand for fluid milk, these companies have been forced to become “bottling companies” and have looked for opportunities to bottle the competitive products.
The growth in the dairy food consumption has been in processed products with the substantial growth in the
U.S. coming in cheese consumption. This has primarily been the result of increased consumption of pizza products and Hispanic food products (Mexican food), which are foods that require significant amounts of cheese.
2
The marketing opportunity for a small milk processing facility in Kansas is in creating a “high-value” niche with a processed product. The best opportunity is in specialty cheese products that require lengthy aging, special flavor or attractive packaging. The commodity cheese business is dominated by large processors, which are located in regions of low milk prices. Large volumes of cheese are shipped long distances from these processing plants into major milk producing regions, and the result is a business that is built on extremely narrow profit margins.
Small-scale milk processing in Kansas could create many viable marketing opportunities, but barriers to
enter into these specialty markets are significant. It is critical to obtain a clear marketing channel prior to the start-up of a proposed operation. This start-up can be very difficult for a group of milk producers as they attempt to manage inventory of milk and finished product in a very slow developing market. This must be accomplished under the difficult task of “balancing” the milk production of the dairies that are part of the group, and the amount of milk that is required for the product in the early stages of operation.
Any small-scale operation must clearly develop a taste preference for their processed product. Once this is
developed, the start-up operation can capitalize on the consumer’s desire for the distinct taste that cannot be found in the “commodity” products.
The range in size and type of possible processing ventures is nearly infinite. Until the parameters of a venture are defined, it is not possible to develop good financial projections.
3
CURRENT KANSAS DAIRY INDUSTRY TRENDS Milk Production Several trends are very apparent in the Kansas Dairy Industry. Here’s a description of some of the major trends.
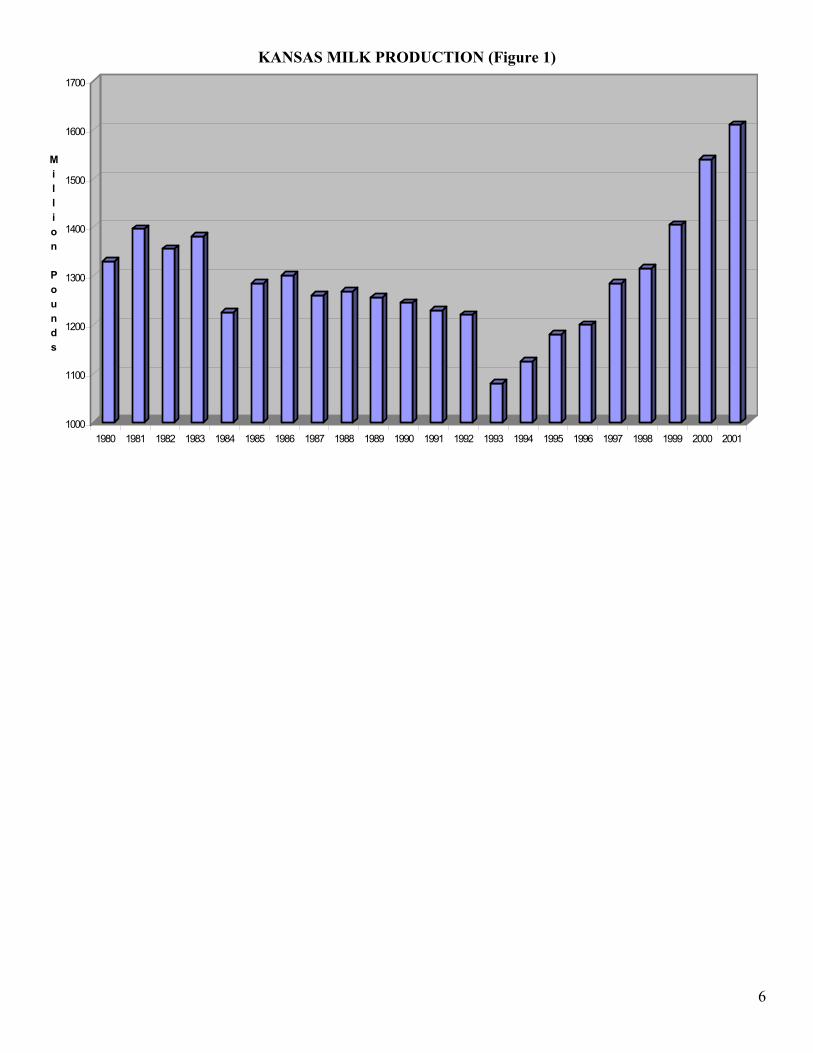
• Production declined gradually through the 1980’s, making a low in 1993. • Since 1993, milk production has climbed sharply. (Figure 1) • Inside the above, described statewide trends, the long-term trend in production can still be described as
stable to declining in all agricultural reporting districts, except the Southwest Kansas district. (Figure 4) • All the growth in Kansas milk production that has occurred in Kansas since 1993 can be attributed to the
Southwest Kansas district. (Figures 4 and 5) The trends are the result of smaller, traditional dairies that have historically made up the Kansas dairy industry leaving the industry; hence, the decline in production seen in the 80’s and the stagnant growth or decline continuing to be seen in most of the state. At the same time, the smaller dairies are leaving; very large dairies are replacing them. The dairies are primarily locating in the Southwest district of the state, though some are locating in other areas. Slight growth is beginning to be evident in the West-central, Northwest and North-central districts. There is no evidence that these trends won’t continue through the next decade. Milk Processing The milk processing industry can only be described as stationary. Kansas has two large volume processors—Hiland Dairy in Wichita and Jackson Ice Cream Company in Hutchinson. These are the only major commercial dairy processors in the state. Kansas State University Dairy is thought to be the next largest facility. The Newhouse Dairy in Wellsville is growing and would be next in size. All the remaining processing is either inactive or very small niche-type businesses. The processor list also includes several transfer stations. (Table 1) Hiland-Roberts Dairy in Kansas City and Anderson-Ericson Dairy in Iowa also serve major segments of the Kansas market. Kansas Department of Agriculture Records Center – DAIRY Section 109 S.W. 9th Street, Topeka, Kansas 66612 Phone: (785) 296-2263 Fax: (785) 296-0673 E-mail: [email protected] Dairy Plants Licensed in Kansas for 2002, July 12, 2002
4

TABLE 1
Bradford Cheese 16432 Headwater Eskridge, Kansas 66423 Phone: (785) 449-2754 License #: 210
Cranston Dairy 1766 N. 500 Road Baldwin City, Kansas 66006 Phone: (785) 594-2683 License #: 192
Gorges Dairy, Inc. 400 N. Main Hillsboro, Kansas 67063 Phone: (316) 947-2747 License #: 191
Hiland 700 E. Central Wichita, Kansas 67201-2199 Phone: (316) 267-4221 License #: 091
IMAC-International Media & Cultures 7210 Oregon Street Sabetha, Kansas 66534 Phone: (785) 284-2161 License #: 147 IMA: 20-350
Jackson Ice Cream Company, Inc. 2600 E. 4th Street Hutchinson, Kansas 67501-0429 Phone: (316) 663-1244 License #: 046 IMA: 20-350
Kan Pak, LLC 1016 S. Summit Street Arkansas City, Kansas 67005 Phone: (620) 442-6820 License #: 150 IMA: 20-301
Kansas State University Dairy Processing Plant 155 Call Hall Manhattan, Kansas 66506 Phone: (785) 532-1293 License #: 302
Newhouse Dairy 4370 Vermont Terrace Wellsville, Kansas 66092 Phone: (785) 883-4547 License #: 036
Niehues Transfer Station 16 Virginia Sabetha, Kansas 66534 Phone: (785) 284-3044 License #: 125
T&R LeDue Milk Hauling 206 2nd Street Greenleaf, Kansas 66943 Phone: (785) 747-2613 License #: 190
Mies Transfer Station 19620 W 85th North Colwich, KS 67030
Hilton House Foods 816 E. Funston Wichita, KS 67211
Jason Wiebe 2932 Goldenrod Durham, KS 67438 (620) 732-2846 License #: 037
Emrich Family Creamery Wheaton, KS License #: 038
Prairie Pride 13700 SW Butler Rd. Rose Hill, KS 67133 License #: not yet assigned
5
KANSAS MILK PRODUCTION (Figure 1)
1000
1100
1200
1300
1400
1500
1600
1700
Million Pounds
1980 1981 1982 1983 1984 1985 1986 1987 1988 1989 1990 1991 1992 1993 1994 1995 1996 1997 1998 1999 2000 2001
6
KANSAS DAIRY COW INVENTORY (Figure 2) January 1
60
65
70
75
80
85
90
95
100
1000 HEAD
1994 1995 1996 1997 1998 1999 2000 2001 2002
KANSAS DAIRY REPLACEMENT HEIFERS (Figure 3)
January 1
0
10
20
30
40
50
60
70
1000 HEAD
1994 1995 1996 1997 1998 1999 2000 2001 2002
7

KANSAS MILK PRODUCTION (Figure 4) By Kansas AG Statistics Reporting Districts
0.000
100.000
200.000
300.000
400.000
500.000
600.000
700.000
800.000
900.000
1980 1981 1982 1983 1984 1985 1986 1987 1988 1989 1990 1991 1992 1993 1994 1995 1996 1997 1998 1999 2000 2001
Mill
ion
Poun
ds
NW
WC
SW
NC
C
SC
NE
EC
SE
SOUTHWEST PRODUCTION DISTRICT (Figure 5) As Percent of Total Kansas Production
1980
1981
1982
1983
1984
1985
1986
1987
1988
1989
1990
1991
1992
1993
1994
1995
1996
1997
1998
1999
2000
2001
SW
%
0%
5%
10%
15%
20%
25%
30%
35%
40%
45%
50%
8
(Figure 6) STRUCTURE OF A DAIRY PROCESSSING PLANT
MULTI-LINE DAIRY PROCESSING FLOWCHART
9
Half-half)
M I L K
C R E A M
I C E
C R E A M
10% Milk Fat 10% NF Solids 16% Sweetener
2% Stabilizer/Emulsifier
Shipping
Whey
Multiple Coolers
Cheese
Starter Cultures Calcium Chloride Renin (enzyme)
Color Salt
Cheese Processing
Ice Cream Manufacturing
Pasteurize
Bottle Blowing Bottling
Homogenize Condenser
Vitamins NFDM
Stabilizer
Blend (Whole, 2%, 1%, Skim,
Raw Cream Storage Raw Milk Storage
Separating
Raw Storage
Unloading Bay
Cheese Cloth
Protein Concentration
Raw Milk: Dairy processing starts with raw whole milk. On average, the milk that comes from a milking center will contain 87% water and 13% solids. The solids will be made up of about 3.7% fat solids and 9% non-fat solids. The fat solids carry the vitamins A, D, E, and K. The non-fat solids include protein levels that average 2.9%. It is delivered to the processing center at a temperature between 36 and 42 degrees Fahrenheit. Unloading/Receiving Bay: The milk is delivered to the processing center in tanker trucks. In some instances, small processing centers are located near the milking center allowing for direct delivery of the raw milk to the processing center through a pipe. An enclosed, all-weather unloading bay is required for sanitary delivery of raw milk. This area must provide a system to adequately clean and sanitize the truck after the milk is unloaded. Raw Milk Storage: Dairy Processing Centers will normally have significant raw milk storage. Small processing centers that are located near a milking center may be able to get by with less raw storage. Most processing plants are not comfortable with storage that is less than the amount of milk that will be utilized in one day. Separation: The first step in processing is separation. No matter what product is to be produced, the raw milk goes through a separation process. In theory, 100% of the fat is removed and then re-blended to the different fluid products that are to be processed. In practice, some of the fluid and a small amount of non-fat solids are removed with the fat solids. Some plants do not separate all the fat and then re-blend. Instead, they remove (separate) only the fat that needs to be removed for the product being bottled. The separation process involves separating the 96.3% water and other non-fat solids from the 3.7% fat solids. In some arrangements, the separation process simply removes the amount of fat solids that are needed to push the amount of fat solids contained in the milk down to 3.25% in order to reach the minimum required for whole milk. In other situations, all of the fat solids are removed and then added back to the water to push the fat solids up to the desired level. The excess fat solids (cream) that are not used for the fluid milk process are used to make other dairy products (primarily ice cream) or sold for use in other food manufacturing (i.e. candy). Raw processing: This consists of putting the raw whole milk through a separator to produce raw skim milk (96.5% water and other non-fat solids) and raw cream. Raw skim milk will be piped to a raw skim storage tank, while the cream will be piped to raw cream storage. There are very few dairy processing operations that would not require a separation process. Multi-Line versus Single Line Processing: The process for milk processing moves in different directions from this point, based upon whether or not the facility is a Multi-Line (several products) facility or a Single-Line facility. For sake of explanation, the following is a description of a Multi-Line processor that bottles Fluid Milk and manufactures Cheese and Ice Cream. Multi-Line Processing: After the separation process in a Multi-line operation, the cream and skim can be blended for any product. This study assumes that the products will be fluid milk products, cheese or ice cream. Dried milk could also be made, but is more suited to large processing plants since the equipment for this process is relatively more expensive than the other products. In addition, dried milk is a commodity and doesn’t allow for product differentiation or niche marketing. A multi-line processing plant would likely sell as much milk as possible into the high-priced fluid market. The raw milk and raw cream would be re-blended for whole milk, 2% milk, 1% milk, skim and flavored milks such as chocolate or strawberry. Additives such as vitamins, non-fat dry milk and stabilizers will be added when the milk products are blended.
10

Half and Half can also be produced in a multi-line plant by utilizing the fat solids (cream) that has been separated. Most of the fluid milk volume will be in whole milk and 2% milk (67% of the total fluid milk business). With milk averaging 3.6% fat, there will be excess cream. This can be stored for a short period and used in ice cream or cheese. If not used in these products, it would be sold to another processor. After blending, the milk would be pasteurized and homogenized before going to a bottling machine. The milk would be packaged into plastic bottles. Bottles can be purchased ready to fill, however, moderate to large operations will find it economical to purchase bottle blowing equipment. Plastic beads can be shipped more economically. Bottles made at the processing plant are much cheaper than shipping empty jugs. Milk sold into the school programs would require equipment for the ½ pint paper containers. After bottling, the fluid products will have to be stored in a cooler until they can be shipped to retail outlets (or direct to consumers). The cooler will have to be large enough to hold at least one day’s production.
WHOLE MILK CONVERSION (Approximate Number as Actual Results will vary) To make one pound of Requires Butter 21.2 lbs whole milk Whole Milk Cheese 10.0 lbs whole milk Evaporated Milk 2.1 lbs whole milk Condensed Milk 2.3 lbs whole milk Whole Milk Powder 7.4 lbs whole milk Powdered Cream 13.5 lbs whole milk Ice Cream (1 gal) 12.0 lbs whole milk (15 pounds when including butter and concentrated milks) Cottage Cheese (Dry Curd basis) 7.25 lbs skim milk Non-fat Dry Milk 11.00 lbs skim milk
11
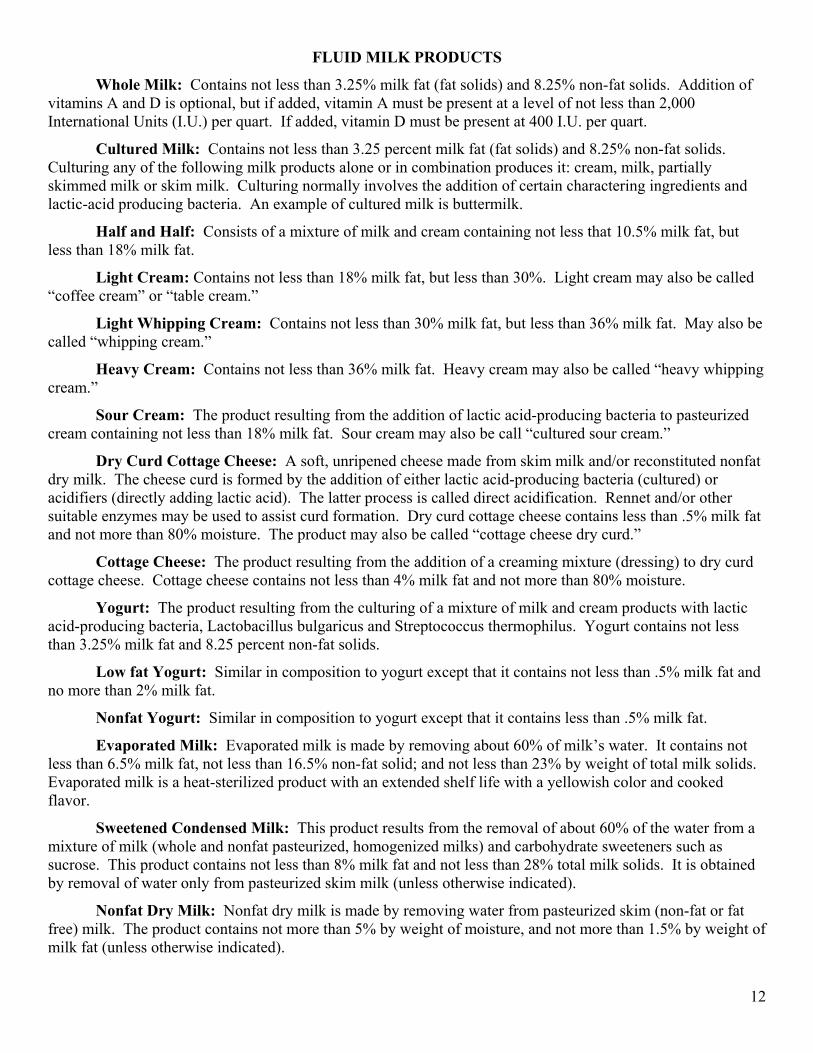
FLUID MILK PRODUCTS
Whole Milk: Contains not less than 3.25% milk fat (fat solids) and 8.25% non-fat solids. Addition of vitamins A and D is optional, but if added, vitamin A must be present at a level of not less than 2,000 International Units (I.U.) per quart. If added, vitamin D must be present at 400 I.U. per quart.
Cultured Milk: Contains not less than 3.25 percent milk fat (fat solids) and 8.25% non-fat solids. Culturing any of the following milk products alone or in combination produces it: cream, milk, partially skimmed milk or skim milk. Culturing normally involves the addition of certain charactering ingredients and lactic-acid producing bacteria. An example of cultured milk is buttermilk.
Half and Half: Consists of a mixture of milk and cream containing not less that 10.5% milk fat, but less than 18% milk fat.
Light Cream: Contains not less than 18% milk fat, but less than 30%. Light cream may also be called “coffee cream” or “table cream.”
Light Whipping Cream: Contains not less than 30% milk fat, but less than 36% milk fat. May also be called “whipping cream.”
Heavy Cream: Contains not less than 36% milk fat. Heavy cream may also be called “heavy whipping cream.”
Sour Cream: The product resulting from the addition of lactic acid-producing bacteria to pasteurized cream containing not less than 18% milk fat. Sour cream may also be call “cultured sour cream.”
Dry Curd Cottage Cheese: A soft, unripened cheese made from skim milk and/or reconstituted nonfat dry milk. The cheese curd is formed by the addition of either lactic acid-producing bacteria (cultured) or acidifiers (directly adding lactic acid). The latter process is called direct acidification. Rennet and/or other suitable enzymes may be used to assist curd formation. Dry curd cottage cheese contains less than .5% milk fat and not more than 80% moisture. The product may also be called “cottage cheese dry curd.”
Cottage Cheese: The product resulting from the addition of a creaming mixture (dressing) to dry curd cottage cheese. Cottage cheese contains not less than 4% milk fat and not more than 80% moisture.
Yogurt: The product resulting from the culturing of a mixture of milk and cream products with lactic acid-producing bacteria, Lactobacillus bulgaricus and Streptococcus thermophilus. Yogurt contains not less than 3.25% milk fat and 8.25 percent non-fat solids.
Low fat Yogurt: Similar in composition to yogurt except that it contains not less than .5% milk fat and no more than 2% milk fat.
Nonfat Yogurt: Similar in composition to yogurt except that it contains less than .5% milk fat.
Evaporated Milk: Evaporated milk is made by removing about 60% of milk’s water. It contains not less than 6.5% milk fat, not less than 16.5% non-fat solid; and not less than 23% by weight of total milk solids. Evaporated milk is a heat-sterilized product with an extended shelf life with a yellowish color and cooked flavor.
Sweetened Condensed Milk: This product results from the removal of about 60% of the water from a mixture of milk (whole and nonfat pasteurized, homogenized milks) and carbohydrate sweeteners such as sucrose. This product contains not less than 8% milk fat and not less than 28% total milk solids. It is obtained by removal of water only from pasteurized skim milk (unless otherwise indicated).
Nonfat Dry Milk: Nonfat dry milk is made by removing water from pasteurized skim (non-fat or fat free) milk. The product contains not more than 5% by weight of moisture, and not more than 1.5% by weight of milk fat (unless otherwise indicated).
12

FLUID MILK PROCESSING The processing and selling of fluid milk products has been the backbone of the dairy/milk industry, but is also the industry that has suffered from extreme competition from other fluid products in the past two decades. Carbonated beverages, juices, sports drinks, bottled water and beer are some of the products that have inhibited the growth in per-capita consumption of fluid milk. Twenty-years ago, a fluid milk bottler would have been involved in the fluid milk business exclusively, but today these entrepreneurs now consider themselves “bottlers” and now bottle many other products other than milk products. This move has become imperative, as bottlers have realized that the fixed costs of processing require that a plant operate at full capacity. Therefore, with the lack of growth in the per capita consumption of milk, bottlers have utilized their plant by bottling water, juice and sports drinks. In addition, distribution costs have increased dramatically and it has become economical for fluid milk bottlers to process the additional items for marketing and distribution. Many distributors and retailers would rather do business with a processor who provides a full line of fluid products, and that has also been an incentive for traditional fluid milk bottlers to add these other products to their processing line. The improved technology has increased efficiency dramatically. The ability to process large volumes of fluid product with reduced labor costs and reduced packaging costs has lead to a dramatic decrease in margins. Therefore, as margins have become tighter, there has been a continued move to larger scale plants and increased concentration in the fluid milk processing business. The increase in concentration in the fluid milk processing has made it very difficult for small processors to survive in this business. Small processors are normally not able to establish contracts to process additional product lines (i.e. juices and water), which results in their fixed costs being higher, and are shut out of many markets. Therefore, small fluid milk processors are forced to work to establish a niche in the fluid milk market. These niches come from promoting their milk in the following ways:
Better Flavor. More solids in their milk, which creates a smoother taste. Many consumers prefer this taste and will pay a premium for this product. This is done by acquiring certain qualities of milk and processing the milk in a manner that the consumer can differentiate the taste. One concern with this market is that consumers have been looking to reduce fat in their milk.
Increased Shelf Life. Small producer/handlers of fluid milk will many times promote a
longer shelf life for their fluid product. This has become difficult to maintain as distribution costs have made it difficult to run routes to retailers on a daily basis. Therefore, small processors have found it difficult to demonstrate increased shelf life versus large processors.
Perceived Quality. There is a significant sector of the U.S. economy that is attracted to
the idea of buying high quality products from small processors who “control their quality” and create an image of high quality. These consumers are likely to pay a premium for this perceived quality. The critical aspect of this marketing plan is that a small processor must be located near a large metropolitan area, as the percentage of consumers that will move their buying habits for fluid milk to this perceived quality is small (likely less than 10% of a given market area).
13

Organic. Another segment of differentiation is the organic sector. Small processors are able to capture significant consumer markets that desire to buy fluid milk, which is produced organically. This market requires a substantial premium and is susceptible to dramatic changes in consumer preference.
Packaging. Small processors have also created niche markets centered on attractive
packaging (glass bottles & decorative containers). Glass containers many times create a perceived quality. Once again, this is a small percentage of the total market (less than 3%); therefore, marketing into a large metropolitan area with a high-income level is critical.
Direct Delivery (Home Delivery). There is also a sector of the consumer market that
will pay a premium for direct delivery of fluid milk. Once again, the marketing plan is based on selling a perceived or real improvement in quality. The costs of distribution for this market have made it very difficult, as consumers have to be willing to pay a premium and work with the processor to find methods to accept delivery of, and pay for, the milk.
In all of the cases listed above, it is critical that the process be located near a large metropolitan area, as the milk in these markets is small and consumer preferences can change dramatically. Because fluid milk has become a commodity in the eye of most consumers, they have become very sensitive to price. Therefore, fluid milk producers will gravitate to the lowest price for fluid milk. In many cases they will develop brand loyalty, but have a difficult time distinguishing between the other fluid milk products sold by large “bottlers.” In other words, consumers may develop some loyalty, but it is very unpredictable for fluid milk, and it is difficult to differentiate.
In comparison, a large number of consumers can differentiate between two different carbonated beverages (i.e. Coke and Pepsi), but they are unable to differentiate between two different brands of whole milk (especially if they are in the same type of container) and will gradually move to the lowest price. Therefore, it is not economical for a small milk processor to work exclusively with fluid milk. The only successful small fluid process would require a small multi-line plant that could market a small percentage of its milk in the fluid market by utilizing one (or more) of the niches listed above.
14
FLUID MILK CONSUMPTION AND PRODUCTION
Fluid milk (Class I) is the market that receives the bulk of the milk production in the United States. U.S. milk production is now 170 billion pounds annually and about 56 billion pounds is used to produce and consume fluid milk and fluid milk products (listed below). Therefore, approximately 33% of the U.S. milk production moves into the fluid milk product market. An indicator of how this market has struggled is the fact that just twenty years ago, 41% of the total milk production in the U.S. was used in the fluid milk product market. Since that time, per capita consumption of fluid milk products has dropped from 235 lbs. to 195 lbs. (despite the introduction of numerous new products) as a result of extreme competition from other products. The per capita consumption drop has been somewhat directly correlated with the growth in the convenience store sales. Convenience stores have increased the sales of many products, but fluid milk products have not kept pace with the new products (carbonated beverages, juice, water, beer). One significant factor has been the lack of innovation in the fluid milk business to provide a bottle that was marketable (convenient) to consumers at the convenience store. Recent innovations in bottling have resulted in some improvement in this packaging, but the industry lost a large amount of ground from 1980 to 2000. During that period, total U.S. milk production grew from 128 to 167 billion pounds. At the same time, total fluid milk product consumption increased from 53 to 55 billion pounds. Obviously, the growth in the use of U.S. milk has been in products other than fluid products. A typical fluid milk product plant will likely have the following sales distribution:
Whole Milk 35% Reduced Fat (2%) 32% Low Fat (1%) 16% Non Fat (Skim) 15% Buttermilk or Half &Half 2%
15

Financial projections for fluid milk processing are discussed later in section—Financial Numbers in Dairy Processing.
COMPONENTS OF MILK (Figure 7)
Fat3.6%
Protein3.1%
Other Solids6.3%
16
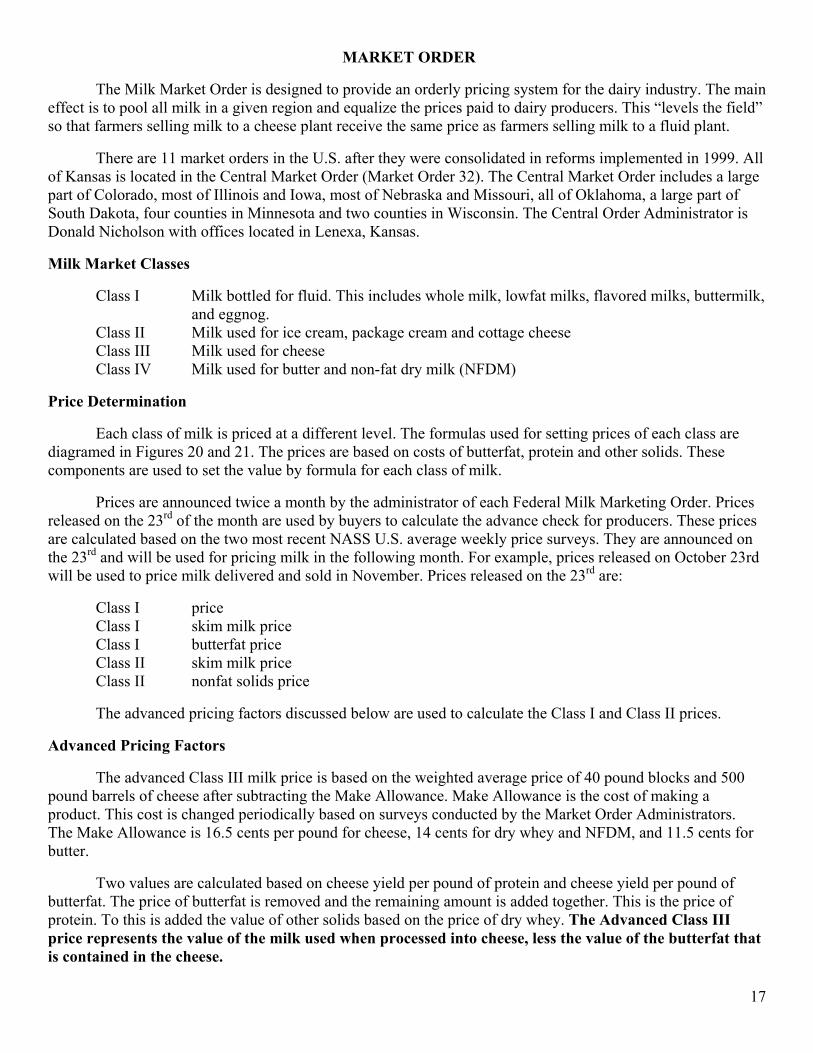
MARKET ORDER The Milk Market Order is designed to provide an orderly pricing system for the dairy industry. The main effect is to pool all milk in a given region and equalize the prices paid to dairy producers. This “levels the field” so that farmers selling milk to a cheese plant receive the same price as farmers selling milk to a fluid plant. There are 11 market orders in the U.S. after they were consolidated in reforms implemented in 1999. All of Kansas is located in the Central Market Order (Market Order 32). The Central Market Order includes a large part of Colorado, most of Illinois and Iowa, most of Nebraska and Missouri, all of Oklahoma, a large part of South Dakota, four counties in Minnesota and two counties in Wisconsin. The Central Order Administrator is Donald Nicholson with offices located in Lenexa, Kansas. Milk Market Classes
Class I Milk bottled for fluid. This includes whole milk, lowfat milks, flavored milks, buttermilk, and eggnog. Class II Milk used for ice cream, package cream and cottage cheese Class III Milk used for cheese Class IV Milk used for butter and non-fat dry milk (NFDM)
Price Determination Each class of milk is priced at a different level. The formulas used for setting prices of each class are diagramed in Figures 20 and 21. The prices are based on costs of butterfat, protein and other solids. These components are used to set the value by formula for each class of milk. Prices are announced twice a month by the administrator of each Federal Milk Marketing Order. Prices released on the 23rd of the month are used by buyers to calculate the advance check for producers. These prices are calculated based on the two most recent NASS U.S. average weekly price surveys. They are announced on the 23rd and will be used for pricing milk in the following month. For example, prices released on October 23rd will be used to price milk delivered and sold in November. Prices released on the 23rd are:
Class I price Class I skim milk price Class I butterfat price Class II skim milk price Class II nonfat solids price
The advanced pricing factors discussed below are used to calculate the Class I and Class II prices. Advanced Pricing Factors The advanced Class III milk price is based on the weighted average price of 40 pound blocks and 500 pound barrels of cheese after subtracting the Make Allowance. Make Allowance is the cost of making a product. This cost is changed periodically based on surveys conducted by the Market Order Administrators. The Make Allowance is 16.5 cents per pound for cheese, 14 cents for dry whey and NFDM, and 11.5 cents for butter. Two values are calculated based on cheese yield per pound of protein and cheese yield per pound of butterfat. The price of butterfat is removed and the remaining amount is added together. This is the price of protein. To this is added the value of other solids based on the price of dry whey. The Advanced Class III price represents the value of the milk used when processed into cheese, less the value of the butterfat that is contained in the cheese.
17

The advanced Class IV price is based on the price of non-fat dry milk. The Make Allowance of 14 cents is deducted and the result is the non-fat solids price. This is then adjusted to a skim milk price by multiplying by nine (9). This is the advanced Class IV price. The Advanced Class IV price represents the value of milk when processed in NFDM after the butterfat is removed. The advanced butterfat price is calculated by subtracting the 11.5 cents Make Allowance from the price of butter. This is then divided by 0.82 (the percentage of fat in butter) to reach the advanced butterfat price. The second set of prices are released on the 5th of the month. They are based on a weighted average of all the weekly prices announced by NASS for the previous month. The prices that are released on the 5th are the following:
Class II price Class II butterfat price Class III price Class III skim milk price Class IV price Class IV skim milk price Butterfat price Nonfat solids price Protein price Other solids price Somatic cell adjustment rate
The following narrative roughly explains the price calculations for each class of milk. The actual calculations require tremendous amounts of data. NASS surveys cheese, butter and other product markets. Using weekly NASS survey data, each market order publishes the price data for producers in their region. The formulas are somewhat complex. The understanding of the formulas will be enhanced by studying the diagrams which accompany this section in Figures 20 and 21. Class I milk is based on the higher of the advanced Class III or advanced Class IV skim price plus the Class I differential for the skim portion of the milk. The butterfat portion is based on the advanced Butterfat Price adjusted for the Class I differential. The final Class I price is the sum of the skim portion and the butterfat. The Class I differential for all Kansas counties is either $2.00 or $2.20, depending on location. A table of values for all Kansas counties is included in Table 9. Class II milk is based on the advanced Class IV price plus 70 cents to determine the skim portion. The fat portion is the Butterfat price. The Butterfat formula is the same formula as the advanced butterfat price, but is based on a weighted average of butter prices for the full month, not the two-week period of the prior month used for the advanced price. The Class II skim portion is added to the Butterfat price for the final Class II price. Class II and Class IV are considered interchangeable. Class II can become Class IV by drying. Class IV can replace Class II in many products. The difference in price is the 70 cents cost of drying. Class III final price formula is very similar to that used to calculate the Class III advance price, but uses cheddar cheese prices for the whole month instead of just the two weeks data from the previous month. This yields a Class III skim price. Butterfat is added to this to determine the Class III final price. Class IV final price formula is based on non-fat dry milk for the full month rather than only two weeks to determine the skim price. Butterfat is added in to determine the final Class IV price. Class III milk is usually the lowest priced, though Class IV is sometimes the lowest priced class.
18

When handlers sell milk in classes priced higher than Class III, they must send the premium above Class III to the market administrator. The premiums are totaled and divided by total milk production for the month. This average premium is called the producer price differential (PPD). This is paid back to the handlers, usually coops, who allocate the premium back to dairy producers. If Class IV is priced lower than Class III, then Class IV will be subsidized back to the handler. This assures that all producers receive a fair price. It avoids a few receiving high prices for fluid milk (Class I) and others receiving lower prices for manufacturing milk. There are exceptions: Exempt plants are plants that process less than 150,000 lbs. of milk per month. An exempt plant is a very small plant. This would be 60 to 100 cows depending on productivity. University- or government-owned plants can be exempt and are not limited to the 150,000 limit. There is some discussion of limiting the size of producer-handlers to some amount, for example 1,000,000 pounds per month. All producer-handlers exceeding this size would then be regulated and forced to become a part of the pool. While most producer-handlers are small, there are some very large producer-handlers, such as Bram’s. Producer-handlers can process their own milk. There is no limit on the size of these plants, but producer-handlers must be single-entity, family-owned dairies processing their own milk. If a producer-handler is larger than 150,000 pounds per month, then they are limited to purchases of no more than 150,000 pounds per month to make a production shortfall. If a producer-handler’s milk production is less than 150,000, then there is no limit to how much milk can be purchased and processed from a regulated handler. This would be the milk from 80 cows producing 60 pounds per day. Three or more producers could form their own coop and begin processing. This coop, being owned by more than one entity, will be regulated by the market administrator. Premiums will have to be paid into the pool for all milk used in classes that are priced above Class III. If producers take this route to form their own coop and process their own milk, the price received (paid) for the raw milk will not differ much from that paid by traditional dairy coops. Dairy coops can allocate the proceeds in any way that they choose. Usually some producers are subsidized while others receive less than average. This “subsidy” comes in several forms. Common ways for a coop to subsidize certain members would be freight and volume premiums. To the extent that producers have been subsidizing others within the coop, as well as the extent that they can save on operating expenses, forming their own small coop may raise the farm price of the milk. The main benefit of forming a processing coop will be to make the profit on the processing. It is important not to confuse margin with profit. Margin is the difference between the cost of the raw milk and price received for the products. Profit is the part of margin, if any, remaining after all processing expenses—labor, overhead, etc. — have been deducted. The Market Orders are very complex legal documents. There are unlimited possibilities to shift milk between Market Orders. Rules can be changed relatively quickly after scheduling hearings. Large coops probably have some advantages in exploiting differences between the different Market Orders. Their sheer size may be a disadvantage. Extra overhead costs and shifting funds to certain areas at the expense of other areas in the coop’s territory may be negative to individual producers.
19

Advanced Pricing Factor (Figure 20) Released on 23rd – based on previous 2 weeks prices
20

Class Prices (Figure 21) Based on Prior months prices – released on 5th (except Class I which is released on the 23rd of the prior month based on advanced prices)
21
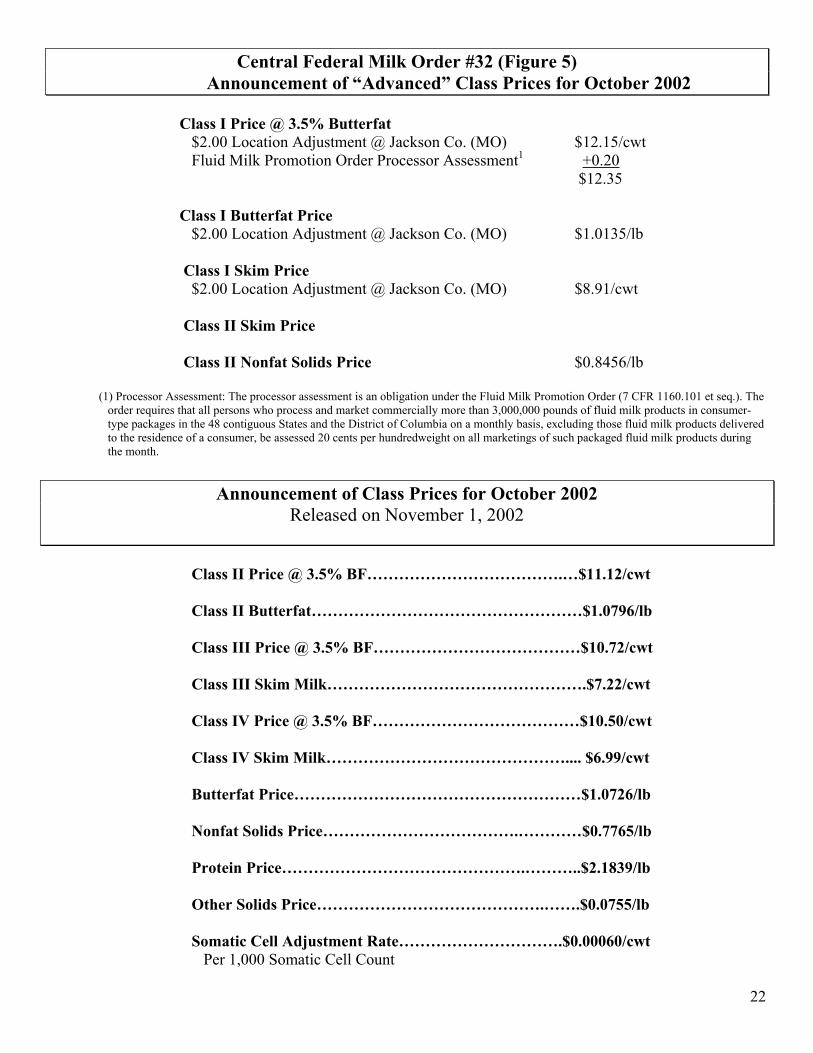
Central Federal Milk Order #32 (Figure 5) Announcement of “Advanced” Class Prices for October 2002
Class I Price @ 3.5% Butterfat $2.00 Location Adjustment @ Jackson Co. (MO) $12.15/cwt Fluid Milk Promotion Order Processor Assessment1 +0.20 $12.35 Class I Butterfat Price $2.00 Location Adjustment @ Jackson Co. (MO) $1.0135/lb Class I Skim Price $2.00 Location Adjustment @ Jackson Co. (MO) $8.91/cwt Class II Skim Price Class II Nonfat Solids Price $0.8456/lb (1) Processor Assessment: The processor assessment is an obligation under the Fluid Milk Promotion Order (7 CFR 1160.101 et seq.). The
order requires that all persons who process and market commercially more than 3,000,000 pounds of fluid milk products in consumer-type packages in the 48 contiguous States and the District of Columbia on a monthly basis, excluding those fluid milk products delivered to the residence of a consumer, be assessed 20 cents per hundredweight on all marketings of such packaged fluid milk products during the month.
Announcement of Class Prices for October 2002
Released on November 1, 2002 Class II Price @ 3.5% BF……………………………….…$11.12/cwt Class II Butterfat……………………………………………$1.0796/lb Class III Price @ 3.5% BF…………………………………$10.72/cwt Class III Skim Milk………………………………………….$7.22/cwt Class IV Price @ 3.5% BF…………………………………$10.50/cwt Class IV Skim Milk……………………………………….... $6.99/cwt Butterfat Price………………………………………………$1.0726/lb Nonfat Solids Price……………………………….…………$0.7765/lb Protein Price……………………………………….………..$2.1839/lb Other Solids Price…………………………………….…….$0.0755/lb Somatic Cell Adjustment Rate………………………….$0.00060/cwt Per 1,000 Somatic Cell Count
22

“Advanced” Pricing Factors For October 2002 (Table 6)
Prices Used Only in Calculating Advanced Class I & II Prices Advanced Class III Skim Milk Price $6.64 /cwt Advanced Butterfat Price $0.9935 /lb Advanced Class III Price @ 3.5% BF $9.88 /cwt Advanced Class IV Skim Milk Price $6.91 /cwt Advanced Class IV Price @3.5% BF $10.15 /cwt
Base Price @ 3.5% BF For Class I $10.15 /cwt
NASS Two-Week Product Price Weighted Averages (Per Lb)
Nonfat Dry Butter Dry Milk Cheese2 Whey
Wtd. 2-Week Average $0.9297 $0.9080 $1.1427 $0.1703
Component Prices for October 2002
Nonfat Dry
Butter Dry Milk Cheese2 Whey
Week 1 Ending 10/05/02 $0.9617 $0.9139 $1.1754 $0.2026 Week 2 Ending 10/12/02 $0.9840 $0.9179 $1.2092 $0.2162 Week 3 Ending 10/19/02 $1.0099 $0.9194 $1.2216 $0.2127 Week 4 Ending 10/26/02 $1.0316 $0.9152 $1.2004 $0.2199 Wtd. Monthly Average $0.9945 $0.9165 $1.2020 $0.2131
2The cheese price is weighted average of the: (a) NASS 40lb. block cheese and (b) NASS 500 lb. barrel cheese (38% moisture) plus 3 cents
Note: These prices were computed using the formulas in the U.S. District Court’s preliminary
injunction order dated January 31, 2001. The price formulas may be found at:
www.ams.usda.gov/dairy/price_formula.htm
Regional Milk Production Costs ($/cwt)
Note: For information contact the following Economic Research Service (ERS) staff members:
James Johnson, 202-694-5560; William McBride, 202-694-5577;
or Sara Short, 202-694-5588. Additional Information can be found at
www.ers.usda.gov/data/costsandreturns/testpick.htm ( select milk )
23
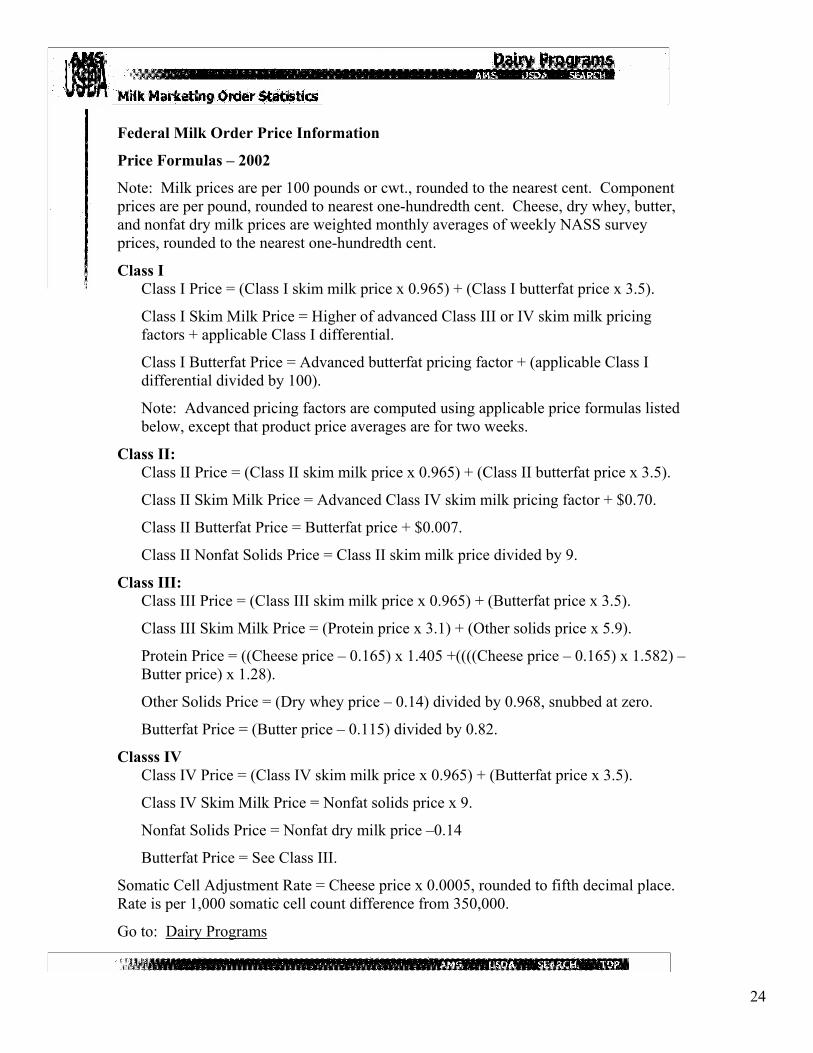
Federal Milk Order Price Information
Price Formulas – 2002
Note: Milk prices are per 100 pounds or cwt., rounded to the nearest cent. Component prices are per pound, rounded to nearest one-hundredth cent. Cheese, dry whey, butter, and nonfat dry milk prices are weighted monthly averages of weekly NASS survey prices, rounded to the nearest one-hundredth cent.
Class I Class I Price = (Class I skim milk price x 0.965) + (Class I butterfat price x 3.5).
Class I Skim Milk Price = Higher of advanced Class III or IV skim milk pricing factors + applicable Class I differential.
Class I Butterfat Price = Advanced butterfat pricing factor + (applicable Class I differential divided by 100).
Note: Advanced pricing factors are computed using applicable price formulas listed below, except that product price averages are for two weeks.
Class II: Class II Price = (Class II skim milk price x 0.965) + (Class II butterfat price x 3.5).
Class II Skim Milk Price = Advanced Class IV skim milk pricing factor + $0.70.
Class II Butterfat Price = Butterfat price + $0.007.
Class II Nonfat Solids Price = Class II skim milk price divided by 9.
Class III: Class III Price = (Class III skim milk price x 0.965) + (Butterfat price x 3.5).
Class III Skim Milk Price = (Protein price x 3.1) + (Other solids price x 5.9).
Protein Price = ((Cheese price – 0.165) x 1.405 +((((Cheese price – 0.165) x 1.582) – Butter price) x 1.28).
Other Solids Price = (Dry whey price – 0.14) divided by 0.968, snubbed at zero.
Butterfat Price = (Butter price – 0.115) divided by 0.82.
Classs IV Class IV Price = (Class IV skim milk price x 0.965) + (Butterfat price x 3.5).
Class IV Skim Milk Price = Nonfat solids price x 9.
Nonfat Solids Price = Nonfat dry milk price –0.14
Butterfat Price = See Class III.
Somatic Cell Adjustment Rate = Cheese price x 0.0005, rounded to fifth decimal place. Rate is per 1,000 somatic cell count difference from 350,000.
Go to: Dairy Programs
24

(Table 9) Class I Differentials in Kansas
Allen 2.20 Greeley 2.20 Osborne 2.00 Anderson 2.00 Greenwood 2.20 Ottawa 2.00 Atchison 2.00 Hamilton 2.20 Pawnee 2.20 Barber 2.20 Harper 2.20 Phillips 2.00 Barton 2.20 Harvey 2.20 Pottawatomie 2.00 Bourbon 2.20 Haskell 2.20 Pratt 2.20 Brown 2.00 Hodgeman 2.20 Rawlins 2.00 Butler 2.20 Jackson 2.00 Reno 2.20 Chase 2.20 Jefferson 2.00 Republic 2.00 Chautauqua 2.20 Jewell 2.00 Rice 2.20 Cherokee 2.20 Johnson 2.00 Riley 2.00 Cheyenne 2.20 Kearny 2.20 Rooks 2.00 Clark 2.20 Kingman 2.20 Rush 2.20 Clay 2.00 Kiowa 2.20 Russell 2.00 Cloud 2.00 Labette 2.20 Saline 2.00 Coffey 2.00 Lane 2.20 Scott 2.20 Comanche 2.20 Leavenworth 2.00 Sedgwick 2.20 Cowley 2.20 Lincoln 2.00 Seward 2.20 Crawford 2.20 Linn 2.00 Shawnee 2.00 Decatur 2.00 Logan 2.20 Sheridan 2.00 Dickinson 2.00 Lyon 2.00 Sherman 2.20 Doniphan 2.00 Marion 2.20 Smith 2.00 Douglas 2.00 Marshall 2.00 Stafford 2.20 Edwards 2.20 McPherson 2.20 Stanton 2.20 Elk 2.20 Meade 2.20 Stevens 2.20 Ellis 2.00 Miami 2.00 Sumner 2.20 Ellsworth 2.00 Mitchell 2.00 Thomas 2.00 Finney 2.20 Montgomery 2.20 Trego 2.20 Ford 2.20 Morris 2.00 Wabaunsee 2.00 Franklin 2.00 Morton 2.20 Wallace 2.20 Geary 2.00 Nemaha 2.00 Washington 2.00 Gove 2.20 Neosho 2.20 Wichita 2.20 Graham 2.00 Ness 2.20 Wilson 2.20 Grant 2.20 Norton 2.00 Woodson 2.20 Gray 2.20 Osage 2.00 Wyandotte 2.00
25

SEASONALITY Seasonality of Production
Production varies seasonally for individual operations and the industry as a whole. The primary cause of this seasonality in production is weather. Summer heat results in lower feed consumption, leading to lower production. The degree of change in production depends on many factors. The first factor is the actual temperatures and humidity that occurs, and the duration of the hot conditions. This is different every year, making planning extremely difficult. Other factors are the ability to meliorate the heat effects on the cattle through use of shades, fans and sprinklers, as well as changing diets to improve consumption and calorie intake. Modern freestall dairies can provide optimum comfort to cows. This is reducing the degree of seasonality as newer, well-designed dairies replace more old-fashioned dairies. Organic dairies are required to have cows on pasture in natural conditions. This results in greater seasonal differences. The seasonal concept of managing a dairy—normally calving the cows in the spring and drying them up in late winter—results in a tremendous seasonal pattern that must be balanced by the dairy if they process their own milk, or the milk handler if the milk is sold. Another less obvious effect of heat is on fertility and conception rates on cows. This results in increased days-in-milk and lower production about 290 days following the summer heat. Production falls as days-in-milk increases. Weather also affects feed quality, price and quantity. These changes in feed availability and cost will affect production for longer periods, often a full year. Over the period of 1970 through 2001, the seasonal low in total U.S. milk production averaged 95 percent of annual average production and occurred in early November. During that period, milk production peaked at nearly 107 percent of the annual average, with peak production coming in May. Regionally, production peaks and lows occur at different times due to differences in climate across the country. For example, the Northwest region of the country peaks in July, two months later than the peak in total U.S. production. The Southeast and South-central areas of the country tend to bottom in September, two months earlier than the U.S. average. Organic dairies have greater seasonal changes in production than “conventional” dairies. Pasture conditions in most areas of the country result in more seasonal changes compared to the managed conditions of a freestall facility. While the lower productivity of most organic cows is positive for conception rates, breeding problems caused by heat have more impact on production in organic dairies, which cannot use BST. BST extends lactations and maintains production, as days-in-milk increases, at a significantly higher level than non-treated cows. Production seasonality charts for the U.S., as well as regional charts, can be found in Figures 22, 23, 29, 30 and 31. Seasonality of Demand The highest value usage for milk is for fluid consumption. Demand for fluid milk has some definite seasonal factors, as well. One of the biggest factors is the increase in milk consumption during the school year. This may become less of a factor due to a trend to year-round school, as well as a trend for children to have more choices in drinking or not drinking milk in school. In many areas, milk consumption shifts from the school to home when school is out. Total consumption doesn’t change, but packaging and location of sales and consumption changes.
26

Fluid uses of milk all fall into Class I under the Federal Market Orders. During the 5-year period from 1997 through 2001, average daily utilization of Class I milk was 124.4 million pounds. This varied from a peak period from January through March at approximately 128 million pounds per day, to a low in early July of just 117 million pounds. There is a second peak just under 128 million pounds per day from September through November. Class I utilization falls off during December when eggnog consumption fails to offset drops in other fluid uses during the holidays. See Average Daily Class I Milk Utilization chart (Figure 28). There is a very strong seasonality in cheese production. Cheese production is strong through the first five months of the year before falling off sharply to a low in August. It then steadily rebounds into the end of the year. There is a strong visual correlation between seasonal cheese production and seasonal milk production. Data from an AC Nielsen study printed in the Idea’s Cheese Facts show similar seasonal trends. Frequency of cheese purchases is highest in the first and fourth quarters and lowest in the third quarters. Pounds per buying household are significantly higher in the first and fourth quarters at 5.7 and 6.0 pounds respectively. The third quarter is much lower at 5.3 pounds. This data shows cheese consumption following a seasonal pattern that complements the seasonal production of milk. It is not clear whether cheese consumption drives cheese production or whether milk production drives cheese production and consumption. All cheese production and Cheddar cheese production charts are found in Figures 24 and 25. With more shelf life than fluid, a multi-line plant for balancing the fairly large seasonal variations in production could use cheese processing. Seasonal ice cream production differs markedly from other dairy products. Production is lowest in the winter, bottoming in December, and highest in the summer, peaking in June 65% higher than the winter lows. This production pattern is clearly driven by seasonal consumption patterns. The ice cream consumption pattern should be the same as the ice cream production, but it is lagged approximately one month. The ice cream industry gears up and builds inventory ahead of the prime consumption period for ice cream. See the ice cream production chart (Figure 26). The seasonality in the consumption of ice cream offsets the seasonality of fluid consumption. A plant that processes both fluid milk and ice cream could use nearly the same quantity of raw milk each week year round. (Do not confuse this with balancing the seasonality of production) NFDM is manufactured for use in many products. In addition, it has the role of residual use for the industry. When the milk market has excess milk that is not being used in other dairy products, it is dried and taken off the market. If milk is short, the NFDM industry reduces production. The NFDM production seasonal closely follows the milk production seasonal. (Figure 27). Butter and NFDM can be substituted for raw milk to provide the needed fat and non-fat solids needed to make ice cream. In the preceding discussion, seasonal production of the various dairy products was analyzed. Consumption data is not readily available for any dairy products. Production data has been analyzed as a proxy for consumption data. The assumption has been made that monthly production of individual dairy products roughly matches consumption. This assumption becomes less valid as products have less value and/or are more storable. Cheese consumption and production are less correlated than fluid milk. Dry milk obviously has the lowest degree of correlation between production and consumption.
27

Seaso
90%
92%
94%
96%
98%
100%
102%
104%
106%
108%
Jan Feb Mar
Perc
ent o
f Ann
ual A
vera
ge P
rodu
ctio
n
90.00
92.00
94.00
96.00
98.00
100.00
102.00
104.00
106.00
108.00
Jan Feb
Perc
ent
U.S. MILK PRODUCTION (Figure 22) nal Changes in Average Daily Milk Production
1970 through 2001
Apr May Jun Jul Aug Sep Oct Nov Dec
U.S. MILK PRICE SEASONAL (Figure 23)1992 through 2001Mar Apr May Jun Jul Aug Sep Oct Nov Dec
28
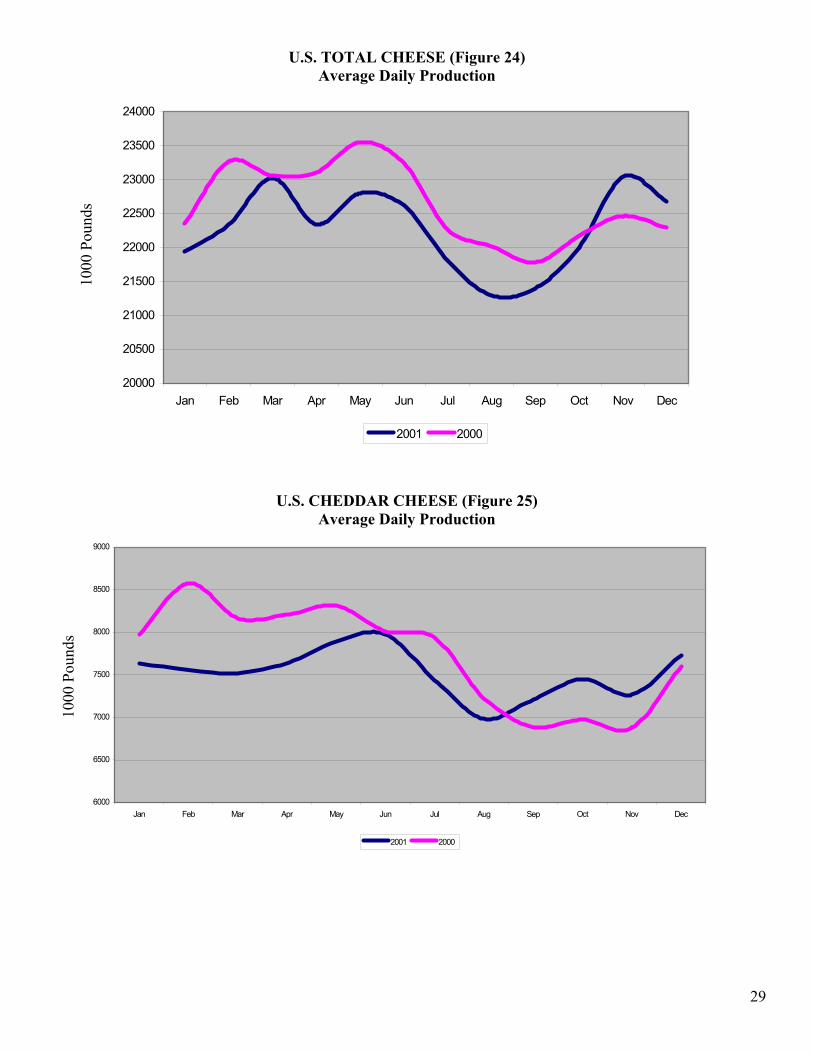
U.S. TOTAL CHEESE (Figure 24) Average Daily Production
20000
20500
21000
21500
22000
22500
23000
23500
24000
Jan Feb Mar Apr May Jun Jul Aug Sep Oct Nov Dec
2001 2000
1000
Pou
nds
U.S. CHEDDAR CHEESE (Figure 25) Average Daily Production
6000
6500
7000
7500
8000
8500
9000
Jan Feb Mar Apr May Jun Jul Aug Sep Oct Nov Dec
2001 2000
1000
Pou
nds
29
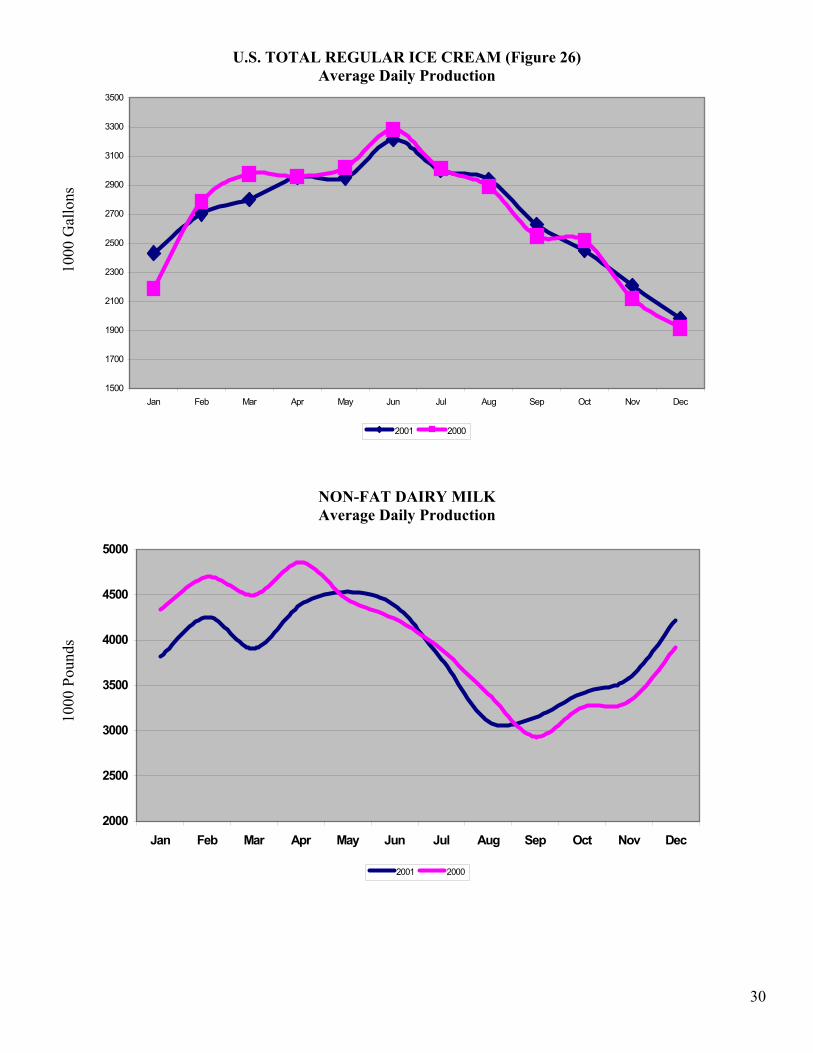
U.S. TOTAL REGULAR ICE CREAM (Figure 26) Average Daily Production
1500
1700
1900
2100
2300
2500
2700
2900
3100
3300
3500
Jan Feb Mar Apr May Jun Jul Aug Sep Oct Nov Dec
2001 2000
1000
Gal
lons
NON-FAT DAIRY MILK Average Daily Production
2000
2500
3000
3500
4000
4500
5000
Jan Feb Mar Apr May Jun Jul Aug Sep Oct Nov Dec
2001 2000
1000
Pou
nds
30

AVERAGE DAILY CLASS I MILK UTILIZATION (Figure 28) 1997 through 2001
110
112
114
116
118
120
122
124
126
128
130
Jan Feb Mar Apr May Jun Jul Aug Sep Oct Nov Dec
Mill
ion
Poun
ds
Mill
ion
Poun
ds
REGIONAL COMPARISON (Figure 29)
SoutheastSouth Central
Southwest
Northeast
Northwest
North Central
31

AVERAGE MILK PRODUCTION BY REGION (Figure 30)
Average Milk Production by Region
10001050110011501200125013001350140014501500155016001650170017501800
Jan Feb Mar Apr May Jun Jul Aug Sep Oct Nov Dec
Month
Milk
Pro
duct
ion
per C
ow
North East North Central South West South Central North West South East
Milk
Pro
duct
ion
Per C
ow
SOUTHEAST U.S. AVERAGE PRODUCTION (Figure 31)
Southeast U.S. Average Production
900
950
1000
1050
1100
1150
1200
1250
1300
1350
1400
1450
1500
Jan Feb Mar Apr May Jun Jul Aug Sep Oct Nov DecMonth
Milk
Pro
duct
ion
Per C
ow
Florida Kenutucky Missouri
Milk
Pro
duct
ion
Per
Cow
32

BALANCING The seasonality of the production and demand of individual products do not match each other. Cheese and ice cream have some similarities with seasonal milk production. Fluid products’ seasonal demand is almost opposite seasonal milk production. There are large discrepancies between the amount of milk produced and the demand for milk during any given week of the year. Variability in production is by far the largest contributor to the need to balance supply and usage. A buffer system is required to deal with excess milk not needed for fluid consumption, cheese or ice cream when production exceeds the amount that can be sold in these markets. This buffer system is referred to as balancing. The amount of milk used must be balanced with the amount that is produced. As indicated earlier, fluid milk has the highest value. After this demand is met, excess milk goes into various manufacturing processes, the largest being cheese and non-fat dried milk. Balancing can occur at several levels. A multi-line plant can conceivably balance its own milk. This can be done by making products such as cheese when milk supplies are large, and putting them in storage, then taking them out of storage over the remaining part of the year, as needed, to meet demand. A single plant could have a drying system, but as mentioned earlier, making NFDM is a capital-intensive process not well suited for balancing small to moderate operations. Nationwide, most balancing occurs between plants. This is a market-driven process. Milk goes to the highest value uses first. What remains at any given time goes to the lowest value use, which is almost always NFDM. The large cooperatives, such as Dairy Farmers of America, buy all the milk. After shipping milk to bottling plants first, the cooperative then markets as much milk as possible to cheese plants and other dairy processing plants. The balance remaining that can’t be sold to processors is dried, often by a plant owned or joint-ventured with the cooperative. The prices of all the different uses of the milk are blended. The cooperative pays the average price to producers. It is extremely difficult to compete as a single-line bottling plant without buying from a cooperative (or other handler), which can handle the balancing. A producer (or a small group of producers) has to plan to balance their milk before they can consider getting into processing. Without a balancing plan, excess milk must be sold at Grade B Manufacturing grade prices. Class is used to designate the use of milk under the Federal Market Order. Grade is to designate quality and wholesomeness. Grade A is required for fluid uses of milk. Grade B is a lower grade, usually because the producer’s facility doesn’t meet some Grade A requirement. Grade B and Grade C represent the same grade of milk, which can be used only for manufacturing. Some states use the term Grade B while others use Grade C. The Federal Market Order does not control manufacturing grade prices. If manufacturing grade milk is used to make cheese, the cheese maker can set any price he chooses. The cheese maker can buy the entire Grade A milk he needs from a handler for the Class III price. It would be rare that any buyer would pay more than Class III for manufacturing grade for a significant period of time. Grade B would not be expected to sell above the Class III price of Grade A milk. Because there is normally plenty of Grade milk available, in practice, Grade B milk is priced below Class III, on a take-it-or-leave-it basis. Grade B producers have few options. The producer has no negotiating power. This low price will likely result in disastrous economic consequences for the producer/bottler. Bottling part of your milk and selling the remainder into the pool is not allowed. It is considered double-dipping to sell part of your milk into the fluid market and still get the pool price (which includes Class I) for your remainder. Therefore, a producer/handler has excess Grade A milk, but since it can’t be pooled, the only place to sell it is into the manufacturing grade market. Producer-handlers are viewed as competitors. The Grade B manufacturing price offered by the cooperative is not usually desirable. The producer has little choice. He can either take it or dump the milk.
33
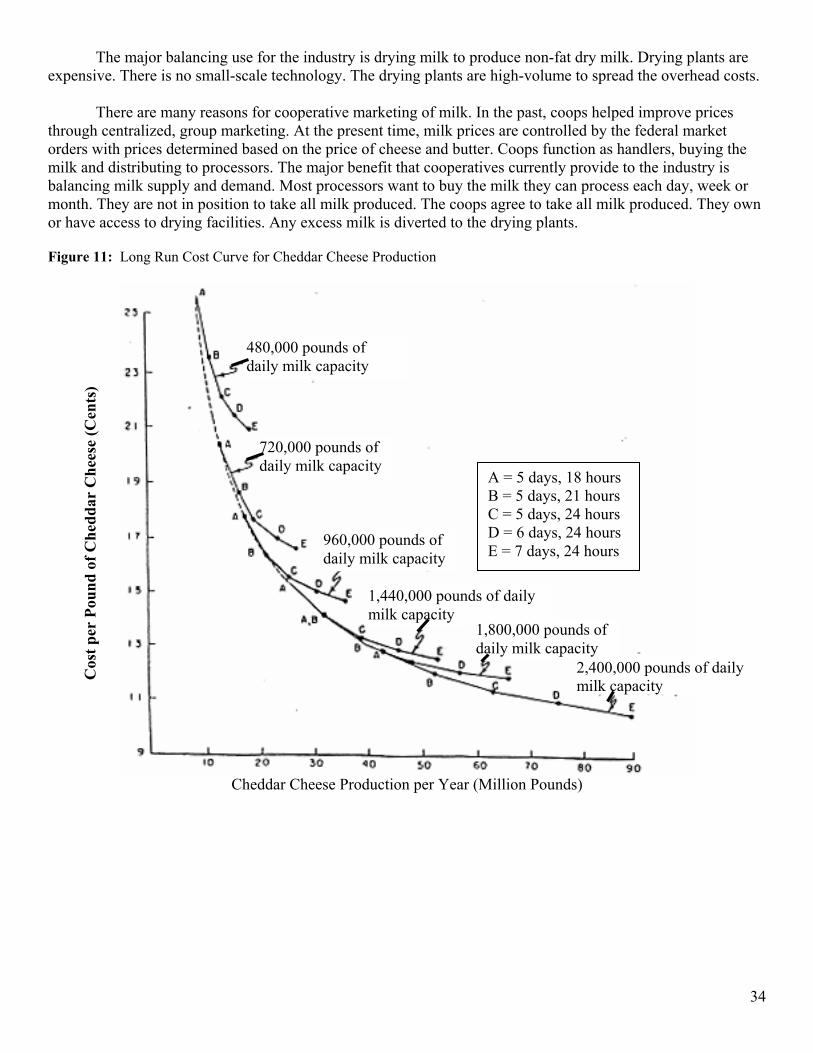
The major balancing use for the industry is drying milk to produce non-fat dry milk. Drying plants are expensive. There is no small-scale technology. The drying plants are high-volume to spread the overhead costs.
There are many reasons for cooperative marketing of milk. In the past, coops helped improve prices through centralized, group marketing. At the present time, milk prices are controlled by the federal market orders with prices determined based on the price of cheese and butter. Coops function as handlers, buying the milk and distributing to processors. The major benefit that cooperatives currently provide to the industry is balancing milk supply and demand. Most processors want to buy the milk they can process each day, week or month. They are not in position to take all milk produced. The coops agree to take all milk produced. They own or have access to drying facilities. Any excess milk is diverted to the drying plants. Figure 11: Long Run Cost Curve for Cheddar Cheese Production
2,400,000 pounds of daily milk capacity
1,440,000 pounds of daily milk capacity
1,800,000 pounds of daily milk capacity
960,000 pounds of daily milk capacity
720,000 pounds of daily milk capacity
480,000 pounds of daily milk capacity
A = 5 days, 18 hours B = 5 days, 21 hours C = 5 days, 24 hours D = 6 days, 24 hours E = 7 days, 24 hours
Cos
t per
Pou
nd o
f Che
ddar
Che
ese
(Cen
ts)
Cheddar Cheese Production per Year (Million Pounds)
34
FINANCIAL NUMBERS IN DAIRY PROCESSING General Financial projections for dairy processing are very difficult. As with any industry from agriculture to retailing, there is a wide range in the costs and profitability between individual firms within the industry. An accepted profitability level within the industry is a number equal to 1% of the value of the Assets. Of course, that number varies dramatically based on size and on market penetration in particular markets. It is important to understand the concepts and principals involved, as well as the relationships in dairy processing. Useful, accurate financial projections cannot be made until a number of decisions have been made. The industry ranges from extremely large, low-cost processors to small, specialty cheese makers—from capital-intensive, low-margin production to time and labor intensive, high margin products. The smaller specialty processors have generally developed a particular marketing niche through packaging, taste preference, or some other type of product differentiation that allows the processor to receive significantly larger gross margins than the large processors. Large processors work on the principle of large volume and tighter margins. The large volume decreases their fixed costs per unit of production and provides them their competitive advantage. Volume is so critical that large processors have moved away from developing their own label and are much more interested in packaging under other private labels for marketing firms that do not have processing facilities. In addition, the large processors involved in Fluid Milk Processing have begun to utilize their production lines for products other than milk. In order to lower their production costs per unit, they have become involved in the bottling of water, fruit juice concentrates and sports drinks. Of course the above describes the processors on each end of the spectrum, and in-between there is a large range of margins and costs. In addition, these ranges vary from product to product. In general, processors who market retail products have made strides to increase the number of lines of dairy products that they sell. This has been caused somewhat by the requirement by retailers that dairy processors offer a full line of products to their dairy case. The financial numbers presented are an attempt to represent small-to-moderate-sized plants. Because milk and product prices are constantly changing, the financial projections are based on gross margin—the difference between the cost of the milk and revenue for the products on a unit basis. For example, if a fluid processor (bottler) sells milk for $1.75 per gallon (wholesale) and buys it for $12.00 per cwt (1.39 per gallon); the gross margin is 36 cents per gallon. Wholesale and farm prices are not perfectly correlated. Retailers do not like to move retail milk prices up and down; therefore retail prices lag wholesale price moves. The farm price might move 50 cent to $1 per cwt during a month, while the wholesale and retail price may remain unchanged during that same month. But over time, prices will adjust so the correlation between the two is relatively high. By using gross margin, we have tried to eliminate the effects of price level from the profitability of dairy processing. Data from Cornell University studies of the cheese and fluid milk processing industries documents the tremendous economies of scale in dairy processing. Costs drop sharply as volume of processing increases (Figure 11). Consequently, there is wide range of costs. Smaller operations, as a rule, have much higher per unit costs. Therefore, smaller processors must find market opportunities that provide substantially larger gross margins. The increased margin must come from the ability to sell the product at a higher price level. The cost of raw milk will be approximately equal for any operation. To the extent milk prices vary, the larger operations will benefit from volume discounts or lower priced freight.
35

Fluid Milk Processing The fluid milk processing financial projections presented represent two different sized operations. The smaller operation is based on sales of 300,000 gallons per month and would require milk procurement from approximately 1700 cows. The range in gross margin used for this projection ranged from $.44 to $.90 per gallon. Therefore, total revenue for the month is determined by multiplying the monthly sales of 300,000 gallon times the gross margin. In addition, a projection of sales of total excess milk fat (1% of the raw milk purchased) is included in the monthly revenue. Expenses are based on per gallon cost for this size of facility. Costs such as enrichments, flavoring, supplies and packaging will not vary dramatically with the size of the operation. Costs such as labor, utilities and depreciation will vary on a per unit basis based on the amount of volume that moves through a plant. In addition, a cost of delivery has been added to expenses, which includes labor and depreciation on delivery equipment. Delivery and distribution costs are extremely variable depending on the market area that is served. Therefore, it is critical to evaluate a new operation and determine whether or not there would be economic benefits to contracting the distribution and delivery to another company rather than being a single line distributor. This is another advantage of processing multiple lines of products. It is also critical to evaluate the costs of equipment for a processing facility. The use of used equipment can significantly reduce depreciation costs and other fixed plant costs. It may reduce plant efficiency as some used equipment may require more maintenance and labor, but that must be evaluated against the total cost of the equipment. The cost of plastic bottles is a major factor in evaluating the size of the facility. If the facility is large enough to justify a bottle blower, the cost of the bottle will be decreased by as much as 50 percent versus buying the bottles already blown. The major cost is the difference in freight. The evaluation of the 300,000 gallon per month facility results in an indication that an expectation of an average gross margin near $.90 per gallon would be needed to result in a reasonable return on investment. A gross margin below $.80 per gallon would result in a significant loss. The larger processing facility that was evaluated was based on monthly sales of 1.2 million gallons, which would require milk procurement from approximately 6800 cows. Labor costs, supplies and packaging, utilities and other plant costs were reduced on a per unit basis because of the larger volume. The larger facility would require a much larger up-front investment, but it would also vary dramatically based on the amount of new and used equipment purchased. The net result of these projections indicates that the break-even gross margin for this operation would be $.50 per gallon. The following is a summary of information that was used to develop the financial numbers presented. It is provided as a guide for the development of financial projections.\ The financial projections presented assume fluid milk sales are made up of the following mixture:
Whole Milk 35% 2% Milk 32% 1% Milk 16% Skim 15% Half & Half 2%
36

Labor cost per gallon of milk varies from $.07 to $.17 per gallon in modern medium to large plants. The projection was based on $.12 per gallon in the larger facility and $.18 in the smaller facility. Labor costs per gallon are affected by two variables—the hourly wage rate and the efficiency of the plant. Plant efficiency has more effect on the cost per gallon than the hourly rate. Labor costs might be very low or zero for a small bottling plant run by family labor, which without the bottling operation would be under-employed. Supplies and packaging vary from $.07 to $.10 for container. Small operations will likely have even higher costs due to cost of shipping containers, as opposed to blowing the containers on site. Utilities usually vary from $.0175 to $.0425 per gallon. This number will vary depending on the plant and location. Plant costs are extremely difficult to estimate for a document of this type. Plant costs—building and equipment—for a small to moderate plant could range from $250,000 to $30 million dollars. Industry average plant costs vary widely due to different depreciation methods. In addition, the age of the plant and equipment have a big impact on overhead costs. The higher the overhead costs, the larger, more capital-intensive a plant becomes. The increasing overhead is offset by better labor efficiency. Lastly, a fluid plant must have a delivery system. This is a fairly costly part of the business, especially for the smaller processors. Large processors serve big accounts and make large deliveries to relatively few points and use efficient equipment to handle the milk containers. Smaller facilities will likely face delivery costs as high as $.30 per gallon compared to large plants which can have costs as low as $.04 per gallon. Cheese Processing Numbers The cheese processing numbers are presented based on a plant that sells 1.032 million pounds of cheese annually. This would require 10.320 million pounds of raw milk. This analysis starts with gross margin per pound of cheese produced. Approximately 10 pounds of milk is used per pound of cheese; therefore, the margin is the price of cheese less the cost of the raw milk. The cost of raw milk will be 10 percent of the cost of Class III milk. A $10 raw milk price results in a milk cost of $1 per pound of cheese produced. Once again, the financials are presented with a range of gross margins. The range presented is from $.30 to $.60 per pound of cheese sold. Overall evaluation indicates that a gross margin of at least $.33 per pound would be needed to break even. A gross margin of $.50 per pound would be needed to provide a reasonable return on investment. The following parameters were used in developing the costs in the presentation: The range of labor costs in a cheese processing facility will be $.035 to $.125 cents per pound. Some specialty cheeses or very small operations would have even higher costs. If a producer/handler was making cheese, they might be using under-employed family labor. This should be considered when estimating labor costs.
• Utility costs will likely range from $.01-$03 per pound. • Plant costs for medium to large plants are $.01 to $.05 per pound, but would be significantly higher
for a labor-intensive specialty product.
37

General Budget Principals for Milk Processing In starting a dairy processing business, the dairy must have a competitive advantage. Most producer-owned processing in Kansas would be expected to be moderate- to small-sized. Therefore, the competitive advantage is not likely to be the fact that it would be a low cost producer, since the larger operations would likely have lower costs due to significant economies of scale in the industry. The primary economic variables between processing companies are labor efficiency, overhead costs, delivery efficiency, and gross margin. The large operations generally have a competitive advantage in labor and delivery efficiency. Overhead costs could be an area in which smaller processors entering the market might be able to develop a cost advantage. The biggest potential for competitive advantage for small processors is in the gross margin. Small dairy processors’ best opportunity is to develop a differentiated, high quality product that commands a premium. While there are some small dairies selling fluid milk successfully, this market is probably limited. There is some concern that consumers will switch back to cheaper milk after the fad of “glass bottles” or “locally grown and processed” wears off. The best opportunity for smaller processors to develop a competitive advantage is most likely in a processed product such as ice cream or cheese. These products offer the best opportunities for differentiation, as well as being more competitive from a freight standpoint in most areas of Kansas. While higher valued specialty cheeses or ice cream appears to offer the best opportunity in dairy processing in Kansas, they also have the most marketing risk. Niche markets must be developed through a combination of a good product and an effective advertising and promotion program. It is an expensive proposition to develop a new product. Moreover, the development and promotion expenses will be incurred before any revenue can be realized. If the product never gains acceptance, these investments will be lost. Many of the input items are expected to have similar costs among all operations (large and small). There is some difference in packaging costs, but this area will not likely be the biggest factor in gaining or losing a competitive advantage between various processing operations. The primary point is that size of the operation has little impact on the cost of raw milk. The cost of raw milk used by processors for the same end use will have virtually the same price, no matter what the size of the operation.
38

FLUID MILK PROCESSING
Projected Income from Operations Monthly
Based on Annual Sales of 3.6 million gallons (Approximately 1,700 cows)
Income Statement
Gross Margin per Gallon $ 0.44 $ 0.54 $ 0.75 $ 0.90 Revenue $ 132,000.00 $ 162,000.00 $ 162,000.00 $ 162,000.00 Excess Milk $ 27,606.00 $ 27,606.00 $ 27,606.00 $ 27,606.00
Total Revenue $ 159,606.00 $ 189,606.00 $ 189,606.00 $ 189,606.00 Expenses $ /gal
Labor $ 0.18 $ 54,000.00 $ 54,000.00 $ 54,000.00 $ 54,000.00 Enrichment $ 0.02 $ 6,000.00 $ 6,000.00 $ 6,000.00 $ 6,000.00 Flavoring $ 0.01 $ 3,000.00 $ 3,000.00 $ 3,000.00 $ 3,000.00 Supplies & Packaging $ 0.20 $ 60,000.00 $ 60,000.00 $ 60,000.00 $ 60,000.00 Utilities $ 0.04 $ 12,000.00 $ 12,000.00 $ 12,000.00 $ 12,000.00 Other Plant Costs $ 0.16 $ 48,000.00 $ 48,000.00 $ 48,000.00 $ 48,000.00 Depreciation $ 0.08 $ 24,000.00 $ 24,000.00 $ 24,000.00 $ 24,000.00 Delivery
Labor $ 0.14 $ 42,000.00 $ 42,000.00 $ 42,000.00 $ 42,000.00 Equipment (Depreciation) $ 0.10 $ 30,000.00 $ 30,000.00 $ 30,000.00 $ 30,000.00
Total Expenses $ 279,000.00 $ 279,000.00 $ 279,000.00 $ 279,000.00 Net Income $ (119,394.00) $ (89,394.00) $ (26,394.00) $ 18,606.00 Bottled Milk Gallons
Whole 35% 105,000 105,000 105,000 105,000 2% 32% 96,000 96,000 96,000 96,000 1% 16% Skim 15% 45,000 45,000 45,000 45,000 Half & Half 2% 6,000 6,000 6,000 6,000 Pounds Excess Milk Fat 0.01 25,800 25,800 25,800 25,800
Operating Parameters Gallons per Month 300,000 300,000 300,000 300,000
Margin Calculation Per Cwt Per Gallon Purchased Milk Price $ 12.00 $ 1.40 Sale Price of Milk $ 15.82 $ 1.84 Gross Margin $ 3.82 $ 0.44
39

FLUID MILK PROCESSING
Projected Income from Operations Monthly
Based on Annual Sales of 14.4 million gallons (Approximately 6,800 cows)
Income Statement
Gross Margin per Gallon $ 0.35 $ 0.44 $ 0.52 $ 0.60 Revenue $ 420,000.00 $ 528,000.00 $ 624,000.00 $ 720,000.00 Excess Milk $ 110,424.00 $ 110,424.00 $ 110,424.00 $ 110,424.00
Total Revenue $ 530,424.00 $ 638,424.00 $ 734,424.00 $ 830,424.00 Expenses $ /gal
Labor $ 0.12 $ 144,000.00 $ 144,000.00 $ 144,000.00 $ 144,000.00 Enrichment $ 0.02 $ 24,000.00 $ 24,000.00 $ 24,000.00 $ 24,000.00 Flavoring $ 0.01 $ 12,000.00 $ 12,000.00 $ 12,000.00 $ 12,000.00 Supplies & Packaging $ 0.10 $ 120,000.00 $ 120,000.00 $ 120,000.00 $ 120,000.00 Utilities $ 0.03 $ 36,000.00 $ 36,000.00 $ 36,000.00 $ 36,000.00 Other Plant Costs $ 0.12 $ 144,000.00 $ 144,000.00 $ 144,000.00 $ 144,000.00 Depreciation $ 0.08 $ 96,000.00 $ 96,000.00 $ 96,000.00 $ 96,000.00 Delivery
Labor $ 0.07 $ 84,000.00 $ 84,000.00 $ 84,000.00 $ 84,000.00 Equipment (Depreciation) $ 0.05 $ 60,000.00 $ 60,000.00 $ 60,000.00 $ 60,000.00
Total Expenses $ 720,000.00 $ 720,000.00 $ 720,000.00 $ 720,000.00 Net Income $ (189,576.00) $ (81,576.00) $ 14,424.00 $ 110,424.00 Bottled Milk Gallons
Whole 35% 420,000 420,000 420,000 420,000 2% 32% 384,000 384,000 384,000 384,000 1% 16% Skim 15% 180,000 180,000 180,000 180,000 Half & Half 2% 24,000 24,000 24,000 24,000 Pounds Excess Milk Fat 0.01 103,200 103,200 103,200 103,200
Operating Parameters Gallons per Month 1,200,000 1,200,000 1,200,000 1,200,000
Margin Calculation Per Cwt Per Gallon Purchased Milk Price $ 12.00 $ 1.40 Sale Price of Milk $ 15.82 $ 1.84 Gross Margin $ 3.82 $ 0.44
40
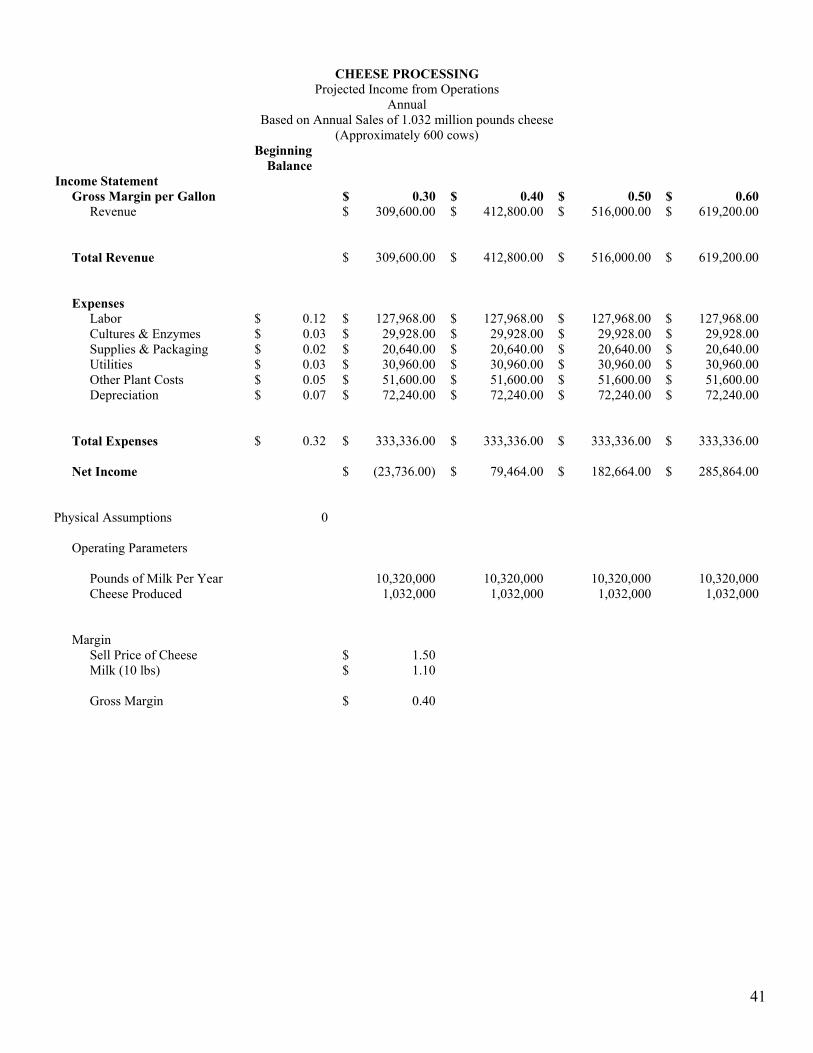
CHEESE PROCESSING
Projected Income from Operations Annual
Based on Annual Sales of 1.032 million pounds cheese (Approximately 600 cows)
Beginning Balance
Income Statement Gross Margin per Gallon $ 0.30 $ 0.40 $ 0.50 $ 0.60
Revenue $ 309,600.00 $ 412,800.00 $ 516,000.00 $ 619,200.00 Total Revenue $ 309,600.00 $ 412,800.00 $ 516,000.00 $ 619,200.00 Expenses
Labor $ 0.12 $ 127,968.00 $ 127,968.00 $ 127,968.00 $ 127,968.00 Cultures & Enzymes $ 0.03 $ 29,928.00 $ 29,928.00 $ 29,928.00 $ 29,928.00 Supplies & Packaging $ 0.02 $ 20,640.00 $ 20,640.00 $ 20,640.00 $ 20,640.00 Utilities $ 0.03 $ 30,960.00 $ 30,960.00 $ 30,960.00 $ 30,960.00 Other Plant Costs $ 0.05 $ 51,600.00 $ 51,600.00 $ 51,600.00 $ 51,600.00 Depreciation $ 0.07 $ 72,240.00 $ 72,240.00 $ 72,240.00 $ 72,240.00
Total Expenses $ 0.32 $ 333,336.00 $ 333,336.00 $ 333,336.00 $ 333,336.00 Net Income $ (23,736.00) $ 79,464.00 $ 182,664.00 $ 285,864.00
Physical Assumptions 0
Operating Parameters
Pounds of Milk Per Year 10,320,000 10,320,000 10,320,000 10,320,000 Cheese Produced 1,032,000 1,032,000 1,032,000 1,032,000
Margin Sell Price of Cheese $ 1.50 Milk (10 lbs) $ 1.10 Gross Margin $ 0.40
41
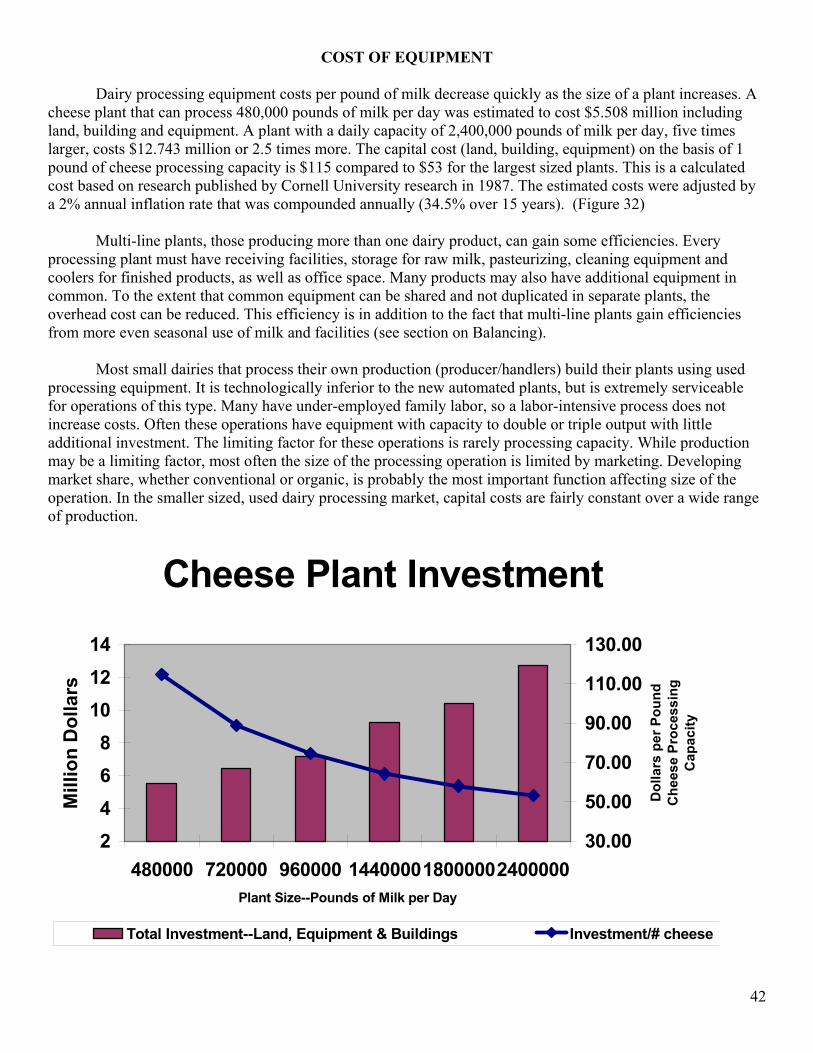
COST OF EQUIPMENT Dairy processing equipment costs per pound of milk decrease quickly as the size of a plant increases. A cheese plant that can process 480,000 pounds of milk per day was estimated to cost $5.508 million including land, building and equipment. A plant with a daily capacity of 2,400,000 pounds of milk per day, five times larger, costs $12.743 million or 2.5 times more. The capital cost (land, building, equipment) on the basis of 1 pound of cheese processing capacity is $115 compared to $53 for the largest sized plants. This is a calculated cost based on research published by Cornell University research in 1987. The estimated costs were adjusted by a 2% annual inflation rate that was compounded annually (34.5% over 15 years). (Figure 32) Multi-line plants, those producing more than one dairy product, can gain some efficiencies. Every processing plant must have receiving facilities, storage for raw milk, pasteurizing, cleaning equipment and coolers for finished products, as well as office space. Many products may also have additional equipment in common. To the extent that common equipment can be shared and not duplicated in separate plants, the overhead cost can be reduced. This efficiency is in addition to the fact that multi-line plants gain efficiencies from more even seasonal use of milk and facilities (see section on Balancing). Most small dairies that process their own production (producer/handlers) build their plants using used processing equipment. It is technologically inferior to the new automated plants, but is extremely serviceable for operations of this type. Many have under-employed family labor, so a labor-intensive process does not increase costs. Often these operations have equipment with capacity to double or triple output with little additional investment. The limiting factor for these operations is rarely processing capacity. While production may be a limiting factor, most often the size of the processing operation is limited by marketing. Developing market share, whether conventional or organic, is probably the most important function affecting size of the operation. In the smaller sized, used dairy processing market, capital costs are fairly constant over a wide range of production.
Cheese Plant Investment
2468
101214
480000 720000 960000 144000018000002400000Plant Size--Pounds of Milk per Day
Mill
ion
Dol
lars
30.00
50.00
70.00
90.00
110.00
130.00D
olla
rs p
er P
ound
C
hees
e Pr
oces
sing
C
apac
ity
Total Investment--Land, Equipment & Buildings Investment/# cheese
42
PRIVATE LABEL VERSUS PROPRIETARY LABEL In the final evaluation of the business marketing strategy, a new entity involved in dairy processing will need to evaluate whether they will concentrate primarily on private label work for other entities or develop their own label. Of course, developing a new company label and doing private label work is a reasonable marketing strategy. The development of a new label can require significant capital depending on the following items:
1) The size of the distribution area and the size of the spectrum of distribution. 2) The advertising campaign that is planned to introduce consumers to the new label and to maintain the
consumer awareness. 3) The number of items that will be marketed under the new label.
Advantage of Developing a New Label
1) Margins will be larger because the entity will have the ability to capture increased values for the product lines.
2) Create a company identity, which allows the company to control its own destiny (success or failure) compared to private label contract work that can disappear because of another company’s ability to market.
3) Much easier to add other product lines in the future under a label owned and established by the entity. Disadvantages of Developing a New Label
1) The cost to develop a new label or purchase an existing label can be very high. 2) Developing a new label can take a large amount of time, and that can result in a very low plant
utilization percentage in the early stages of the label development. Advantages of Private Label Processing
1) Reduces the costs of entry into the market place. 2) Can increase plant utilization in the early stages of the new company, as the private label will likely
require a substantial amount of production. Disadvantages of Private Label Processing
1) Reduced margins per unit, as private label work will be done on a contracted per-unit basis. 2) Inability to create an identity in the marketplace.
Generally, large dairy processing facilities will find it advantageous to do a large amount of private label work, as it is imperative that the facility utilize a large percentage of the plant capacity. Smaller processing facilities will generally work to develop their own label and capture larger margins per unit. There are certainly exceptions to this statement, but it is a trend in the entire food industry.
43

Legal Structure The traditional legal business structures are all reasonable structures to use in developing a dairy processing business. Those considered workable are: Limited Liability Company (LLC): This structure would be very useful for a small processing company that would not need a large number of owners. It provides the corporate protection and can be organized rather easily. Typically, this structure results in a “pass through” of tax liability to the individual owners based upon their percentage ownership in the LLC. The LLC will have no tax liability, as it will all be passed to the individual owners. Corporation: If there is a need to put a large amount of capital in the processing facility or there is a need for a large number of owners, then the traditional C Corporation is the desirable structure. This structure would allow for a large number of owners and a more liquid market for the “trading” of stock. The formation of the C Corporation will be more expensive than an LLC or an S Corporation. C Corporations do pay corporate income taxes, and then individual stockholders would pay taxes on any dividends distributed. Cooperative: If a group of producers decide to be the owners of a dairy processing facility, they would likely find that a Cooperative structure could be beneficial. The limitations are that the Cooperative would have to purchase over 50% of their milk from members, which could be a limitation. Any milk purchased from a non-member would be considered non-member business, which would mean that a portion of the net income (portion equal to the portion purchased from non-members) would be taxable to the Corporation. The tax structure would be an advantage in that the Cooperative would not pay taxes, but the tax liability would be “passed through” to the individual members of the Cooperative. There is no distinct advantage to any of the legal structures listed above for dairy processing. The most desirable structure for a new dairy processing entity would most likely be evaluated based upon the amount of capital needed, the number of owners desired, the need for liquidity in the stock, and whether or not obtaining a captive supply of milk is important to the business strategy of the entity. If the new entity is interested in processing milk and also marketing milk, there is an advantage in forming a cooperative that is owned by member producers. In addition to the fact that a captive supply of milk would be obtained through the cooperative arrangement, the entity would also find it much easier to receive the milk “pooling” funds that are generated through the sale of Class II, III, and IV milk (see Federal Milk Orders). Example: If three milk producers decided to form an entity to process milk into cheese, the entity formed would have the ability to receive “pooling” funds, but the individual producers cannot receive those pooling funds. Of course, the entity would take the pooling funds and use those funds to offset the cost of milk, which is indirectly a benefit to the producer/owners of the processing entity.
44
Dairy Processing Reference Section Contacts
Henry Schaffer Karen Schmidt Milk Marketing Order – FO 30 Associate Professor USDA – AMS Dairy Programs Kansas State University 4570 W. 77th Street, Suite 210 224 Call Hall Minneapolis, MN 55435-5037 Manhattan, KS Phone: (952) 831-5292 Ext 208 Phone: (785) 532-1216 Chris Hackman Dr. P. D. Courtney Central Dairy Company Food Science and Technology Department 610 Madison Ohio State University Jefferson City, MO 65101 2121 Fyffe Road Phone: (573) 635-6148 Columbus, OH 43210 Phone: (614) 292-9621 E-mail: [email protected] Gary G. Frank UW-Center for Dairy Profitability Ed Reznicek Kansas Organic Producers Rt. 2, Box 23 Goff, KS 66428
45

Organizations and Publications International Dairy Foods Association 1250 H Street, NW, Suite 900 Washington, DC 20005 Main Telephone: (202) 737-4332 Fax: (202) 331-7820 (all staff) Website: http://www.idfa.org USDA Guidelines for the Sanitary Design and Fabrication of Dairy Processing Equipment USDA-Dairy Accepted Equipment List
U.S. Department of Agriculture Agricultural Marketing Service Dairy Programs Dairy Grading Branch P.O. Box 96456 Washington, DC 20090-6456 Introduction to Cheese making Web Page: http://www.geocities.com/Heartland/Cottage/1288/intro/Intro.htm
Seasonal Dairy Grazing: A Viable Alternative for the 21st Century Jonathan R. Winsten & Bryan T. Petrucci American Farmland Trust National Office 1200 18th Street, N.W. Washington, DC 20036 Phone: (202) 331-7300 Web Page: http://www.farmland.org
Agricultural Marketing Service USDA Web Page: http://www.ams.usda.gov/nop/facts/standards.htm Final rule for the National Organic Standard
An Analysis of Processing and Distribution Productivity and Cost of 35 Fluid Milk Plants
Eric M. Erba, Richard D. Aplin & Mark W. Stephenson Cornell Program on Dairy Markets and Policy Department of Agricultural, Resource and Managerial Economics College of Agriculture and Life Sciences Cornell University Ithaca, NY 14853-7801
46

Economic Performance of 11 Cheddar Cheese Manufacturing Plants in Northeast and North Central Regions – Part One of a Research Effort on Cheddar Cheese Manufacturing Cheddar Cheese Manufacturing Costs Economies of Size and Effects of Different Current Technologies Part Two of a Research Effort on Cheddar Cheese Manufacturing
Department of Agricultural Economics Cornell University Agricultural Experiment Station New York State College of Agriculture and Life Sciences Cornell University Ithaca, NY 14853
Questions You Should Answer Before Starting a New Dairy Processing Enterprise
Brian M. Henehan Senior Extension Associate Department of Agricultural, Resource and Managerial Economics (ARME) Cornell University Ithaca, NY 14853
Central Milk Marketing Order – FO 32
Donald R. Nicholson USDA – AMS Dairy Programs Street address: P.O. Box 14650 10801 Renner Boulevard Shawnee Mission, KS 66285-4650 Lenexa, KS 66219 Phone: (913) 495-9300 Web Page: http://www.fmmacentral.com Bob Vanderliden Ext 9313 Bob Schoening Ext 9319 David Stukenberg Ext 9326 Bruce Adams Ext 9314
Milk Facts – 2001 edition Cheese Facts – 2001 edition The Latest Scoop – 2001 edition
International Dairy Foods Association 1250 H Street, N.W., Suite 900 Washington, DC 20005 Phone: (202) 737-4332 Web Page: http://www.idfa.org Web Page: http://www.egr.msu.edu/~steffe/handbook/tbl21.html
Illustrations from this site were used in discussions of cheese, ice cream and NFDM. Most of the illustrations were taken from:
Dairy Processing Handbook Tetra Pak Processing Systems AB S-221 86 Lund Sweden
47
Processing Equipment and Other Suppliers
Hartter Feed & Seed 903 Oregon Sabetha, KS Phone: (785) 284-2220 Certified organic feed processing International Machinery Xchange 214 N Main Street Deerfield, WI 53531-9644 Phone: (608) 764-5481 Garrity Equipment Company 31 Georgia Trail Medford, N.J. 08055-8938 Phone: (609) 953-0007 Rowland Sales Company P.O. Box 552 Hazelton, PA 18201-0552 Phone: (570) 455-5813 CHR Hansen 9015 W Maple Street Milwaukee, WI 53214 Phone: (414) 607-5700 Cheese culture, rennet, all types of dairy supplies
48
REFERENCE FOR ORGANIC MARKETING SURVEY Boland, M.A. and J.A. Fox. “Consumer Willingness-to-Pay for Natural Beef.” Unpublished manuscript, Kansas State University, 2001. Cameron, T. and J. Quiggin. “Estimation Using Contingent Valuation Data From a ‘Dichotomous Choice with Follow-up’ Questionnaire.” Journal of Environmental Economics and Management 24(1994): 218-234. Carson, R. “Three Essays on Contingent Valuation.” Unpublished Ph.D. dissertation, University of California, Berkeley, CA, 1985. Givry, S. “Consumers Preferences for Natural Beef Products.” Unpublished M.S. thesis, Kansas State University, Manhattan, KS, 1998. Glaser, L.K. and G.D. Thompson. “Demand for Organic and Conventional Beverage Milk.” Selected paper presented at Western Agricultural Economics Association annual meeting, Vancouver, Canada, June 29-July 1, 2000. Hanneman, W. “Some Issues in Continuous- and Discrete Response Contingent Valuation Studies.” North East Journal of Agricultural Economics 14(1985): 5-13. Hanneman, W. and W. Kanninen. “The Statistical Analysis of Discrete-Response CV Data.” Working Paper No. 798, Department of Agricultural and Resource Economics, University of California, Berkeley, 1996. Hanneman, W., J. Loomis, and B. Kanninen, B. “Statistical Efficiency of Double-Bounded Dichotomous Choice Contingent Valuation.” American Journal of Agricultural Economics 73(1991): 1255-1263. Herriges, J. “Measuring Goodness of Fit for the Double-Bounded Logit Model: Comment.” American Journal of Agricultural Economics 81(1999): 231-234. Herriges, J. and J. Shogren. “Starting Point Bias in Dichotomous Choice Valuation with Follow-up Questioning.” Journal of Environmental Economics and Management 30(1996): 112-131.
49
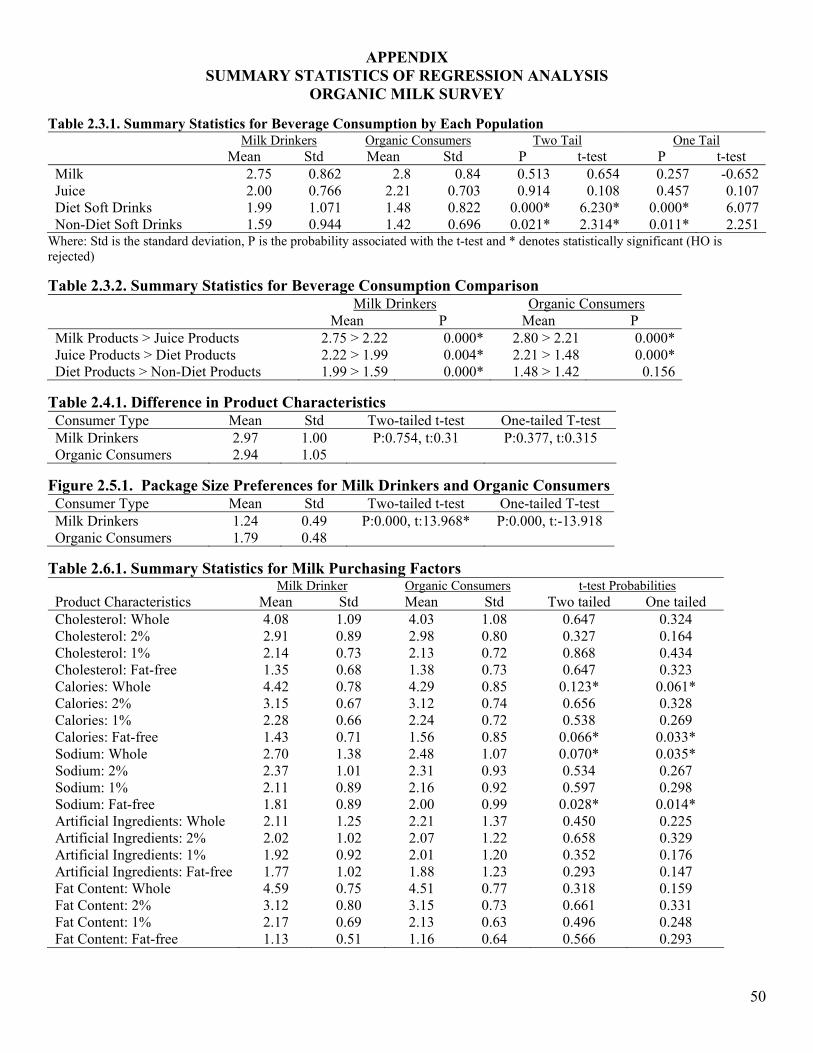
APPENDIX SUMMARY STATISTICS OF REGRESSION ANALYSIS
ORGANIC MILK SURVEY Table 2.3.1. Summary Statistics for Beverage Consumption by Each Population
Milk Drinkers Organic Consumers Two Tail One Tail Mean Std Mean Std P t-test P t-test
Milk 2.75 0.862 2.8 0.84 0.513 0.654 0.257 -0.652Juice 2.00 0.766 2.21 0.703 0.914 0.108 0.457 0.107Diet Soft Drinks 1.99 1.071 1.48 0.822 0.000* 6.230* 0.000* 6.077Non-Diet Soft Drinks 1.59 0.944 1.42 0.696 0.021* 2.314* 0.011* 2.251
Where: Std is the standard deviation, P is the probability associated with the t-test and * denotes statistically significant (HO is rejected) Table 2.3.2. Summary Statistics for Beverage Consumption Comparison Milk Drinkers Organic Consumers
Mean P Mean P Milk Products > Juice Products 2.75 > 2.22 0.000* 2.80 > 2.21 0.000*Juice Products > Diet Products 2.22 > 1.99 0.004* 2.21 > 1.48 0.000*Diet Products > Non-Diet Products 1.99 > 1.59 0.000* 1.48 > 1.42 0.156
Table 2.4.1. Difference in Product Characteristics Consumer Type Mean Std Two-tailed t-test One-tailed T-test Milk Drinkers 2.97 1.00 P:0.754, t:0.31 P:0.377, t:0.315 Organic Consumers 2.94 1.05
Figure 2.5.1. Package Size Preferences for Milk Drinkers and Organic Consumers Consumer Type Mean Std Two-tailed t-test One-tailed T-test
1.24 0.49 P:0.000, t:13.968* P:0.000, t:-13.918 Organic Consumers 1.79 0.48 Milk Drinkers
Table 2.6.1. Summary Statistics for Milk Purchasing Factors
Milk Drinker Organic Consumers t-test Probabilities Product Characteristics Mean Std Mean Std Two tailed One tailed Cholesterol: Whole 4.08 1.09 4.03 1.08 0.647 0.324 Cholesterol: 2% 2.91 0.89 2.98 0.80 0.327 0.164 Cholesterol: 1% 2.14 0.73 2.13 0.72 0.868 0.434 Cholesterol: Fat-free 1.35 0.68 1.38 0.73 0.647 0.323 Calories: Whole 4.42 0.78 4.29 0.85 0.123* 0.061* Calories: 2% 3.15 0.67 3.12 0.74 0.656 0.328 Calories: 1% 2.28 0.66 2.24 0.72 0.538 0.269 Calories: Fat-free 1.43 0.71 1.56 0.85 0.066* 0.033* Sodium: Whole 2.70 1.38 2.48 1.07 0.070* 0.035* Sodium: 2% 2.37 1.01 2.31 0.93 0.534 0.267 Sodium: 1% 2.11 0.89 2.16 0.92 0.597 0.298 Sodium: Fat-free 1.81 0.89 2.00 0.99 0.028* 0.014* Artificial Ingredients: Whole 2.11 1.25 2.21 1.37 0.450 0.225 Artificial Ingredients: 2% 2.02 1.02 2.07 1.22 0.658 0.329 Artificial Ingredients: 1% 1.92 0.92 2.01 1.20 0.352 0.176 Artificial Ingredients: Fat-free 1.77 1.02 1.88 1.23 0.293 0.147 Fat Content: Whole 4.59 0.75 4.51 0.77 0.318 0.159 Fat Content: 2% 3.12 0.80 3.15 0.73 0.661 0.331 Fat Content: 1% 2.17 0.69 2.13 0.63 0.496 0.248 Fat Content: Fat-free 1.13 0.51 1.16 0.64 0.566 0.293
50
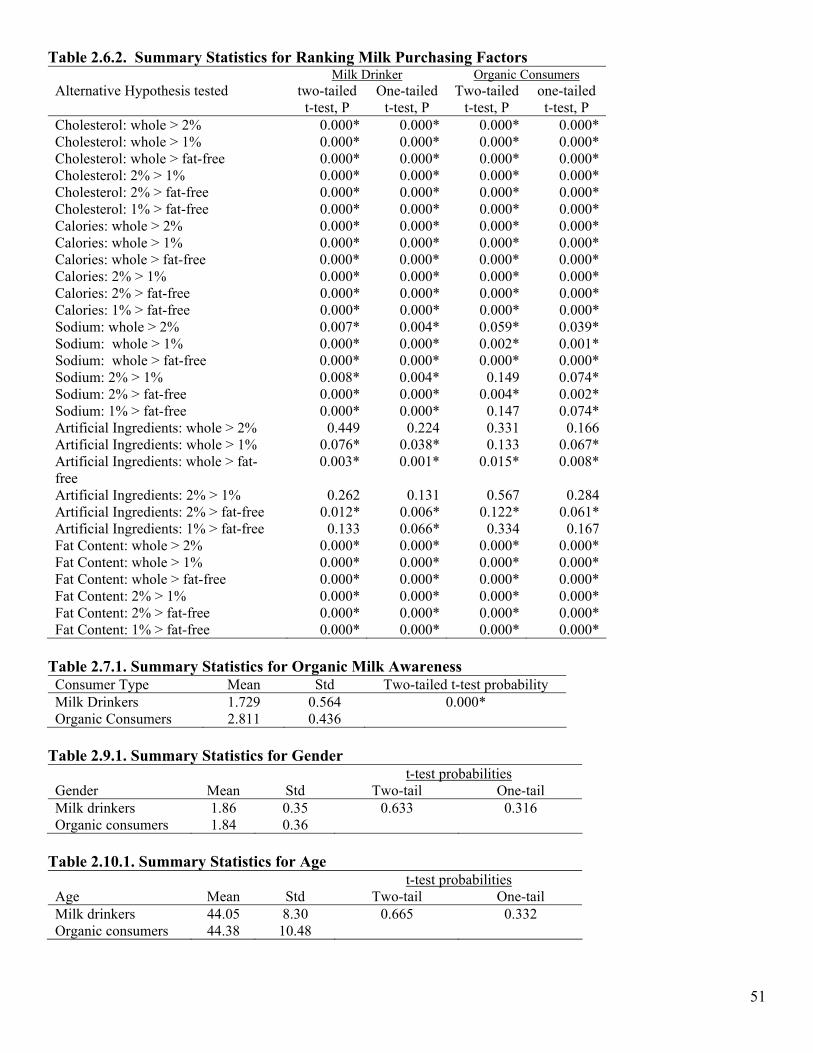
Table 2.6.2. Summary Statistics for Ranking Milk Purchasing Factors Milk Drinker Organic Consumers
Alternative Hypothesis tested two-tailed t-test, P
One-tailed t-test, P
Two-tailed t-test, P
one-tailed t-test, P
Cholesterol: whole > 2% 0.000* 0.000* 0.000* 0.000* Cholesterol: whole > 1% 0.000* 0.000* 0.000* 0.000* Cholesterol: whole > fat-free 0.000* 0.000* 0.000* 0.000* Cholesterol: 2% > 1% 0.000* 0.000* 0.000* 0.000* Cholesterol: 2% > fat-free 0.000* 0.000* 0.000* 0.000* Cholesterol: 1% > fat-free 0.000* 0.000* 0.000* 0.000* Calories: whole > 2% 0.000* 0.000* 0.000* 0.000* Calories: whole > 1% 0.000* 0.000* 0.000* 0.000* Calories: whole > fat-free 0.000* 0.000* 0.000* 0.000* Calories: 2% > 1% 0.000* 0.000* 0.000* 0.000* Calories: 2% > fat-free 0.000* 0.000* 0.000* 0.000* Calories: 1% > fat-free 0.000* 0.000* 0.000* 0.000* Sodium: whole > 2% 0.007* 0.004* 0.059* 0.039* Sodium: whole > 1% 0.000* 0.000* 0.002* 0.001* Sodium: whole > fat-free 0.000* 0.000* 0.000* 0.000* Sodium: 2% > 1% 0.008* 0.004* 0.149 0.074* Sodium: 2% > fat-free 0.000* 0.000* 0.004* 0.002* Sodium: 1% > fat-free 0.000* 0.000* 0.147 0.074* Artificial Ingredients: whole > 2% 0.449 0.224 0.331 0.166 Artificial Ingredients: whole > 1% 0.076* 0.038* 0.133 0.067* Artificial Ingredients: whole > fat-free
0.003* 0.001* 0.015* 0.008*
Artificial Ingredients: 2% > 1% 0.262 0.131 0.567 0.284 Artificial Ingredients: 2% > fat-free 0.012* 0.006* 0.122* 0.061* Artificial Ingredients: 1% > fat-free 0.133 0.066* 0.334 0.167 Fat Content: whole > 2% 0.000* 0.000* 0.000* 0.000* Fat Content: whole > 1% 0.000* 0.000* 0.000* 0.000* Fat Content: whole > fat-free 0.000* 0.000* 0.000* 0.000* Fat Content: 2% > 1% 0.000* 0.000* 0.000* 0.000* Fat Content: 2% > fat-free 0.000* 0.000* 0.000* 0.000* Fat Content: 1% > fat-free 0.000* 0.000* 0.000* 0.000*
Table 2.7.1. Summary Statistics for Organic Milk Awareness Consumer Type Mean Std Two-tailed t-test probability Milk Drinkers 1.729 0.564 0.000* Organic Consumers 2.811 0.436
Table 2.9.1. Summary Statistics for Gender t-test probabilities Gender Mean Std Two-tail One-tail Milk drinkers 1.86 0.35 0.633 0.316 Organic consumers 1.84 0.36
Table 2.10.1. Summary Statistics for Age t-test probabilities Age Mean Std Two-tail One-tail Milk drinkers 44.05 8.30 0.665 0.332 Organic consumers 44.38 10.48
51

52
Table 2.11.1. Summary Statistics for Education t-test Probabilities Education Mean Std Two-tail One-tail Milk drinkers 4.46 1.73 0.721 0.361 Organic consumers 4.51 1.83
Table 2.12.1. Summary Statistics for Income t-test probabilities Income Mean Std Two-tail One-tail Milk drinkers 10.35 2.68 0.000* 0.000* Organic consumers 8.95 3.09
Table 2.13.1. Summary Statistics for Number of Children t-test probabilities Children Mean Std Two-tail One-tail Milk drinkers 1.89 0.41 0.000* 0.000* Organic consumers 1.64 0.48
SUMMARY STATISTICS OF WILLINGNESS TO PAY MODEL
Table 3.1.1. Prices Offered to Consumers in Willingness-to-Pay Question
Version First Outcome (B) Second Outcome
(if they chose $2.00 as first outcome), Bd
Second Outcome (if they chose the higher price
as the first outcome), Bu I $2.00 or $2.50a $2.00 or $2.20 $2.00 or $3.00
II $2.00 or $3.00 $2.00 or $2.50 $2.00 or $3.60
III $2.00 or $3.60 $2.00 or $3.00 $2.00 or $4.50
IV $2.00 or $4.50 $2.00 or $3.60 $2.00 or $5.50 aFor example in version 1, if the consumer chose $4.00 (“No”) as the first outcome, then their
second outcome would be either $4.00 (“No”) or $4.20 (“Yes”).
Table 3.4.1. Marginal Effects Evaluated at The Mean and Selected Statistics for the Single Bound Logit Model with Whether a Milk Drinker would Purchase Organic Milk Variable Milk Drinkers Organic Consumers Intercept 2.006 4.065 Price -1.96* (.03) -33.631* (.004) Pseudo R2 0.67 0.14
*denotes significance at the .10 level for the parameter estimate used to calculate the marginal effects. Table 3.4.2. Parameter Estimates and Selected Statistics for the Double-Bounded Models Variable Milk Drinkers Organic Consumers Intercept 3.34 (0.34) 5.99 (0.72) Bid expressed in eB 1.18* (0.1) 0.99* (0.17) Pseudo R2, a 0.13 0.09
aThe pseudo R2 for the double-bounded is Herriges’ modification of McFadden’s pseudo R2. *denotes significance at the .10 level for the parameter estimate.


