Page 1
Linköping University Post Print
Value-added strategies and forward integration
in the Swedish sawmill industry: positioning
and profitability in the high-volume segment
Staffan Brege, Tomas Nord, Roland Sjöström and Lars Stehn
N.B.: When citing this work, cite the original article.
This is an electronic version of an article published in:
Staffan Brege, Tomas Nord, Roland Sjöström and Lars Stehn, Value-added strategies and
forward integration in the Swedish sawmill industry: positioning and profitability in the high-
volume segment, 2010, SCANDINAVIAN JOURNAL OF FOREST RESEARCH, (25), 5,
482-493.
SCANDINAVIAN JOURNAL OF FOREST RESEARCH is available online at
informaworldTM
:
http://dx.doi.org/10.1080/02827581.2010.496738
Copyright: Taylor & Francis
http://www.tandf.co.uk/journals/default.asp
Postprint available at: Linköping University Electronic Press
http://urn.kb.se/resolve?urn=urn:nbn:se:liu:diva-60882
Page 2
1
Value Added Strategies and Forward Integration in the Swedish Sawmill
Industry – Positioning and Profitability in the High Volume Segment
STAFFAN BREGE, TOMAS NORD, ROLAND SJÖSTRÖM and LARS STEHN
The changing market conditions for the Swedish sawmill industry place a focus on a better
understanding of the pros and cons of value added and forward integration strategies. The
purpose of this article is to describe and explain recent value added strategies in the Swedish
sawmill industry. The study includes strategies from 13 of the 15 largest sawmill companies
for the period between 2002 and 2005, describing the differentiation between value added in
primary sawmill production and forward integration into secondary production. It also aims to
relate some basic conditions, such as company size, company growth and corporate strategy,
to value added and forward integration to profitability. The results show strong positive and
significant correlations between forward integration, value added in primary production
(somewhat weaker) and unit revenue, and profitability measured as return on investment.
There were no strong or significant correlations between size and profitability, playing down
the importance of economies of scale (among these already large companies). An interesting
result is the much higher profitability of the buying sawmill companies compared to the forest
corporations, stressing the importance of both a long-term strategy when investing in value
added activities and ultimately the priorities of ownership.
Key words: forward integration, ownership, profitability, sawmill industry, value added
strategy.
Page 3
2
INTRODUCTION
There is still much to understand about strategic management in the sawmill industry. For the
past 30 years, the relationship between value added strategies and profitability has been at the
top of the strategic agenda of the Swedish sawmill industry. Value added strategies include
additional production processes in primary sawn timber production as well as the integration
and control of downstream operations to broaden product portfolio, both aimed at higher
profit margins. Sawmill companies that initially adopted corporate strategies with a larger
share of value-added products were so-called “buying sawmills”, i.e. mostly smaller and
privately owned sawmill companies without their own forest resources. The other two main
categories of sawmills – the forest owner association sawmills and the large forest
conglomerate owned sawmills – were slower to develop from selling commodities (bulk) to
increased value adding activities. With a broader strategic agenda at the corporate level, the
ownership situation of larger sawmills created dilemmas, where value added strategies in the
sawmill business were not a top priority, or not even the sawmill business as such (Roos et al.,
2001). It was not until the financial crisis at the beginning of the 1990s when the entire
sawmill industry in Sweden concluded that traditional bulk strategies were caught in a
commodity trap (Brege & Överberg, 2000). In other important countries such as the USA,
Canada and Finland, a similar trend occurred (Bush & Sinclair, 1991; Niemelä & Smith,
1996; Lee et al., 1999).
From the 1990s onwards, all large Swedish sawmill companies have implemented value
added strategies of different kinds (Hugosson & McCluskey, 2008). However, value added
strategies and in general increased market orientation are not the only aspects of profitable
strategy development. Being at the forefront in technology development and investing in
large-scale operations have also been of importance (Sinclair & Cohen, 1992; Nyrud &
Bergseng, 2002; Mårtensson, 2003). Lee et al. (1999), especially, emphasise the important
relationship between product innovation and process innovation.
However, the experiences of value added strategies of earlier decades have not been entirely
positive (cf. Brege & Överberg, 2000). Several investments have resulted in major
disappointments, even though they initially looked good. There could be several explanations,
two of which are elaborated upon.
Page 4
3
First, the sawmill industry has to handle problems related to the “divergent product logic”, i.e.
the need to make full use of the entire saw-log (cf. Brege et al., 2004). This “restriction” on
business development forces sawmill companies to employ more than one strategy, expressed
in terms of the Porter (1980) classification into cost effective, differentiated and focus-
oriented strategies. Hansen et al. (2002) show the negative effects on profitability by
employing several strategies simultaneously, a conclusion that agrees with the Porter warning
of not getting “stuck in the middle” (Porter, 1980, p.?).
Second is the problem of imitation and the low barriers to imitation within the sawmill
industry. Adding value in terms of planing, special drying, stress-grading, etc. are too easily
imitated and the differentiation factor can turn into a commodity rather quickly. It is often
imperative to combine investments in tangible resources for value added strategies with the
building up of intangible resources and capabilities in terms of marketing skills, market
positions and even company and product branding, and thus create a more sustainable
differentiation (cf. Brege et al., 2004; Tokarczyk & Hansen, 2006; Läthinen, 2007). In
general, Day (1994), for example, supports this reasoning regarding the importance of
building a wide variety of strongly market-oriented capabilities.
However, despite the problems above regarding the increasing of value-added activities, there
is interesting evidence that value added strategies in sawmill industries have in general
positive effects on profitability. From a Swedish perspective, Roos et al. (2001; 2002) have
shown that sawmills with value-added strategies have higher profit margins. Internationally,
research results from Hansen et al. (2006) and Läthinen and Toppinen (2008) indicate a
similar direction i.e. that value added activities pay off. From a more general perspective,
when broadening the empirical context beyond sawmills and forest products, Narver and
Slater (1990) express a similar viewpoint.
Purpose of the article
The aim of this article is to further our understanding of Swedish sawmilling strategies. The
purpose is divided into one descriptive and one explanatory. The descriptive purpose is to
present an updated picture into the 21st century of the value added strategies among the largest
Swedish sawmill companies (with an annual production capacity of more than 250,000 cubic
meters, m3), including a differentiation between further processing in primary sawmill
Page 5
4
production and further integration into the wood manufacturing business (called forward
integration into secondary production).
The explanatory purpose is to relate some basic conditions, expressed as company size,
company growth and corporate strategy, to value added strategies and forward integration and
thereafter to profitability. Läthinen and Toppinen (2008) state that the insights into the
relationship between sawmill strategies and profitability are still very low. Compared to
studies from Roos et al. (2001; 2002), the unit of analysis in this study is the company level
and not the specific sawmill level, and we distinguish between different types of value added
strategies. A third difference is the longitudinal character of the study, covering the four-year
period from 2002 to 2005.
MATERIALS AND METHODS
The study population consists of the largest Swedish sawmill companies with an annual
production capacity exceeding 250,000 m3 (Skogsindustrierna, 2006). The population
comprised 15 companies with a combined production volume of 10.9 million m3 in 2005,
which was more than 60 per cent of the total Swedish production for that year. The lower
boundary of the population was set somewhat subjectively, though we were interested in the
largest buying sawmill companies and forest corporations and forest owners’ association
companies (the two latter categories bundled together as “forest corporation sawmills”). Note
that even though conventionally larger companies have the resources to invest in value added
activities, they also have large volumes to sell to the market, which forces them to operate on
the open market with day-to-day prices.
The companies Stora Enso and Norra Skogsägarna were excluded due to data collection
difficulties, resulting in a response rate for this study of 87 per cent. The international profile
of Stora Enso (the largest company) made it difficult to obtain and estimate value added
figures and profitability, and properly relate the company to their Swedish operations. In the
case of Norra Skogsägarna, their organisational form rendered the structure of their operations
and economic data incompatible to our structure. For analytical purposes we decided to keep
Södra separate from Geijer Trä (Geijer Trä, a buying sawmill company acquired by Södra in
2003).
Page 6
5
The study of this high volume segment was a description from 2002 to 2005. This period was
chosen to obtain a normal market situation, e.g. the storm Gudrun had an effect on production
and profitability from 2006 and onwards. Production and economic data were predominantly
collected from income statements and annual reports. Direct or telephone interviews with
representatives from all companies were conducted to fill in information gaps and to confirm
the figures presented in company reports and our calculations.
Definition of variables used
Our definition of value added focuses on the additional activities that transform a bulk
product (a commodity) into a more differentiated product. In other types of analysis, all
activities that transform raw material into a product are termed value added or gross value
added (cf. Lantz, 2003; Läthinen & Toppinen, 2008). Our definition is more in line with Roos
et al. (2002), but with a somewhat different categorisation of different value added activities.
We distinguish between value added in the primary sawmill production and forward
integration.
- Value added in the primary sawmill production includes planing, finger-jointing,
stress-grading and preservation as well as length and dimension adaptation and kiln-
drying to specific MC. Our definition distinguishes between “basic” sawmill
production and value added refining of the basic production further (cf. Roos et al.,
2002).
- Forward integration includes ownership and control of businesses further down the
value chain (secondary value added). Examples range from production of gluelam,
cross-laminated timber and edge-glued panel to the production of structural building
elements and system prefabrication to trading as wholesalers and manufacturing of
timber frame houses.
The following variables have been analysed:
- turnover in MSEK (average 2002-2005),
- turnover growth in percentage (2002-2005),
- production capacity in m3 (average 2002-2005),
- capacity growth in percentage (2002-2005),
- unit revenue - turnover per capacity m3 (average 2002-2005),
- value added in primary sawmill production as a percentage of volume of total primary
production (average 2002-2005),
Page 7
6
- growth in value added measured as share of total primary production (2002-2005),
- growth in value added measured in volume value added (2002-2005),
- forward integration; percentage of turnover of secondary operations of total turnover
(average 2002-2005)
- profitability measured as return on investment, ROI (as an average of the period 2002-2005).
ROI was calculated by dividing earnings before financial costs and taxes with total assets on
the balance sheet.
Estimating the degree of value added and forward integration in the sawmill strategies is
difficult even for the companies themselves due to the integrated character of sawmill
production processes. Value added activities (primary) in sawmill production are not always
organisationally separate from the “basic” sawmill activities; similarly, forward integration
activities organisationally are not separate from primary production. Our estimations are
based on the definitions of value added production and forward integration and from official
data like company reports as well as internal information provided by the companies. We
contacted each company to confirm our estimates of value added shares in primary sawmill
production and forward integration, and we felt confident that the estimates of shares of value
added in primary production were accurate. However, our estimates of forward integration
were less certain, and we therefore excluded the calculation of forward integration growth
during the period.
The explanatory part of this study was based upon the formulation of hypotheses of casual
relationships between some basic conditions, such as company size, company growth and
corporate strategy, related to value added strategies and profitability. A correlation analysis
based on Pearson’s correlation test was conducted between the listed variables.
To test the hypotheses of differences between strategic groups, i.e. buying sawmill companies
as a group and forest corporation sawmills (including larger forest companies together with
forest owner’s association sawmills) as another group, an independent samples t-test was
conducted. A Levene’s test was conducted to test the equality of variance in the strategic
groups.
Generalizing our hypotheses from a population of sawmill companies in the high volume
segment to the entire population should be done with great care. Some of the most successful
Page 8
7
buying sawmill companies are in the high volume segment (otherwise they would not belong
to this exclusive group), whereas almost all of sawmill divisions to forest conglomerates and
forest owners associations belong to the high volume segment.
ANALYTICAL MODEL AND HYPOTHESES
The explanatory analysis of value added strategies and profitability is built on a model with
three (independent) explanatory variables for value added and profitability – company size in
terms of turnover and sawmill capacity, company growth in terms of turnover and capacity
over the time period, and corporate strategy. Value added strategies and growth in value
added are both treated as dependent and independent variables – dependent in the analysis of
the causes of value added strategies and growth in value added and independent in the
analysis of the relationship between value added and profitability.
Figure 1: Analytical frame of reference and hypotheses
When building upon this analytical model, we can formulate some hypotheses based on
research within the forest and wood manufacturing industries and more general research from
other empirical settings. Note that our hypotheses are principally related to the largest
companies in the industry.
Hypothesis 1(H1): Size in terms of turnover or capacity is negatively related to profitability.
Page 9
8
Hypothesis 2 (H2): Size in terms of sawmill capacity is negatively related to value added
strategies in primary production.
Hypothesis 3 (H3): Growth in sawmill capacity is positively related to growth in value added
in primary production, measured in cubic metres and in value added share.
In the literature, the relationship between size and profitability is unclear, and even more so if
we delimit the population to the high volume segment. Roos et al. (2001) indicate that the
largest sawmills (at the sawmill level) have lower profit margins compared to the somewhat
smaller sawmills. Läthinen and Toppinen (2008) present empirical evidence that the 27
largest Finnish companies have higher profitability figures compared to the industry average.
The kind of strategy being implemented is confusing the relationship between size and
profitability. Scale economies in production-oriented sawmill strategies (cost-leadership) are
often in a trade-off relationship with differentiation strategies in terms of value added and
market orientation (cf. Porter, 1980; Bush & Sinclair, 1991). When formulating H1, we
believed more in the negative aspects of size on profitability among the large sawmill
companies.
Bush & Sinclair (1991) state that the “giant” companies most often apply cost leadership
strategies and use price as a competitive weapon, and that “large” and “medium” sized
companies have more mixed strategies between cost leadership and differentiation, focusing
more on customer relations and product quality rather than price. In Roos et al. (2001), the
largest sawmills (at the specific site level) and those belonging to large forest corporations,
have lower value added figures than sawmills with somewhat lesser capacity and belonging to
the buying sawmill category. Aggregated to company level, this implies that forest company
sawmills (in the high volume segment) are larger in size and still more bulk-oriented, i.e. size
is negatively related to value added strategies in primary production (H2).
Hypothesis 3 (H3 - the degrees of value added and forward integration are gradually
increasing) is primarily linked to findings from the Swedish sawmill industry (cf. Roos et al.,
2001; 2002; Nord, 2005; Hugosson & McCluskey, 2008). When sawmill companies grow
most of their resources is channelled to value added strategies. Similar international trends are
reported in Bush and Sinclair (1991), Niemelä and Smith, (1996) and Lee et al. (1999).
Page 10
9
Hypothesis 4 (H4): Buying sawmill companies have a higher degree of value added activities
in primary production and in forward integration (compared to forest corporation sawmills).
Hypothesis 5 (H5): Forest company sawmills have invested more in value added growth in
primary production (from a lower value added level compared to buying sawmill companies).
Hypothesis 6 (H6): Buying sawmill companies are more profitable than forest corporation
sawmills.
The question of causal relationships between corporate strategy versus value added and value
added growth is addressed in H4 and H5. Buying sawmill companies with a greater focus on
the sawmilling business are expected to have higher value added and forward integration
figures. As discussed under H2, Roos et al. (2002) show the linkage between high value
added activities and larger sawmills owned by companies with no forest resources of their
own. The rationale for H5 is that the forest company sawmills are trying to catch up in the
race for increased value added, especially value added in the primary production. When
focusing on the Swedish sawmilling industry, hypothesis 6 (H6 - implies that buying sawmill
companies are more profitable than forest corporation sawmills, indicated that sawmills
belonging to privately owned companies had a higher profitability than forest corporation and
forest-owners association sawmills. Note that a positive relationship between corporate
strategy and profitability is not only dependent upon a high degree of value added. Also
important to profitability is market orientation in a broader sense, often relying upon a
consistent and step-wise building of market positions and customer relationships (cf. Brege et
al., 2004; Tokarczyk & Hansen, 2006; Läthinen, 2007)
Hypothesis 7 (H7): A high degree of value added in primary production and in forward
integration is positively related to profitability
Roos et al. (2002) report a combination of value added and forward integration strategies of
the Swedish sawmilling industry, and that significant differences in terms of value added and
profitability between a cluster of large forest company sawmills (at the specific sawmill level)
and a cluster of buying sawmill companies were established. Although Roos et al. (2002) do
not separate primary production value added activities with forward integration, a positive
relationship between value added and profitability (H7) can also be hypothesized at a
company level.
Page 11
10
In a similar study of the Finnish sawmill industry, Läthinen & Toppinen (2008) reported
significant improved profitability and turnover growth among 27 large and medium-sized
sawmill companies compared to the total industry (a study of fiscal data from 2000 to 2004).
The study also showed that among the 27 companies, those with higher value added (as a
function of gross value added and investments) were more profitable and displayed better
performance in terms of liquidity and solvency.
Hypothesis 8 (H8): Higher growth in value added in primary production is negatively related
to profitability.
H8 is formulated with reference to results from the Profit Impact of Market Strategy (PIMS)
database, which stated that profitability is lower during the time period when a strategy
change is implemented (Schoeffler et al., 1974; Buzzel & Gale, 1987;).
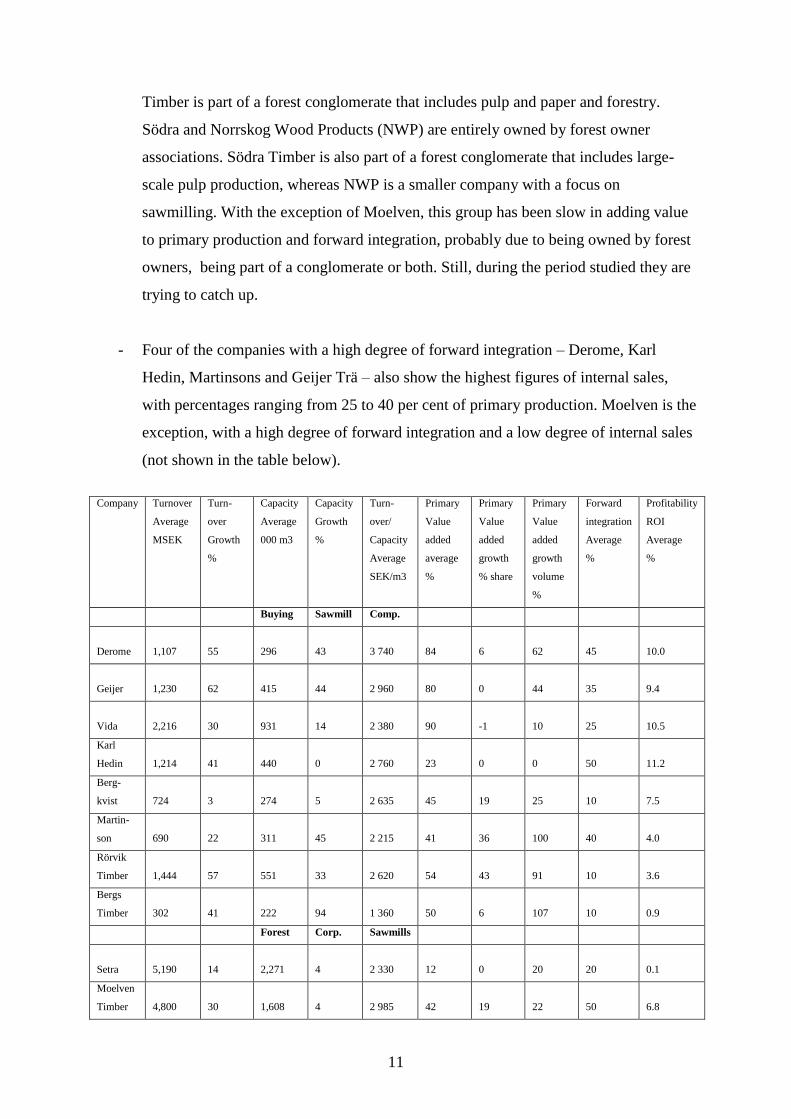
RESULTS
The categorisation of the value added strategies and profitability figures are presented in
Figure 1 below:
- Eight companies are referred to as the “buying sawmill companies”, indicating the
lack of their own forest resources and thus their dependence on purchasing
roundwood. Six of these companies are privately owned and two are traded on the
Stockholm stock exchange (even though many of the shares are in the hand of one
owner). The buying sawmill companies started value added activities and forward
integration early on partly due to a lack of their own forest resources. With the
exception of the Vida-group, they are relatively small in terms of sawmill production
capacity (though still large compared to the industry average). Derome and Karl Hedin
are the companies with the highest forward integration, including building merchant
subunits, and in the case of Derome prefabricated house production.
- Five companies are referred to as the “forest corporation sawmills” and four are
among the largest in terms of production capacity (we keep the forest owner’s
sawmills together with the forest conglomerates). Setra Group and Moelven are more
focused upon sawmilling and forward integration into wood manufacturing. SCA
Page 12
11
Timber is part of a forest conglomerate that includes pulp and paper and forestry.
Södra and Norrskog Wood Products (NWP) are entirely owned by forest owner
associations. Södra Timber is also part of a forest conglomerate that includes large-
scale pulp production, whereas NWP is a smaller company with a focus on
sawmilling. With the exception of Moelven, this group has been slow in adding value
to primary production and forward integration, probably due to being owned by forest
owners, being part of a conglomerate or both. Still, during the period studied they are
trying to catch up.
- Four of the companies with a high degree of forward integration – Derome, Karl
Hedin, Martinsons and Geijer Trä – also show the highest figures of internal sales,
with percentages ranging from 25 to 40 per cent of primary production. Moelven is the
exception, with a high degree of forward integration and a low degree of internal sales
(not shown in the table below).
Company Turnover
Average
MSEK
Turn-
over
Growth
%
Capacity
Average
000 m3
Capacity
Growth
%
Turn-
over/
Capacity
Average
SEK/m3
Primary
Value
added
average
%
Primary
Value
added
growth
% share
Primary
Value
added
growth
volume
%
Forward
integration
Average
%
Profitability
ROI
Average
%
Buying Sawmill Comp.
Derome
1,107
55
296
43
3 740
84
6
62
45
10.0
Geijer
1,230
62
415
44
2 960
80
0
44
35
9.4
Vida
2,216
30
931
14
2 380
90
-1
10
25
10.5
Karl
Hedin
1,214
41
440
0
2 760
23
0
0
50
11.2
Berg-
kvist
724
3
274
5
2 635
45
19
25
10
7.5
Martin-
son
690
22
311
45
2 215
41
36
100
40
4.0
Rörvik
Timber
1,444
57
551
33
2 620
54
43
91
10
3.6
Bergs
Timber
302
41
222
94
1 360
50
6
107
10
0.9
Forest Corp. Sawmills
Setra
5,190
14
2,271
4
2 330
12
0
20
20
0.1
Moelven
Timber
4,800
30
1,608
4
2 985
42
19
22
50
6.8
Page 13
12
SCA
Timber
2,617
110
1,263
115
2 070
19
50
230
10
2.1
Södra
Timber
1,834
12
952
25
1 925
40
67
108
10
-4.5
NWP
532
148
301
109
1 770
29
19
57
10
2.2
1,838
48
756
41
2 440
47
20
67
25
4.9
Table 1. The sample of sawmilling companies with financial and production data for the period 2002-2005
Correlation analysis
A correlation analysis was made between the variables listed in an earlier section of this
article.
Turnover
average
MSEK
Turn-
over
Growth
%
Production
Capacity
average
000 m3
Capacity
Growth
%
Unit
Revenue
Average
SEK/m3
Primary
Value
added
average
%
Primary
Value
added
growth
% share
Primary
Value
added
growth
volume
%
Forward
integration
average
%
Turnover
Growth
%
-.236
.437
13
Capacity
average
000m3
.972**
.000
13
-.200
.512
13
Capacity
Growth
%
-.392
.185
13
.794**
.001
13
-.291
.335
13
Unit
Revenue
average
SEK/m3
.170
.578
13
-.186
.543
13
-.006
.984
13
-.519
.069
13
Primary
Value
added
average %
-.317
.291
13
-.131
.669
13
-.413
.161
13
-.129
.674
13
.444
.128
13
Primary
Value
added
growth
% share
-.061
.844
13
.077
.803
13
.035
.911
13
.245
.420
13
-.313
.297
13
-.305
.310
13
Primary
Value
added
-.154
.400
-.029
.729**
-.407
-.240
.693**
Page 14
13
growth
volume %
.614
13
.176
13
.925
13
.005
13
.168
13
.430
13
.009
13
Forward
integration
average
02-05 %
.181
.554
13
-.221
.469
13
.009
.978
13
-.451
.122
13
.682*
.010
13
.222
.466
13
-.432
.141
13
-.455
.118
13
Profitability
ROI
average
%
-.145
.635
13
-.043
.890
13
-.307
.308
13
-.353
.237
13
.704**
.007
13
.533
.060
13
-.649*
.016
13
-.530
.062
13
.655*
.015
13
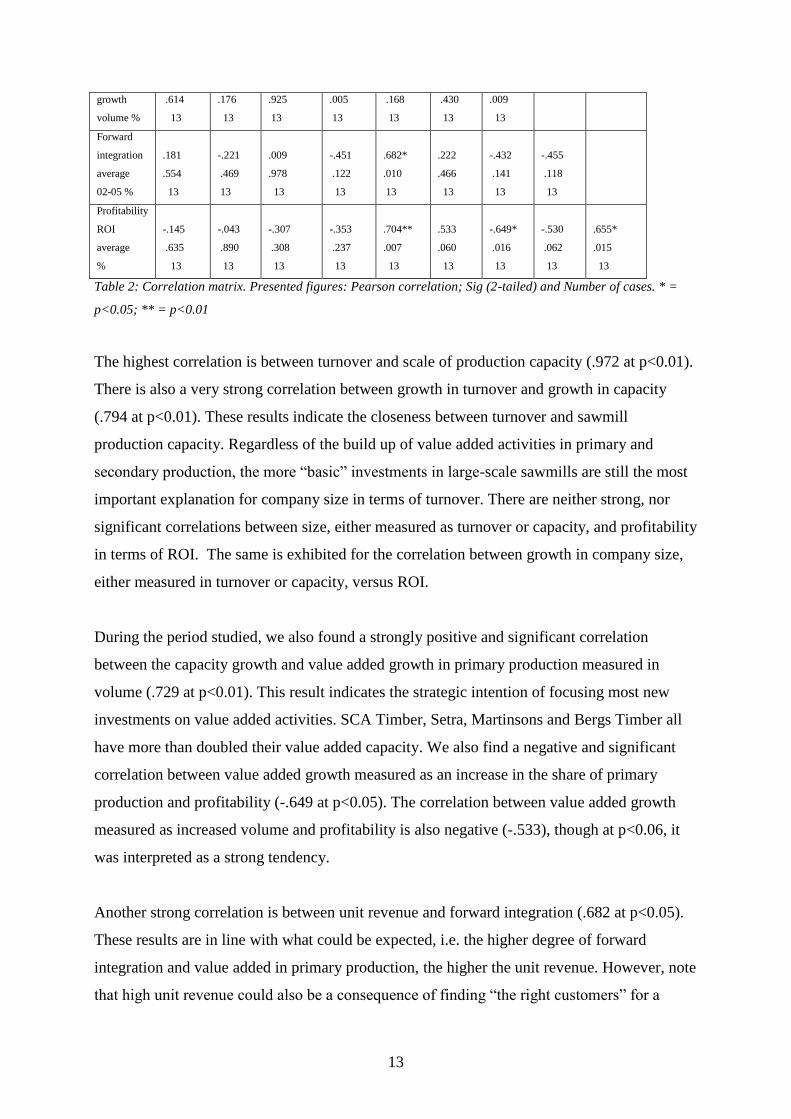
Table 2: Correlation matrix. Presented figures: Pearson correlation; Sig (2-tailed) and Number of cases. * =
p<0.05; ** = p<0.01
The highest correlation is between turnover and scale of production capacity (.972 at p<0.01).
There is also a very strong correlation between growth in turnover and growth in capacity
(.794 at p<0.01). These results indicate the closeness between turnover and sawmill
production capacity. Regardless of the build up of value added activities in primary and
secondary production, the more “basic” investments in large-scale sawmills are still the most
important explanation for company size in terms of turnover. There are neither strong, nor
significant correlations between size, either measured as turnover or capacity, and profitability
in terms of ROI. The same is exhibited for the correlation between growth in company size,
either measured in turnover or capacity, versus ROI.
During the period studied, we also found a strongly positive and significant correlation
between the capacity growth and value added growth in primary production measured in
volume (.729 at p<0.01). This result indicates the strategic intention of focusing most new
investments on value added activities. SCA Timber, Setra, Martinsons and Bergs Timber all
have more than doubled their value added capacity. We also find a negative and significant
correlation between value added growth measured as an increase in the share of primary
production and profitability (-.649 at p<0.05). The correlation between value added growth
measured as increased volume and profitability is also negative (-.533), though at p<0.06, it
was interpreted as a strong tendency.
Another strong correlation is between unit revenue and forward integration (.682 at p<0.05).
These results are in line with what could be expected, i.e. the higher degree of forward
integration and value added in primary production, the higher the unit revenue. However, note
that high unit revenue could also be a consequence of finding “the right customers” for a
Page 15
14
standard product range (i.e., Japanese customer segments) or as an “extra turnover” from a
complementary business such as the trading of timber.
We also find a very strong and significant correlation between unit revenue and profitability
in terms of ROI (.862 at p<0.01). This is one of the most important results from our study.
First, this result emphasises the importance of price and revenue management and not only
focusing on cost, and tells us that large-scale bulk strategies, primarily focused on cost
efficiency, are not profitable (at least not during the studied period). Secondly, in scrutinizing
our material closer, we could find three avenues for good revenue management.
1. Profitable management of low value added product ranges. There are strong
indications that three companies with relatively low value added in primary production
– Karl Hedin (25 per cent value added), Bergquist i Insjön (30 per cent) and Moelven
(20 per cent) – have very good profitability in primary production (above 7-8 per cent
ROI as an average between 2002 and 2005).
2. Profitable management of value added in primary production. Three companies with
very high value added figures are Derome (90 per cent value added), Vida (90 per
cent) and Geijer (80 per cent). Their profitability ranges from 9 per cent ROI and up.
3. Profitable management of forward integration. The three most successful companies
seem to be Karl Hedin (50 per cent forward integration), Derome (50 per cent) and
Geijer Trä (35 per cent), with profitability figures about equivalent to the top three
value added in primary production (Derome shows up in both categories).
A somewhat weaker correlation at a lower significance level is found between forward
integration and profitability as ROI (.657 at p<0.05). However, this result must be interpreted
with slight caution. In examining our cases one by one, we can conclude that forward
integration does not always lead to increased profitability and it is not even the most
profitable part of a sawmill corporation. What we have shown is that there is more than one
avenue to profitability – and forward integration is one. Moelven is perhaps the most
interesting example with a high degree of forward integration (50 per cent), as well as (from
their annual reports) a better profitability in the sawmilling business than in forward
integration.
Page 16
15
The correlation between value added in primary production and profitability is lower than the
correlation between forward integration and profitability, and is only significant at the 0.06
level (.533 at p<0.06). However, the result could be viewed as a strong tendency, since the
significance level is strongly related to the number of cases and this is a small sample of 13
firms. Furthermore, Pearson’s correlation analysis and Independent samples t-test are rather
sensitive to “outliers” (such as Bergs Timber in our sample) and hence, we have compared
with Spearman’s rank correlation and Mann-Whiney U-test. Not surprisingly, we received,
though with some small differences, the same correlations and differences in means (rank-
sum). Therefore, it must be stated that high correlation figures are interesting, despite not
being significant in the traditional sense.
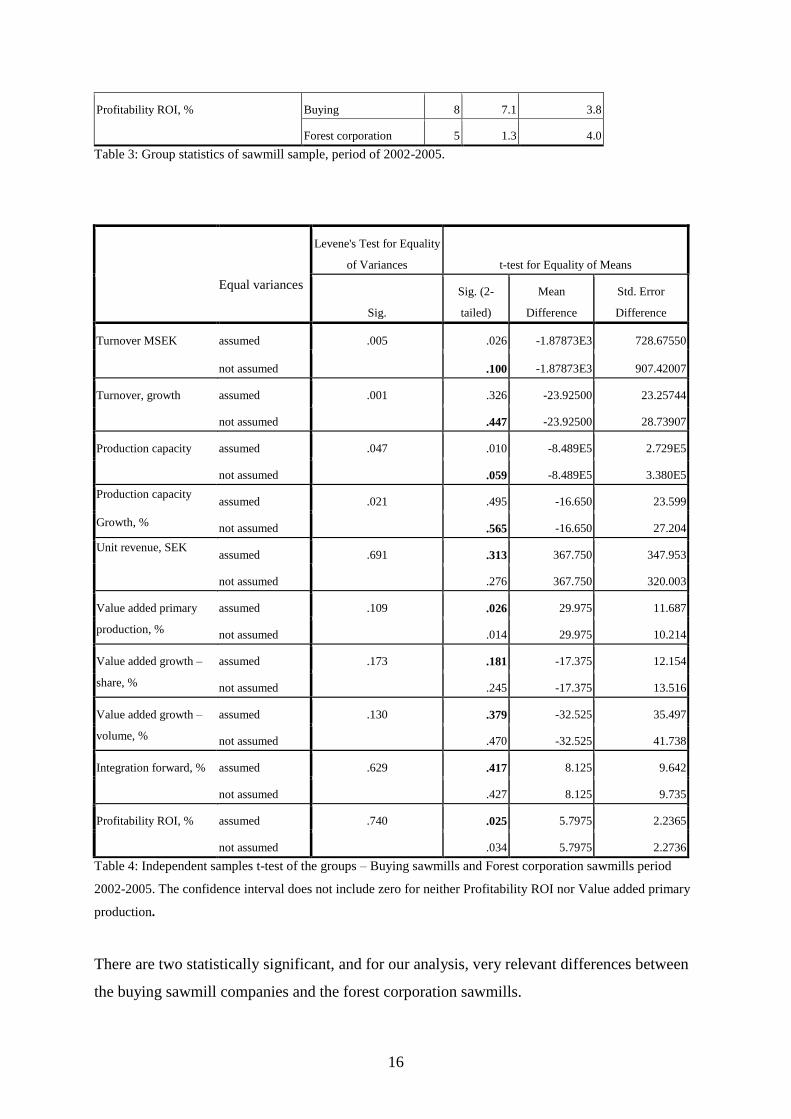
Comparison between buying sawmill companies and forest corporation sawmills
In this analysis, we compare eight buying sawmill companies with five forest corporation
sawmills.
Sawmill type N Mean Std. Deviation
Turnover MSEK Buying 8 1115 577.9
Forest corporation 5 2994 1976.9
Turnover growth, % Buying 8 39 19.9
Forest corporation 5 63 62.3
Production capacity, 000 m3 Buying 8 430 228. 5
Forest corporation 5 1 279 733.9
Production capacity
Growth, %
Buying 8 35 30.0
Forest corporation 5 51 56.0
Unit revenue, SEK
Buying 8 2584 674.9
Forest corporation 5 2216 476.8
Value added primary production, % Buying 8 58 23.7
Forest corporation 5 28 13.0
Value added growth – share, % Buying 8 14 17.3
Forest corporation 5 31 26.9
Value added growth – volume, % Buying 8 55 41.7
Forest corporation 5 87 87.3
Integration forward (secondary
production), %
Buying 8 28 16.7
Forest corporation 5 20 17.3
Page 17
16
Profitability ROI, % Buying 8 7.1 3.8
Forest corporation 5 1.3 4.0
Table 3: Group statistics of sawmill sample, period of 2002-2005.
Levene's Test for Equality
of Variances t-test for Equality of Means
Equal variances
Sig.
Sig. (2-
tailed)
Mean
Difference
Std. Error
Difference
Turnover MSEK assumed .005 .026 -1.87873E3 728.67550
not assumed .100 -1.87873E3 907.42007
Turnover, growth assumed .001 .326 -23.92500 23.25744
not assumed .447 -23.92500 28.73907
Production capacity assumed .047 .010 -8.489E5 2.729E5
not assumed .059 -8.489E5 3.380E5
Production capacity
Growth, %
assumed .021 .495 -16.650 23.599
not assumed .565 -16.650 27.204
Unit revenue, SEK
assumed .691 .313 367.750 347.953
not assumed .276 367.750 320.003
Value added primary
production, %
assumed .109 .026 29.975 11.687
not assumed .014 29.975 10.214
Value added growth –
share, %
assumed .173 .181 -17.375 12.154
not assumed .245 -17.375 13.516
Value added growth –
volume, %
assumed .130 .379 -32.525 35.497
not assumed .470 -32.525 41.738
Integration forward, % assumed .629 .417 8.125 9.642
not assumed .427 8.125 9.735
Profitability ROI, % assumed .740 .025 5.7975 2.2365
not assumed .034 5.7975 2.2736
Table 4: Independent samples t-test of the groups – Buying sawmills and Forest corporation sawmills period
2002-2005. The confidence interval does not include zero for neither Profitability ROI nor Value added primary
production.
There are two statistically significant, and for our analysis, very relevant differences between
the buying sawmill companies and the forest corporation sawmills.
Page 18
17
- Value added in primary production, where the buying sawmill companies on the
average have double the percentage in value added (58 per cent vs. 28 per cent at
p<0.05, table 3).
- Profitability, where the buying sawmills are on the average almost 5.5 times as
profitable (7.1 percent vs. 1.3 percent ROI at p<0.05).
Summing up the hypotheses
H1: Size in terms of turnover or capacity is negatively related to profitability.
The correlation analysis showed very weak negative and not significant correlations between
size, in terms of both turnover and capacity. Based on the population of the Swedish high
volume segment, H1 is rejected.
H2: Size in terms of sawmill capacity is negatively related to value added strategies in
primary production.
There were no strong or significant correlations between size, expressed either as turnover or
capacity, and value added in primary production. Based on the population of the Swedish high
volume segment, H2 is rejected.
H3: Growth in sawmill capacity is positively related to growth in value added in primary
production, measured in cubic metres and in value added share.
The correlation analysis shows support for H3 when value added growth is measured in terms
of volume growth (.729 at p<0.01). However, this is not the case when measured as value
added share.
H4: Buying sawmill companies have higher degrees of value added activities in primary
production and in forward integration.
The analysis of strategic groups gave significant support for H4, that buying sawmill
companies have a higher degree of value added in primary production compared to forest
corporation sawmills (58 per cent vs. 28 per cent on the average, and significant at p<0.05).
There was no significant difference between the two groups regarding forward integration.
Page 19
18
H5: Forest company sawmills have invested more in value added growth in primary
production (from a lower value added level).
Regarding H5, there was no significant difference between the two groups, despite the
difference in value added share growth of 31 per cent for the forest corporation sawmills and
13 per cent for the buying sawmill companies. This was due to the wide distribution of the
strategic groups
H6: Buying sawmill companies are more profitable than forest corporation sawmills.
There was also significant support for H6, that buying sawmill companies are more profitable
than forest corporation sawmills (7.1 per cent vs. 1.3 per cent ROI on the average at p<0.05).
As mentioned before, H6 proposes a broader causal relationship between corporate strategy
and profitability than value added only strategies. Included in this broader concept was a
clearer focus on the sawmill business, more long-term strategy development and more explicit
demands on profitability, as well as an overall more market-oriented approach.
H7: A high degree of value added in primary production and forward integration is positively
related to profitability.
The correlation analysis showed the clearest and most significant support to the positive
relationship between forward integration and profitability (.655 at p<0.05). The correlation
between value added in primary production and profitability was also strong, but not fully
significant (.533 at p<0.06, interpreted by us as a strong tendency, especially when there are
so few companies in the population). The major weakness with our analysis was that we have
been unable, with enough accuracy, to relate the share of value added in primary production
to profitability in primary production and the degree of forward integration to profitability in
forward integration. With our additional calculations, we feel rather confident that
profitability in value added in primary production is related to overall profitability. However,
we are somewhat uncertain about the profitability figures for forward integration. Therefore,
interpreting the causality between value added in primary production and forward integration
versus profitability should be done with great care.
H8: Higher growth in value added in primary production is negatively related to profitability.
The correlation analysis indicates a strong and significant support for the negative relationship
between growth in value added shares of primary production and profitability (-.649 at
p<0.05). This is in line with the broader experience from the PIMS database, but caution
Page 20
19
should again be taken when interpreting the causality. It seems as though the least profitable
companies (in the beginning of period) are those that have invested the most to increase the
value added share in primary production.
DISCUSSION
The results from our study show neither strong nor significant correlations between size and
profitability (the correlations are slightly negative). Among the largest companies in our
sample, two have good/high profitability – Moelven (a forest corporation company) and Vida
(a buying sawmill company), but the other large sawmill companies found in the category
with forest corporations all have low profitability. Among the smaller sawmill companies,
some have low profitability, such as Bergs Timber (a buying sawmill company) and NWP (a
forest corporation company). From this, our results from the correlation analysis can be used
to falsify two hypotheses. The hypothesis that size is strongly negatively correlated to
profitability is presented above. However, the opposite hypothesis is also falsified, i.e. size is
strongly positively related to profitability. From the latter hypothesis, large investments in
cost-efficient production capacity have not resulted in profitability (at least not during the
period studied).
However, our results show strong and significant correlations between unit revenue, forward
integration and value added in primary production and profitability. Besides value added and
forward integration, unit revenue could also be reached by obtaining higher prices from
specific customer segments (though with a low value added percentage) or from
complementary businesses like trading. These results point to the importance of the
management of revenues (and not only the management of costs).
From above, it is implied that standardized bulk strategies (with a low degree of value added)
are not profitable. We can also indicate a trend away from these bulk strategies towards more
value added in primary production. Companies with low value added from the beginning are
showing a higher growth rate in investing in value added activities. The privately owned
buying sawmill companies are still on top, but others are investing more heavily to catch up.
In the literature on sawmill strategy, there is empirically based evidence that the largest
companies are those that invest the most in value added activities (cf. Niemelä & Smith, 1997;
Läthinen & Toppinen, 2008). Our results from a population of high volume companies
Page 21
20
indicate the opposite. From our sample of the largest sawmills, the very largest are the least
oriented downstream in value added and forward integration. These results are more in line
with the results of Roos et al. (2001; 2002).
The relatively strong and negative correlations between growth in value added and
profitability show no immediate pay-offs for this behaviour. The negative relationship
between periods of heavy investments and profitability is shown in the PIMS-results (Buzzel
& Gale, 1987), which give a more general perspective on the problem. Two reasons are that
the high capital cost is a burden to company profit and that it takes time to exploit the benefits
of the investments, especially on a market such as sawn timber with prices almost set on a
global basis.
In our case data, there are examples of forward integration that are unprofitable, but also that
two companies can run about the same business with different profitability. Of course, this is
no surprise, but should be considered in discussing the advantages and challenges with value
added strategies and forward integration. Studies on outsourcing in the wood manufacturing
industry have, for instance, shown the difficulties for sawmill companies to take over
component production from customers (cf. Andersson et al., 2007).
The comparison between buying sawmill companies and forest corporation sawmills
highlights the importance of a long-term strategy and ultimately on priorities among the
owners. Investments in value added strategies in primary production and in forward
integration are not only a question about physical equipment, acquiring new companies
downstream in the value chain or both. It is very much a laborious question about building
customer relationships, market positions and even a brand reputation. It is also a question
about exploiting synergies in terms of internal integration (briefly mentioned in this article).
These results point in the direction of a certain capability to run value added businesses (cf.
Brege et al., 2004; Hansen et al., 2006; Tokarczyk & Hansen, 2006).
In conclusion, the results for the high volume segment show that neither company size nor
growth has any relationship to profitability, although the data shows a strong relation between
value added strategies and profitability. Companies that have gradually pursued further
processing activities and diversification into downstream operations are more profitable than
companies that have greatly invested recently. Hence, consistency in strategy and
Page 22
21
management of revenue pays off. The results of the study add to our understanding of the role
of strategic management to overcome the divergent product flow in the sawmill industry.
ACKNOWLEDGEMENTS
This study is part of the Lean Wood Engineering Programme (LWE), which is financed by
VINNOVA, partner companies and Luleå, Linköping and Lund universities. We thank the
editor and the two reviewers for comments on earlier versions of the manuscript.
REFERENCES
Andersson, D., Brege, S., Rehme, J. & Nordigården, D. (2007). Outsourcing of Wood-Based
Component Manufacturing: Driving Forces Found in Scandinavian Companies.
Journal of Forest Products Business Research 4: 1-19.
Brege, S., Johansson, H.-E. & Pihlqvist, B. (2004). Wood Manufacture – the System Breaking
Innovation System (in Swedish: Trämanufaktur – det systembrytande
innovationssystemet). VINNOVA Report VR 2004:02.
Brege, S & Överberg, I. (2000). Sawmill strategies for value added activities – a pilot study
(in Swedish: Strategier för sågverks vidareförädling – en pilotstudie), internal report,
Linköping university.
Bush, J. R. & Sinclair, S. A. (1991). A multivariate model and analysis of competitive
strategy in the U.S. hardwood lumber industry. Forest Science 37: 481 – 499.
Buzzell, R. and Gale, B. (1987) The PIMS Principles: Linking Strategy to Performance, Free
Press, New York.
Day, G. S. (1994). The Capabilities of Market-Driven Organizations. Journal of Marketing 58
(Oct): 37-52.
Hansen, E., Seppälä, J. & Juslin, H. (2002). Marketing Strategies of Softwood Sawmills in
Western North America. Forest Product Journal 52 (10): 19-25.
Hansen, E., Dibrell, C. & Down, J. (2006). Market orientation strategy and performance in the
primary forest industry. Forest Science 52 (3): 209-220.
Page 23
22
Hugosson, M. & McCluskey, D. (2008). Strategy transformations of the Swedish sawmilling
sector 1990-2005. Studia Forestalia Suecica No. 217.
Lähtinen, K. (2007). Linking Resource-Based View with Business Economics of
Woodworking Industry: Earlier Findings and Future Insights. Silva Fennica 41 (1):
149-165.
Läthinen, K. & Toppinen, A. (2008). Financial performance in Finnish large- and medium
sized sawmills: the effects of value-added creation and cost-efficiency seeking.
Journal of Forest Economics 14 (4): 289-305.
Lantz, V. (2005). Measuring scale, technology and price effects on value-added production
across Canadian forest industry sectors. Forest Policy and Economics 7: 333-344.
Lee, L., Cohen, D. & Maness, T. (1999). Market and technology in Western Canadian
sawmills. Forest Product Journal 49: 36-42.
Mårtensson, J. (2003). Economies of scale in the Swedish sawmill industry. Journal of Forest
Economics 9 (3): 169-179.
Narver, J. D. & Slater, S. F. (1990). The effect of a market orientation on business
profitability. Journal of Marketing 54 (4): 20-35.
Niemelä, J. S. & Smith, P. M. (1997). A multinational analysis of competitive strategies of
softwood sawmills. Scandinavian Journal of Forest Research 12(3), p 295-301.
Niemelä, J. S. & Smith, P. M. (1996). A cross-national investigation of softwood sawmill
marketing strategies. Forest Science 42: 290-299.
Nord, T. (2005). Structure and Developments in the Solid Wood Value Chain - Dominant Saw
Milling Strategies and Industrialized Housing, licentiate thesis, Civil and
Environmental Engineering, Luleå University of Technology, Luleå
Nyrud, A & Bergseng, E. (2002). Production Efficiency and Size in Norwegian Sawmilling.
Scandinavian Journal of Forest Research 17: 566-575.
Page 24
23
Porter, M. (1980). Competitive strategy – techniques for analyzing industries and
competitors. The Free Press. New York.
Roos, A., Flinkman, M., Jäppinen, A., Lönner, G. & Warensjö, M. (2001). Production
strategies in the Swedish soft-wood industry. Forest Policy and Economics 3: 189-
197.
Roos, A., Flinkman, M., Jäppinen, A., Lönner, G. & Warensjö, M. (2002).Value added
strategies in the sawn wood industry. Scandinavian Journal of Forest Research 17:
90-96.
Schoeffler, S. Buzzell, R. and Heany, D. (1974). Impact of Strategic Planning on Profit
Performance. Harvard Business Review 52(2).
Sinclair, S. A. & Cohen, D. H. (1992). Adaptation of continuous processing technologies: Its
strategic importance in standardized industrial product markets. Journal of Business
Research 24 (3): 209-224.
Skogsindustrierna. (2006). The Swedish forest industry – facts and figures. Retrieved from
Skogsindustrierna website:
http://www.skogsindustrierna.org/documentation/publications
Tokarczyk, J. & Hansen, E. (2006). Creating Intangible Competitive Advantage in the Forest
Industry. Forest Products Journal 56 (7/8): 4-13.