30
VALUE-ADDED WOOD PRODUCTS MARKETS U. Buehlmann Virginia Tech Blacksburg, VA A. Schuler U.S. Forest Service Princeton, WV M. Bumgardner U.S. Forest Service Delaware, OH
VALUE-ADDED WOOD PRODUCTS MARKETS
U. BuehlmannVirginia TechBlacksburg, VA
A. SchulerU.S. Forest ServicePrinceton, WV
M. BumgardnerU.S. Forest ServiceDelaware, OH

U.S. Economic Picture as of Sept. ’08
Bad as it can get…
Source: HMR Market Report- HMR Executive


Eastern hardwood lumber production- Four years of decline from 1999-2003- (this last happened in 1966-1970)
9
10
11
12
13
91 92 93 94 95 96 97 98 99 '00 '01 '02 '03 '04 '05 '06 '07 '08p
Bill
ion
boar
d fe
et
Source: W. Luppold, USDA Forest Service


0%
10%
20%
30%
40%
50%
60%
199219931994199519961997199819992000200120022003200420052006
Kitchen cabinets Upholstered Wood OfficeHH Furniture Molding(hwd + soft) Hardwood Flooring
*These market shares are conservative becausesome imported components and finished furniture is included in the domestic shipments Source: U.S. Census; ITA
U.S. import market shares for hardwood products

Hardwood lumber consumption trends
0
1
2
3
4
5
6
1963 1967 1972 1977 1982 1987 1992 1997 2002
Billi
on B
F
Furniture
Construction &Remodeling*Industrial
Exports
Construction and remodeling now about 2X as large as furniture

Changing markets for hardwood components
Source: 2008 WCMA Market Study
* residential and commercial, both new construction and remodeling
1984(%)
2008(%)
Furniture 65 22Cabinetry 16 27Building Products* 10 42Decorative/Specialty 4 7Industrial Products 5 3

What large hardwood sawmills are doing
• 2005 survey of the Appalachian Hardwood Manufacturers, Inc. (High Point, NC)
32 responses (60%)owners/upper management85% of mills with production ≥ 6 MMBF41% of mills with production >15 MMBFResponses from 9 states (WV, NC, VA, KY,NY, PA, OH, TN, GA)

What large hardwood sawmills are doingActions cited by a majority of AHMI members . . .
53.1
53.1
62.5
62.5
71.9
75.0
90.6
0 20 40 60 80 100
We sell a higher proportion of our production inexport markets
We provide more sorting services for color
We provide more sorting services for width
We provide more sorting services for length
We have invested in new equipment
We are more aggressive in our search for newmarkets
We work harder to develop relationships withour customers
Proportion of respondents

What large hardwood sawmills are doingOther actions cited by AHMI members . . .
6.3
6.3
31.3
31.3
40.6
43.8
46.9
46.9
0 10 20 30 40 50
We really don't do anything different because ofglobalization
We have decreased our work in progress inventory
We carry more finished inventory at the mill
We have invested to become more verticallyintegrated
We have hired or contracted with sales reps locatedoverseas
We have developed new grading criteria for specificcustomers
We have shortened our lead times
We are more flexible in our delivery schedules
Proportion of respondents

A “new” and growing market – smaller customers?
• “my Christmas card list has expanded”
• “Yesterday, it was five loads to one customer; today, it is one load to five customers”– and all five want something a little different!
• Efficiency in distribution becomes a competitive advantage

Modern Woodworking Housing Study
• Survey February 2008• email to 17,658 subscribers• reminder after 2 weeks• 496 responses• 430 usable responses

Pretty Optimistic Response…
• by February 2008, only a third of the industry seems affected• today, one would assume a bleaker picture• responses obtained, however, are interesting…

Value of private U.S. construction
Of those firms with sales growth in 2007in the single family housing market . . .
Sources: U.S. Census Bureau, Tables C30 and C500
50
100
150
200
250
300
350
400
450
2002 2003 2004 2005 2006 2007
billio
n $ SF housing
MF housingR&RNonres cons.
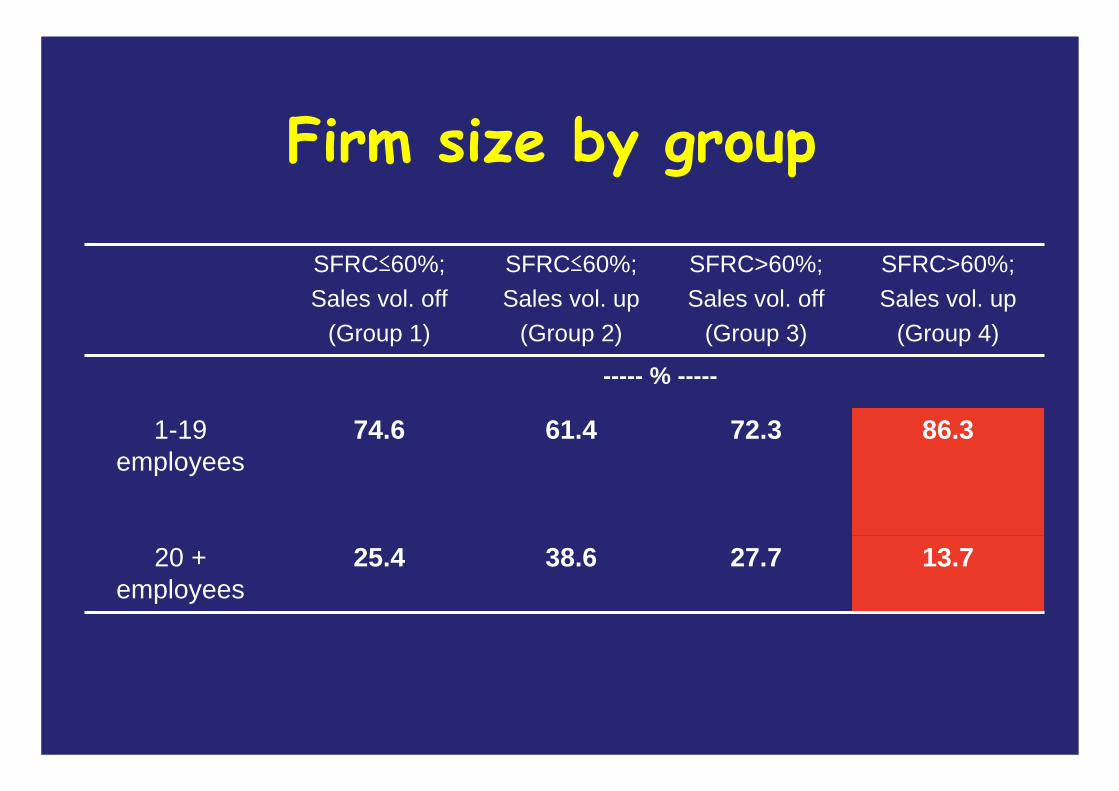
Firm size by group
SFRC≤60%;Sales vol. off
(Group 1)
SFRC≤60%;Sales vol. up
(Group 2)
SFRC>60%;Sales vol. off
(Group 3)
SFRC>60%;Sales vol. up
(Group 4)
----- % -----
1-19 employees
74.6 61.4 72.3 86.3
20 + employees
25.4 38.6 27.7 13.7

Total sales by groupSFRC≤60%;Sales vol. off
(Group 1)
SFRC≤60%;Sales vol. up
(Group 2)
SFRC>60%;Sales vol. off
(Group 3)
SFRC>60%;Sales vol. up
(Group 4)
----- % -----
< $1 million 61.0 48.8 66.1 78.1
$1-$10 million 24.6 34.6 16.1 13.7
> $10 million 14.4 16.5 17.9 8.2

Made-to-order productionSFRC≤60%;Sales vol. off
(Group 1)
SFRC≤60%;Sales vol. up
(Group 2)
SFRC>60%;Sales vol. off
(Group 3)
SFRC>60%;Sales vol. up
(Group 4)
----- % -----
0 – 20% 18.6 14.3 16.1 4.1
21 – 60% 23.7 19.0 15.2 16.7
61 – 100% 57.6 66.7 68.8 79.4

Assessment of construction markets, 2008 & 2010
1
2
3
4
5
6
7
SFhousing
MFhousing
R&R Nonrescons.
2008 2010

Market size - Remodeling becoming increasingly important
191220
280
338
402
230
300
424 418453
$100
$200
$300
$400
$500
1995 2000 2005 2010 2015
Remodeling New constrcution
Billions 2005 dollars
Source: Harvard JCHS 2007
45%
42%
40%
45%
47%
36%
38%
40%
42%
44%
46%
48%
1995 2000 2005 2010 2015
Remodeling share of residential investment

Housing Demand Drivers – this decade could be better than the last
0
0.5
1
1.5
2
2.5
1986 - 95 1996 - 05 2005 - 2014
Household Growth Vacant Unit Demand Net Removals
Million per yearHarvard JCHR outlook ( Nov 2007)

Housing Cycles – they have been with us for decades
Source: NAHB

Home prices and incomes must trend together- when price exceeds ability to pay ( incomes)
house prices must come downIncome and Price set to Index of 100 in 1990
Sustainable relationship
correction
Sources: NAHB & NAR – Home prices; U.S. Census – family income

Summary
• Globalization and housing problems pressures continue in many hardwood and woodworking sectors
• Effects of housing problems ripple through entire wood products value-chain
• For lumber producers, sorting, flexibility becoming necessary actions to supply the hardwood industry
• Smaller woodworking firms producing made-to-order products increasingly important to domestic demand for hardwood lumber
• A focus on adding value!
GREEN BUILDING PROGRAMS IN THE USA
U. BuehlmannVirginia TechBlacksburg, VA
P. AramanU.S. Forest ServiceBlacksburg, VA
D. HindmanVirginia TechBlacksburg, VA
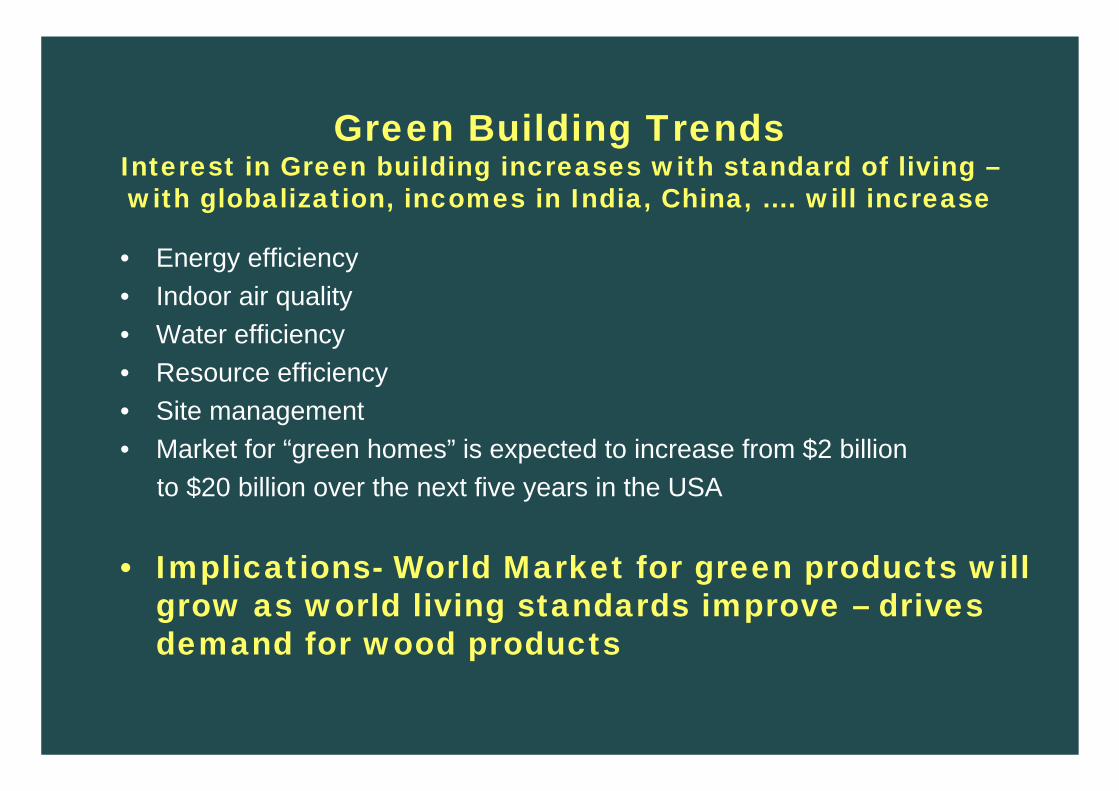
Green Building TrendsInterest in Green building increases with standard of living –with globalization, incomes in India, China, …. will increase
• Energy efficiency• Indoor air quality• Water efficiency• Resource efficiency• Site management• Market for “green homes” is expected to increase from $2 billion
to $20 billion over the next five years in the USA
• Implications- World Market for green products will grow as world living standards improve – drives demand for wood products

Purpose of study – OSB, LVL, and treated lumber
• Quantify the amount of OSB, LVL, and treated lumber waste generated per house.
• Compare waste generated from “green”construction with that of “non-green”construction.
• Determine potential uses for waste material as an alternative to landfilling.
• Salvage material where possible for reuse and/or recycle into other products.

Inside view of storage trailer with waste OSB, LVL and treated lumber
Any Questions?


