14
Value based Management (BCG approach) Presented by:- Avinash Ahuja (11101) Jagdish Devjani (11111)
| Date post: | 21-Apr-2015 |
| Category: |
Documents |
| Upload: | avinash-ahuja |
| View: | 265 times |
| Download: | 8 times |

Value based Management(BCG approach)
Presented by:- Avinash Ahuja (11101)
Jagdish Devjani (11111)
Introduction Developed by Boston Consulting Group Two concepts at Foundation
Total Share holders Return Total Business Return
Performance matrix Cash flow return on investment (CFROI) Cash Value Added
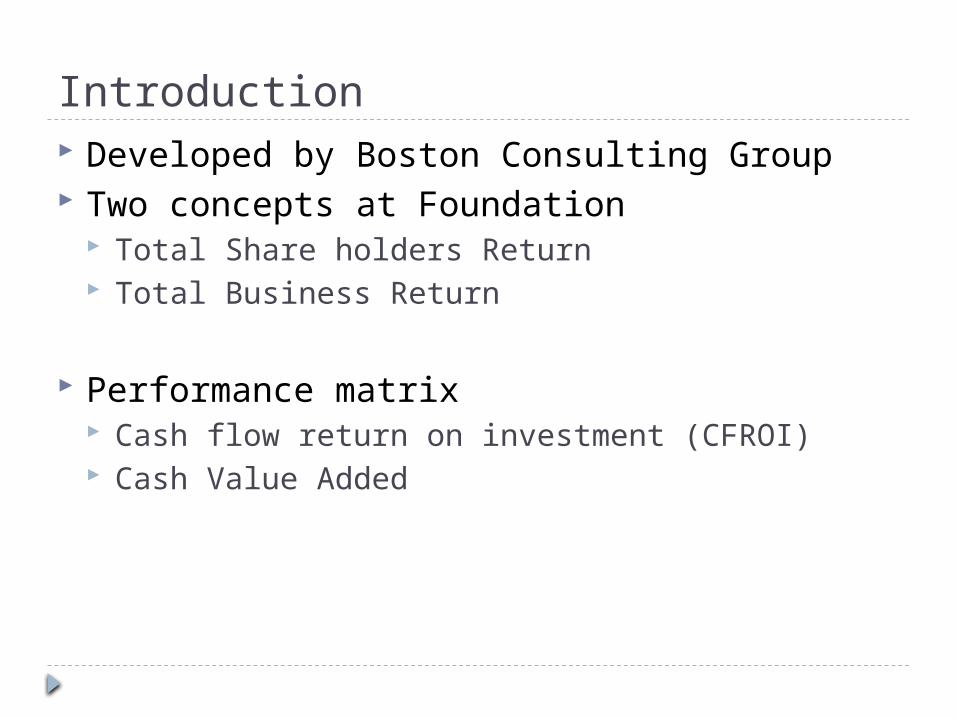
Total Share holder Return
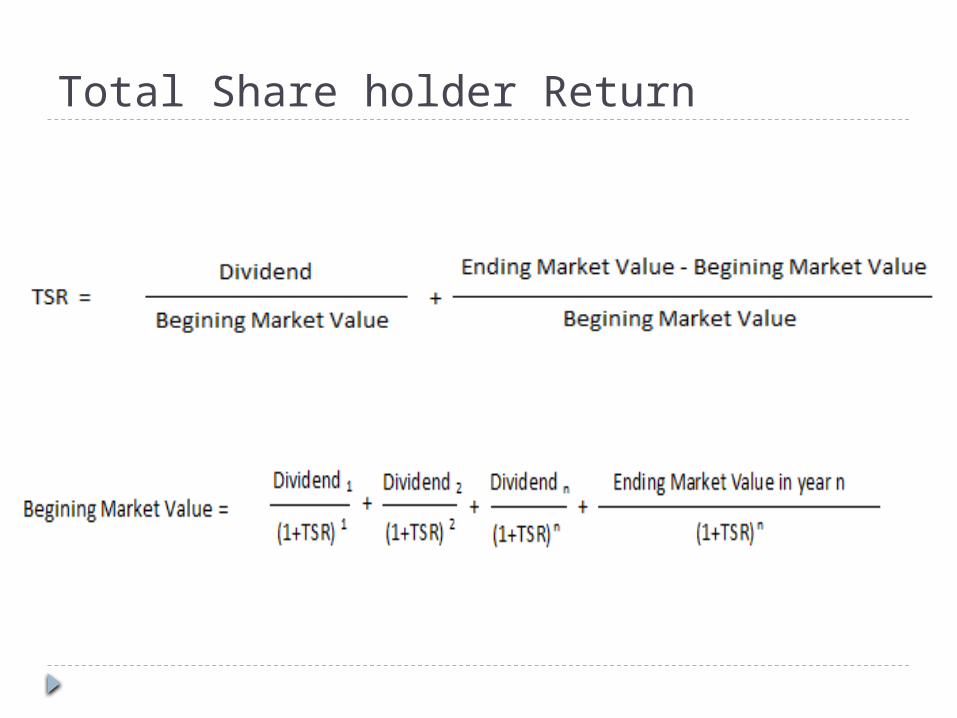
TSR, TBR and Value Drivers
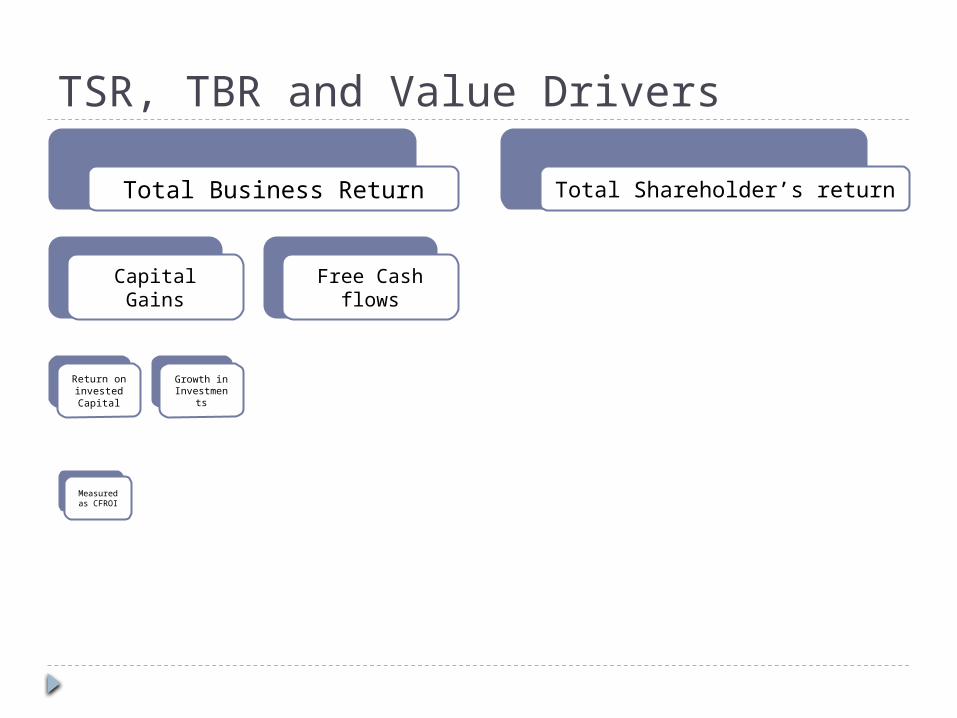
Total Business Return
Capital Gains
Return on invested Capital
Measured as CFROI
Growth in Investmen
ts
Free Cash flows
Total Shareholder’s return
Total Business Return
Value = Earnings * P/V ratioValue = Book value * M/B multipleValue = Free Cash flow / Cost of CapitalValue = NPV of expected Cash flow
Uses of TBR
Strategic Planning
Resource Allocation
Incentive Compensation

Resource Allocation Perspective
Question
High Priority for
Reinvestment
Do not Fund Question
TBR of business plan v/s target TBR
Negative 0 Positive
Positive
Negative
0Current CFROIv/sCost of Capital
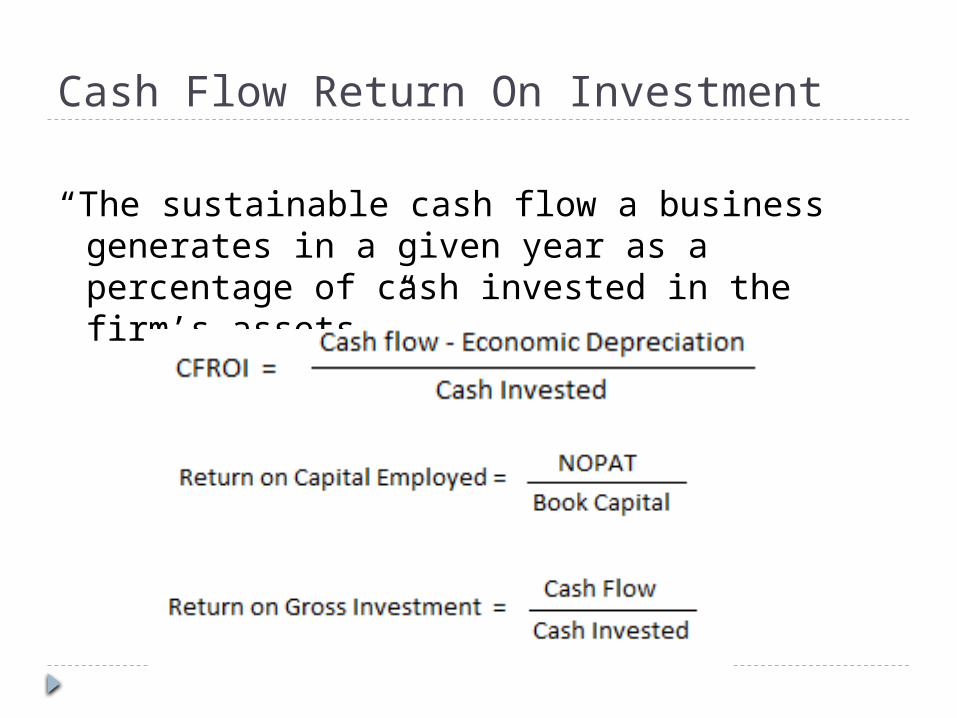
Cash Flow Return On Investment
“The sustainable cash flow a business generates in a given year as a percentage of cash invested in the firm’s assets.”
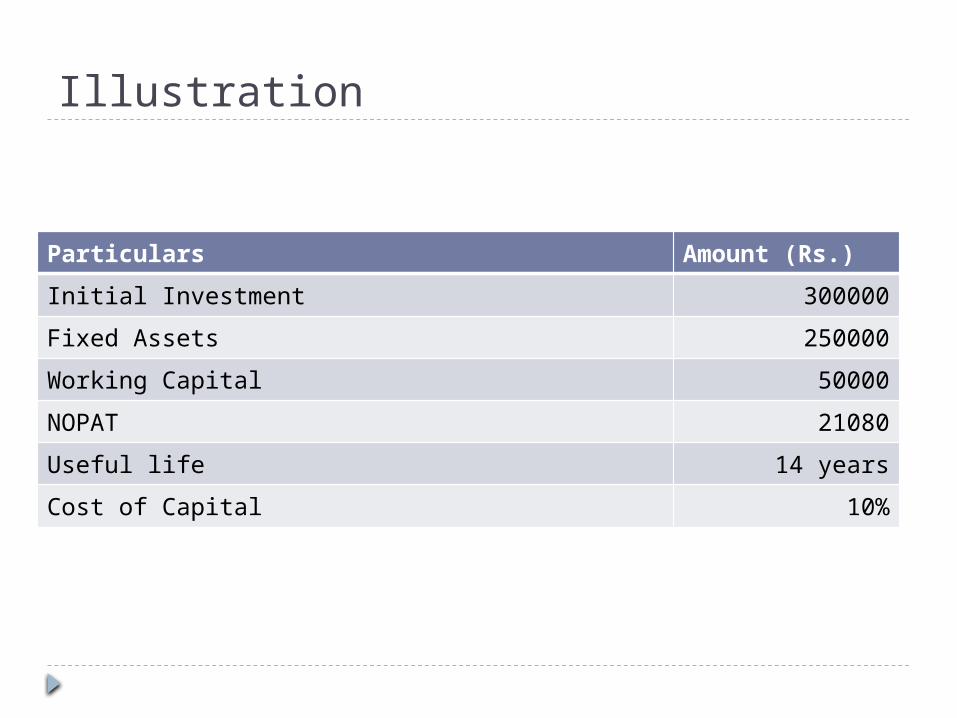
Illustration
Particulars Amount (Rs.)
Initial Investment 300000
Fixed Assets 250000
Working Capital 50000
NOPAT 21080
Useful life 14 years
Cost of Capital 10%

Annual Measurement of project
Year 1 Year 2 Year 3
NOPAT 21080 21080 21080
Depreciation 17857 17857 17857
Cash Flow 38937 38937 38937
Economic depreciation 8937 8937 8937
Sustainable Cash Flow 30000 30000 30000
Book Capital 300000 210715 103573
CFROI (%) 10.00 10.00 10.00
ROCE (%) 7.03 10.00 20.35
ROGI (%) 12.98 12.98 12.98
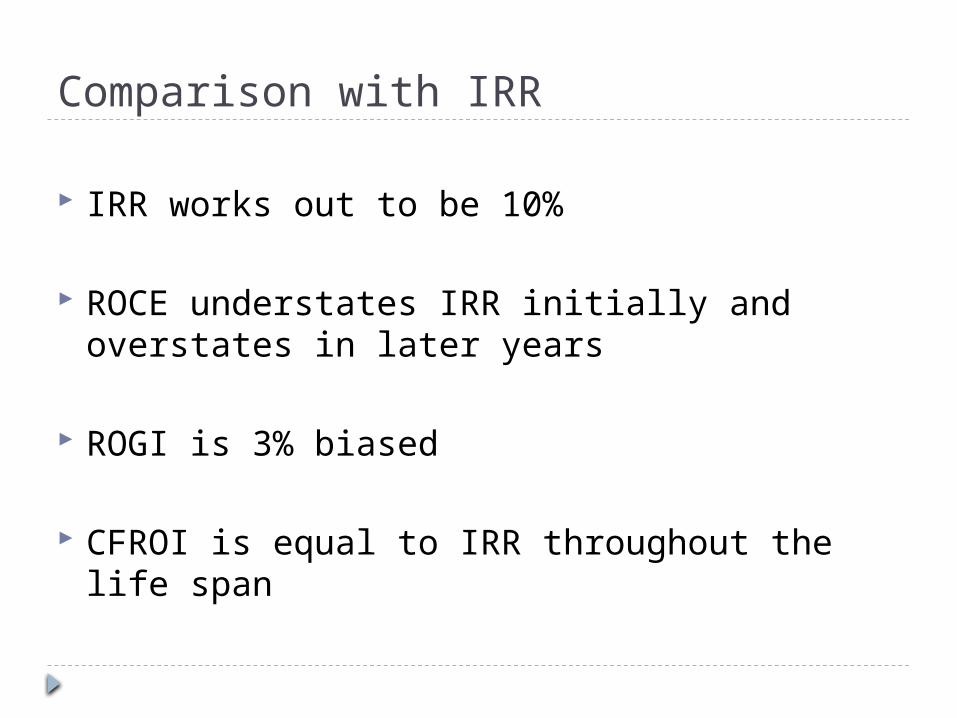
Comparison with IRR
IRR works out to be 10%
ROCE understates IRR initially and overstates in later years
ROGI is 3% biased
CFROI is equal to IRR throughout the life span
Cash Value Added
Another side showing measure of economic profit
Better measure than EVA Removes accounting distortion
CVA = Operating Cash flow – Economic Depreciation – Capital charge on Gross Investment

Comparing EVA and CVAEVA
Year 1 Year 6 Year 12
NOPAT 21080 21080 21080
Book Capital 300000 210715 103573
Capital Charge (10%) 30000 21072 10357
EVA (8920) 8 10732
CVA
NOPAT 21080 21080 21080
Depreciation 17857 17857 17857
Cash flow 38937 38937 38937
Economic Depreciation 8937 8937 8937
Cash Invested 300000 300000 300000
Cost of Capital 10% 10% 10%
Capital Charge 30000 30000 30000
CVA 0 0 0