No. 2009-10-C OFFICE OF ECONOMICS WORKING PAPER U.S. INTERNATIONAL TRADE COMMISSION Zhi Wang* William Powers* U.S. International Trade Commission Shang-Jin Wei Columbia University, CEPR, and NBER October 2009 *The authors are with the Office of Economics of the U.S. International Trade Commission. Office of Economics working papers are the result of the ongoing professional research of USITC Staff and are solely meant to represent the opinions and professional research of individual authors. These papers are not meant to represent in any way the views of the U.S. International Trade Commission or any of its individual Commissioners. Working papers are circulated to promote the active exchange of ideas between USITC Staff and recognized experts outside the USITC, and to promote professional development of Office staff by encouraging outside professional critique of staff research. Address correspondence to: Office of Economics U.S. International Trade Commission Washington, DC 20436 USA Value Chains in East Asian Production Networks— An International Input-Output Model Based Analysis
Transcript
No. 2009-10-C
OFFICE OF ECONOMICS WORKING PAPER U.S. INTERNATIONAL TRADE COMMISSION
Zhi Wang* William Powers*
U.S. International Trade Commission
Shang-Jin Wei
Columbia University, CEPR, and NBER
October 2009 *The authors are with the Office of Economics of the U.S. International Trade Commission. Office of Economics working papers are the result of the ongoing professional research of USITC Staff and are solely meant to represent the opinions and professional research of individual authors. These papers are not meant to represent in any way the views of the U.S. International Trade Commission or any of its individual Commissioners. Working papers are circulated to promote the active exchange of ideas between USITC Staff and recognized experts outside the USITC, and to promote professional development of Office staff by encouraging outside professional critique of staff research.
Address correspondence to: Office of Economics
U.S. International Trade Commission Washington, DC 20436 USA
Value Chains in East Asian Production Networks—
An International Input-Output Model Based Analysis
1
This version: October 2009.
Value Chains in East Asian Production Networks: An International Input-Output Model Based Analysis
Zhi Wang and William Powers United States International Trade Commission1
Shang-Jin Wei
Columbia University, CEPR, and NBER
Abstract
This paper extends the quantitative measures of vertical specialization proposed by Hummels, Ishii, and Yi (2001) into a framework that includes many countries based on an international input-output model. It not only distributes foreign value added in a country’s exports to its original sources, but also further decomposes domestic value added in a country’s exports into direct exports and indirect intermediate exports via third countries, thus completely slicing up the value-chain. This extended measure of vertical specialization allows us to estimate each country’s net contribution of value-added in East Asian production networks at the industry level, providing systematic quantitative evidence for the nature of East Asian value chains and their growth from 1990 to 2000. Our data include nine major economies in East Asia (Japan, China, Korea, Taiwan, Singapore, Thailand, Malaysia, Indonesia, and the Philippines) plus the United States. Our results show that East Asian developing economies became more deeply integrated into the East Asia production network in the 1990s. This integration is indicated by both a dramatic increase in the developing-country share of value added in final goods supplied by East Asia to the United States, and by an increase in their indirect value added embodied in exports via other Asian countries. We also report interesting heterogeneity in the value chain across sectors. The electronics industry has the most integrated global production network, with value shares becoming more evenly distributed among East Asian economies in the period. In contrast, wearing apparel became more concentrated in Asian developing countries, with a shift in value-added away from industrialized Asian countries and the rest of the world between 1990 and 2000. The automobile industry experienced less change in the period; production still mainly involved Japan and Korea in 2000, with developing Asia just starting to show up in the chain. JEL Classification Numbers: F1, C67, C82
We are grateful for helpful comments and suggestions from Kei-Mu Yi.
1 The views in the paper are those of the authors and are not the official views of the USITC or of any other organization that the authors are or have been affiliated with.
2
I. Introduction
World production has become increasingly fragmented. Global supply chains for
many products stretch across many countries, with each country specializing in a particular
stage of a good’s vertically integrated production sequence. While such production networks
exist in Europe and North America (such as between Germany and Hungary/Czechoslovakia
and within NAFTA), the ones in East Asia have been more dynamic and have become a
more substantial component of the economies in the region. Fragmented trade along vertical
integrated production networks has been at the heart of the growth in trade among East Asian
countries in recent decades. One can not really explain manufacturing activities and
international trade patterns in East Asia without understanding these production networks.
There is a sizable literature demonstrating the growing importance of fragmentation-
based specialization for economic growth and structural transformation in East Asian
economies. For example, by decomposing East Asian countries’ machinery trade statistics at
six-digit HS level for 1990, 1996 and 2000 into one-way trade, horizontal and vertical intra-
industry trade, Ando (2006) found that the explosive increase in trade of machinery parts and
components is largely due to the expansion of back-and-forth transactions in vertically
fragmented cross-border production processes, and he showed that international production
sharing became an essential part of each East Asian economy in the 1990s. Using parts and
components trade as a proxy for fragmentation, Athukorala and Yamashita (2006) found that
the dependence on this new form of international specialization is proportionally larger in
East Asia than in North America or Europe.
There are three major shortcomings in existing analyses of production networks in
East Asia based solely on trade data. First, in the presence of production fragmentation,
goods will be counted multiple times in trade data if they cross multiple national borders
before being embodied in the final products, so trade statistics can report a multiple of the
value of final goods. Therefore, using gross trade statistics to calculate the structure of
exports can lead to inaccurate conclusions about the relative importance of specific trading
regions and the technological sophistication of a country’s exports (Athukorala, 2003).
Second, as noted by Hummels, Ishii, and Yi (2001), analyses based on intermediate goods or
parts and components trade have to rely on rather arbitrary classifications of goods into final
and intermediates. Finally and most importantly, none of these existing trade-statistics-based
3
analyses is able to capture the source of value-added or quantify the contribution of each
country to the total product value created in the production network. These methods thus fail
to provide systematic evidence quantifying the nature and growth of value chains in East
Asian production networks.
This paper extends quantitative measures of vertical specialization proposed by
Hummels, Ishii, and Yi (2001), referred to as HIY in the subsequent discussion, into a
framework that includes many countries based on an international input-output model. This
extended measure allows us to estimate each country’s net contribution to value-added in
East Asian production networks at the industry level, thus providing systematic quantitative
evidence for the nature and growth of value chains in the region. Our estimates show that
East Asian developing economies (including China and the ASEAN-4 countries of Indonesia,
Malaysia, and the Philippines, and Thailand) became more deeply integrated into regional
production networks, as indicated by the dramatic increase of their share of value-added in
final goods that East Asia shipped to the United States, although Japan and the newly
industrialized NIE-3 (Singapore, Taiwan, and Korea) continued to dominate some networks.
At the sector level, the sectors of East Asia exports with the highest foreign content (lowest
domestic value-added) in 1990 were dominated by natural resource and labor intensive
products such as petroleum, apparel, and leather products. By 2000, although the domestic
content for the natural resource based sectors still remained low because of the scarcity of
natural resources in these economies, capital- and skill-intensive industries (electronics and
shipbuilding) replaced the most labor-intensive industries at the top of the list.
There is a large literature that uses international input-output (IO) tables to estimate
the effect of final demand changes on value-added in production. However, it is relatively
rare to use an international IO table to evaluate the growth of vertical specialization and to
slice up value-added along an international supply chain.
The only related paper that we are aware of is Pula and Peltonen (2009).2 They
estimate the dependence of each country’s value-added (GDP) on domestic, intra-East Asia
and extra-regional demand based on their updated aggregate Asian input-output table, and
2 In addition, Koopman, Wang, and Wei (2009) is a companion paper to this current paper focusing on Chinese value chains. Further discussion of Koopman, Wang, and Wei appears in section 3.
4
conclude there is no support for view that Asian supply chains have decoupled from global
networks, although they find that emerging Asia is less “coupled” with the rest of the world
than is suggested by gross trade statistics. These authors do not connect their results to HIY’s
measure of vertical specialization, however, and they do not conduct any analysis at the
industry level.
Another related line of work focus on measuring value-added embedded in
international trade, which removes double-counting in gross trade and tracks the value-added
produced in each country to the final destination where that value-added is consumed
(Johnson and Noguera, 2009; Daudin, Rifflart, and Schweisguth, 2008). Using input-output
tables and bilateral trade data from the Global Trade Analysis Project (GTAP) database,
these authors refine the HIY measure of the domestic content of exports, and examine the
difference between gross and value-added trade flows to study patterns of production sharing
across countries. They find that gross trade statistics can give misleading impressions of both
the location of final demand and patterns of international supply. Unlike the current paper,
however, most of their analyses are devoted to aggregate trade patterns and they do not
address the issue of how vertical specialization in global production networks should be
quantified.
The rest of the paper is organized as follows. In section 2, we start with HIY’s
measure of vertical specialization, discuss its implicit assumptions and shortcomings when
used to estimate value added in a production network with many countries, and then specify
our new value-chain measures for global production networks in two-, three-, and many-
country cases. In section 3 we describe our major data sources and present our estimates of
the total value chain in East Asian production networks in 1990 and 2000, including
characteristics and growth trends in value chains by major markets and major industries.
Section 4 concludes the paper with a brief discussion of its limitations and directions for
future improvements.
5
II. Value Chain in Global Production Network: Concepts and Measurement
2.1 Concepts
In their seminal paper, HIY (2001) discussed two ways in which a country can
participate in vertical specialization: a country can use imported intermediate inputs to
produce exports, or it can export intermediate goods that are used as inputs in goods exported
by another country. Based on a single country non-competitive type input-output model
(implicit in their paper), HIY derived VS as measure of the value of imports embodied in a
country’s exports, and VS1 as measure of the value of exported goods that are used as
imported inputs to produce other countries’ exports. A complete picture of vertical
specialization or a county’s position in a vertical integrated production network involves both
measures. However, VS1 is more difficult to measure than VS, because it requires matching
bilateral trade flow data to the input-output tables of all destinations to which the country
under consideration exports. Further, although HIY developed a precise definition for their
VS measure in mathematical terms, they did not do the same for their VS1 measure, because
correctly calculating VS1 requires the existence of a third country in the model.3
Two key assumptions are needed for the HIY’s measure to work. First, the intensity
in the use of imported inputs must be the same whether goods are produced for export or for
domestic final demand. This assumption is violated when processing exports are pervasive
due to policy incentives, as in China and Mexico, and exported goods use much greater share
of imported intermediate inputs. When data on processing trade are utilized, one can relax the
first assumption. Koopman, Wang, and Wei (2008) provide a methodology to re-compute
domestic and foreign value added in such cases.4
The second key assumption is that all imported intermediate inputs must contain
100% foreign value added.5 That is, there can be no indirect domestic content in a country’s
imports. The second assumption generally does not hold because, by the nature of production
fragmentation, any given country’s exports could contain imported inputs from many other
3 Yi (1999) noted that on the import side, vertical specialization is just a subset of intermediate goods—it is those intermediates that are used to make goods for export—while on the export side, vertical specialization can include both final goods and intermediate goods. Hence, HIY’s VS1 concept is closely related to, but distinct from, trade in intermediate goods. 4 This paper has not incorporated information on processing trade, which is the subject of ongoing work. Limitations are addressed in the empirical results in section 3. 5 This is equivalent to the assumption that the first exporting country’s exports have to be 100% domestically sourced when computing VS1 in the HIY framework.
6
countries, including from itself. For example, computer parts imported by China could very
well contain Chinese domestic value if other countries imported Chinese parts, processed
them, and subsequently exported them back to China. In fact, a key phenomenon behind
fragmentation is that countries increasingly link sequentially to produce final goods. Such a
multiple-border-crossing, back-and-forth aspect of trade is what HIY intended to use VS and
VS1 to measure. Obviously, a measure which combines VS and VS1 and also captures any
domestically sourced content embodied in a country’s imported intermediate inputs (such as
our VAS matrix described in the next section) will be more consistent with the back-and-
forth nature of trade that much of the anecdotal and case study evidence suggests has risen
dramatically in recent decades.
Data from a world input-output table permit the relaxation of the second assumption.
In our view, an international supply chain can be seen as distribution of value-added share
among countries (regions) in a particular global industry. Within the supply chain, each
producer purchases inputs and then adds value, which is included in the cost of the next stage
of production. The sum of the value added by every stage in the chain equals the value of
final goods produced by the network. To precisely define such chains across many countries
one needs to quantify the contribution of each country (region) to the total value-added
generated in the process of supplying final products. In this regard, a world input-output table
provides the best available information, allowing us to completely slice up the value chain
across all related countries at the industry average level.6
In detail, a world input-output table would contain a number of sub-matrices that have
information on (a) transaction flows of intermediate products and final goods within and
between each country in the world at the industry level, (b) the direct value-added of each
industry in all countries, and (c) the gross output of each industry in all countries. In other
words, the world IO table not only provides the origin and destination of all transaction flows
by industry, but also specifies every intermediate and/or final use for all such flows. For
example, the Asian IO table describes not only the number of electronics produced in China
that were shipped to the United States, but also the number that were used as intermediate 6 There are also product-level approaches to estimating the financial value embedded in a product and quantifying how the value is distributed among participants in the supply chain, moving from design and branding to component manufacturing to assembly to distribution and sales (Dedrick, Kraemer, and Linden, 2008).
7
inputs in each U.S. sector and the number that were used for U.S. private household
consumption and capital formation. Similarly, the tables provide the information on the
amount of steel used as intermediate inputs in Japan’s motor vehicle industry, and also have
information on which part of the world this steel comes from. Since this type of IO table
matches bilateral trade-flow data to input-output relations and includes more detailed
source/destination, supply/use information than a single country IO table, it is more suitable
for measuring production fragmentation and vertical specialization.
In the next four sub-sections, we will use an international input-output model to
illustrate how value added along a multi-country production chain can be decomposed into
the sum of each participating country’s net contributions. We will combine the VS and VS1
concepts proposed by HIY(2001) and extend them, in both plain English and mathematical
terms, to a framework that includes many countries, thus providing a better and more precise
measure of the nature and growth of value chains (vertical specialization) in global
production networks. To present the major concepts and show the difference between the
HIY measures and the new measures developed in this paper clearly, we start from two- and
three-country cases and then extend to a world with many countries.7
2.2 Two-country case
Assume a two-country (home and foreign) world, in which each country produces N
differentiated tradable products that can be consumed directly or used as intermediate inputs.
Let Xr denote the N by 1 gross output vector of country r, Yr the N by 1 final demand vector
including domestic final demand in r and exports of final goods from r, and Asr the N by N
input-output coefficient matrix, giving intermediate use in country r of goods produced in s.
Then the two-country production and trade system can be written in block matrix notation as
follows:
, (1)
7 The authors are very grateful for the constructive discussion with Dr. Kei-Mu Yi at the Federal Reserve Bank of Philadelphia in developing the two- and three-country cases and the relationship between our new measures of vertical specialization and the original HIY measures.
⎥⎦
⎤⎢⎣
⎡⎥⎦
⎤⎢⎣
⎡=⎥
⎦
⎤⎢⎣
⎡⎥⎦
⎤⎢⎣
⎡−−−−
=⎥⎦
⎤⎢⎣
⎡−
2
1
2221
12112
11
2221
12112
1
YY
BBBB
YY
AIAAAI
XX
8
where Bsr denotes the N by N block Leontief inverse, which is the total requirement matrix
that gives the amount of total output in producing country s required for a one-unit increase
in final demand in country r. As final and intermediate goods are distinguished by country of
use, we can write
⎥⎦
⎤⎢⎣
⎡
++++
=⎥⎦
⎤⎢⎣
⎡21222
22
1211111
2
1
EYXAEYXA
XX
, (2)
where ⎥⎦
⎤⎢⎣
⎡
++++
=⎥⎦
⎤⎢⎣
⎡
++
=⎥⎦
⎤⎢⎣
⎡211112
21
12222112
21121
12212
21
12
)()(
YxxAYxxA
YXAYXA
EE
and Esr denotes the N by 1 vector of exports (both intermediate and final goods) from s to r.
Equation (2) decomposes each country’s production and exports. It shows that there
are three components in each country’s gross exports. For country 1, these consist of the
following: (i) final goods consumed in the foreign country (Y12); (ii) intermediate goods used
to produce final goods consumed in the foreign country ( )2212 xA ; and (iii) intermediate
goods used by the foreign country to produce final goods shipped back and consumed in the
home country ( )2112 xA .
It can be shown that in the two-country case, the blocks of the total requirement
matrix are equal to the following (see Appendix for the derivation): 1
211
22121111 ))()(( −−−−−= AAIAAIB (3) 1
121
11212222 ))()(( −−−−−= AAIAAIB (4) 1
22121122121
11112 )()( −− −=−= AIABBAAIB (5)
11121221121
122221 )()( −− −=−= AIABBAAIB (6)
Let Vs be the 1 by N direct value-added coefficient vector. Each element of Vs is
equal to one minus the intermediate input share from all countries, which is the share of
direct domestic value added in total output. Based on the input-output coefficient adding-up
condition,
V1 = (u – uA11 – uA21) and V2 = (u – uA12 – uA22) (7)
9
These equations are sufficient to define our basic measure of vertical specialization in a
production network as
⎥⎥⎦
⎤
⎢⎢⎣
⎡=
⎥⎥⎦
⎤
⎢⎢⎣
⎡⎥⎦
⎤⎢⎣
⎡= 21
22212
212
21121
12111
210012
222212121111E VAS_WWP
EBVEBVEBVEBV
EE
BVBVBVBV
, (8)
where VAS is a 2 by 2N matrix. Although rather elementary with only two countries, the
product of VAS and the export matrix expresses all major concepts of our vertical
specialization measures.
Diagonal elements of VAS define the domestic value-added share in a unit of each
country’s exports. Off-diagonal elements give the shares of foreign value-added embodied in
a unit of each country’s exports, which correspond to the HIY VS and VS1 measures. It is
easy to show that the sum along each of the 2N columns of VAS is unity:
uBVBVBVBV =+=+ 222121212111 . (9)
uAAIAAIAAIAAAIA
AAIAAIAAIAA
AAIAAIAAI
BAAIAAIBAAIBVBV
=−−−−−−−+=
−−−−−+
−−−−−=
−−−+−−=+
−−−−
−−−−
−−
−
121
1221211
121
12212211121
121
1221211
121
1221221
121
12212112111
11211
222212112111212111
))())(())((
))())(())((
))()((
))(()(
Therefore, the home country's total gross exports can be decomposed into domestic
value-added (DV) and foreign value-added (VS) as follows: 121
211
221211112
1111 ))()((_WWPDV EAAIAAIVEBV −−−−−== (10)
and
12121
122121121
1221221
121121
12212
121121
12222
121121
1222212
12212
1
))())(()((
)())((
))((_WWPVS
EAAIAAIAAIAA
EBAAIAEBAAIAI
EBAAIAAIEBV
−−−
−−
−
−−−−−=
−−−−=
−−−==
(11)
Using the same notation, VS as defined by HIY (2001, page 80, equation 3) can be
expressed as
⎥⎦
⎤⎢⎣
⎡
−−
=⎥⎦
⎤⎢⎣
⎡⎥⎦
⎤⎢⎣
⎡
−−
=−
−
−
−
2112212
1211121
21
12
12212
11121
)()(
00
)()(
VS_HIYEAIuAEAIuA
EE
AIuAAIuA
(12)
10
As shown by KWW (2008), domestic value-added (DV) in a country’s exports is the
mirror of VS in HIY’s single country framework, and can be defined as:
⎥⎦
⎤⎢⎣
⎡
−−
=⎥⎦
⎤⎢⎣
⎡⎥⎦
⎤⎢⎣
⎡
−−
=−
−
−
−
211222
121111
21
12
1222
1111
)()(
00
)()(
DV_HIYEAIVEAIV
EE
AIVAIV
(13)
Comparing equation (11) to (12) and equation (10) to (13), we can see that the HIY
measures accurately capture value added in trade only when A12=0 or A21=0, which means
that only one country can export intermediate products that are used in the other country’s
production process. As we will see throughout this section, whenever two or more countries
export intermediate products, the HIY measures diverge from the true measures of value
added in exports.
For example, when both countries export intermediate goods, the total domestic
value-added in home’s exports has to take into account the value-added embodied in
intermediate goods that are exported to the foreign country, used to produce final goods
abroad, and then shipped back and consumed at home. The term
211
2212 )( AAIA −− (14)
in equation (10) is the quantitative measure of such an adjustment for each unit of gross
exports from the home country. This term is equal to the HIY measure of VS for the foreign
country, A12 (I-A22)-1, which represents the imported content of the foreign country’s exports,
multiplied by A21, the direct IO coefficient matrix of foreign inputs used in home production.
This product equals the amount of home country intermediate input returned from abroad
that was used to produce one unit of final goods in the foreign country.
The HIY measure of foreign vertical specialization (VS) is subject to further
adjustment when both countries export intermediate goods. In equation (11), as above, an
adjustment must be made to domestic intermediate input use to include the domestic content
embedded in goods imported from abroad. A second adjustment must be made to imported
intermediate use (i.e., matrix A21) because home’s imports of its own intermediate goods
embodied in the foreign country’s exported final goods should not counted as imported
foreign content. The adjustment term is exactly the same as term (14).
11
The second HIY measure of value added in international supply chains is VS1, which
measures the value of exports that are used as intermediate inputs to produce other countries’
exports. Although HIY never define their VS1 measure mathematically, VS1 can be
specified precisely based on our measures of vertical specialization in VAS. In a two-country
world, the home country’s VS1 measure can be defined as
211
22121
211
2212111
2112212111
21121
1
)())()((
)(_WWPVS1
EAIAAAIAAIV
EAIABVEBV−−−
−
−−−−=
−== (15)
The equation has two parts. First, 2112212 )( EAIA −− is the home country’s intermediate
exports embodied in the foreign country’s exports, or the foreign country’s imported content.
Second, 121
12212111 ))()(( −−−−− AAIAAIV is the domestic value-added share of the home
country’s exports (see equation 10), including both intermediate and final goods. Therefore,
the product of these two terms equals domestic value-added embodied in the home country’s
intermediate goods exported to the foreign country and used by the foreign country as inputs
to produce its exports. It measures the indirect domestic value-added embodied in the foreign
country's exports, which must equal the domestic content of the home country's imports in a
two-country world.
2.3 Three-country case:
While the two-country case illustrates the basic concept of our value-chain measures
and their relationship to HIY’s original measures, additional insights emerge when a third
country is added to the framework. Using similar notation as in the previous sub-section, we
can specify the production and trade system of the three-country world as follows:
YAIYYY
AIAAAAIAAAAI
XXX
1
3
2
11
333231
232221
131211
3
2
1
)( −
−
−=⎥⎥⎥
⎦
⎤
⎢⎢⎢
⎣
⎡
⎥⎥⎥
⎦
⎤
⎢⎢⎢
⎣
⎡
−−−−−−−−−
=⎥⎥⎥
⎦
⎤
⎢⎢⎢
⎣
⎡
(16)
⎥⎥⎥
⎦
⎤
⎢⎢⎢
⎣
⎡
++++++
=⎥⎥⎥
⎦
⎤
⎢⎢⎢
⎣
⎡
333333
222222
111111
3
2
1
EYXAEYXAEYXA
XXX
(17)
12
where ⎥⎥⎥
⎦
⎤
⎢⎢⎢
⎣
⎡
+++++++++
=⎥⎥⎥
⎦
⎤
⎢⎢⎢
⎣
⎡
+++
=⎥⎥⎥
⎦
⎤
⎢⎢⎢
⎣
⎡
32232
31131
23323
21121
13313
12212
3332
2321
1312
3
2
1
YXAYXAYXAYXAYXAYXA
EEEEEE
EEE
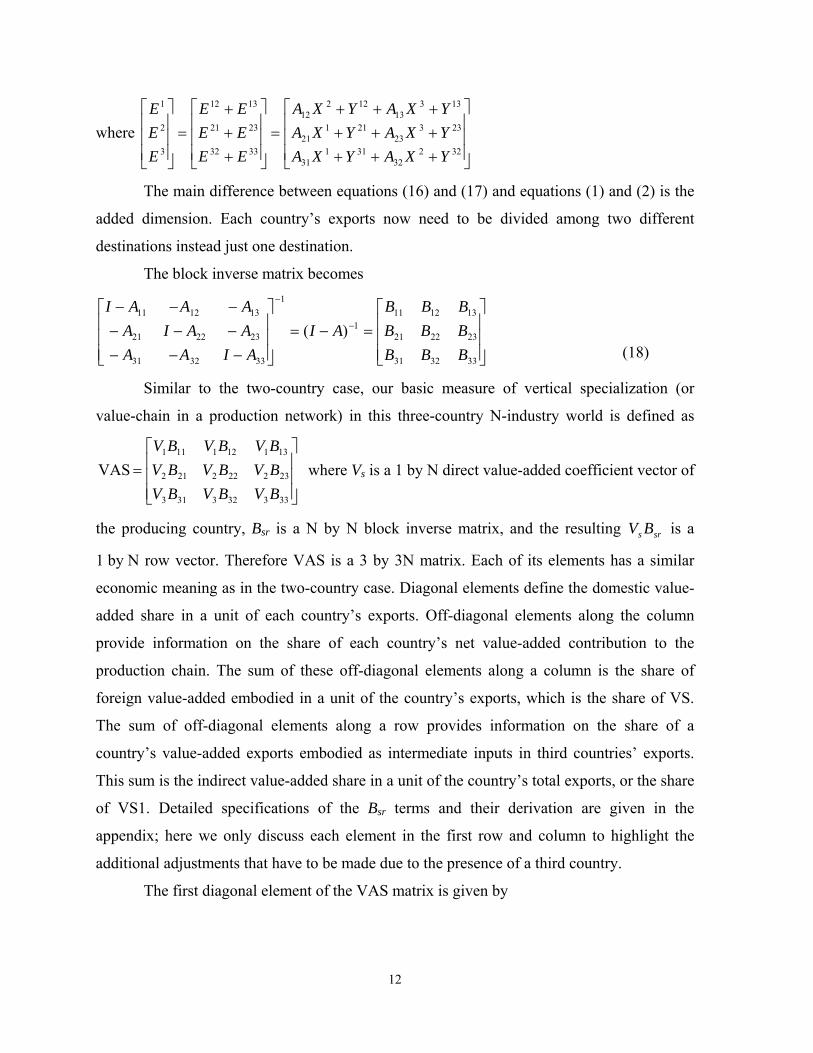
The main difference between equations (16) and (17) and equations (1) and (2) is the
added dimension. Each country’s exports now need to be divided among two different
destinations instead just one destination.
The block inverse matrix becomes
⎥⎥⎥
⎦
⎤
⎢⎢⎢
⎣
⎡=−=
⎥⎥⎥
⎦
⎤
⎢⎢⎢
⎣
⎡
−−−−−−−−−
−
−
333231
232221
1312111
1
333231
232221
131211
)(BBBBBBBBB
AIAIAA
AAIAAAAI
(18)
Similar to the two-country case, our basic measure of vertical specialization (or
value-chain in a production network) in this three-country N-industry world is defined as
⎥⎥⎥
⎦
⎤
⎢⎢⎢
⎣
⎡=
333323313
232222212
131121111
VASBVBVBVBVBVBVBVBVBV
where Vs is a 1 by N direct value-added coefficient vector of
the producing country, Bsr is a N by N block inverse matrix, and the resulting srs BV is a
1 by N row vector. Therefore VAS is a 3 by 3N matrix. Each of its elements has a similar
economic meaning as in the two-country case. Diagonal elements define the domestic value-
added share in a unit of each country’s exports. Off-diagonal elements along the column
provide information on the share of each country’s net value-added contribution to the
production chain. The sum of these off-diagonal elements along a column is the share of
foreign value-added embodied in a unit of the country’s exports, which is the share of VS.
The sum of off-diagonal elements along a row provides information on the share of a
country’s value-added exports embodied as intermediate inputs in third countries’ exports.
This sum is the indirect value-added share in a unit of the country’s total exports, or the share
of VS1. Detailed specifications of the Bsr terms and their derivation are given in the
appendix; here we only discuss each element in the first row and column to highlight the
additional adjustments that have to be made due to the presence of a third country.
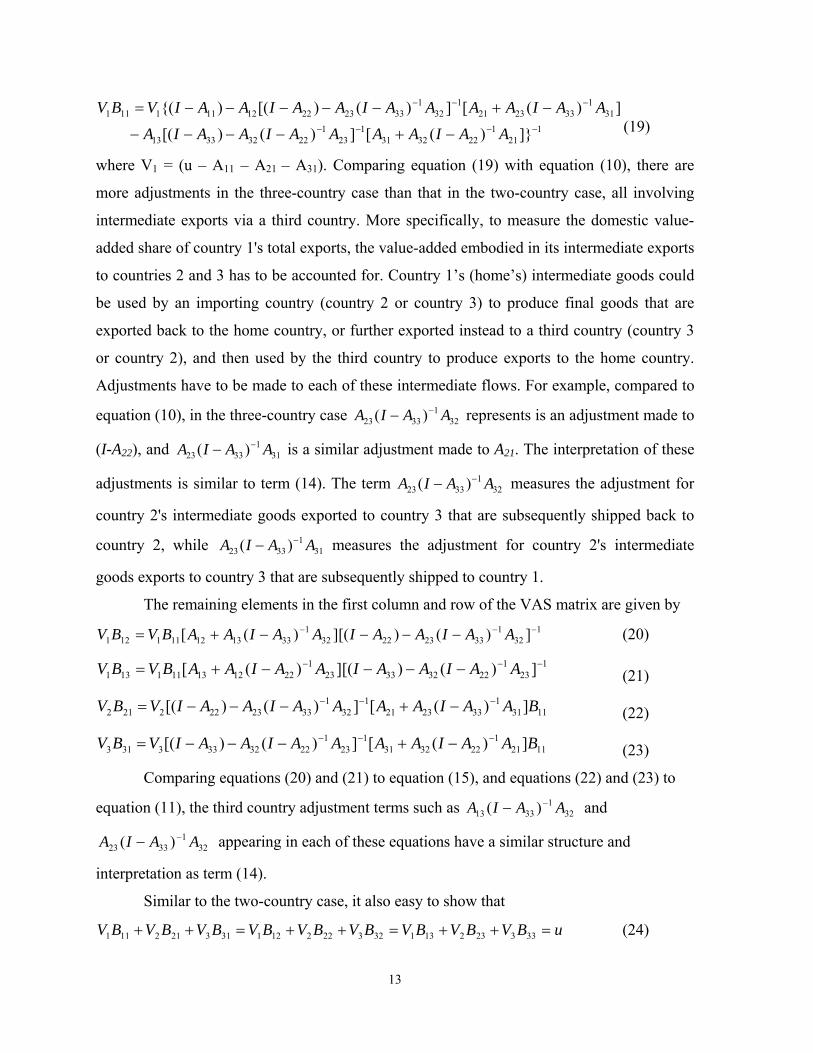
The first diagonal element of the VAS matrix is given by
13
121
1223231
123
122323313
311
3323211
321
33232212111111
]})([])()[(
])([])()[(){(−−−−
−−−
−+−−−−
−+−−−−−=
AAIAAAAIAAIA
AAIAAAAIAAIAAIVBV(19)
where V1 = (u – A11 – A21 – A31). Comparing equation (19) with equation (10), there are
more adjustments in the three-country case than that in the two-country case, all involving
intermediate exports via a third country. More specifically, to measure the domestic value-
added share of country 1's total exports, the value-added embodied in its intermediate exports
to countries 2 and 3 has to be accounted for. Country 1’s (home’s) intermediate goods could
be used by an importing country (country 2 or country 3) to produce final goods that are
exported back to the home country, or further exported instead to a third country (country 3
or country 2), and then used by the third country to produce exports to the home country.
Adjustments have to be made to each of these intermediate flows. For example, compared to
equation (10), in the three-country case 321
3323 )( AAIA −− represents is an adjustment made to
(I-A22), and 311
3323 )( AAIA −− is a similar adjustment made to A21. The interpretation of these
adjustments is similar to term (14). The term 321
3323 )( AAIA −− measures the adjustment for
country 2's intermediate goods exported to country 3 that are subsequently shipped back to
country 2, while 311
3323 )( AAIA −− measures the adjustment for country 2's intermediate
goods exports to country 3 that are subsequently shipped to country 1.
The remaining elements in the first column and row of the VAS matrix are given by 1
Therefore, in the three-country case we can define related measures of vertical specialization
in a way similar to that in two-country case. Total domestic value-added embodied in
country 1's exports is given by
1
1111_WWYDV EBV= (25)
This includes direct value-added exports to country 2 and 3 as well as indirect value-added
exports via country 2 to country 3 and indirect value-added exports via country 3 to country
2. Domestic value-added embodied in the home country’s imports from country 2 and
country 3 are included as part of this indirect value-added export in our new measure.
Foreign value added embodied in the home country’s exports is given by
1
3131
2121_WWYVS EBVEBV += (26)
Indirect domestic value-added exports via third countries is given by
3
1312
1211 _WWYVS1 EBVEBV += (27)
This measures the value-added embodied in a country's intermediate exports used to produce
a third country's exports that are returned to the home country or sent to other destinations.
Multiplying the VAS matrix by a country’s exports at different aggregations, such as
a country’s total exports or its exports to a particular destination, as weights, we can obtain
total and indirect domestic value added as well as each country’s value added contribution to
the production network at different levels. For example, at the most aggregate level
(28)
is a 3 by 3 matrix, which provides a complete picture of how value-added is generated
geographically for each country's total exports, where
⎥⎥⎥
⎦
⎤
⎢⎢⎢
⎣
⎡
++
+=
⎥⎥⎥
⎦
⎤
⎢⎢⎢
⎣
⎡
=3231
2321
1312
3
2
1
000000
000000
EEEE
EE
EE
EE is a 3N by 3 matrix.
We could obtain a similar measure for value added in goods exported from countries 2 and 3
to country 1 by focusing on only bilateral exports. This approach also works when exports
are disaggregated by sector, an approach we will use in the empirical section below.
⎥⎥⎥⎥
⎦
⎤
⎢⎢⎢⎢
⎣
⎡
=3
3332
3231
313
3232
2222
1212
3131
2121
1111
EBVEBVEBVEBVEBVEBV
EBVEBVEBV
EVAS
15
2.4 Many countries After working through the two- and three-country cases and gaining an understanding
of all the relevant concepts and measures of vertical specialization, let us now move from
theory to the real world with many countries. Without loss generality, assume there are G
countries, with N industries in each country. The production in each sector in any country
can potentially use intermediate inputs from any sector (including its own) from any country.
Assuming a predetermined location of production that defines the structure of the global
economy, the deliveries of goods and services between countries are determined by
imbalances between supply and demand inside the different countries. A world IO table is a
comprehensive account of annual product and payment flows within and between countries.
We use the following notation to describe the elements of the world IO table (expressed in
annual values): rix = Gross output of industry i in country r; r
iv = Direct value added by
production of industry i in country r; srijz = Delivery of good i produced by country s and
used as an intermediate by sector j in country r; and sriky = Delivery of good i produced in
country s for final use in final demand type ‘k’ in country r. The total number of final
demand types, such as private consumption or gross capital formation, is H. Then the
following two accounting identities describe the relationship among elements of each row
(i, r) and column (j, s) of the international IO table:
x =yz ri
srik
H
=1k
G
s
srij
N
j=1
G
s
11∑∑∑∑
==
+ (29)
x =vz sj
sj
N
i
rsij
G
r
+∑∑== 11
(30)
The two equations have straightforward economic meanings. A typical row in
Equation (29) states that total gross output of commodity i in country r is equal to the sum of
all deliveries to intermediate and final users in all countries (including itself) in the world.
Equation (30) defines the value of gross output for commodity j in production country s as
the sum of the values from all of its (domestic plus imported) intermediate and primary factor
inputs. Equations (29) and (30) must hold for all i, j ∈ N, k ∈ H and s, r ∈ G in each year.
16
Define rrj
rrij
xzrr
ija = as the direct input coefficients of domestic products of country r,
rrj
srij
xzsr
ija = s≠r as intermediate input/output coefficients of good i produced in source country
s for use in sector j by destination country r; and sj
sj
xvs
jav = as each sector j’s ratio of direct
value added to gross output for each producing country s. Using matrix notation, equations
(29) and (30) could be re-written as:
YAIY
Y
AIAAI
AAI
X
X
GGGG
ss
G
G
1
11
1
1111
)(:...
::...
: −
−
−=⎥⎥⎥
⎦
⎤
⎢⎢⎢
⎣
⎡
⎥⎥⎥
⎦
⎤
⎢⎢⎢
⎣
⎡
−−−
−−=
⎥⎥⎥
⎦
⎤
⎢⎢⎢
⎣
⎡
(31)
where A is a NG by NG square matrix with G2 number of N by N block submatrices. It
shows inter-industry input/output coefficients not only within each country, but also across
all of the countries. There is no qualitative difference between equation (31) and equation
(16). The only difference is their dimensions. Therefore, all the concepts and measures
constructed in the previous sub-section could be straightly extended to current section.
Although the analytical solution for the block matrix inverse is too complicated when the
number of countries exceed three, we can define each element in the block inverse matrix B
as srB ][ srjib= where the superscripts s and r denote source and destination country
respectively, and subscripts i and j denote the use and supply industry respectively. Let us
further define [ ]sn
sj
ss avavavV LL1= as a 1 by GN vector of direct value-added.
Then we can define our basic measure of value added in a global production network as a G
by GN matrix
⎥⎦
⎤⎢⎣
⎡==
⎥⎥⎥
⎦
⎤
⎢⎢⎢
⎣
⎡= ∑
=
N
j
srji
sj
sri
GGGGG
sss
G
bavvasBVBV
BVBVBV
11
11111
][....
::....
VAS (32)
Each of its elements is the column sum of the product between a value-added coefficient and
a total requirement coefficient, where industry i in destination country r represents the using
industry, and industry j in source country s represent the supply industry. The direct value-
added coefficient is from the producing industry j used in source country s. Intuitively, this is
the same as pre-multiplying the Leontief inverse by the direct value-added ratio and
summing over the columns (industries) for each bilateral transaction in every country and
17
industry, so we obtain the value-added generated directly and indirectly in one unit of final
product for each industry in each country. The value-share contributed from all countries for
a particular industry equals unity.
Similar to the three-country case, we can define the domestic value-added share in the
corresponding source country’s total exports as:
Share of ∑
∑∑
∑=
==
=
=== N
i
si
N
j
si
ssji
sj
N
iN
i
si
si
ssi
s
sssss
e
ebav
e
evasuE
EBVDV
1
11
1
(33)
which are the diagonal elements of the VAS matrix weighted by the structure of the source
country’s exports. Please note ∑≠
=G
rs
sri
si ee .
The diagonal elements of the VAS matrix capture domestically produced intermediate
inputs in gross output of country r at the second, third, fourth, and subsequent stages before
they become embodied in final goods delivered to other countries. Diagonal elements also
capture the domestic value added embodied in intermediate exports to a third country used to
produce subsequent exports of final goods. As before, the domestic value-added share based
on HIY (i.e., one minus HIY’s VS share) will underestimate domestic value added by
neglecting both domestic value-added embodied in home’s imports and indirect exports via
indirect intermediate exports to third countries.
The foreign value-added share in the source country’s total exports becomes
Share of ∑∑
∑∑∑
∑∑
∑∑
=≠
==≠
=≠
≠≠ === N
i
sri
G
rs
N
j
sri
srji
sj
N
i
G
rsN
i
sri
G
rs
sri
G
rs
sr
s
ssrs
G
rss
e
ebav
e
evas
uE
EBVVS
1
11
1
(34)
which is the sum of the off-diagonal elements of the source country column in the VAS
matrix weighted by the source country’s export structure. The off-diagonal elements in a
column (for all r≠s, holding the destination country r constant) in the VAS matrix capture
imported intermediate input from source country s in output of destination country r at the
second and subsequent stages before it becomes embodied in final goods imported by
destination country r. Therefore, the sum over source country s is similar to the VS measure
proposed by HIY without the assumption that imported intermediates are 100% foreign
18
sourced. This revised VS measure also decomposes the foreign value-added embodied in
direct exports of country s to destination country r into each of its original source countries.
The indirect value-added share of total exports from source country s due to
intermediate exports that are exported as final goods by third countries (VS1) becomes
Share of ∑∑
∑∑∑
∑∑
∑∑
=≠
==≠
=≠
≠≠ === N
j
sri
G
rs
N
j
sri
srji
sj
N
i
G
srN
i
sri
G
sr
G
sr
sri
sr
s
rsrs
G
srs
e
ebav
e
evas
uE
EBVVS
1
11
1
1 , (35)
which is the sum of the off-diagonal elements of the source country row in the VAS matrix
weighted by the export structure of each country (excluding the source). Just as our modified
VS measure provides a way to further decompose VS into all source countries, our modified
VS1 measure provides a way to further decompose each country’s value-added trade into
direct and indirect value-added exports to the final destination.
These measures could also be defined at disaggregate level, for each source or
destination country and for each industry. For example, for a particular industry
Share of si
N
j
si
ssji
sj
si
ssis
i e
ebav
evas
DV∑=== 1 (36)
Share of ∑
∑∑
∑
∑
≠
=≠
≠
≠ == G
rs
sri
N
j
sri
srji
sj
G
rsG
rs
sri
G
rs
sri
si
e
ebav
e
vasVS 1 (37)
At a disaggregate level, however, VS1 may not be expressible as a share of a
country’s exports at that detailed level, since the country may not have direct exports of the
particular sector or direct exports to a particular partner country. If a sector had zero direct
exports but positive indirect value-added exports via third countries, the share of VS1 in
exports would be infinite.
Obviously, our basic value chain measure, VAS, is an extension of HIY’s vertical
specialization measures (VS and VS1) to G countries. It includes both domestic value-added
shares (along the diagonal) and foreign value-added share from and to all other countries,
thus combining VS and VS1 in a consistent framework. The detailed distribution of foreign
value added in a country’s direct and indirect exports to a destination country revealed by
19
this systematic measure will enable us to quantify each country's position in the production
chain. In addition, it relaxes the unrealistic assumptions that imported intermediate inputs
have 100% foreign content and that only a single country exports intermediate products,
which are necessary for the HIY measures to empirically measure value-added trade.
2.5 Many countries, but only a subset of countries have an input-output table
World IO tables that include all countries are rare because of the tremendous data
requirements in their compilation and the differing statistical classifications among countries.
Many developing countries do not even have national IO tables. Available tables such the
Asian international IO table usually cover only a select set of economies and treat other
countries in the rest of the world as exogenous regions. To estimate value chain measures
based on such a table, the model specified in the previous section has to be modified.
Dividing the G countries into a set of M endogenous and another set of G-M
exogenous countries, the model specified by equations (29) and (30) becomes:
x =eyz ri
G
MGs
sri
srik
H
=1k
M
s
srij
N
j=1
M
s
11∑∑∑∑∑−===
++ (38)
x =vmz rj
rj
N
i
srij
G
MGs
N
i
srij
M
s
++ ∑∑∑∑=−=== 111
(39)
where srie = exports of product i from endogenous country s to exogenous country r in the
rest of the world.; srijm = imports of product i used in sector ‘j’ in an endogenous country r
from an exogenous country s in the rest of the world.
This modified international IO model is sometimes referred to as an “Inter-Regional
IO model” (IRIO) in the input-output literature. The computation of VAS in such model is
similar to equations (31) and (32) with a different dimension of related matrixes. (For
instance, the dimensions of matrix A and the Leontief inverse B reduce to NM by NM with
M2 number of N by N blocks).
To estimate the value-added contribution from exogenous countries in the rest of the
world (which does not have an input-output table), we need to assume imported intermediate
inputs from the G-M exogenous countries are 100% foreign sourced, similar to HIY. Then
the contribution of value added share from the G-M exogenous countries in each of the N
industry is computed as follows:
20
10 )( −−= AIMVSS (40)
where VSS is a G-M by N(G-M) matrix, with each row giving the contribution of value-
added share from a corresponding exogenous country to each of the N industries.
⎥⎥⎥
⎦
⎤
⎢⎢⎢
⎣
⎡
=
+
G
M
M
MM
0
10
0
000000
O
oM is also a diagonal block matrix of G-M by N(G-M) whose diagonal blocks are 1 by N
row vectors ][ roj
ro mM = , where each element r
ojm is the column sum of the direct import
coefficients for the corresponding exogenous country. In other words, rr uMM =0 where
Mr = [msrij] is an N by N import coefficient matrix and u is a 1 by N vector of ones.
Intuitively, the amount of imports from the rest of the world required directly and indirectly
by one unit of final demand (including exports to rest of the world) can be obtained by pre-
multiplying the Leontief inverse by the imported intermediate IO coefficient matrix. The column sums of VAS and VSS always equal one by the adding up condition of
the revised IO model, which says that the column sum of domestic input/output coefficients,
import input/output coefficients, and the direct value-added ratio for each industry in each
endogenous country has to equal unity.
III Characters and Changing Patterns of Value-Chain in East Asia Production Network
3.1 Data Source
Our main data source is the Asian international Input-Output tables (AIO). The AIO
is compiled by the Institute of Development Economies (IDE), a public research institute
affiliated with the Ministry of Economics, Trade, and Industry of Japan in collaboration with
national statistical institutions in eight other Asian economies (China, Indonesia, Korea,
Malaysia, the Philippines, Singapore, Taiwan, and Thailand) plus the United States. It
provides the origin and destination of all transaction flows within and across these ten
economies at the industry level, and includes trade flows with Hong Kong and the rest of the
world. It specifies intermediate and/or final use for all such flows. The table is available for
1990 and 2000. The 2000 table separates the EU15 from the rest of the world.
21
Sixty-four sectors, including 36 non-food-processing manufacturing sectors, are
common to the 1990 and 2000 tables after concordance. Final demand in the AIO has four
components (i.e., H=4), including private consumption, government consumption, gross
domestic fixed capital formation, and change in inventories. Direct value-added in the AIO
includes wages and salaries, operating surplus, gross fixed capital formation, and indirect
taxes less subsidies.
3.2 East Asia Manufactured Products sold at U.S. Markets
3.2.1 Domestic and foreign contents
To illustrate how the measures developed in the previous section can be used to
systematically quantify the nature and growth of a global production network, we computed
these measures for manufactured goods exported to the United States from the nine East
Asian countries included in the AIO. Table 1a reports results for 1990 and 2000 for aggregate
manufacturing exports (not including food).8 Columns (2) and (3) report the current dollar
value of exports from each of the nine East Asian economies in 1990 and 2000, and the share
of intermediate exports in the total. In 2000, the median intermediate export share was 52.9%
(Malaysia). The four countries with the highest share of intermediate goods exports that year
are Korea (63.55), Philippines (61%), Singapore (60%), and Taiwan (62%). It is noteworthy
that China’s share is the lowest in Asia. Indeed, comparing 2000 with 1990, China stands out
as the only country that experienced a decline in the share of intermediate in exports. By this
metric, it would appear that China’s participation in the global production chain decreased,
but it likely indicates that China moved downstream in the production chain and increased
the portion of its exports to the U.S. market that are final products. Adding credence to this
view, the shares of foreign and East Asian value added in Chinese exports rose in the period,
as we examine next.
(Insert Table 1a here)
8 A related paper, Koopman, Wang, and Wei (2009) also reports results from the AIO, focusing in particular on Chinese value-added flows. Table 5 in Koopman, Wang, and Wei reports some of the information contained in table 1a, but does not include the same breakdown of foreign value added, and more importantly, lacks the shares of value added exported through third countries to the United States.
22
The share of intermediate goods in total exports can be a misleading yardstick to
judge international integration. As noted by Koopman, Wang, and Wei (2009), the shares of
domestic and foreign content in a country’s exports may be more informative statistics; these
are reported in Columns (4) through (7) in Table 1a. The foreign content share in column (5)
exceeds 40% for Malaysia, the Philippines, Singapore, Taiwan, and Thailand in 2000. This
suggests that these economies are heavy users of imported intermediates in the production of
their exports. On the other end of the spectrum is Japan, whose foreign content is less than
10% of its exports, indicating that Japan uses relatively few foreign-sourced inputs in its own
final goods exports. After Japan, China had the second lowest estimate (23.5%) of foreign
content in its exports in 2000. This share underestimates foreign content in Chinese exports,
however, because the data do not distinguish between processing and normal exports. As
shown by Koopman, Wang, and Wei (2008), the estimated foreign content share rises to
about 50% after accounting for the high reliance on imported inputs used in processing
exports. The other Asian countries will likely require lower adjustments because they have
lower reliance on processing exports.9
The share of foreign value added from other East Asian countries in Column (6) is
another important indicator of the integration of these countries in the region’s value chains.
By this measure, East Asia became more integrated between 1990 and 2000: this share
increased in eight of the nine countries. Malaysia and Taiwan, which experienced the largest
increases in the share of foreign value added in their exports, also had the largest increases in
regional value-added shares. For China, the Philippines, and Taiwan, regional value chains
seem to have displaced some foreign inputs over the period, as the increase in the regional
value-added share exceeded the increased share of all foreign value added.
Column (7) in Table 1a reports the share of U.S. value-added that is re-exported from
the region back into the United States. U.S. domestic content was quite significant in the
period for imports from the NIE-3 and ASEAN-4 (except Indonesia). In aggregate, the role
of the United States as an intermediate inputs supplier in East Asian manufactured goods was
almost unchanged during the ten-year period. Among individual Asian countries, only
9 Japan and Singapore, for example, have low tariff rates on manufactured inputs, so the estimation errors are likely to be small, and the estimated foreign content shares in Table 1a are likely to be accurate.
23
Malaysia had a large increase in this share; Singapore, the Philippines, and Thailand had
moderate decreases.
The last measure of regional integration is reported in column (8). This column
presents our extended VS1 measure, which gives the domestic value added exported to the
United States indirectly through other East Asian countries. This measure quantifies each
East Asian country’s engagement in the Asian production network from its exports
perspective, rather than its import perspective. The export perspective also shows increasing
integration within the region in the 1990–2000 period; overall, the value of domestic value-
added exported through other countries in the region rose from 7% of regional exports to
10%. Individual countries show an interesting convergence toward the 10% average value
over the period, and China’s value decreased to a very low 4.2% in 2000, indicating that it
moved further downstream in Asian production chains supplying the U.S. market.
3.2.2 Slicing up the value chain across countries
A major advantage of international I/O tables is that they allow for further
decomposition of the foreign content of regional or country-specific exports according to
their net value-added contributions. This is done with the help of the formulas in equation
(37) for the endogenous countries and equation (40) for the two exogenous regions of Hong
Kong and the rest of the world. Koopman, Wang, and Wei (2009) present such an analysis
for individual countries.10 To prevent duplication, we present here only the decomposition of
the net value-added contribution of each country in the region’s overall exports to the U.S.
market. (Figure 1).
In general, the figure shows that developing countries have made gains at the expense
of the more advanced economies. Japan remained the most important source of value added
in the region’s exports to the United States in 2000, although Japan’s share of value added
declined by 15 percentage points between 1990 and 2000. Taiwan also lost a substantial
portion of its share of regional value added in this trade. China dramatically increased its
share by 11 percentage points in the period. For the remaining countries, small declines in the
10 They focus their discussion on China, and note several interesting patterns in the data. For example, the most significant suppliers of intermediate inputs for China’s exports to the United States include Hong Kong, Japan, and the United States. The contributions by Japan, Korea, Taiwan, and the United States increased between 1990 and 2000, while Hong Kong’s contribution declined considerably.
24
shares of more advanced economies experienced were balanced by developing country
increases. In some developing countries, such as Indonesia and Malaysia, the gains were
quite large relative to their rather small initial shares of value added.
(Insert Figure 1 here)
3.2.3 Decomposing gross and value-added manufacturing trade flows
In addition to decomposing value added shares, our methodology also breaks out
gross and value added flows from these economies to the United States. As noted in Johnson
and Noguera (2009), gross trade flows can differ substantially from value added flows in the
presence of international supply chains. Table 1b reports the decomposition of East Asian
manufacturing trade with the United States in both gross and value-added terms. Columns (2)
through (9) report dollar-value flows, and columns (10) through (13) give each country’s
trade as a share of the relevant regional total.
(Insert Table 1b here)
East Asian imports from the United States in value-added terms are close to the gross
trade values (and actually exceed gross imports from Japan, Korea, and Taiwan), indicating
that the United States has only moderate foreign value added in its exports to the region. The
importance of indirect value-added imports (as a share of the total) from the United States
nearly doubled in the period; almost 15% of U.S. value-added exports to East Asia went
through third countries in 2000.
In contrast, value-added exports to the United States are substantially smaller than
gross exports for most East Asian economies, again indicating that these economies (other
than Japan and Indonesia) use substantial amounts of foreign intermediates in the products
they send to the United States. The region’s share of value added that is exported indirectly
to the United States also rose in the decade (to 14% of the total in 2000), although this is
almost entirely due to large increases in indirect exports originating in Japan and the NIE-3.
The regional shares in columns (10) through (13) show that most countries have quite
similar shares of gross and value-added trade in imports from the United States. Because of
its limited use of foreign intermediates, Japan’s share of regional value-added exports is
higher than its share of gross exports, while the opposite is true for most other countries.
25
Changes between 1990 and 2000 highlight the relative decline in Japanese exports in both
gross and value added terms, the rapid increase in Chinese exports, and the continued
importance of Korea and Taiwan.
3.3 East Asian manufacturing exports to the U.S. market by sector
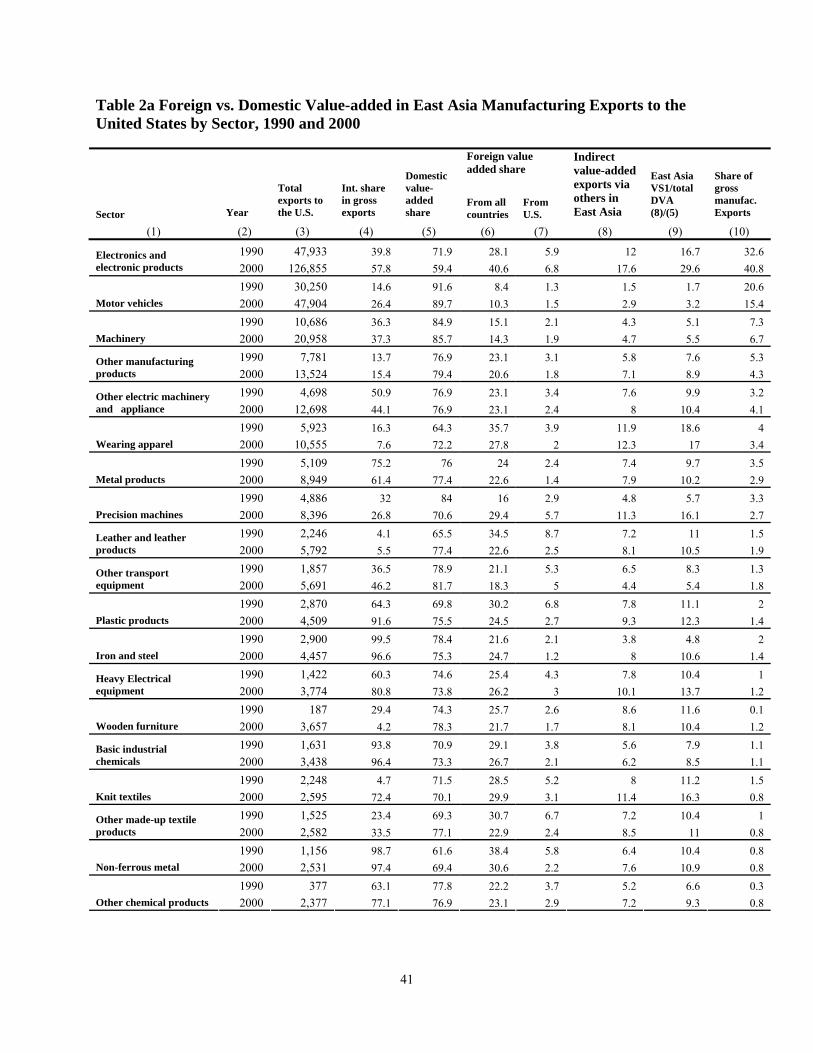
Table 2a reports our value-chain measures for final products made in East Asia sold
in the U.S. market, similar to Table 1a but broken down by major manufacturing sectors.
Sectors are ranked by their share in regional manufacturing exports to the United States in
2000 as shown in column (10). Electronics, motor vehicles, and machinery were the top three
export categories to the U.S. market in both 1990 and 2000, and constituted more than 60%
of East Asia’s total gross manufacturing exports. However, only the share of electronics
increased dramatically (from 32.2% to 40.8% of total exports), while the shares of both
motor vehicles and machinery declined. Trends in intermediate exports, foreign content, and
other value-added measures for these sectors are discussed in detail in section 3.4.
(Insert Table 2a here)
Figure 2a shows that the five sectors with the highest foreign content shares in 1990
(refined petroleum, non-ferrous metal, thread and yarn, wearing apparel, and leather
products) were dominated by natural resource and labor intensive products.11 By 2000,
although the foreign content for those natural resource based sectors remained high because
of the scarcity of natural resources in these economies, electronics and ship building replaced
the two most labor- intensive industries (apparel and leather products), indicating that either
labor costs or domestic sourcing in these sectors increased in the period.
(Insert Figure 2a here)
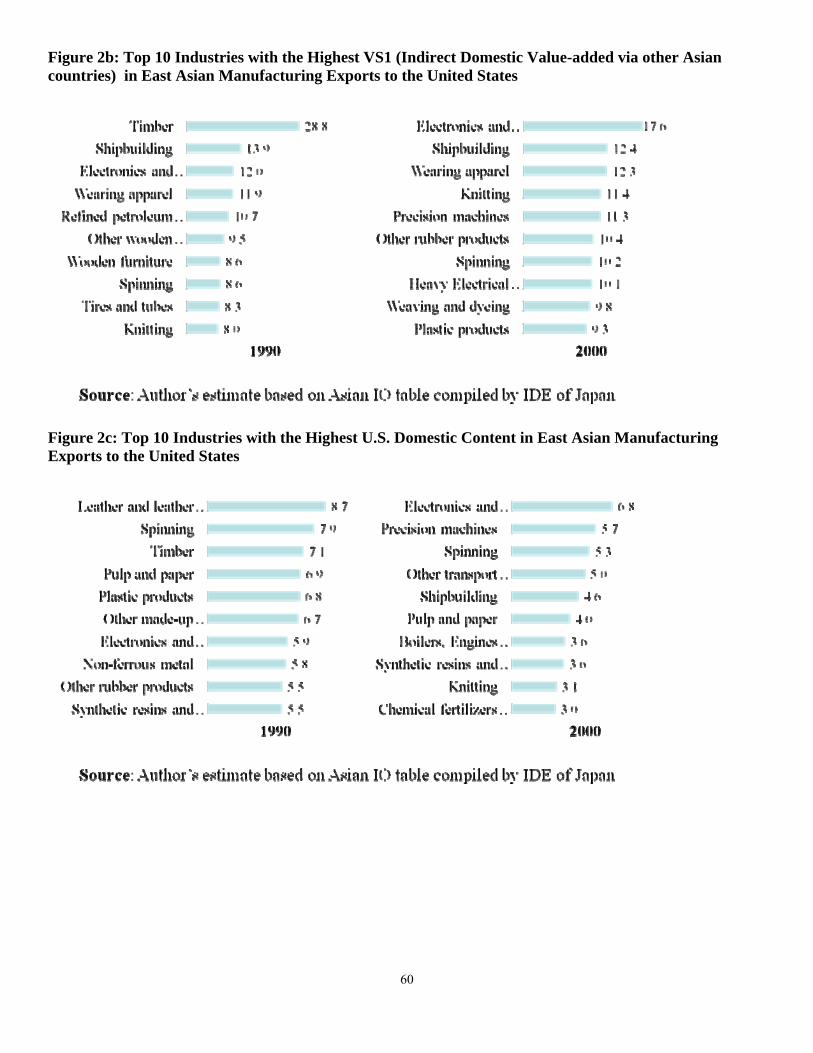
We can rank industries by the intensity of East Asian integration with their neighbors,
based on foreign value-added imports from the other eight Asian countries (revised VS) or by
domestic value-added via these countries (revised VS1). (The two measures are equal when
we aggregate East Asian economies together.) Using exports to the United States as weights,
electronics, ship building and wearing apparel were the most integrated sectors in both 1990
11 Timber is excluded from this list because it is not available in the 2000 AIO.
26
and 2000 (Figure 2b). If we rank the industries based the domestic content in exports to the
United States, however, the results are quite different in the two time periods (Figure 2c). In
1990, the top five product categories (other made-up textile products, plastic products, pulp
and paper, thread and yarn, and leather products) were all are resource-intensive sectors. By
2000, the top sectors (shipbuilding, other transport equipment, thread and yarn, precision
machines, and electronics and electronic products) were skill-intensive products, indicating
more domestic U.S. content embodied in its imports from East Asia (because high value-
added content such as product design often originates in the United States).
(Insert Figures 2b and 2c here)
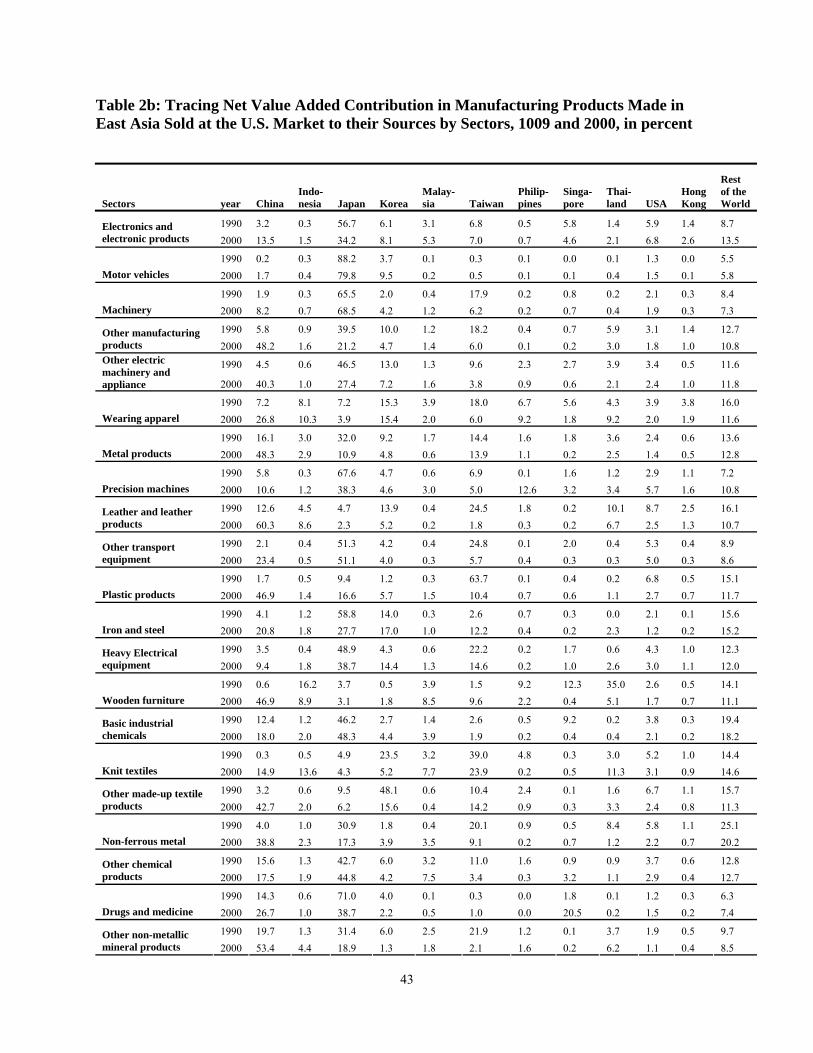
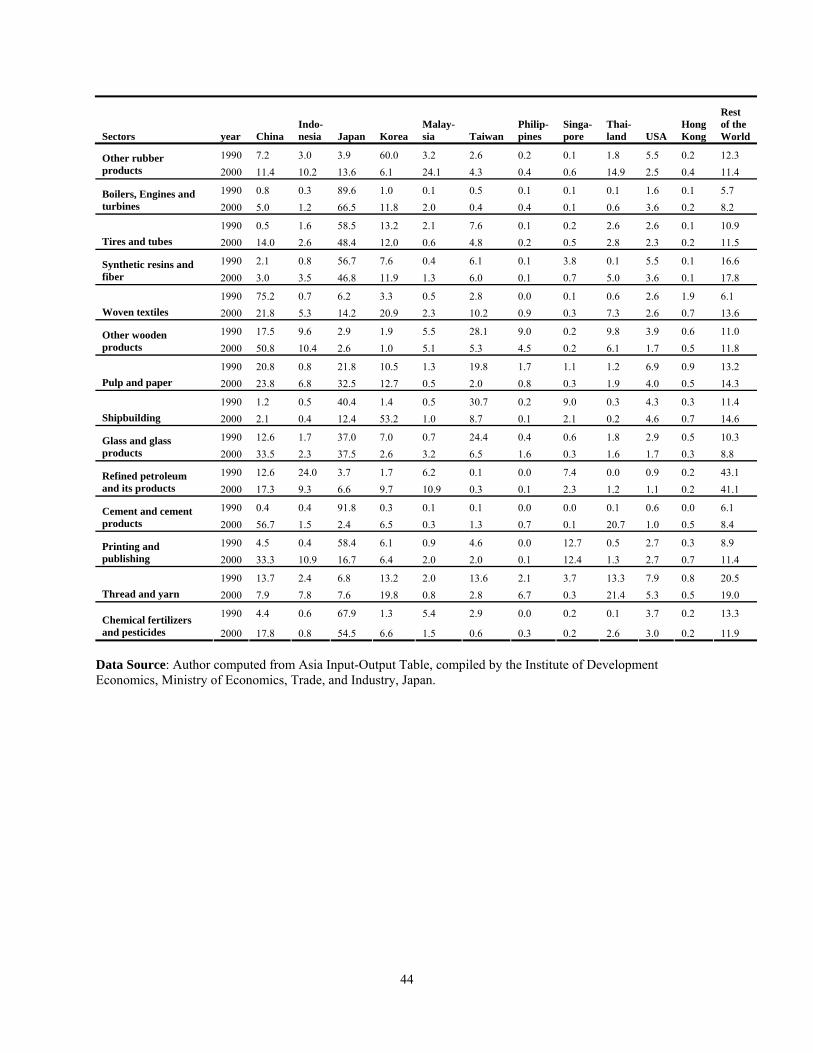
Table 2b decomposes value-added in East Asian manufacturing exports to the U.S.
market into their original contributing sources for major industries. The results demonstrate
the substantial expansion of the East Asian production network in many manufacturing
industries. Emerging East Asia became more integrated into the value-added production
processing as Japan and the NIE-3 sourced more manufacturing inputs from ASEAN-4 and
China. As a result, the net value-added contribution from Japan and NIE-3 declined in most
sectors and was replaced by China and ASEAN-4. The redistribution among Asian countries
presents an interesting contrast to the relatively stable contributions from the United States
and the rest of the world between 1990 and 2000, indicating that the vertical production
integration of manufacturing products occurred mainly within East Asia.
(Insert Table 2b here)
The most dramatic East Asian decline occurred in Japan. In 1990, Japan’s value-
added share in East Asian exports to the United States was more than 40% in 18 of the 35
industries reported in Table 2b, while it retained such a dominant position in only 9 sectors in
2000. The changing role of NIE-3 in the production chain was similar to the Japanese
experience: the net value-added contribution from Korea, Taiwan, and Singapore in East
Asian goods exported to the U.S. market exceeded 20% in 21 sectors at 1990, but the number
of such sectors declined to 10 by 2000.
In contrast, developing countries (particularly China) experienced a very rapid
increase. China’s value-added contribution exceeded 40 percent in 1990 in only one sector
(woven textiles), and was less than 10% in 23 of these industries. By 2000, China’s net
27
value-added contribution was over 40% in 10 industries, and it had less than 10% net value-
added contribution in only 7 industries. Changes in ASEAN-4 countries closely resemble to
the Chinese experience. Indonesia, Malaysia, the Philippines, and Thailand together
contributed more than 20% of net value added in only 4 industries in 1990, while the number
of such industries expanded to 9 in 2000.
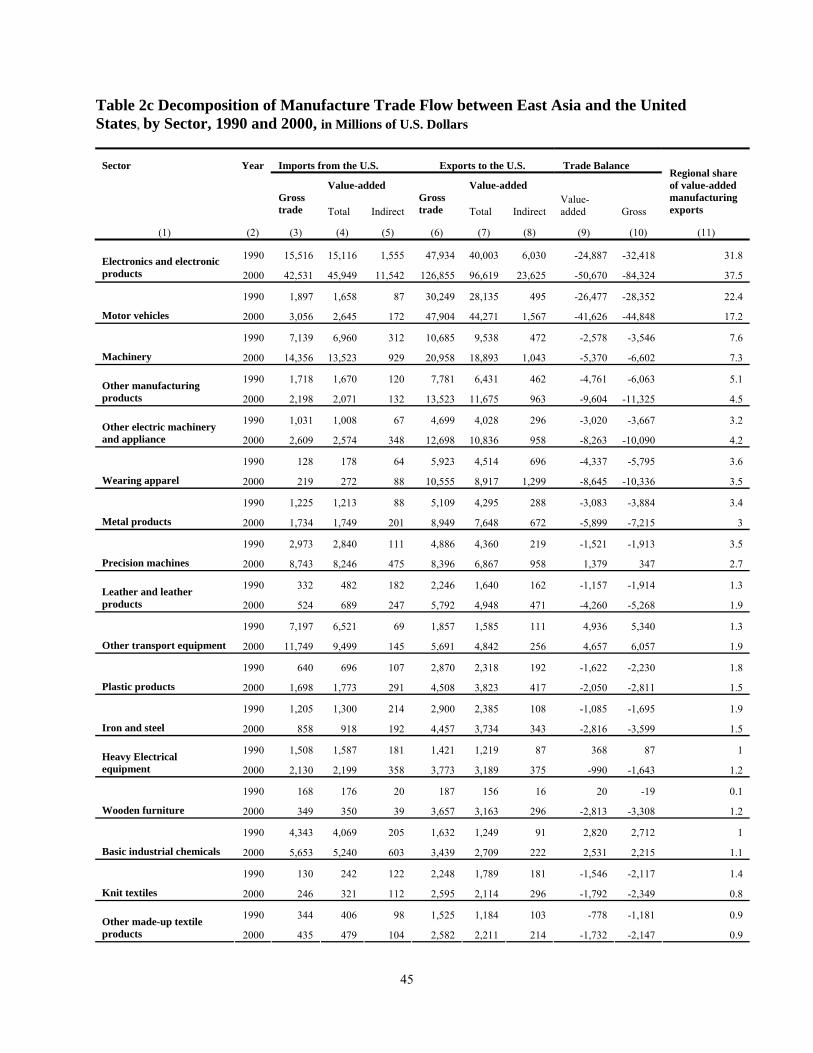
Table 2c decomposes bilateral trade flows in manufacturing sectors in both gross and
value-added terms between East Asia and the United States. Except for several resource-
based sectors such as refined petroleum and pulp and paper, the U.S. trade deficit with East
Asia is smaller in value-added terms than that in gross terms. For some skill and capital
intensive sectors, such as electronics and electronic products, the difference between the U.S.
trade deficit measured in gross terms and in value-added terms increased between 1990 and
2000 (from 23% of the gross deficit to 40%), while for some labor intensive sectors, such as
apparel, this gap diminished during the same period (from 25% of the gross deficit to 16%).
(Insert table 2c here)
3.4 East Asia manufacturing exports to the U.S. market in selected industries
To better understand the determinants of the aggregate trends and the characteristics
of value chains at the industry level, this section will examine more disaggregated results in
several selected industries. These industries include the top three sectors in Table 2b
(electronics, motor vehicles, and machinery) in addition to the apparel sector. Characteristics
of vertical specialization are presented in three tables for each sector. Table a for each sector
mirrors the aggregate breakdown in Table 1a, presenting intermediate trade as well as our
extended VS and VS1 measures for each industry. Table b for each sector further distributes
the foreign content of East Asian exports to the United States into the contributions from
each contributing economy. Table c for each sector compares each country’s trade with the
United States in gross and value-added terms.
The results show interesting heterogeneity across sectors. Although indirect value
added exports through third countries rose for all sectors, other indicators of supply chain
integration varied. The share of intermediate inputs in exports held steady in some industries
and rose in others. The share of foreign content in exports rose in some industries and fell in
28
others. One consistent factor was that the Chinese contribution increased in all selected
sectors, in some cases dramatically. Also, Japan consistently had a higher domestic value-
added share in its exports than other countries in these sectors, as it did in aggregate exports,
though the extent to which Japan dominated the supply chain varied by sector.
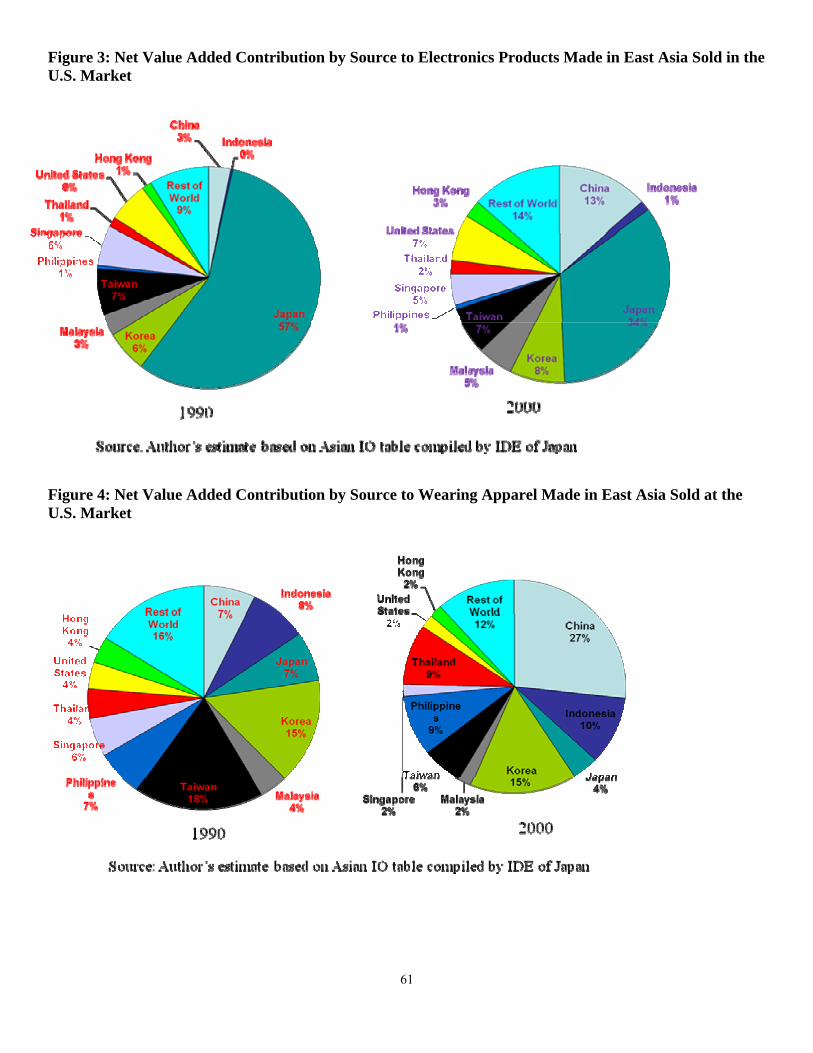
3.4.1 Electronics industry
Supply chains for electronics in the period were characterized by increasing exports
of intermediate products, a rise in the share of products indirectly exported through other
East Asian countries, and an increase in the value-added contribution from non-Asian
economies. Table 3a shows the increased integration of electronics production between East
Asia and the United States, as indicated by the dramatic increase of intermediate goods
exported from East Asia to the United States in column (4). Most East Asian economies,
except China and Indonesia, exported more intermediates than final goods to the U.S. market
in 2000. Thus the supply chain overall became more tightly integrated the United States,
while the two largest developing economies have moved further downstream in the supply
chain. Table 3a also shows that the average direct domestic value-added for each East Asian
country fell from 71.9% in 1990 to 59.4% in 2000 (column (4) minus column (8) in the
“total” row). This decline was greater than the 5.6 percentage point rise in indirect value-
added exports in the period (from 12.0% to 17.6% in column 8). In consequence, foreign
value added rose to 23.0% of the total by 2000.
Table 3b further distributes the foreign content of East Asian electronic exports to the
United States into each of its contributing economies.12 Two features are notable from the
table. One is China’s emergence as a major player in the production network and the relative
decline of Japan. China’s value-added contribution to regional final electronics products
exported to the United States increased from 3.2% in 1990 to 13.5% in 2000, while Japan’s
share declined from 56.7% to 34.2%. At the same time, all other East Asian countries except
Singapore also increased their value-added shares in the production chain, indicating China’s
rise in the East Asian electronics production chain was not crowding out its East Asian
developing neighbors, but may have actually enhanced the competitiveness and efficiency of 12 Each row represents a breakdown of the supply chain, for a given county’s exports to the United States, of all foreign countries that contribute value added to its production. For example, the first row shows that Indonesia contributed only 0.5% of the foreign content in Chinese exports to the United States in 1990.
29
the production chain as a whole. The other feature is that there is no sign of the “decoupling”
of East Asia from the rest of the world in the electronic industry. The role of United States
itself and the rest of the world in the production process actually increased in the period. By
2000, they contributed over 20% of the total value-added exports from East Asia to the U.S.
market (column (11) plus (13)), and nearly 7% of the final electronics products that the
United States imported from East Asia actually originated from U.S. domestic firms (Column
(9), table 3a).13 The high foreign content share reveals that East Asia remains deeply
integrated with the United States and the rest of the world in the production process.
Table 3c shows that Japan remained the center of value-added creation in the
production chain even as China began its rapid emergence. As with overall exports in Table
1b, Japan was the only country to have a substantially higher share of the region’s exports in
value-added terms than in gross terms (e.g., 45% via 29.3% in 2000, columns (13) and (14)).
Japan supplied higher value-added intermediate inputs to other East Asian economies, thus
indirectly exporting more domestic value-added to the U.S. electronics market through its
neighboring East Asia economies. As Japan’s share slipped in the period, though, China’s
expanded rapidly. In 1990, China’s share of the region’s exports to the United States was
only 3% in both gross and value-added terms; these shares rose in 10 years to over 11%,
catching up with the three newly industrialized economies.
(Insert tables 3a to 3c here)
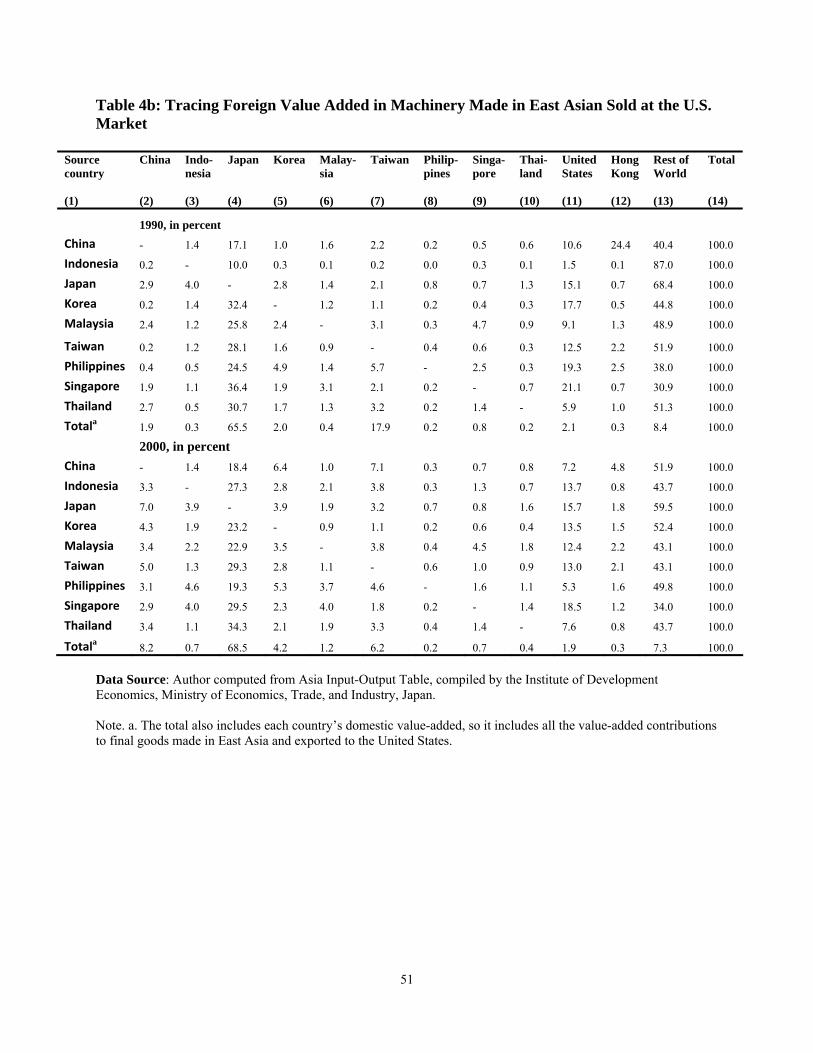
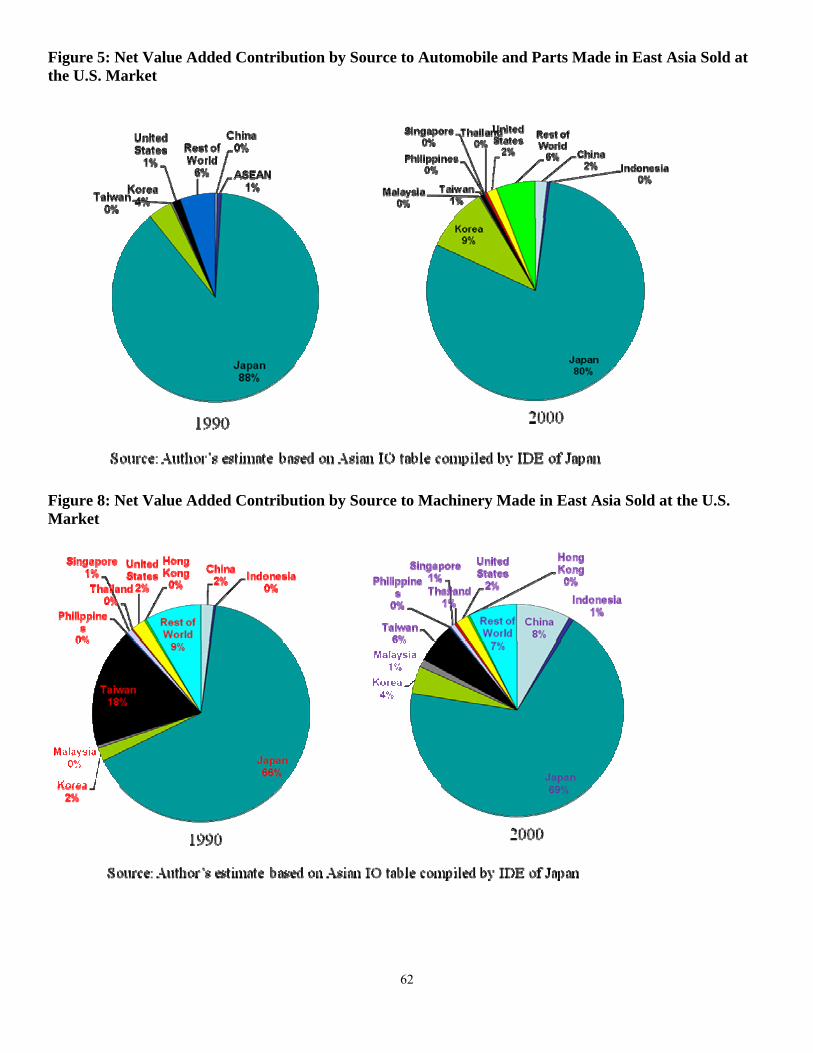
3.4.2 Machinery industry
The value chain for machinery made in East Asia and supplied to the U.S. market is
an important part of the Asian production network, but its nature and development pattern are
different from the electronics industry. Tables 4a to 4c show three special features of this
value chain: slower growth in overall integration, continued Japanese dominance in value-
added terms, and the displacement of other East Asian economies by China.
First, Table 4a shows that vertical specialization within East Asia increased very
moderately compared to the electronics industry. This slow change is indicated by the very
slight rise in the share of intermediate products trade and the very small increase in indirect
13 The overall foreign content share was 23% in 2000, as noted in Table 3a. Of this 23%, table 3b shows that Hong Kong had a minor role, contributing only 2.6% of value added.
30
value-added trade through other East Asian countries. The average domestic content of each
East Asian economy also slightly increased from 84.9% to 85.7% (Column (5) minus (6))
while the value-added contribution from economies outside Asia also slightly declined.
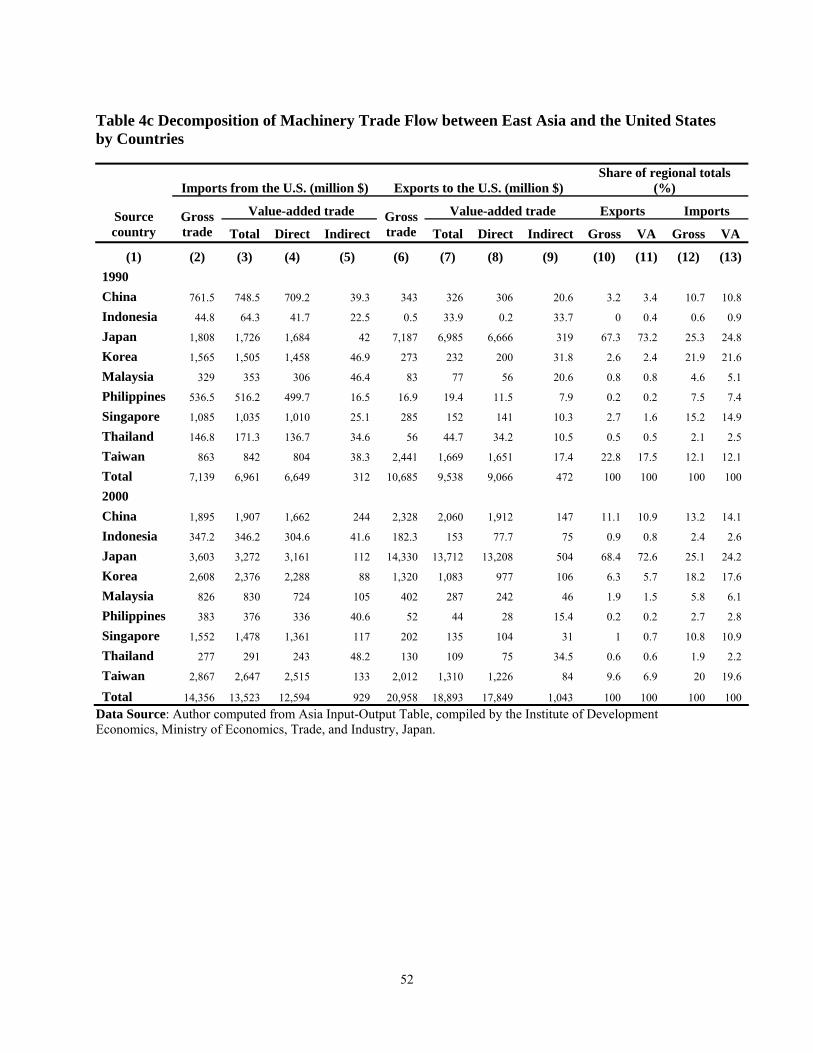
Second, the role of Japan in the production chain is similar to that in the electronics
industry, but Japan’s dominant position did not change over the ten-year period. Table 4b
shows a slight increase in Japan’s share of value added in total regional exports to the United
States. Also, similar to electronic industry, Japan was the only country with a share in value-
added exports to the United States substantially higher than its share in gross exports; but its
share of both gross and value-added exports basically stayed the same in 1990 and 2000
(column (12) and (13) in table 4c).
Finally, as in electronics, China dramatically increased its presence in the regional
value chain for machinery. China’s net value-added contribution increased from 1.9% to
8.2% (column (2) in table 4b), but in contrast to the electronics industry, China displaced
Taiwan’s position in the value chain instead of Japan’s. As noted above, Japan’s net value-
added contribution was little changed, while Taiwan’s share declined from 17.9% to 6.2%
(table 4c).
(Insert tables 4a to 4c here)
3.4.3 Wearing apparel industry
It is well known that the production network for apparel is well developed in East
Asia. However, the total value chain measures developed in this paper reveal that the
characteristics and development patterns of the apparel value chain are very different than
those of the electronic industry in East Asia. The first difference is that a very high share of
goods exported to the United States from the region are final goods (column (3) of Table
5a).14 The second major difference is that the value added for wearing apparel made in East
Asia and sold in the U.S. market is increasingly sourced within East Asian economies. The
average direct domestic value-added share increased from 64.4% to 72.2% (Column (4)
minus (6) in Table 5a), while the contribution from economies outside East Asia declined
from 19.9% in 1990 to 13.6% in 2000 (Table 5b). One similarity with electronics is the
14 The source data for 2000 incorrectly reports the intermediate share as 7,6% for all countries; this will be addressed in a future update.
31
relatively high share of indirect value-added. The indirect value-added contribution to the
value chain remained steady at about 12% (column (8) of table 5a). Variation in this share
has increased over time, as direct exports of these goods from most developed Asian
economies to the United States had shrunk considerably by 2000.
The other major trend in the apparel industry is the emergence developing economies.
The Chinese net value-added contribution increased from 7.2% in 1990 to 26.8% in 2000
(table 5b). Most of this value-added is contributed by direct exports, and China exports a
lower than average share indirectly through third countries. The ASEAN-4 contribution
increased from 23% to 30.7% in the period. China and ASEAN-4 mainly replaced
contributions from Taiwan and Singapore (their value-added shares declined by about two-
thirds) and to a lesser extent Japan. Among developed suppliers, only Korea’s contribution
stayed relatively unchanged at about 15% during the period.
(Insert tables 5a to 5c here)
3.4.4 Motor vehicle industry
Tables 6a to 6c show that the automobile production network is much less developed
in East Asia compared to the other selected industries. The network is largely concentrated
in Japan and Korea, with more limited involvement by China and Taiwan. The high and
steady average domestic content share (about 93% in table 6a) is driven by the high share in
Japan, which dominated regional automobile production in the period. Most other countries
had much lower domestic content in the period. Table 6b shows that Japan was an important
source of foreign value added for production in the other eight East Asian countries. The
integration with economies outside East Asia was relatively low compared to other
industries, with low value-added contributions from the United States and the rest of the
world (1.5% and 5.8% respectively, Table 6b).
There was some development during the 10 year period, however. First, Japan’s
contribution shrank in nearly all countries (though, as noted above, Japan’s domestic value
added in its own production remained nearly unchanged). Second, Korea sharply increased
its weight in the value chain: its share of value-added had increased from 3.7% in 1990 to
9.5% by 2000. Third, China, and other developing countries started to show up in the value
32
chain in 2000, with their contribution mainly indirectly through exports of intermediates
incorporated into Japanese and Korean automobiles sold in the U.S. market.
(Insert tables 6a to 6c here)
V. Conclusion and Direction for Future Work
In this paper, we extended quantitative measures of vertical specialization (VS and
VS1) proposed by Hummels, Ishii, and Yi into a consistent framework with many countries
based on an international input-output model. The extended measures relaxed the unrealistic
assumptions that (a) all imported intermediate inputs contain 100% foreign value added, and
(b) only one country exports intermediate inputs. Our new measures can account for back-
and forth trade in intermediates across multiple borders, which the HIY measures cannot
capture because of the single-country IO model they are based on. Our new measures not
only distribute foreign value-added in a country’s exports to its original sources, but also
further decompose domestic value-added in a country’s exports into direct value-added
exports and indirect value-added exports via third countries, thus completely slicing up the
value-chain. This decomposition further allows us to compare each country’s bilateral trade
in value-added terms to its gross trade.
Using an Asian international input-output table compiled by Japan’s Institute of
Development Economies, we applied the extended measures to estimate each East Asian
country’s net contribution of value-added in East Asian manufacturing production chains that
supply the U.S. market. Our results provide systematic quantitative evidence for the nature
and growth of East Asian value chains at the industry average level between 1990 and 2000.
Our results show that East Asian developing economies (China and ASEAN-4) became more
deeply integrated into East Asian production networks. Although Japan and the NIE-3
continued to be the largest contributors to the value chain, developing countries dramatically
increased their share of value-added contained in final goods shipped to the U.S. market, and
they also increased indirect value-added exports via neighboring countries. We also report
interesting heterogeneity of the value chain across sectors. The electronics industry is the
most dynamic and well integrated global production network; with the dramatic emergence
of China and ASEAN-4, value-added shares become much more evenly distributed among
East Asian economies in 2000 than in 1990. In contrast, automobile production still mainly
33
involved Japan and Korea in 2000, with developing Asia just starting to show up in the value
chain. The value chain for wearing apparel became more concentrated in Asian developing
countries, with value-added production shifting away from Japan, NIE-3, and the rest of the
world during the period.
The total value chain measures developed in this paper and the decomposition of
trade flows based on such measures provide useful insights for understanding the nature and
growth of value chains in global production networks. The analysis demonstrates that
international IO tables can be a valuable tool for completely slicing up the value chain and
quantifying the degree of vertical specialization along a global production network.
However, there are several limitations that should be mentioned. First, processing trade has
not been included in the total value chain measures because of limitations of the AIO.
Because processing and ordinary imports may have substantially different intensity of use of
imported intermediate inputs, ignoring this difference may result in systematic aggregation
bias that underestimates the foreign content share in gross exports. This bias can generate
inaccurate estimates of the distribution of value-added along the global production network,
particularly for the Chinese contribution. Second, the most recent AIO table available is
2000, and given the rapid changes in East Asian production and trade, especially the dramatic
impact of China joining the WTO in 2001, the data in the 2000 AIO table may be too old to
describe the current state of Asian production networks. Therefore, results reported in this
paper should be seen only as “snapshots” of the East Asian manufacturing production value
chain in 1990 and 2000. Finally, the AIO tables include only ten endogenous countries,
leaving out the EU and other important markets for final goods, forcing us to maintain the
unrealistic HIY assumptions in computing the vertical specialization in trade with the rest of
the world. To overcome all these limitations, a time series world IO table, including all major
economies in the world and all available processing trade information, has to be developed
and incorporated into our measures. This will be the next stage of our research efforts in this
area.
34
References Ando, Mitsuyo, 2006, “Fragmentation and vertical intra-industry trade in East Asia”, North
American Journal of Economics and Finance, 17:257–281. Athukorala, Prema-chandra, 2003, “ Production Fragmentation and Trade Patterns in East
Asia” Working paper No. 2003/21, Research School of Pacific and Asian Studies, Australian National University
Athukorala, Prema-chandra and Nobuaki Yamashita, 2006, “Production Fragmentation and
trade integration: East Asia in a global context” North American Journal of Economics and Finance, 17:233–256.
Dedrick, Jason, Kenneth L. Kraemer, and Greg Linden, 2008,“ Who Profits from Innovation
in Global Value Chains? A Study of the iPod and notebook PCs,” Paper presented at the Sloan Industry Studies Annual Conference, Boston, MA, May.
Daudin, Guillaume, Christine Rifflart, and Danielle Schweisguth, 2008, “Value-added Trade
and Regionalization,” Memo, OFCE, Sciences Po Paris, July. Hummels, D., J. Ishii, and K. Yi, 2001, “The Nature and Growth of Vertical Specialization in
World Trade,” Journal of International Economics 54:75–96. Johnson, Robert, and Guillermo Noguera, 2009, “ Accounting for Intermediates: Production
Sharing and Trade in Value-added,” Mimeo, Princeton University, May. Koopman, Robert, Zhi Wang and Shang-jin Wei, 2008, “How much Chinese exports is really
made in China – Assessing foreign and domestic value-added in gross exports,” NBER Working Paper 14109, June.
Koopman, Robert, Zhi Wang and Shang-jin Wei, 2009, “A World Factory in Global
Production Chains: Estimating Imported Value Added in Exports by the People’s Republic of China,” CEPR Discussion Paper in International Trade and Regional Economics, No. 7430, September.
Pula, Gabor and Tuomas Peltonen, 2009, “Has Emerging Asia Decoupled? An analysis of
production and trade linkages using the Asian International Input-Output Table,” Working paper series, No. 993, European Central Bank, January.
35
Appendix: Derivation of the block inverse
Two-country case:
By inverse matrix definition we have
⎥⎦
⎤⎢⎣
⎡⎥⎦
⎤⎢⎣
⎡−−−−
⎥⎦
⎤⎢⎣
⎡=⎥
⎦
⎤⎢⎣
⎡⎥⎦
⎤⎢⎣
⎡−−−−
II
AIAAAI
BBBB
BBBB
AIAAAI
00
2221
1211
2221
1211
2221
1211
2221
1211
Then we obtain following four equations (by right multiply)15
IBABAI =−− 21121111)( (2.1)
0)( 22121211 =−− BABAI (2.2)
0)( 11212122 =−− BABAI (2.3)
IBABAI =−− 12212222 )( (2.4)
From (2.2) and (2.3)
22121
1112 )( BAAIB −−= (2.5)
11211
2221 )( BAAIB −−= (2.6)
Substituting into (2.1) and (2.4)
121
1222121111 ))(( −−−−−= AAIAAIB (2.7)
112
1111212222 ))(( −−−−−= AAIAAIB (2.8)
Equations (2.7) and (2.8) are exactly equations (4) and (5) in session 2.
By inverse matrix definition, we also could have (by left multiply)
IABAIB =−− 21121111 )( (2.1a)
0)( 21221121 =−− ABAIB (2.2a)
0)( 12112212 =−− ABAIB (2.3a)
IABAIB =−− 12212222 )( (2.4a)
From (2.2a) and (2.3a)
15 Please note for matrix multiplication AB ≠ BA in general, while the multiplication rule for
block matrix is the same as the general matrix.
36
122121112 )( −−= AIABB (2.5a)
111212221 )( −−= AIABB (2.6a)
Substituting into (2.1a) and (2.4a) will also give us (2.7) and (2.8), but combine (2.5) and
(2.5a), (2.6) and (2.6a) we get additional relationship:
12212112212
111112 )()( −− −=−= AIABBAAIB (2.9)
11121221121
122221 )()( −− −=−= AIABBAAIB (2.10)
Equations (2.9) and (2.10) are exactly equations (6) and (7) in session 2.
Three-country case:
From the definition of inverse matrix, we have
IBABABAI =−−− 311321121111)( (3.1)
0)( 312321221121 =−−+− BABAIBA (3.2)
0)( 313321321131 =−+−− BAIBABA (3.3)
0)( 321322121211 =−−− BABABAI (3.4)
IBABAIBA =−−+− 322322221221 )( (3.5)
0)( 323322321231 =−+−− BAIBABA (3.6)
0)( 331323121311 =−−− BABABAI (3.7)
0)( 332323221321 =−−+− BABAIBA (3.8)
IBAIBABA =−+−− 333323321331 )( (3.9)
For all off diagonal block, from (3.2) and (3.3)
)()( 312311211
2221 BABAAIB +−= − (3.10)
)()( 213211311
3331 BABAAIB +−= − (3.11)
From (3.4) and (3.6)
)()( 321322121
1112 BABAAIB +−= − (3.12)
)()( 123122321
3332 BABAAIB +−= − (3.13)
From (3.7) and (3.8)
37
)()( 231233131
1113 BABAAIB +−= − (3.14)
)()( 132133231
2223 BABAAIB +−= − (3.15)
Compared to the off-diagonal block in the two-country case, an additional term associated
with the third country appears, which makes the analytical solution for diagonal block of the
Total 124 122 103 18 311 257 222 36 100 100 100 100 Data Source: Author computed from Asia Input-Output Table, compiled by the Institute of Development Economics, Ministry of Economics, Trade, and Industry, Japan.
41
Table 2a Foreign vs. Domestic Value-added in East Asia Manufacturing Exports to the United States by Sector, 1990 and 2000
Foreign value added share
Sector Year
Total exports to the U.S.
Int. share in gross exports
Domestic value-added share
From all countries
From U.S.
Indirect value-added exports via others in East Asia
Thread and yarn 2000 204 82 65 35 5.3 10.2 15.6 0.1 1990 76 89.4 79.8 20.2 3.7 3.1 3.9 0.1 Chemical fertilizers and
pesticides 2000 104 86.9 79.9 20.1 3 4.9 6.2 0 Data Source: Author computed from Asia Input-Output Table, compiled by the Institute of Development Economics, Ministry of Economics, Trade, and Industry, Japan. Note: a. in Millions of U.S. Dollars
43
Table 2b: Tracing Net Value Added Contribution in Manufacturing Products Made in East Asia Sold at the U.S. Market to their Sources by Sectors, 1009 and 2000, in percent
Data Source: Author computed from Asia Input-Output Table, compiled by the Institute of Development Economics, Ministry of Economics, Trade, and Industry, Japan.
45
Table 2c Decomposition of Manufacture Trade Flow between East Asia and the United States, by Sector, 1990 and 2000, in Millions of U.S. Dollars
Sector Year Imports from the U.S. Exports to the U.S. Trade Balance
Value-added Value-added
Gross trade Total Indirect
Gross trade Total Indirect
Value-added Gross
Regional share of value-added manufacturing exports
Data Source: Author computed from Asia Input-Output Table, compiled by the Institute of Development Economics, Ministry of Economics, Trade, and Industry, Japan. Note: a. in Millions of U.S. Dollars
47
Table 3a Foreign vs. Domestic Value-added in East Asia Electronics Exports to the U.S. Market, 1990 and 2000
Data Source: Author computed from Asia Input-Output Table, compiled by the Institute of Development Economics, Ministry of Economics, Trade, and Industry, Japan. Note: a. in Millions of U.S. Dollars
48
Table 3b: Tracing Foreign Value Added in Electronics Made in East Asian Sold at the U.S. Market
Source country (1)
China (2)
Indo-nesia (3)
Japan (4)
Korea (5)
Malay-sia (6)
Taiwan (7)
Philip-pines (8)
Singa-pore (9)
Thai-land (10)
United States (11)
Hong Kong (12)
Rest of World (13)
Total (14)
1990, in percent China - 0.5 19.3 2.2 0.8 2.3 0.1 0.4 0.2 5.9 53.2 15.2 100.0
Totala 13.5 1.5 34.2 8.1 5.3 7.0 0.7 4.6 2.1 6.8 2.6 13.5 100.0 Data Source: Author computed from Asia Input-Output Table, compiled by the Institute of Development Economics, Ministry of Economics, Trade, and Industry, Japan. Note. a. The total also includes each country’s domestic value-added, so it includes all the value-added contributions to final goods made in East Asia and exported to the United States.
49
Table 3c Decomposition of Electronic Trade Flow between East Asia and the United States by Countries
Imports from the U.S. (million $) Exports to the U.S. (million $) Share of regional totals
(%)
Value-added trade Value-added trade Exports Imports Source country
Gross trade Total Direct Indirect
Gross trade Total Direct Indirect Gross VA Gross VA
Total 42,531 45,949 34,407 11,542 126,855 96,619 72,994 23,625 100 100 100 100 Data Source: Author computed from Asia Input-Output Table, compiled by the Institute of Development Economics, Ministry of Economics, Trade, and Industry, Japan.
50
Table-4a Foreign vs. Domestic Value-added in East Asia Machinery Exports to the U.S. Market, 1990 and 2000
Data Source: Author computed from Asia Input-Output Table, compiled by the Institute of Development Economics, Ministry of Economics, Trade, and Industry, Japan. Note: a. in Millions of U.S. Dollars
51
Table 4b: Tracing Foreign Value Added in Machinery Made in East Asian Sold at the U.S. Market
Source country (1)
China (2)
Indo-nesia (3)
Japan (4)
Korea (5)
Malay-sia (6)
Taiwan (7)
Philip-pines (8)
Singa-pore (9)
Thai-land (10)
United States (11)
Hong Kong (12)
Rest of World (13)
Total (14)
1990, in percent China - 1.4 17.1 1.0 1.6 2.2 0.2 0.5 0.6 10.6 24.4 40.4 100.0
Totala 8.2 0.7 68.5 4.2 1.2 6.2 0.2 0.7 0.4 1.9 0.3 7.3 100.0 Data Source: Author computed from Asia Input-Output Table, compiled by the Institute of Development Economics, Ministry of Economics, Trade, and Industry, Japan. Note. a. The total also includes each country’s domestic value-added, so it includes all the value-added contributions to final goods made in East Asia and exported to the United States.
52
Table 4c Decomposition of Machinery Trade Flow between East Asia and the United States by Countries
Imports from the U.S. (million $) Exports to the U.S. (million $) Share of regional totals
(%)
Value-added trade Value-added trade Exports Imports Source country
Gross trade Total Direct Indirect
Gross trade Total Direct Indirect Gross VA Gross VA
Total 14,356 13,523 12,594 929 20,958 18,893 17,849 1,043 100 100 100 100 Data Source: Author computed from Asia Input-Output Table, compiled by the Institute of Development Economics, Ministry of Economics, Trade, and Industry, Japan.
53
Table-5a Foreign vs. Domestic Value-added in East Asia Wearing Apparel exports to U.S. Market, 1990 and 2000
Data Source: Author computed from Asia Input-Output Table, compiled by the Institute of Development Economics, Ministry of Economics, Trade, and Industry, Japan. Note: a. in Millions of U.S. Dollars.
54
Table 5b: Tracing Foreign Value Added in Wearing Apparel Made in East Asian Sold at the U.S. Market
Source country (1)
China (2)
Indo-nesia (3)
Japan (4)
Korea (5)
Malay-sia (6)
Taiwan (7)
Philip-pines (8)
Singa-pore (9)
Thai-land (10)
United States (11)
Hong Kong (12)
Rest of World (13)
Total (14)
1990, in percent China - 0.3 6.2 0.7 0.3 4.2 0.0 0.1 0.2 3.3 73.1 11.6 100.0
Totala 26.8 10.3 3.9 15.4 2.0 6.0 9.2 1.8 9.2 2.0 1.9 11.6 100.0 Data Source: Author computed from Asia Input-Output Table, compiled by the Institute of Development Economics, Ministry of Economics, Trade, and Industry, Japan. Note. a. The total also includes each country’s domestic value-added, so it includes all the value-added contributions to final goods made in East Asia and exported to the United States.
55
Table 5c Decomposition of Wearing Apparel Trade Flow between East Asia and the United States by Countries
Imports from the U.S. (million $) Exports to the U.S. (million $) Share of regional totals
(%)
Value-added trade Value-added trade Exports Imports Source country
Gross trade Total Direct Indirect
Gross trade Total Direct Indirect Gross VA Gross VA
Total 219 272 183 89 10,555 8,917 7,619 1,299 100 100 100 100 Data Source: Author computed from Asia Input-Output Table, compiled by the Institute of Development Economics, Ministry of Economics, Trade, and Industry, Japan.
56
Table-6a Foreign vs. Domestic Value-added in East Asia Motor vehicles exports to U.S. Market, 1990 and 2000
Data Source: Author computed from Asia Input-Output Table, compiled by the Institute of Development Economics, Ministry of Economics, Trade, and Industry, Japan. Note: a. in Millions of U.S. Dollars
57
Table 6b: Tracing Foreign Value Added in Motor Vehicle and Parts Made in East Asian Sold at the U.S. Market
Source country (1)
China (2)
Indo-nesia (3)
Japan (4)
Korea (5)
Malay-sia (6)
Taiwan (7)
Philip-pines (8)
Singa-pore (9)
Thai-land (10)
United States (11)
Hong Kong (12)
Rest of World (13)
Total (14)
1990, in percent China - 0.8 23.9 0.6 1.4 1.3 0.1 0.3 0.9 7.5 10.3 52.8 100.0
Totala 1.7 0.4 79.8 9.5 0.2 0.5 0.1 0.1 0.4 1.5 0.1 5.8 100.0 Data Source: Author computed from Asia Input-Output Table, compiled by the Institute of Development Economics, Ministry of Economics, Trade, and Industry, Japan. Note. a. The total also includes each country’s domestic value-added, so it includes all the value-added contributions to final goods made in East Asia and exported to the United States.
58
Table 6c Decomposition of Motor Vehicle and Parts Trade Flow between East Asia and the United States by Countries
Imports from the U.S. (million $) Exports to the U.S. (million $) Share of regional totals
(%)
Value-added trade Value-added trade Exports Imports Source country
Gross trade Total Direct Indirect
Gross trade Total Direct Indirect Gross VA Gross VA
Total 3,056 2,645 2,473 172 47,904 44,271 42,705 1,567 100 100 100 100 Data Source: Author computed from Asia Input-Output Table, compiled by the Institute of Development Economics, Ministry of Economics, Trade, and Industry, Japan.
59
Figure 1: Net Value Added Contribution by Source to Manufacturing Products Made in East Asia Sold in the U.S. Market
Figure 2a: Top 10 Industries with the Highest Foreign Value-added in East Asian Manufacturing Exports to the United States
60
Figure 2b: Top 10 Industries with the Highest VS1 (Indirect Domestic Value-added via other Asian countries) in East Asian Manufacturing Exports to the United States
Figure 2c: Top 10 Industries with the Highest U.S. Domestic Content in East Asian Manufacturing Exports to the United States
61
Figure 3: Net Value Added Contribution by Source to Electronics Products Made in East Asia Sold in the U.S. Market
Figure 4: Net Value Added Contribution by Source to Wearing Apparel Made in East Asia Sold at the U.S. Market
62
Figure 5: Net Value Added Contribution by Source to Automobile and Parts Made in East Asia Sold at the U.S. Market
Figure 8: Net Value Added Contribution by Source to Machinery Made in East Asia Sold at the U.S. Market