73
© 2003 @Value Software, LLC @Value Narrative Appraisal Software User's Guide and Help Manual Version 2.0

© 2003 @Value Software, LLC
@Value Narrative Appraisal SoftwareUser's Guide and Help Manual
Version 2.0

Table of Contents
Part I @Value Overview 2
................................................................................................................................... 31 Installation
................................................................................................................................... 42 Registration
................................................................................................................................... 63 Macros
................................................................................................................................... 74 Narrative Tools
.. ... .... ... .... .... ... .... ... .... ... .... .... ... .... ... .... ... .... ... .... .... ... .... ... .... ... .... ... .... .... ... .... ... .... ... .... ... .... .... ... .... ... ... 8Report Wizard Step 1, Overview
.. ... .... ... .... .... ... .... ... .... ... .... .... ... .... ... .... ... .... ... .... .... ... .... ... .... ... .... ... .... .... ... .... ... .... ... .... ... .... .... ... .... ... ... 9Report Wizard Step 2, Scope
... .... .... ... .... ... .... ... .... ... .... .... ... .... ... .... ... .... ... .... .... ... .... ... .... ... .... ... .... .... ... .... ... .... ... .... ... .... .... ... .... ... .... . 10Report Wizard Step 3, Departures
... .... .... ... .... ... .... ... .... ... .... .... ... .... ... .... ... .... ... .... .... ... .... ... .... ... .... ... .... .... ... .... ... .... ... .... ... .... .... ... .... ... .... . 12Report Wizard Step 4, Introduction
... .... .... ... .... ... .... ... .... ... .... .... ... .... ... .... ... .... ... .... .... ... .... ... .... ... .... ... .... .... ... .... ... .... ... .... ... .... .... ... .... ... .... . 13Report Wizard Step 5, The Cost Approach
... .... .... ... .... ... .... ... .... ... .... .... ... .... ... .... ... .... ... .... .... ... .... ... .... ... .... ... .... .... ... .... ... .... ... .... ... .... .... ... .... ... .... . 14Report Wizard Step 6, The Sales Approach
... .... .... ... .... ... .... ... .... ... .... .... ... .... ... .... ... .... ... .... .... ... .... ... .... ... .... ... .... .... ... .... ... .... ... .... ... .... .... ... .... ... .... . 15Report Wizard Step 7, The Income Approach
... .... .... ... .... ... .... ... .... ... .... .... ... .... ... .... ... .... ... .... .... ... .... ... .... ... .... ... .... .... ... .... ... .... ... .... ... .... .... ... .... ... .... . 16Report Wizard Step 8, Reconciliation & Addenda
... .... .... ... .... ... .... ... .... ... .... .... ... .... ... .... ... .... ... .... .... ... .... ... .... ... .... ... .... .... ... .... ... .... ... .... ... .... .... ... .... ... .... . 17Data Manager Overview
.. .... .... ... .... ... .... ... .... ... .... .... ... .... ... .... ... .... ... .... .... ... .... ... .... ... .... ... .... .... ... .... ... .... ... .... ... .... .... ... .... ... .... . 18 Data Manager: Report Mode
.. .... .... ... .... ... .... ... .... ... .... .... ... .... ... .... ... .... ... .... .... ... .... ... .... ... .... ... .... .... ... .... ... .... ... .... ... .... .... ... .... ... .... . 20 Data Manager: Design Mode
... .... .... ... .... ... .... ... .... ... .... .... ... .... ... .... ... .... ... .... .... ... .... ... .... ... .... ... .... .... ... .... ... .... ... .... ... .... .... ... .... ... .... . 22@Value Clipboard: Narrative
... .... .... ... .... ... .... ... .... ... .... .... ... .... ... .... ... .... ... .... .... ... .... ... .... ... .... ... .... .... ... .... ... .... ... .... ... .... .... ... .... ... .... . 24Report Templates
... .... .... ... .... ... .... ... .... ... .... .... ... .... ... .... ... .... ... .... .... ... .... ... .... ... .... ... .... .... ... .... ... .... ... .... ... .... .... ... .... ... .... . 26Analysis Tools From Word
... .... .... ... .... ... .... ... .... ... .... .... ... .... ... .... ... .... ... .... .... ... .... ... .... ... .... ... .... .... ... .... ... .... ... .... ... .... .... ... .... ... .... . 28Importing Appraisal Data
... .... .... ... .... ... .... ... .... ... .... .... ... .... ... .... ... .... ... .... .... ... .... ... .... ... .... ... .... .... ... .... ... .... ... .... ... .... .... ... .... ... .... . 29@Value AutoText
... .... .... ... .... ... .... ... .... ... .... .... ... .... ... .... ... .... ... .... .... ... .... ... .... ... .... ... .... .... ... .... ... .... ... .... ... .... .... ... .... ... .... . 32@Value Autotext Utilities
... .... .... ... .... ... .... ... .... ... .... .... ... .... ... .... ... .... ... .... .... ... .... ... .... ... .... ... .... .... ... .... ... .... ... .... ... .... .... ... .... ... .... . 34Pictures & Picture Tables
... .... .... ... .... ... .... ... .... ... .... .... ... .... ... .... ... .... ... .... .... ... .... ... .... ... .... ... .... .... ... .... ... .... ... .... ... .... .... ... .... ... .... . 35Quick Tools
.. .... .... ... .... ... .... ... .... ... .... .... ... .... ... .... ... .... ... .... .... ... .... ... .... ... .... ... .... .... ... .... ... .... ... .... ... .... .... ... .... ... .... . 36Bookmarks
................................................................................................................................... 385 Analysis Tools & Database
... .... .... ... .... ... .... ... .... ... .... .... ... .... ... .... ... .... ... .... .... ... .... ... .... ... .... ... .... .... ... .... ... .... ... .... ... .... .... ... .... ... .... . 39Sales Analysis Grid
.. .... .... ... .... ... .... ... .... ... .... .... ... .... ... .... ... .... ... .... .... ... .... ... .... ... .... ... .... .... ... .... ... .... ... .... ... .... .... ... .... ... .... . 44Grid Adjustments
.. .... .... ... .... ... .... ... .... ... .... .... ... .... ... .... ... .... ... .... .... ... .... ... .... ... .... ... .... .... ... .... ... .... ... .... ... .... .... ... .... ... .... . 46Editing Drop-Down Lists
.. .... .... ... .... ... .... ... .... ... .... .... ... .... ... .... ... .... ... .... .... ... .... ... .... ... .... ... .... .... ... .... ... .... ... .... ... .... .... ... .... ... .... . 46Creating Sales Analysis Grid Templates
.. .... .... ... .... ... .... ... .... ... .... .... ... .... ... .... ... .... ... .... .... ... .... ... .... ... .... ... .... .... ... .... ... .... ... .... ... .... .... ... .... ... .... . 47Comp Sheets
.. .... .... ... .... ... .... ... .... ... .... .... ... .... ... .... ... .... ... .... .... ... .... ... .... ... .... ... .... .... ... .... ... .... ... .... ... .... .... ... .... ... .... . 49Writing New Comparables
.. .... .... ... .... ... .... ... .... ... .... .... ... .... ... .... ... .... ... .... .... ... .... ... .... ... .... ... .... .... ... .... ... .... ... .... ... .... .... ... .... ... .... . 50Grids Without Comp Sheets
.. .... .... ... .... ... .... ... .... ... .... .... ... .... ... .... ... .... ... .... .... ... .... ... .... ... .... ... .... .... ... .... ... .... ... .... ... .... .... ... .... ... .... . 50@Value Clipboard: Sales Analysis
... .... .... ... .... ... .... ... .... ... .... .... ... .... ... .... ... .... ... .... .... ... .... ... .... ... .... ... .... .... ... .... ... .... ... .... ... .... .... ... .... ... .... . 52Sales Analysis And Database Overview
.. .... .... ... .... ... .... ... .... ... .... .... ... .... ... .... ... .... ... .... .... ... .... ... .... ... .... ... .... .... ... .... ... .... ... .... ... .... .... ... .... ... .... . 53@Value Database
.. .... .... ... .... ... .... ... .... ... .... .... ... .... ... .... ... .... ... .... .... ... .... ... .... ... .... ... .... .... ... .... ... .... ... .... ... .... .... ... .... ... .... . 55The Comp Manager
.. .... .... ... .... ... .... ... .... ... .... .... ... .... ... .... ... .... ... .... .... ... .... ... .... ... .... ... .... .... ... .... ... .... ... .... ... .... .... ... .... ... .... . 56Sharing Comp Data
... .... .... ... .... ... .... ... .... ... .... .... ... .... ... .... ... .... ... .... .... ... .... ... .... ... .... ... .... .... ... .... ... .... ... .... ... .... .... ... .... ... .... . 57Income Analysis
.. .... .... ... .... ... .... ... .... ... .... .... ... .... ... .... ... .... ... .... .... ... .... ... .... ... .... ... .... .... ... .... ... .... ... .... ... .... .... ... .... ... .... . 59Capitalization Rate Tools
.. .... .... ... .... ... .... ... .... ... .... .... ... .... ... .... ... .... ... .... .... ... .... ... .... ... .... ... .... .... ... .... ... .... ... .... ... .... .... ... .... ... .... . 61Expense Reimbursements
.. .... .... ... .... ... .... ... .... ... .... .... ... .... ... .... ... .... ... .... .... ... .... ... .... ... .... ... .... .... ... .... ... .... ... .... ... .... .... ... .... ... .... . 62@Value Clipboard: Income Capitalization
... .... .... ... .... ... .... ... .... ... .... .... ... .... ... .... ... .... ... .... .... ... .... ... .... ... .... ... .... .... ... .... ... .... ... .... ... .... .... ... .... ... .... . 64Cost Analysis
.. .... .... ... .... ... .... ... .... ... .... .... ... .... ... .... ... .... ... .... .... ... .... ... .... ... .... ... .... .... ... .... ... .... ... .... ... .... .... ... .... ... .... . 65@Value Clipboard: Cost Analysis
... .... .... ... .... ... .... ... .... ... .... .... ... .... ... .... ... .... ... .... .... ... .... ... .... ... .... ... .... .... ... .... ... .... ... .... ... .... .... ... .... ... .... . 68Other Analysis Tools
Index 69
@Value Narrative Report Software
© 2003 @Value Software, LLC

@Value Narrative Report Software 2
© 2003 @Value Software, LLC
1 @Value Overview
@Value Narrative Report SoftwareVersion 2.0, 11/9/03
This software package includes:
· Narrative Report templates for self-contained, summary and restricted reports, with analysiscontent for limited and/or complete appraisals
· A Report Wizard to generate any type of report, complete with 2003 USPAP Departure citations, ifapplicable
· Digital Imaging Tools· Sales Comparison Analysis with Database
· Cost Analysis· Income Analysis
This help system is organized as follows:· Narrative Tools· Analysis Tools
· Sales Comparison Analysis and Database· Income Analysis· Cost Analysis
Note: Macros must be enabled for @Value to function.
Purchase/Register @Value Narrative Report Software
Contact @Value@Value Software, LLCCurry Place on Squam LakePO Box 308Holderness, NH [email protected]
@Value software has been developed by Tom Armstrong, MAI.

@Value Narrative Report Software 3
© 2003 @Value Software, LLC
1.1 Installation
Installation Instructions and Notes
1. Load the @Value CD in the CD drive of your computer or download the file avnar.exe (short for@Value Narrative) from www.atvalue.com. Save this file to your desktop or other easilyaccessible location.
2. Find and double-click avnar.exe.3. Follow the on-screen instructions.
Single User Installation Notes1. @Value will install to the user-designated drive of your computer and create a folder named
atvalue. We recommend you install to the c: drive.2. Files created by @Value are normal MS Office files and may be stored in any local or network
folder.3. @Value files will operate in demo mode when opened on a computer that does not have
@Value installed, and the help menus will not function.
@Value Directory Structure
Notes1. The main atvalue folder contains the "avnarrative.dot" file. This is the primary file for thenarrative module. The atvalue folder also contains the "avatbackup.dot" file. This file is used forautotext exports and back-ups. Another important file in this directory is the "Comps Index.xls" file,the user-interface for sorting and selecting comparables from the database.2. The Comps folder contains the individual comparable sale records.3. The Reports folder contains narrative report templates.4. The Tools folder contains sub-folders, each of which contains templates for the Cost, Income
and Sales modules.
Network InstallationContact @Value for a free Network Installation Kit (registered users only please) and install to theserver. Note that any computer on a network can function as a server for @Value.
@Value is designed to run on primarily on individual computers with network services for two keycomponents: the database and @Value autotext (@Value autotext is a database of narrative reportcomponents). The network installation simply provides a central storage and retrieval facility for thesedata components so they may be shared among users connected to the server.
1. Install @Value on individual computers. We recommend installing to the c: drive.2. Install the network components on the server.3. On each individual computer, map network connections to the database and autotext
import/export functions.
@Value Narrative Report Software 4
© 2003 @Value Software, LLC
1.2 Registration
Registration can be accomplished from the Narrative, the Sales Comparison Analysis or the IncomeAnalysis. Registration from any one of these modules will unlock all the modules.
NarrativeOpen the @Value Narrative, click on the @Value Help menu and select Registration. Enter yourregistration name and number combination.
Sales Comparison AnalysisOpen the Sales Comparison Analysis and click the Registration button from the main menu (top rightof Sales Comparison Analysis). Enter your registration name and number combination.
Income AnalysisOpen the Income Analysis and click the Registration button (top right of Income Analysis). Enter yourregistration name and number combination.
Purchase@Value is sold on an individual license basis. Each licensed @Value customer may install thesoftware on as many computers as they need. For example, if you have a computer at your office, oneat home and a notebook, you can install @Value on all of these machines, or more. This should bemisinterpreted as permission to install the software on computers for use by other appraisers who havenot purchased a license.
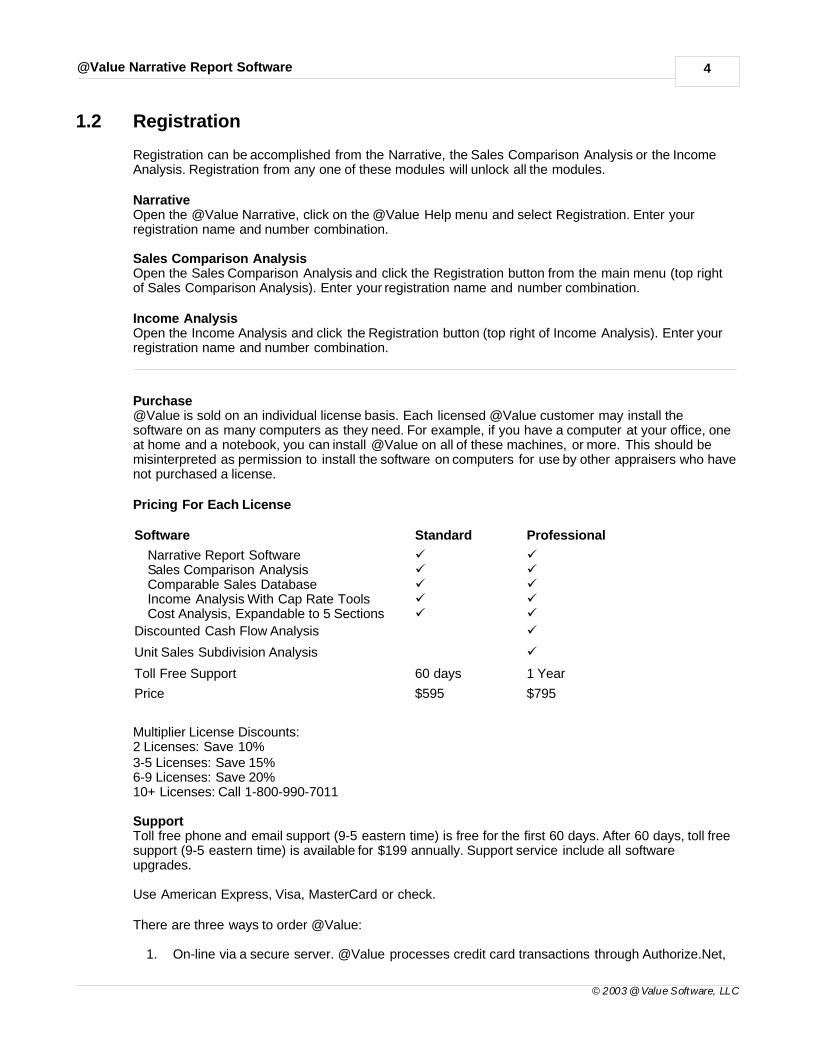
Pricing For Each License
Software Standard Professional
Narrative Report SoftwareSales Comparison AnalysisComparable Sales DatabaseIncome Analysis With Cap Rate ToolsCost Analysis, Expandable to 5 Sections
üüüüü
üüüüü
Discounted Cash Flow Analysis ü
Unit Sales Subdivision Analysis ü
Toll Free Support 60 days 1 Year
Price $595 $795
Multiplier License Discounts:2 Licenses: Save 10%3-5 Licenses: Save 15%6-9 Licenses: Save 20%10+ Licenses: Call 1-800-990-7011
SupportToll free phone and email support (9-5 eastern time) is free for the first 60 days. After 60 days, toll freesupport (9-5 eastern time) is available for $199 annually. Support service include all softwareupgrades.
Use American Express, Visa, MasterCard or check.
There are three ways to order @Value:
1. On-line via a secure server. @Value processes credit card transactions through Authorize.Net,

@Value Narrative Report Software 5
© 2003 @Value Software, LLC
one of the largest and most secure transaction providers on the web. Click here to order on-line.
2. By Phone: 1-800-990-7011
3. If Your organization requires a purchase order, call 1-800-990-7011

@Value Narrative Report Software 6
© 2003 @Value Software, LLC
1.3 Macros
IMPORTANT >> Close all Word Files before starting the @Value Narrative. This is onlynecessary while the software is in Demo Mode.
IMPORTANT >> Macros must be enabled for @Value to function. See notes below.
All @Value files installed on your computer have been scanned with Norton AntiVirus softwareand are safe to use. See note concerning AVG AntiVirus software below.
Office 97 UsersThis version of @Value requires MS Word and Excel 2000 or XP. If you need to upgrade your versionof Office in order to run the @Value Narrative, we will reduce the price of the Narrative by $100. Call 1-800-990-7011 for more information.
About MacrosOffice 2000 and XP: Office 2000 and XP are often shipped with Security set to High. This automaticallydisables macros - @Value won't run under this setting. If you run AntiVirus software, such as McAfeeor Norton, you can safely set the security to Low. This option allows for the best operation of @Value.Without AntiVirus software, you need to change your Security setting to Medium. You will need toenable macros each time you run @Value. Security settings must be set for both Word and Excel.
How Do I Change Security Settings?Start Excel/Word then click Tools -> Macro -> Security and select Low or Medium. If you run anantivirus program, you may safely select Low. You do not need to save the file after making thesechanges.
XP UsersYou must change an additional setting in Excel: click the "Trusted Sources" tab and check the TrustAccess To Visual Basic Project checkbox.
Questions? Call @Value at 1-800-990-7011
AVG AntiVirus SoftwareIn some cases, this free virus software will erroneously indicate that@Value contains a virus. @Valuemay not function if you have this software installed. In most cases it must be uninstalled. Werecommend Norton or McAfee antivirus software. If you purchase one of these programs to replaceAVG AntiVirus software, @Value will reimburse you, just call 1-800-990-7011 and we'll take care of it.
@Value Narrative Report Software 7
© 2003 @Value Software, LLC
1.4 Narrative Tools
To start the @Value Narrative either click on a Desktop shortcut or click Start, Programs, then scroll tothe @Value program group and select the @Value Narrative. This will automatically start Word and the@Value Narrative Software.
You have three choices when starting a new file:
1. Use the Report Wizard to build a new report. Use this option to build reports on the fly, selectingscope specific options for the analysis at hand including valuation approaches and USPAPDeparture reporting.
2. Select a report template. Use this option for @Value's property specific templates or user-builttemplates that have been saved to @Value.
3. Start with a blank document. Build documents from scratch quickly with @Value Autotext orselect from report templates. Also, use this option when importing your previous narrative workto the @Value system.
One hour invested in adding local market, neighborhood, zoning, qualifications,certifications, limiting conditions, assumptions and other commonly referenced data tothe @Value system will get you off to a quick start.

@Value Narrative Report Software 8
© 2003 @Value Software, LLC
1.4.1 Report Wizard Step 1, Overview
Use the @Value Report Wizard to dynamically and quickly build narrative reports, incorporatingprevious narrative work, such as area analyses, zoning, etc. The Wizard will set-up USPAP scopedreports, including USPAP Departure documentation, when applicable.
After the initial report build, use the @Value Data Manager to add and manage appraisal specificitems, such as subject address, appraisal date, site and building size, value conclusions, etc.
Start by scoping the appraisal and report (Scope tab). Note when the Limited Appraisal option isselected, a new "Departures" tab appears.
Each subsequent tab contains narrative report sections. Each component is identified in the left-handcolumn and may be included or excluded from the report build. The right-hand column consists ofdrop-down lists with narrative sections for the report component. For example, the Zoning componenton the left-hand column will typically have several zoning districts listed on the drop-down in the right-hand column.
New narrative sections are easily be added via the @Value Autotext tool, and existing sections can beedited as necessary. While there is ample content to start building reports immediately, the system isdesigned to incorporate your existing and on-going narrative work.

@Value Narrative Report Software 9
© 2003 @Value Software, LLC
1.4.2 Report Wizard Step 2, Scope
Begin scoping the appraisal and report format with Step 2. Select from the following:
Report Type· Self-Contained· Summary
· Restricted
Appraisal Type· Complete· Limited
Note: When a Limited Appraisal is selected, a new "Departures" tab appears.
About The Departure RuleThis software is not a substitute for appraiser competency. It is the appraiser's sole responsibility todetermine if a Limited Appraisal is appropriate based on:
- Analysis of the appraisal problem - Analysis of the client and intended users needs - The results will not be misleading - Communication with and confirmation by the client that a Limited Appraisal is appropriate
Care must be taken to determine if a specific USPAP requirement is applicable and necessary toperform a credible appraisal. If a specific USPAP requirement is applicable and necessary, Departureis not permitted.
See USPAP Departure Rule, USPAP Statement on Appraisal Standards No. 7 (SMT-7), PermittedDeparture from Specific Requirements for Real Property Appraisal and USPAP Advisory Opinion No.15 (AO-15), Using Departure Rule in Developing a Limited Appraisal.
Departure can be applied to a wide variety of appraisal components, allowing the appraiser to focus onwhat is most important to the analysis.
The appraiser cannot invoke Departure however, when the results are not credible or the resultsmisleading. The appraiser must determine when an appraisal component is both applicable andnecessary. If so, Departure cannot be applied to the appraisal component.
For example, appraising a 100 year old Victorian that has been converted to an apartment buildingwould require a Sales Comparison and/or Income Approach to produce credible results. With adequatedata the analysis could be limited to a single approach using the Departure Provision.
Properly understood, Departure is a highly effective tool for the appraiser to be more competitive andefficient. Per USPAP, "Appraisers need to be familiar with the DEPARTURE RULE because it is apowerful tool that allows the extent of appraisal analysis or development (conducted underSTANDARD 1, 6, 7 or 9) to be varied as appropriate for the appraisal assignment. Appropriate use ofthe DEPARTURE RULE provides appraisers with an effective means to compete in an increasinglycompetitive market."
The key to Departure is understanding the client's needs and delivering a credible analysis and reportthat meets those needs.

@Value Narrative Report Software 10
© 2003 @Value Software, LLC
1.4.3 Report Wizard Step 3, Departures
The Departure tab will appear when the Limited Appraisal option has been selected under Step 2.Alternatively, the Departure Wizard can be started independently from the @Value Narrative Toolbar.
Based on USPAP for 2003, @Value has defined 11 categories for Departure provisions:
Cycle through each of the 11 @Value Departure categories and select applicable departures. @Valuewill automatically populate the Scope and Methodology sections of report with applicable narrative andUSPAP citations.

@Value Narrative Report Software 11
© 2003 @Value Software, LLC
Note: Only select applicable departures, including the elimination of approaches. If an approach isnot applicable or necessary and normally would not be developed, do not exclude it with theDeparture Wizard, rather simply exclude it later in the report building process under steps 5, 6 or 7.Otherwise, it's exclusion will erroneously be listed as a departure.
@Value Narrative Report Software 12
© 2003 @Value Software, LLC
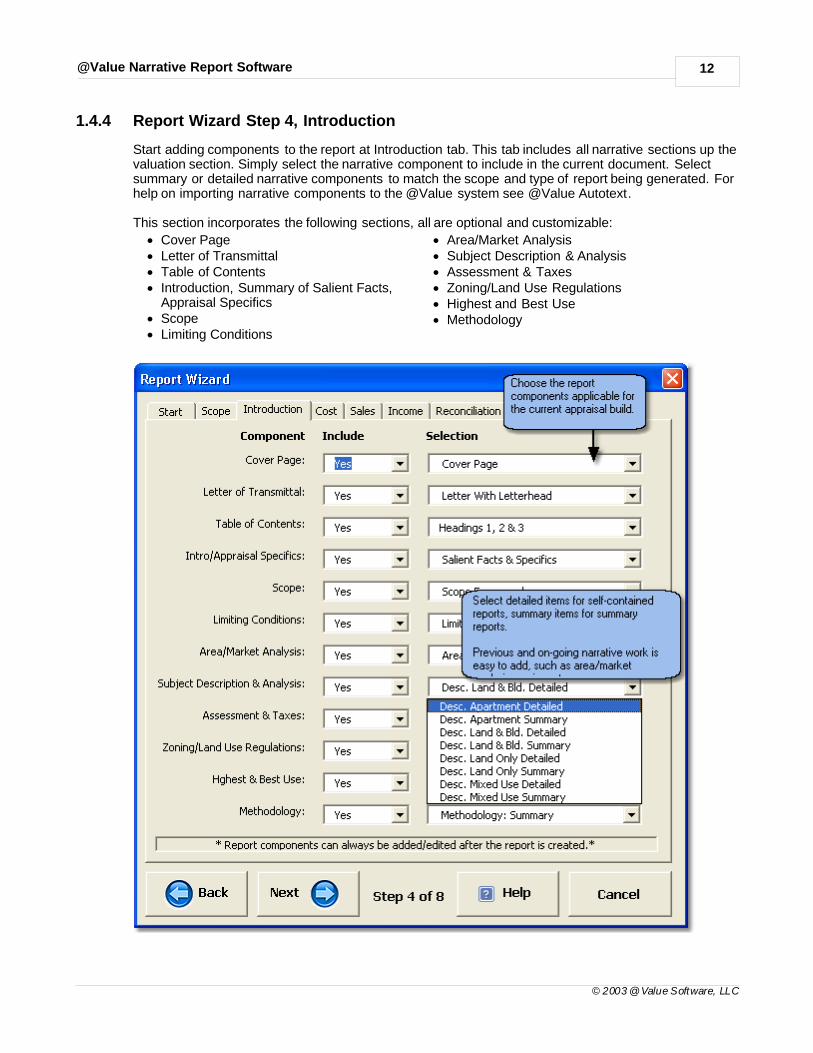
1.4.4 Report Wizard Step 4, Introduction
Start adding components to the report at Introduction tab. This tab includes all narrative sections up thevaluation section. Simply select the narrative component to include in the current document. Selectsummary or detailed narrative components to match the scope and type of report being generated. Forhelp on importing narrative components to the @Value system see @Value Autotext.
This section incorporates the following sections, all are optional and customizable:
· Cover Page· Letter of Transmittal· Table of Contents· Introduction, Summary of Salient Facts,
Appraisal Specifics· Scope· Limiting Conditions
· Area/Market Analysis· Subject Description & Analysis· Assessment & Taxes· Zoning/Land Use Regulations· Highest and Best Use· Methodology

@Value Narrative Report Software 13
© 2003 @Value Software, LLC
1.4.5 Report Wizard Step 5, The Cost Approach
Select the desired report components to match the report scope and format. For help on importingnarrative components to the @Value system see @Value Autotext.
The Cost Approach has five sections:
· Introduction· Land Valuation· Cost Analysis· Depreciation Analysis· Summary

@Value Narrative Report Software 14
© 2003 @Value Software, LLC
1.4.6 Report Wizard Step 6, The Sales Approach
Select the desired report components to match the report format. For help on importing narrativecomponents to the @Value system see @Value Autotext.
The Sales Analysis has three sections:
· Introduction· Market Data (This includes comps, maps and analysis grid.)· Analysis/Reconciliation. (This includes the narrative discussion of the adjustments made on the
analysis grid and reconciliation of the analysis.)

@Value Narrative Report Software 15
© 2003 @Value Software, LLC
1.4.7 Report Wizard Step 7, The Income Approach
Select the desired report components to match the report format. Given the inherent complexities ofthe Income Approach, there are many components to choose from all of which can be customized bythe analyst. For help on importing narrative components to the @Value system see @Value Autotext.
The Income Analysis has nine sections:
· Introduction· Income History/Actual· Rental/Income Comparables· Income Analysis/Projection· Vacancy & Collection Loss
· Expense History/Actual· Expense Analysis/Projection· Capitalization Rate/Discount Rate Development· Income Approach Conclusion
@Value Narrative Report Software 16
© 2003 @Value Software, LLC
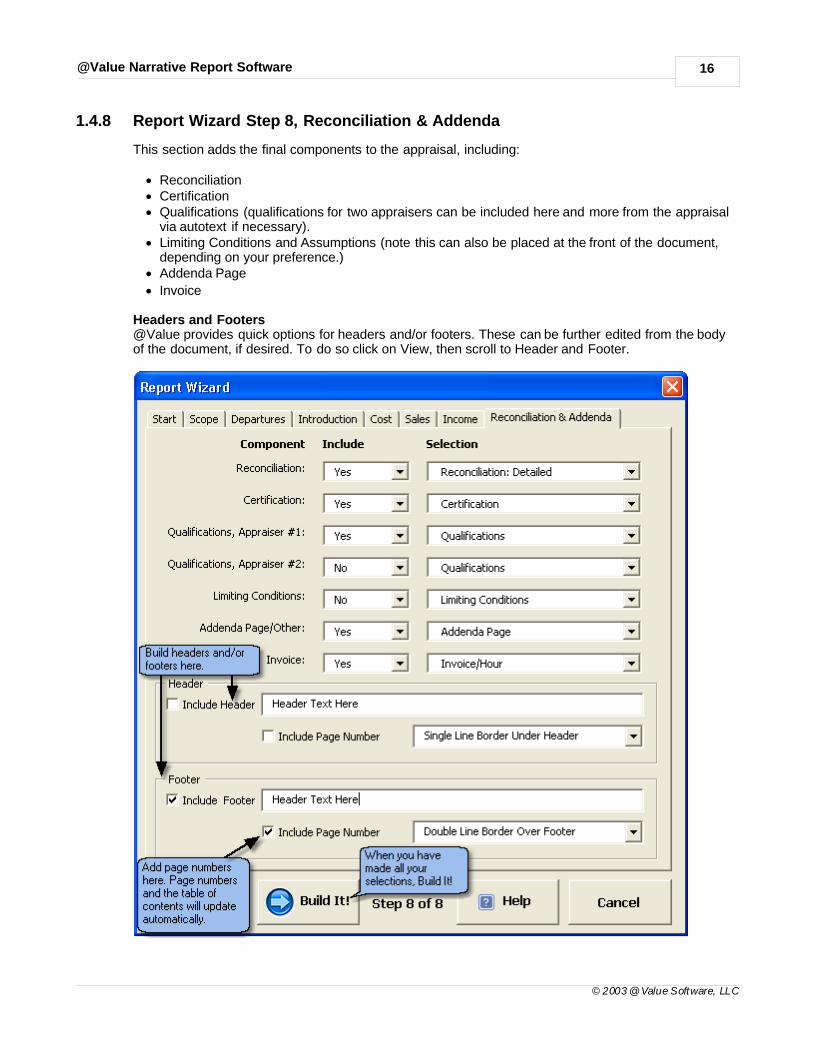
1.4.8 Report Wizard Step 8, Reconciliation & Addenda
This section adds the final components to the appraisal, including:
· Reconciliation· Certification· Qualifications (qualifications for two appraisers can be included here and more from the appraisal
via autotext if necessary).· Limiting Conditions and Assumptions (note this can also be placed at the front of the document,
depending on your preference.)· Addenda Page
· Invoice
Headers and Footers@Value provides quick options for headers and/or footers. These can be further edited from the bodyof the document, if desired. To do so click on View, then scroll to Header and Footer.

@Value Narrative Report Software 17
© 2003 @Value Software, LLC
1.4.9 Data Manager Overview
The Data Manager is a central location to manage data that is dispersed throughout the report. Reportspecific data, from the appraiser's name to the value conclusion are entered on this dialog. Many fieldshave editable drop-down lists with common responses to speed the report writing process. The DataManager makes documents dynamic, allowing for global changes of over 50 appraisal variables. Withthe help of the @Value Clipboard, these data can also be transferred directly to the cost, income andsales spreadsheets.
Enter or edit information in the Data Manager at anytime; the software will automatically update theentire report.
Note that in certain cases a bookmark table will be inserted into the document when the Data Manageris activated.
Two Modes of Operation
1. Report Mode 2. Design Mode
Report Mode is the default mode that is used when writing reports. This mode is an interface forentering and editing appraisal data.
Design Mode is used when creating or editing a report or report template or autotext component. Thismode enables the placement of fields in the document that reference the information entered in theData Manager while in Report Mode.

@Value Narrative Report Software 18
© 2003 @Value Software, LLC
1.4.9.1 Data Manager: Report Mode
Report Mode is the primary mode of operation for the Data Manager. Enter and edit report data that isdispersed throughout the document and associated valuation spreadsheets. Many items have lists thatcan be added to for future reference.

@Value Narrative Report Software 19
© 2003 @Value Software, LLC
Enter Summary DataThe Data Manager is designed to manage and distribute summary data. For example, the highest andbest use entries are intended for highest and best use conclusions, not the full analyses, which can befurther detailed narratively in the body of the document. The conclusions are then referenced via theData Manager in the Highest and Best Use section, the Summary of Salient Facts section and othersections the user may have defined.
Another example are property description items, which can be transferred to the valuationspreadsheets as adjustment description items, as well as to other locations in the narrative like theSummary of Salient Facts. If, for example, the site topography is sloping, simply enter "Sloping". Ifwarranted, add further detail around this reference in the narrative Site Description section.
Property description items can be dispersed throughout the report to populate narrative sections withsubject data. For example, a paragraph summarizing the property might be set up as follows, where

@Value Narrative Report Software 20
© 2003 @Value Software, LLC
[Ref] is populated with data entered in the Data Manager:
The subject property is [Ref], with [Ref] acres of land and [Ref] SF of gross building area. Theproperty is in [Ref] condition and has a highest and best use as [Ref]. The current assessment is [Ref]and the annual tax bill is [Ref].
Enter Numbers as NumbersItems such as gross building area (GBA), net leasable area (NLA), site size, number of units, etc., canbe transferred to the valuation spreadsheets and used for calculations. Therefore these numbersshould be entered as numbers without additional text (SF, sq. ft., etc.) or special symbols (±, ~, etc.)so they will be interpreted as values, not text, on the spreadsheets. Formatting can be used, such ascommas, decimals and any typical date convention (10-15-03, 10/15/03, 10/15/2003, October 15,2003, etc.). This does not apply to the File Number field, which is a text field.
1.4.9.2 Data Manager: Design Mode
Use Design Mode when setting up templates and autotext report sections. It is activated when theDesign Mode button at lower-left is selected.
The Data Manager is a tool to insert references for various fields throughout the document. Most of thetime, the fields in the Data Manager will have no information when the initial references are created.
Using the Data Manager is an interactive process that involves frequent switching between the Worddocument and the Data Manager. After the Data Manager is running, simply click the Word documentto activate it. Note that the Data Manager can be moved to the side of the screen by clicking anddragging the title bar.
1. Place the cursor in the Word document where you want a reference field to appear.2. Switch back to the Data Manager and click the Radio button for the information you want to
reference.3. Select a Reference from the list and Click "Insert Reference at Cursor"
Repeat this process for each item, keeping the Data Manager "on top" while you work.

@Value Narrative Report Software 21
© 2003 @Value Software, LLC
NotesThe Data Manager will automatically insert a "Bookmark Container Table" at the end of the document ifit doesn't already exists, which is usally the case when working with document sections.
IMPORTANT >> Before saving the document section to the system via @Value Autotext, be sure the"Bookmark Container Table" is not included in the selection. @Value will automatically include a tablewhen the report is generated. The individual components should not be saved with a BookmarkContainer Table.
@Value Narrative Report Software 22
© 2003 @Value Software, LLC
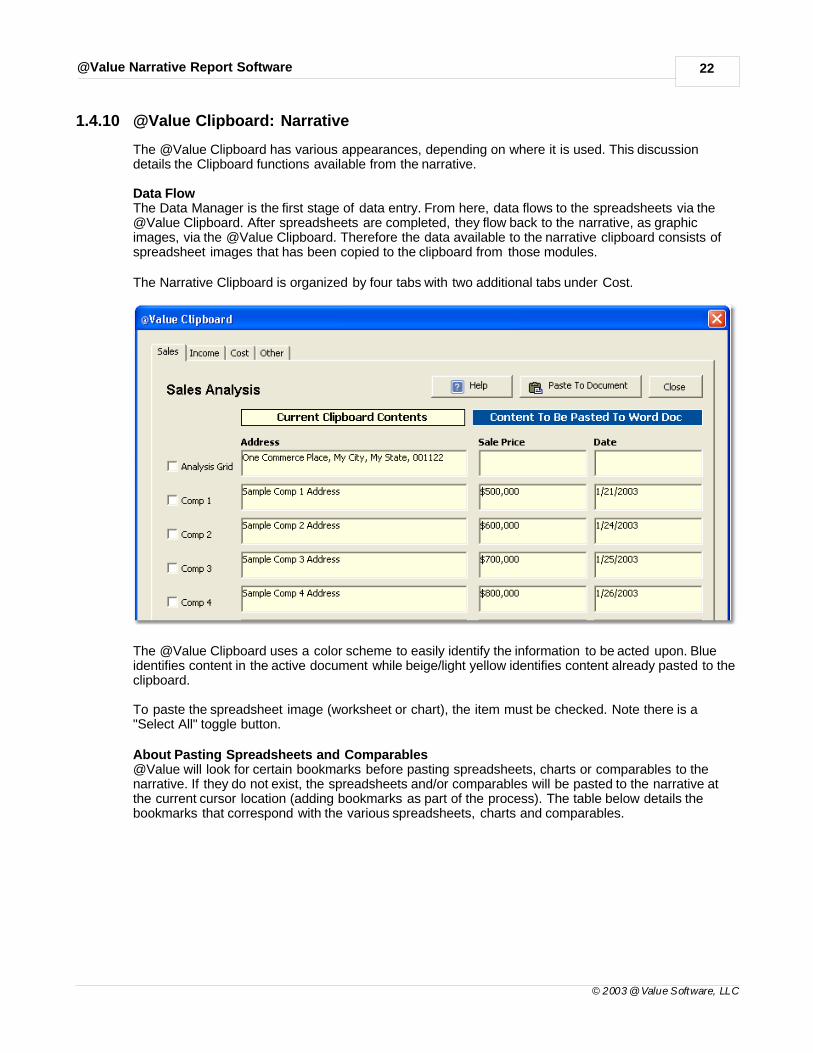
1.4.10 @Value Clipboard: Narrative
The @Value Clipboard has various appearances, depending on where it is used. This discussiondetails the Clipboard functions available from the narrative.
Data FlowThe Data Manager is the first stage of data entry. From here, data flows to the spreadsheets via the@Value Clipboard. After spreadsheets are completed, they flow back to the narrative, as graphicimages, via the @Value Clipboard. Therefore the data available to the narrative clipboard consists ofspreadsheet images that has been copied to the clipboard from those modules.
The Narrative Clipboard is organized by four tabs with two additional tabs under Cost.
The @Value Clipboard uses a color scheme to easily identify the information to be acted upon. Blueidentifies content in the active document while beige/light yellow identifies content already pasted to theclipboard.
To paste the spreadsheet image (worksheet or chart), the item must be checked. Note there is a"Select All" toggle button.
About Pasting Spreadsheets and Comparables@Value will look for certain bookmarks before pasting spreadsheets, charts or comparables to thenarrative. If they do not exist, the spreadsheets and/or comparables will be pasted to the narrative atthe current cursor location (adding bookmarks as part of the process). The table below details thebookmarks that correspond with the various spreadsheets, charts and comparables.

@Value Narrative Report Software 23
© 2003 @Value Software, LLC
Spreadsheet/Comparable Bookmark
Sales Analysis Grid AnalysisGrid
Comparable Sales 1 - 6 Comp1, Comp2, Comp3, Comp4, Comp5, Comp6
Land Sales Analysis Grid AnalysisGrid_Land
Comparable Land Sales 1 - 6 Comp1_Land, Comp2_Land, Comp3_Land, Comp4_Land,Comp5_Land, Comp6_Land
Cost Analysis CostAnalysis, CostAnalysis2, CostAnalysis3, CostAnalysis4,CostAnalysis5
Income Analysis ValuationWorksheet
Expense Reimbursements ExpenseReimbursements
Income Profile (Chart) IncomeProfile
Expense Profile (Chart) ExpenseProfile
Cash Flow Profile (Chart) CashFlowProfile
Capitalization Rate Calculations(From Income Cap Analysis)
RateTools
Capitalization Rate Calculations(From stand-alone analysis,accessed from "Other" Category)
CapRateTools
The @Value Clipboard is slightly different for each analysis module. See:
· @Value Clipboard: Sales Analysis· @Value Clipboard: Income Analysis· @Value Clipboard: Cost Analysis

@Value Narrative Report Software 24
© 2003 @Value Software, LLC
1.4.11 Report Templates
@Value includes the following report templates:
· General Use: Complete Appraisal, Self-Contained Report· General Use: Complete Appraisal, Summary Report· General Use: Limited Appraisal, Summary Report· Multi-Family: Limited Appraisal, Summary Report· Retail/Office: Limited Appraisal, Summary Report· General Use: Limited Appraisal, Restricted Report
To create a new report based on a template, open the Reports dialog.
Simply select a report type from the list and click the "Insert at Cursor" button.
Copy a Report to the @Value SystemStart by clicking the "Copy New Report To @Value System" button at the top of the dialog. Beforesaving files to the system, please see Prepping a file for the @Value System.
1. Click the "Select A File" button. This start Word's File Find dialog. The selected file name willappear under the button.
2. Enter a description for the file name. We recommend ample detail here; the type of report, scopeof the appraisal, approaches applied, etc. Finally, save the file. Note that copy of file will becreated and added to the @Value system in the ..\atvalue\reports folder, the original is notmodified or moved.

@Value Narrative Report Software 25
© 2003 @Value Software, LLC
Prepping A File For The @Value System
· Remove appraisal/client specific items, such as names, dates, addresses.· Remove all photographs and images.· Remove all property specific narrative such as property description, highest and best use, analysis
narrative, etc.
· Use the @Value Placeholder for items that need to be customized. Click the "Quick Tools" buttonon the @Value toolbar, then scroll down to and click on "Placeholder" or "BookmarkedPlaceholder". A placeholder will be inserted at the cursor location.
See @Value Clipboard: Narrative

@Value Narrative Report Software 26
© 2003 @Value Software, LLC
1.4.12 Analysis Tools From Word
@Value includes the following analysis tools:
· Sales Comparison Analysis and Database· Income Capitalization Analysis with built-in expense reimbursement and cap rate tools· Cost Analysis, with sections for detailed building and site improvements, depreciation schedules,
expandable to five connected sections· Stand-alone capitalization rate tools
@Value Analysis Tools can be operated as stand-alone Excel spreadsheets or they can be embeddedinto Word where they become part of the Word file and can only be accessed through the Word file.Even with a new computer, working with large embedded files, such as the @Value Sales ComparisonAnalysis, can tax the system resources. We recommend stand-alone spreadsheets.
Analysis tools can be accessed from the @Value narrative toolbar, from the @Value Program Groupor from a Desktop Shortcut. When you start Analysis Tools from the narrative toolbar you will bepresented with two choices:
1. Open a spreadsheet as a stand-alone file (recommended).2. Embed a spreadsheet in the active Word document.
Open a Stand-Alone SpreadsheetWe recommend this because it allows for better file stability, faster file operation and fewer "enablemacros" prompts. This option will open an Excel file that serves as a menu for @Value Analysis Tools.There are four categories:
1. Sales Analysis Tools2. Income Analysis Tools3. Cost Analysis Tools4. Other Tools

@Value Narrative Report Software 27
© 2003 @Value Software, LLC
Embed A SpreadsheetChoosing this option opens the same dialog as pictured above. The difference is that when a file isselected, it embeds the spreadsheet into the Word document, with a picture of the spreadsheetshowing on the page. If the spreadsheet you are embedding contains macros (all the @Valuespreadsheets do), depending on your security settings, you may get several warnings concerningmacros. Of course, the @Value spreadsheet macros should be enabled.
This action often requires two types of re-sizing for the embedded image.
1. The embedded spreadsheet is often over-sized, and too large for the page.2. The picture of the embedded spreadsheet often includes additional rows and columns.
Re-size The Image1. Select the image with a right-button single-click on the image. This display a Word shortcut
menu.2. From the shortcut menu, select Format Object, then click the Size tab.3. From the Size tab, scroll down to the Scale section and use the spin button to roll the
percentages down. Start with 50% and refine as necessary.
Change Displayed Rows and Columns1. Select the image with a right-button single-click. This display a Word shortcut menu.2. Select Worksheet Object 4 this will bring up a side menu, select Edit (not Open).3. This will open the worksheet within Word. Note your Word menus and toolbars are now Excel
items. The edge of the embedded Excel sheet is now a hatched line with small square "handles"on the corners and sides.
4. To show or hide Excel rows and columns, click and drag a handle. When your done, clickoutside the Excel area to return to Word.
Opening An Embedded Spreadsheet1. Select the image with a right-button single-click. This display a Word shortcut menu.2. Select Worksheet Object 4 which will bring up a side menu, select Open (not Edit, as used
above).
@Value Narrative Report Software 28
© 2003 @Value Software, LLC
1.4.13 Importing Appraisal Data
It will pay dividends to go through some of your files and extract local market, neighborhood, zoning,qualifications, certifications, limiting conditions and assumptions and other commonly referenced datato the @Value system.
Start with a blank @Value document. Next, click Insert on Word's main menu, then scroll down toInsert File. Find and select the file you want to extract information from. For each section of the fileyou want to import, do the following:
1. Select the document section2. Activate the @Value AutoText tool3. Select the category (and sub-category, if applicable)4. Name the selection5. Optional: Make the selection a report component for the @Value Report Wizard by selecting the
checkbox.6. Save the entry
See Adding A New AutoText Entry
Building Custom EntriesUse the @Value AutoText tool to build custom appraisal components. For example, you may have aproperty description or highest and best use layout you want to use. Simply purge any appraisalspecific data from the selection, insert placeholders or bookmarked placeholders where appropriate,then save the selection. See Data Manager: Design Mode

@Value Narrative Report Software 29
© 2003 @Value Software, LLC
1.4.14 @Value AutoText
This feature is central to effective use of the @Value Narrative. Use @Value AutoText to quickly saveand retrieve report sections, standard comments or even tables and graphics. Custom AutoTextentries can be very important to your work; we recommend regular backups.
@Value AutoText organized by common report components, ordered like a typical appraisal report,starting with "Covers" (Cover Page), ending with Addenda and miscellaneous items, such as invoicesand digital signatures. The "About This Category" window (top-right) provides basic information abouteach autotext category and if a page break should be included when creating a new autotext entry.This applies primarily to report sections that are to be used by the Report Wizard.
The Autotext Preview window provides a quick but unformatted preview of the autotext content. SeePreview Autotext discussion, below.
Inserting AutoTextAutoText is always inserted at the cursor location. Note that the @Value AutoText dialog can remain"on-top" while you work with the Word document. The dialog can be moved to the side by clicking anddragging the title bar at the top of the dialog, allowing you to move the cursor to different locations inthe document if necessary.
@Value Narrative Report Software 30
© 2003 @Value Software, LLC
1. Select the appropriate category tab on the left side of the dialog and sub-category, if applicable.2. Select the Autotext entry.3. Click the "Insert at Cursor" button. Note that you can reverse the Insert by clicking the "Undo"
button or Ctrl+Z.
Preview AutotextThe easiest way to preview an autotext entry is to simply insert it to the document. Remove it byclicking the "Undo" button or Ctrl+Z. It may be helpful to open a blank @Value document, then insertvarious autotext entries to review the content.
Add A New AutoText EntryStart be selecting text, table or other document section from Word document. Simply select, or"highlight" with your cursor.
Tip: Press F8 and use arrow and page-up/page-down keys for better control selecting text.
1. Select the "Create New Entry" option button at the top of the dialog.2. Select a category from the tabbed list on the left side of the dialog.3. Some categories have additional sub-categories, so you may need to click the sub-category
drop-down list to refine the location where the AutoText entry is stored.4. Name the entry. The name field has a 27 character maximum length, so abbreviate as
necessary.5. If the AutoText entry is a report component, click the "Make Available To Report Wizard"
checkbox. Further, add "Detailed" or "Summary" to the end of the name if the component isspecifically for a self-contained or summary report, respectively.
6. Save the AutoText.

@Value Narrative Report Software 31
© 2003 @Value Software, LLC
Edit An Existing Autotext EntryThis is very similar to creating a new autotext entry, described above. Start by inserting the Autotextentry to be modified and make the desired edits. Next, select and re-save the edited content, using theoriginal name. The software will provide a warning that it is over-writing an existing entry, which is ofcourse the intent.
Tip: If your are modifying an autotext entry that was originally included with the software, use a newname, that way when you update or reinstall the software, the entries won't be replaced with theoriginal @Value AutoText content.
Delete An AutoText EntrySelect the autotext entry and click the delete button.
Autotext Backups and ExportingFor autotext back-up/export, or autotext restore/import see @Value AutoText Utilities.

@Value Narrative Report Software 32
© 2003 @Value Software, LLC
1.4.15 @Value Autotext Utilities
@Value AutoText Utilities
@Value AutoText utilities are a set of tools to export or import @Value AutoText entries. Use theseutilities to backup autotext, send autotext directly to another user or to send autotext entries to a serverfor distribution across a network.
Start the Export utility by opening @Value AutoText, then click the Export AutoText button (lower-right).
When @Value is installed, a file called "avatbackup.dot" is created in the atvalue folder. By default, theExport utility will export @Value Autotext entries to this file. Autotext entries should be exported to thisfile regularly, and this file included in your regular computer back-up schedule.
Export Autotext to a Server or Other ComputerTo Export files to a server or another computer on the network, simply click the Browse button andnavigate to the remote folder where the "avatbackup.dot" has been installed, then run the Exportfunction.
Import @Value AutoText Entries: This is essentially the same as the above process, and will importall @Value AutoText entries from avatbackup.dot to avNarrative.dot.
About Importing and Exporting AutoTextImporting autotext will overwrite existing autotext entries with the same name. Similarly, exportingautotext entries will over-write entries with the same name in the destination file. Other entries will notbe affected. For example, if the autotext on your computer contains an entry named "Letter ofTransmittal" and there is an entry with the same name in the destination file ("avatbackup.dot"), theentry on the destination file will be overwritten. However, if the destination file has a file named"Transmittal Letter", it will not be overwritten.
Tips: When adding new entries, provide unique names. With time sensitive information, such aszoning or regional data, add the date to the name. Remember, the maximum name length is 27characters (we don't like the limitation either...), so abbreviate as necessary.

@Value Narrative Report Software 33
© 2003 @Value Software, LLC
Print All AutoText EntriesCareful! This will print over 100 pages of autotext.

@Value Narrative Report Software 34
© 2003 @Value Software, LLC
1.4.16 Pictures & Picture Tables
Start the picture tool from the @Value toolbar byclicking the "Insert Images" button.
The Picture tool will appear blank at first. To viewphotos, click the "Folder" button and select thefolder that contains your pictures.
Think of the pictures as a roll of film that can bescrolled up or down.
To insert a picture (at the current cursor location),simply click on it. Different cameras producedifferent sized images, so experiment with the scalesettings at the bottom. @Value will remember thesettings and the last pictures you looked at, so if youclose the Picture tool and then return to the file at alater date, you can pick up where you left off, noneed to scroll through all of the pictures again.
Tip: You can keep the Picture tool viable while youwork in Word. This is very helpful when writingproperty descriptions, etc.
Tip: Keep the number of pictures in a picture folderto 50 or less.
Picture TablesThis helps with your photograph layout. There aretwo options: arrange with description text to the rightof the photograph, or under the photograph. Eachpicture table holds two pictures with one picturetable to a page.

@Value Narrative Report Software 35
© 2003 @Value Software, LLC
1.4.17 Quick Tools
Quick Tools is a collection of tools to expedite routine tasks.
Update Table of ContentsUse this option to update the table of contents.
Go To and Mark Active EditUse these functions to mark and return to the active section of the document. "Mark Active Edit" willplace a bookmark at the current cursor location; "Go To Active Edit" will return to that location.
Formatting: Normal Through Heading Level 4Faster than Word's built-in menu, this function will quickly format the selected text. Heading levels 1 upto 4 will be added to the Table of Contents, depending on the number of levels selected in the Reportbuild. See Table Of Contents
BookmarksThis function has a separate help page. See Bookmarks.
SymbolsAgain, a quicker way to find and insert common symbols used in appraisal work.
Paste Without FormatThis will paste the contents of the Windows clipboard as plain text. This is handy if you have copiedfrom another document with different formatting, or a web page or spreadsheet.
Insert PlaceholderThis function will insert a placeholder field, which is simply an easy to find visual que where user inputmay be required. This is used when designing report components and templates.
Insert Bookmarked Placeholder

@Value Narrative Report Software 36
© 2003 @Value Software, LLC
This inserts a placeholder with a bookmark.
Show/Hide Hidden TextThis will reveal or hide text formatted as hidden text. Some @Value fields have hidden text whichdescribe features of the filed, such as the associated bookmark name (if applicable).
Show/Hide BookmarksThis will reveal or hide bookmarks. Note that empty bookmarks appears as "I-beams", whilebookmarks with content start and end with brackets. It is helpful to keep bookmarks visible whendesigning report components and templates.
1.4.17.1 Bookmarks
@Value has a powerful tool for Word bookmarks.
Use this tool to:· Navigate to bookmarks· Create new bookmarks· Delete bookmarks· Insert bookmarked content· Insert page number cross references to bookmarks

@Value Narrative Report Software 37
© 2003 @Value Software, LLC
See @Value Clipboard: Narrative for a list of bookmarks used by @Value.

@Value Narrative Report Software 38
© 2003 @Value Software, LLC
1.5 Analysis Tools & Database
As detailed in the Narrative Tools section of this help system, @Value includes the following analysistools:
· Sales Comparison Analysis and Database· Income Capitalization Analysis with built-in expense reimbursement and cap rate tools
· Cost Analysis, with sections for detailed building and site improvements, depreciation schedules,expandable to five connected sections
· Stand-alone capitalization rate tools
These analysis tools can be operated as stand-alone Excel spreadsheets, or they can be embeddedinto Word where they become part of the Word file and can only be accessed through the Word file.Even with a new computer, working with large embedded files, such as the @Value Sales ComparisonAnalysis, can tax the system. See Analysis Tools From Word .
Open A Stand-Alone SpreadsheetWe recommend this because it allows for better file stability, faster file operation and fewer "enablemacros" prompts. This option will open an Excel file that serves as a menu for @Value Analysis Tools.We recommend stand-alone spreadsheets.
Starting @Value Analysis Tools· Click Start, Programs, then scroll to the @Value Program Group· Double-click the desktop shortcut

@Value Narrative Report Software 39
© 2003 @Value Software, LLC
1.5.1 Sales Analysis Grid
The Main MenuThe Main Menu is located at the top-right corner of the Analysis Grid. The function of each button isexplained below.
Grid Options: Activate this dialog to set the number of comps to analyze, to set the adjustmentcategories and methods and to refresh the comp data on the Analysis Grid after a new comp has beenadded or an existing comp edited.
Manage Comps: Activate to import comps selected from the database, add a new blank comp sheet,change the order of comps, or remove comparables from the analysis.
Open Database: This button will open the @Value Database where you can sort, preview and selectcomps to be imported the analysis grid. There are two steps to importing comps:
1. Selecting comps from the database. When you open the database, you can build a list of up toten comps to import when you return to the analysis grid. After you build and save your list, exitthe database.
2. From the Analysis Grid, open the Manage Comps tool and import the comps to the AnalysisGrid.
Edit Drop-Downs: The Analysis Grid has numerous drop-down lists that can be customized to yourpreferences.

@Value Narrative Report Software 40
© 2003 @Value Software, LLC
Copy to Clipboard: Copy the Analysis Grid to the @Value Clipboard.
Save as Template: Save a customized Analysis Grid with comp sheet template.
What You Can and Can't DoThe Analysis Grid and comp sheets are loaded with drop-down lists and formulas. For flexibility most ofthese cells can be over-written and copied to or formatted.
What You Can Do: Over-write formulas, ignore drop-down lists and type different entries.What You Shouldn't Do: Cut/Copy, Drag & Drop cells with drop-downs (each is tied to a compspecific list).

@Value Narrative Report Software 41
© 2003 @Value Software, LLC
Setting Up The Analysis GridThe Analysis Grid pulls much of its data from the comp sheets (though comp sheets are optional). Thefollowing section assumes comps have been imported to the analysis. See @Value Database for thatfunction.
Analysis Grid OptionsThis dialog has four functions:
1. Set the analysis mode (SF, Per Unit, etc.)2. Set the number of comps3. Refresh the Analysis Grid4. Set the adjustment categories (2nd tab)
Note: The "Apply" button must be pressed for each section.
Analysis ModeThere are several options, as shown on the image below, and they can be changed at any time.
Number of Comps to UseThe @Value Analysis Grid holds a minimum of two comps and a maximum of six, though up to tencomps may be stored with any analysis. In the rare event that only one comp is available for analysis,the information for the second comp may be left blank.
Refresh Analysis GridThis will re-populate the analysis grid with comp sheet data. This is helpful when a new comp has beenadded or when an existing comp has been edited. @Value will search for adjustment categories thatmatch any of the comp sheet description items and will populate the analysis grid with data from thecomparable. For example, if an adjustment has been established for site size, @Value will find the sitesize for each comp and place this data in the adjustment grid in the appropriate locations.
A similar process is followed for subject data. @Value will search each adjustment category and placethe corresponding subject data in the subject column.

@Value Narrative Report Software 42
© 2003 @Value Software, LLC

@Value Narrative Report Software 43
© 2003 @Value Software, LLC
Set Individual Adjustments (2nd tab)
The left-hand side of the dialog shows the adjustment categories. Some are not shown, such asProperty Rights, Financing, Conditions of Sale and Economic Trends (Time). The first item is differentthan the others in that it is reserved for the Location adjustment, discussed further below.
Each adjustment item has a drop-down list that has been generated from the comp sheet templateassociated with the Analysis Grid. The drop-down list has been populated with all the description itemsfrom the comp sheet and provides the analyst with a good starting point for defining relevantadjustment categories. Adjustment descriptions/categories can be edited at any time, either with thisdialog or on the adjustment grid.
Automatically Populate The Analysis Grid: @Value will automatically populate the adjustment gridwith comp data for each adjustment item, if the item is selected from the drop-down lists.
The right-hand side of the dialog is used to select the adjustment method. There are two basicadjustment methods, percent and dollar, with optional comparison rows and narrative descriptionrows. Additionally, there are four options for user-defined adjustments, spanning two to six rows. Alladjustments are editable and can be changed at any time.

@Value Narrative Report Software 44
© 2003 @Value Software, LLC
At the bottom of the dialog is a drop-down list for previewing the various adjustment methods andformats.
1.5.1.1 Grid Adjustments
Working With The Adjustment GridAssuming the analysis includes comp sheets, the software will populate the analysis grid with compdata. The top section of the grid will include comp specific data regarding location, date of sale, unitprice (optional), property rights and financing. The balance of the comp data will populate theadjustment grid, matching adjustment categories with comp data. For example, if an adjustmentcategory for land size has been established, @Value will populate the grid with the land size for eachcomparable in the appropriate location. If there are no matching adjustment categories, the comp datais always available in the drop-down lists found throughout the grid. The comp data in the drop-downlists is visible only when the cell is selected and the drop-down arrow is clicked.
Comp data will automatically load to the adjustment grid when a comp is loaded to the analysis fromthe database. If changes are made to a comp sheet after it has been loaded to the grid, the grid mustbe refreshed. Similarly, if a new comp has been written, the grid must be refreshed in order to load thenew comp data to the grid. To refresh, click Grid Options, then reference the Refresh Grid section atthe bottom of the dialog.
The first three adjustment categories, Property Rights, Financing and Conditions of Sale are fixedcategories and accept only percent adjustments. Click the adjustment cell to activate the drop-down listwith common percent adjustments listed. Note that you can edit these lists.
Economic Trends Adjustment@Value will automatically calculate the difference between the sale and appraisal dates, and apply apercent adjustment for each month elapsed. Enter the time adjustment as shown in the image below.

@Value Narrative Report Software 45
© 2003 @Value Software, LLC
Note that the time adjustment formulas for the individual comps can be over-written.
Location AdjustmentThe Location adjustment has unique characteristics. Unlike the adjustments below this item, theLocation adjustment cannot be renamed and it does not have options for creating a user-definedadjustment. There are two options: a percent adjustment or a dollar adjustment. A comparison rowmay also be included. If you need to set up the Location adjustment differently, you can hide the built-inLocation adjustment and create a new Location adjustment in one of the rows below.
General AdjustmentsThe names of the adjustment categories, located on the left side of the Analysis Grid, can be set viathe Grid Options dialog, as described above or directly on the Analysis Grid worksheet. Either select anadjustment category from the drop-down list or enter a new one. Note that the type of adjustment (% or$) must be set through the Grid Options dialog.
In the column for each comparable, the drop-down lists are populated with three types of information:
1. The top row drop-down contains data from the comp sheet, such as site size, improvements, etc2. Row 2 and 3 drops-downs include common comparative notes, such as inferior, similar, superior,
etc3. The Row 4 drop-down contains common percent adjustments
Row 5 holds the final dollar adjustment.

@Value Narrative Report Software 46
© 2003 @Value Software, LLC
Again, drop-down lists are optional and can be over-written. The cells are unlocked for user-definedadjustments and formulas. You can show 2 to 5 rows for a single adjustment. See Set IndividualAdjustments, above.
Other FeaturesThe Analysis Grid has optional Average and Weighted Average calculations at the bottom of the sheet.Further, after the Time Adjustment and before the Location Adjustment, the grid can be expanded foran additional adjustment. A common use for this feature is post sale expenses, such as razingimprovements, etc. To expand the grid and reveal this adjustment, click the + sign in the left margin.
1.5.1.2 Editing Drop-Down Lists
Most of the lists in the Analysis Grid and Comp sheets are editable to some degree. Certain lists are acombination of editable data and fixed data. For example, some of the lists in the Analysis Grid containqualitative ratings, such as "Average", "Good", "Very Good", etc., which are editable items, and dataextracted from the comp sheets, which is not editable.
Edit Analysis Grid Lists1. Select Edit Lists from the top-right section of the Analysis Grid sheet2. At the top of the dialog, select the list you want to edit from the drop-down list3. Enter new items in the text box (top-right) and click Add To List. Likewise, you can move or
remove items from the list4. Click Save Changes
Edit Comp ListsComp lists are edited the same way, but from the comp sheet.
1.5.1.3 Creating Sales Analysis Grid Templates
This function saves a customized Sales Analysis as a template for future use.
Analysis grids and comp sheet templates are designed to be property-type specific and stay togetheras a set.
When a custom template is created, two components are customized; the analysis grid and the compsheet template, which are saved as a single workbook. Therefore, when a new project is started, theanalysis grid and a comp sheet template are both formatted for a specific property type.
Note: Before saving, do the following:
· Clear all adjustment text· Set all adjustments to 0
· Remove comparables
@Value Narrative Report Software 47
© 2003 @Value Software, LLC
1.5.1.4 Comp Sheets
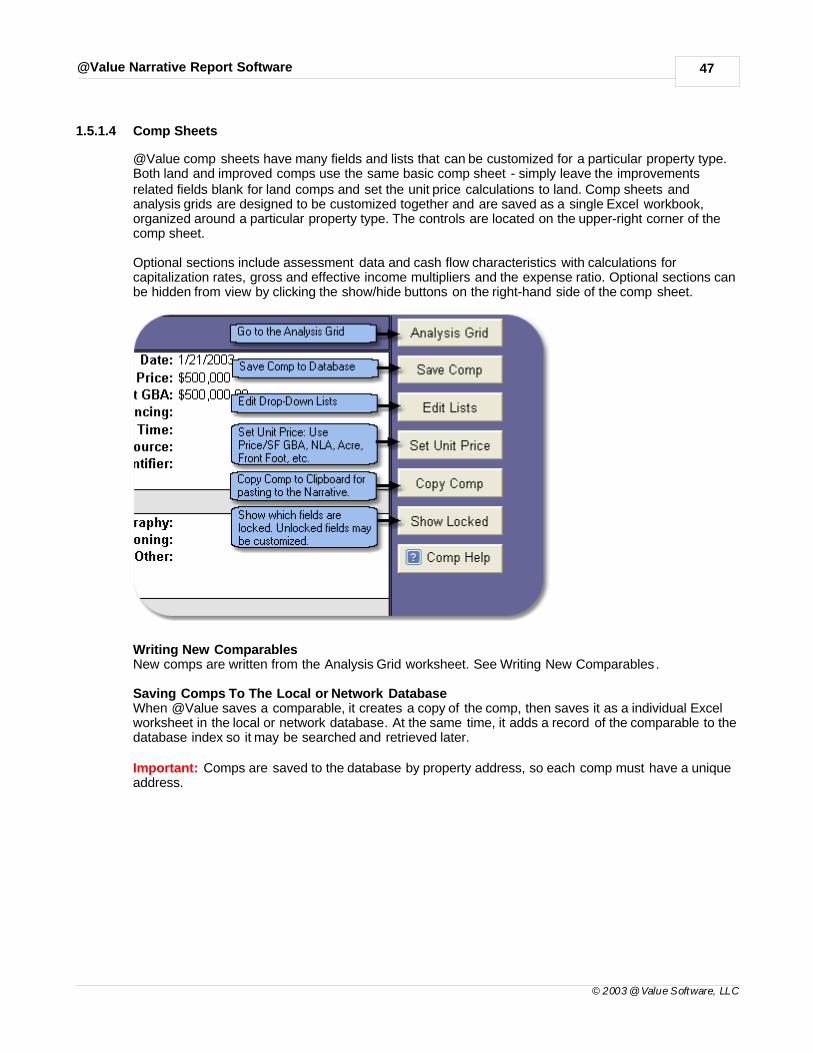
@Value comp sheets have many fields and lists that can be customized for a particular property type.Both land and improved comps use the same basic comp sheet - simply leave the improvementsrelated fields blank for land comps and set the unit price calculations to land. Comp sheets andanalysis grids are designed to be customized together and are saved as a single Excel workbook,organized around a particular property type. The controls are located on the upper-right corner of thecomp sheet.
Optional sections include assessment data and cash flow characteristics with calculations forcapitalization rates, gross and effective income multipliers and the expense ratio. Optional sections canbe hidden from view by clicking the show/hide buttons on the right-hand side of the comp sheet.
Writing New ComparablesNew comps are written from the Analysis Grid worksheet. See Writing New Comparables .
Saving Comps To The Local or Network DatabaseWhen @Value saves a comparable, it creates a copy of the comp, then saves it as a individual Excelworksheet in the local or network database. At the same time, it adds a record of the comparable to thedatabase index so it may be searched and retrieved later.
Important: Comps are saved to the database by property address, so each comp must have a uniqueaddress.

@Value Narrative Report Software 48
© 2003 @Value Software, LLC
Drop-DownsThese are designed to save input time, and to facilitate data consistency. Each drop-down has acategory and list associated with it. Many of the categories can be changed. The largest list is theProperty Type list, which uses the Appraisal Institute Commercial Database property typestandards. The 13 major categories are listed at the top of the drop-down list, then it is broken down to227 sub-categories below. As always, the lists are optional and can be edited/over-written. We suggestusing the AI standard in the interest of industry consistency. The remaining lists have a capacity of 16items, though parts of some lists may be reserved, leaving fewer editable items.
Edit Comp Sheet Lists1. Select Edit Lists from the top-right section of the comp sheet.2. At the top of the dialog, select the list you want to edit from the drop-down list.3. Enter new items in the text box (top-right) and click Add To List. Likewise, you can move or
remove items from the list.4. Click Save Changes
Locked CellsWhile attempting to keep as many cells unlocked and editable as possible, certain fields cannot bechanged in order to for the system to keep track of key data fields. To see what cells are locked, clickthe Show Locked button. All other fields may be customized.
Set Unit Price@Value can calculate the unit price for:
· Square Foot of Gross Building Area (GBA)· Square Foot of Net Leasable Area (NLA)· Square Meter of Gross Building Area· Square Meter of Net Leasable Area
· Square Foot of Land Area· Acre of Land Area· Acre of Usable Land Area· Front Foot
Note that the text describing the unit price on the comp sheet will change accordingly and the unit pricewill be calculated.

@Value Narrative Report Software 49
© 2003 @Value Software, LLC
Analyzing Unique Unit TypesIf the property type requires analysis of a unique unit type, such a price per slip, bed, hole, etc., utilizethe price per unit comparison.
Insert ImagesThe center section of the comp sheet is for digital maps, plans and/or photos. Click the Insert Imagesbutton to start Excel's Insert Picture dialog. You may need to resize and re-position the image after ithas been placed on the comp sheet. Re-position by dragging the image. To re-size, select the objectthen drag the handles at the corners, or, right-click the image, then select Format Object from theshortcut menu.
Enter/Edit NotesThe Notes section of the comp sheet is an embedded Word file. Double-click the notes area to activateWord. When finished, click anywhere outside of the Word edit area.
1.5.1.5 Writing New Comparables
Writing New ComparablesNew comps are written from the Sales Analysis Grid, which has a comparable template attached to theworksheet ("Standard Commercial Template").
Think of analysis grids are dual purpose:
1. Comparable templates2. Analysis grid templates
There are no stand alone comp templates - all comp templates are associated with an analysis grid.
From the Sales Analysis Grid, click the Manage Comps button (top-right). Then click the "Insert BankComp Sheet" button. This will insert a new blank comp sheet in the analysis. If it is the first compadded to the grid, the sheet tab (at the bottom) will be labeled Comp 1. After you have completed thiscomparable, click the Save Comp button to save it to the database. You may be prompted to choose alocal or network database if the network database component has been installed.
Note that if you opened a new Analysis Grid to for the purpose of writing a new comp, once the comphas been saved to the database, you do not need to save the analysis grid file.

@Value Narrative Report Software 50
© 2003 @Value Software, LLC
Important: Don't fill out the comp template - use the Comps Manager to insert a new blank Compsheet.
Tip: You can save time by setting the unit price and other options on the Standard Commercialtemplate sheet before you create new blank comps.
Do not include special characters in the comparable's address such as \ / ~ ; : * & % $ # @ !. Dashesand commas are acceptable.
Also, see Creating Sales Analysis Grid templates.
1.5.1.6 Grids Without Comp Sheets
Comp sheets are optional. The drop-downs will still include many adjustment related items to speeddata entry. Further, at the top left of the Adjustment Grid is an area that can be expanded to revealadditional items to identify the comparables.
1.5.1.7 @Value Clipboard: Sales Analysis
Type Of AnalysisSales Analyses can be categorized one of two ways:
1. As a stand-alone analysis. This can be land or improved property.2. As a land analysis that is part of the cost approach.
This selection tells the narrative software where to place the completed spreadsheets in the report.
Data FlowThe Data Manager is the first stage of data entry. From here, data flows to the spreadsheets via the@Value Clipboard. After spreadsheets are completed, spreadsheet data flows back to the narrative, asgraphic images, via the @Value Clipboard. The Sales Analysis Clipboard is organized by three tabs:
1. General2. Analysis Grid & Comp Images3. Analysis Type and Clipboard Options
The General TabThis tab displays data collected from the narrative Data Manager. Subject address, appraisal date,property rights, site and improvement items are collected from the Data Manager. With regard to siteand improvement data, the intent of the Data Manager and Clipboard is to collect basic elements mostoften used in the sales comparison analysis adjustment grid. It is not intended to be a comprehensive

@Value Narrative Report Software 51
© 2003 @Value Software, LLC
property description.
Each item has a checkbox and can be individually selected for pasting to the Analysis Grid, or, use the"Select All" button to select all items. Only selected items will be pasted the Analysis Grid.
Where Data From The General Tab Is PastedWhen items are pasted to the grid, they will appear in one or two places. The subject address, propertyrights, analysis date will be immediately visible on the Analysis Grid. If adjustment categories havebeen established and there are matching categories for site and improvement items, the clipboard datawill pasted next to the adjustment category in the subject column. For example if an adjustment itemhas been set up for "Zoning", the software will recognize this and place the subject zoning in thesubject column next to this item.
If there is not a matching adjustment item, the clipboard data is always available in the subject propertycolumn in the drop-down lists. These items are only visible when the cell is selected the drop-downarrow clicked.
Use the Analysis Grid and Comp Images tab to copy images of these spreadsheets to the @ValueClipboard, or to view the current clipboard content for these items.
The Analysis Type and Windows Clipboard tab has an option to change the type of sales analysisbeing copied to the clipboard. The default type of analysis is "Stand-Alone". The second option is aSales Comparison Analysis that is a component of the Cost Approach.
Use the Windows Clipboard to bypass the @Value Clipboard system and copy the active page to theWindows Clipboard. When pasting to the Word document, use Paste Special, Picture option. ClickEdit, Paste Special and select the Picture option.

@Value Narrative Report Software 52
© 2003 @Value Software, LLC
1.5.2 Sales Analysis And Database Overview
OverviewThe system is Analysis Grid centric, allowing you to perform all your sales analysis tasks from oneplace (the sales grid), including writing new comps or searching and importing previously documentedcomps.
Analysis grids and comp sheet templates are designed to be property-type specific and stay togetheras a set. The system allows the user to create custom templates, though it is very easy to customizean analysis grid and associated comp sheet template and on the fly.
When a custom template is created, two components are customized; the analysis grid and the compsheet template, which are saved as a single workbook. Therefore, when a new project is started, theanalysis grid and a comp sheet template are both formatted for the property type at hand.
The Analysis GridThe Analysis Grid can handle two to six comps but, you can store up to 10 comps with any SalesAnalysis Grid. The grid has 15 adjustment categories, though most of these can be hidden if not used.You can set up your adjustments anyway you like, but several common adjustment methods areincluded and can be implemented or customized at any point. You can also change the order of compsat any time. For example, if you move Comp 2 to the Comp 4 position, all of the adjustments andnarrative entries will also be moved. The comp data is automatically imported to the Analysis Grid;some of the comp data is immediately visible, most is accessed through various drop-down lists.
The Analysis Grid is populated with drop-down lists that are activated when a cell is selected. Many ofthese lists can be customized. Further, as noted above, many drop-down lists are populated with datafrom the various comp sheets associated with the Analysis Grid.
Information in drop-down lists are always optional, you can select an item from the list or type adifferent entry. Further, comp sheets are optional; data can be entered directly to the analysis grid andthere are optional extra rows to identify and describe the comparables when comp sheets are notused.
Other features include average and weighted average value calculations. These are optional and maybe hidden from view if not used.
The DatabaseThe database consists of two parts, the Database index worksheet and a folder named Comps wherethe individual comps are stored. See @Value Directory Structure.
New comparables are written from Analysis Grids, where the comp sheet templates are stored. Thistakes a little getting used to. It helps to think of sales grids as dual purpose: templates for new compsand templates for sales analyses.
The database index allows you to sort comps by selecting search criteria from drop-down lists. Youcan also preview/edit the comparables from here. @Value saves each comparable as a single Excelfile in the comps folder (..\atvalue\comps). Comps selected from the database are copied into thecurrent analysis as additional worksheets. @Value then collects the comp data and populates theanalysis grid and the drop-down lists with comp specific data.
Note: The Analysis Grid and Comp sheets are loaded with drop-down lists and formulas. Forflexibility most of these cells can be over-written, copied to and formatted.
What You Can Do: Over-write formulas, ignore drop-down lists and type different entries.What You Shouldn't Do: Cut/Copy, Drag & Drop.

@Value Narrative Report Software 53
© 2003 @Value Software, LLC
1.5.2.1 @Value Database
Adding Comparables To The DatabaseSee Writing New Comparables.
The @Value DatabaseThe @Value Database is accessed from the Analysis Grid (menu button, top right), or from the@Value Program Group (Click Start, Programs, then scroll to the @Value Program Group).
Local And/Or Network DatabaseBy default, the @Value will install a local database to the atvalue folder. Upon request, @Value willprovide registered users with a network database installation at no charge. The local and networkdatabases work the same way and are nearly identical.
The Local DatabaseThe local database consists of two parts, the Database index worksheet named "Comps Index.xls"and a folder named Comps where the individual comps are stored. Each Comp is saved as anindividual Excel worksheet and can be opened, edited and moved to another computer or emailed asyou would any normal Excel file. (@Value includes two sample comps. You can delete these byopening the Comps folder at ..\atvalue\comps. See the @Value Directory Structure. After you havedeleted the comps, remember to refresh the database.)
The Network DatabaseThe network database must be installed on the server by the network administrator. This databaseworks the same way as the local database, only it is located on a network server. Again, there are twoparts to the system, the Database index worksheet named "NW Comps Index.xls" and a folder namedComps where the individual comps are stored. By default, @Value will always open the localdatabase. Click the View Network Database button to switch to the network database (if installed).
The @Value Database:

@Value Narrative Report Software 54
© 2003 @Value Software, LLC
Search ComparablesSearch and sort comps via the drop-down lists. For example, to view all the comps for a particularproperty type, click the "Type" drop-down, then select the property type to view. The list will then showonly comps that match that property type. You can further sort by date ranges and other criteria.
In the example below, we have selected "Custom" from the Unit Price drop-down, then set the criteriato show comps with unit prices between $95 and $140.
Select ComparablesAfter sorting your comps list, flag the comp for importing by double-clicking the cell to the left.
When you have finished sorting and flagging comps, click the Save/Clear List button. This will bringup the following dialog:

@Value Narrative Report Software 55
© 2003 @Value Software, LLC
Click the Save List To Comp Manager For Importing.You may now exit the database. When you return to theAnalysis Grid, click the Comp Manager button, top-right,to import the comps to the analysis.
1.5.2.2 The Comp Manager
From the Analysis Grid, click the Manage Comps button. This will bring up the following dialog:
Select each comp from the left hand list (one at a time), then click Copy To Analysis >.

@Value Narrative Report Software 56
© 2003 @Value Software, LLC
Other Functions of the Comp Manager· Remove comps from the analysis· Change the order of comps
· Insert blank comp sheets
New CompsNew comps are written to blank comp sheets, then saved to the database. Note that data from compsheets will automatically populate the adjustment grid, but comp data entered directly to the analysisgrid will not automatically populate comp sheets.
Important: Don't fill out the comp template - use the Comps manager tools to create a new blankComp sheet.
Allow DuplicatesThis allows the same comp to be inserted to the current analysis more than once. This is handy forcomp write-ups of transactions where there is a similar sale already documented in the database.
1.5.2.3 Sharing Comp Data
When a comp is saved to the database, it is saved as an individual Excel file consisting of a singleworksheet, stored in the ..\atvalue\comps folder.
You can also manually copy/move any comp, group of comps or the entire comps folder to anothercomputer that have the @Value Narrative Software installed. After new comps have been manuallyadded to the comps folder, open the @Value Database and click the Refresh Database Index button.This will regenerate the list of comp data to reflect the contents of the comp folder. Note that if youhave a large number of comparables (100+), refreshing the database index may take several minutes.
Note: Only comps should be placed in the comps folder, otherwise, the database index will containfaulty records.
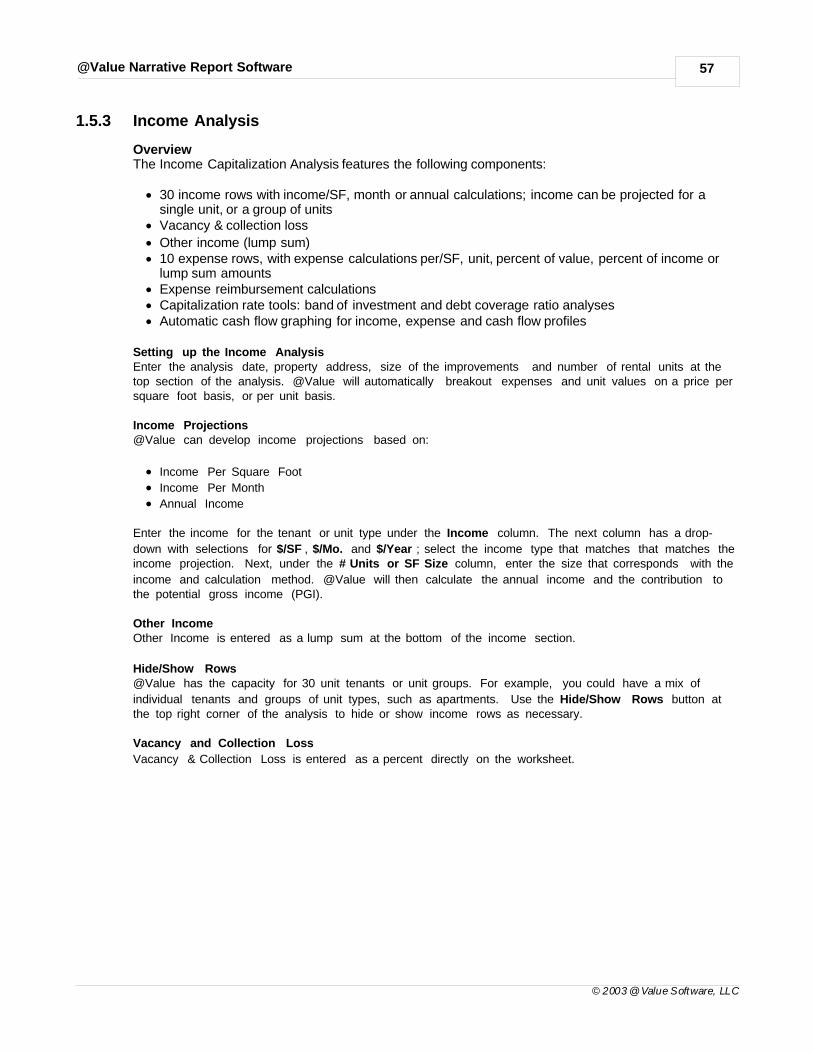
@Value Narrative Report Software 57
© 2003 @Value Software, LLC
1.5.3 Income Analysis
OverviewThe Income Capitalization Analysis features the following components:
· 30 income rows with income/SF, month or annual calculations; income can be projected for asingle unit, or a group of units
· Vacancy & collection loss
· Other income (lump sum)· 10 expense rows, with expense calculations per/SF, unit, percent of value, percent of income or
lump sum amounts· Expense reimbursement calculations· Capitalization rate tools: band of investment and debt coverage ratio analyses· Automatic cash flow graphing for income, expense and cash flow profiles
Setting up the Income AnalysisEnter the analysis date, property address, size of the improvements and number of rental units at thetop section of the analysis. @Value will automatically breakout expenses and unit values on a price persquare foot basis, or per unit basis.
Income Projections@Value can develop income projections based on:
· Income Per Square Foot
· Income Per Month
· Annual Income
Enter the income for the tenant or unit type under the Income column. The next column has a drop-
down with selections for $/SF , $/Mo. and $/Year ; select the income type that matches that matches theincome projection. Next, under the # Units or SF Size column, enter the size that corresponds with the
income and calculation method. @Value will then calculate the annual income and the contribution tothe potential gross income (PGI).
Other IncomeOther Income is entered as a lump sum at the bottom of the income section.
Hide/Show Rows@Value has the capacity for 30 unit tenants or unit groups. For example, you could have a mix of
individual tenants and groups of unit types, such as apartments. Use the Hide/Show Rows button atthe top right corner of the analysis to hide or show income rows as necessary.
Vacancy and Collection Loss
Vacancy & Collection Loss is entered as a percent directly on the worksheet.

@Value Narrative Report Software 58
© 2003 @Value Software, LLC
Entering ExpensesEnter the expense as a percent or dollar amount, formatting as necessary. The dollar amount can be
$/SF , $/Unit or a Lump Sum . Percent expense can be calculated as a percent of effective grossincome (EGI) or as a percent of value . The latter is handy for tax abatement work.
In the Expense Type column select from the drop-down list the expense type that matches theexpense percent or dollar amount.

@Value Narrative Report Software 59
© 2003 @Value Software, LLC
Reimbursable Expenses@Value has comprehensive expense reimbursement capabilities. Expense reimbursements areautomatically imported to the income analysis sheet and added to the Net Operating Income (NOI).See Expense Reimbursements .
Entering the Capitalization RateThe cap rate is entered on the worksheet directly under the net operating income. See CapitalizationRate Tools .
1.5.3.1 Capitalization Rate Tools
@Value includes two capitalization rate tools, Band of Investment and Debt Coverage Ratio. Edit thevariables at the top part of the sheet and the formulas will automatically recalculate.

@Value Narrative Report Software 60
© 2003 @Value Software, LLC
The Band of InvestmentThis technique utilizes lender and real estate investor investment criteria to develop, or synthesize acapitalization rate. There are four key inputs necessary for this method:
1. The loan-to-value ratio (M)2. The mortgage interest rate (i)3. The loan term (n)4. The equity cap rate or equity dividend rate (RE)
The mortgage variables are used to build the mortgage constant (RM), which is the total amount of thepayments made in one year, expressed as a percentage of the original loan amount.
Payments x 12 / Original Loan Amount = Mortgage Constant (RM)
The equity cap rate is the annual return to the investor, expressed as a percent of the original amountinvested. The annual return to the investor is also known as the equity dividend rate; it is the profitremaining after debt service and all other expenses.
After Debt Service Profit / Equity Investment = Equity Cap Rate (RE)
Note that the equity cap rate is not the same (usually, that is) as the equity yield rate. The equity yieldrate reflects the total return to the investor over the life of the investment. Factors such as appreciationand mortgage pay down affect and usually increase this return to a point higher than the equitydividend rate. In markets where substantial appreciation is expected, investors will often accept a lowor even negative equity dividend rate, anticipating a compensating payoff when the property is

@Value Narrative Report Software 61
© 2003 @Value Software, LLC
eventually sold. In markets where little appreciation is expected, much more weight is given to theannual equity dividend.
Formula:
RM x M = rateRE x (1-M) = rate
= Cap Rate (Ro)
Debt Coverage Ratio AnalysisThis technique develops a capitalization rate based on typical mortgage terms. There are fourvariables necessary for this method:
1. The loan-to-value ratio (M)2. The mortgage interest rate (i)3. The loan term (n)4. The debt coverage ratio (DCR)
Items 1 through 3 are discussed above under the Band of Investment section. In this method it is alsoused to develop the mortgage constant (RM). The debt coverage ratio is the factor by which incomeexceeds debt on an annual basis.
Formula:
Debt Coverage Ratio x Loan to Value Ratio x Mortgage Constant = Ro
or
DCR x M x RM = Ro
1.5.3.2 Expense Reimbursements
Expense ReimbursementsExpense Reimbursements are expense items passed through to or reimbursed to the propertyowner(s) by the tenants. Expenses may be reimbursed according to the tenant's proportional squarefoot area or proportional income contribution, or user-defined by the analyst.
Navigating the Expense Reimbursement SheetIt is important to navigate the expense reimbursement sheet by using the drop-down list at the top-leftcorner of the sheet. This will move the menu with you as you move from tenant to tenant.
Expense Reimbursement OptionsThere are four options:
1. "% of Area" will calculate the proportional share of each expense, based on the tenant'sproportion of building area. If the tenant's square foot area is not defined on the valuation worksheet(if for example, the rent is calculated monthly) , click the "Edit Area" button and enter the tenant'ssquare foot area.
2. "% of Income" will calculate the proportional share of the expense, based on the tenant's share ofthe income stream. This is based on potential gross income.
3. "User-Defined" unlocks the Tenant column, and allows the user to enter amounts directly. Note:This will over-write the formulas in the cells, and they cannot be restored.
4. "None" will set the reimbursements to zero.
Each expense has a Yes/No option to activate or deactivate reimbursement calculations. Type "Yes" or

@Value Narrative Report Software 62
© 2003 @Value Software, LLC
"No".
Tip: Double-click the cell to toggle between "Yes" and "No".
Expense Stops: Enter the amount of the expense not reimbursed by the tenant. This amount isdeducted from the reimbursement amount allocated to the tenant.
1.5.3.3 @Value Clipboard: Income Capitalization
Data FlowThe Data Manager is the first stage of data entry. From here, data flows to the spreadsheets via the@Value Clipboard. After spreadsheets are completed, spreadsheet data flows back to the narrative, asgraphic images, via the @Value Clipboard. The Income Analysis Clipboard is organized by two tabs:
1. General2. Valuation Worksheet & Images
Use the @Value Clipboard for general data, such as property address, analysis date and certainsubject physical characteristics that are applicable to the income capitalization analysis, such asnumber of units, gross building area, etc.
Additionally, images of the Valuation Worksheet, Expense Reimbursements, Cap Rate Calculationsand the three cash flow graphs can be copied to the clipboard. Note that when Income Capitalizationimages are pasted from the @Value Clipboard to the narrative document, the software looks forcertain bookmarks to identify the location to paste the various images. See @Value Clipboard:Narrative for a table of bookmarks that @Value uses.

@Value Narrative Report Software 63
© 2003 @Value Software, LLC
To paste, the item must be checked. Note there is a "Select All" toggle button. Only information on theGeneral tab may be pasted from the clipboard to the Valuation Worksheet. Worksheet and chartimages can only be copied to the clipboard.
Use the Valuation Worksheet and Chart Images tab to copy images of the worksheets and charts tothe @Value Clipboard, or to view the current clipboard content for these items.
A Note About Expense Reimbursements: If there is more than one page of expensereimbursements, it is more efficient to print directly from Excel and insert the pages into the document.
The Expense Reimbursements worksheet can be very tall, encompassing several pages. Each 8.5" x11" area can hold three reimbursement tables. Therefore, if the analysis has 30 leases, there will beten pages of reimbursement tables. The copy function will copy the current print range of the ExpenseReimbursement sheet. This can include a single page (set of three reimbursement tables) or severalpages. If the print range is greater than one page, the reimbursements will not display properly whenpasted to Word.
It is therefore recommended that the Expense Reimbursements worksheet be printed while in Excelthen inserted into the Word document if there are more than one page of expense reimbursements.
The Windows ClipboardTo bypass the @Value Clipboard, use the Windows clipboard option. This will copy the print area ofthe active sheet to the Windows Clipboard. For best results in Word, paste the spreadsheet as apicture. In Word, click Edit, Paste Special and select Picture.

@Value Narrative Report Software 64
© 2003 @Value Software, LLC
1.5.4 Cost Analysis
OverviewThe Cost Analysis features the following components:
· 10 categories for building component costs· 5 categories for site improvements
· 4 soft cost categories· Contingency and entrepreneurial costs· Automatic allocation of building and site costs· Site items depreciation· Building items depreciation· Functional and external obsolescence depreciation· Location for incorporating additional cost sections (create up to 5 cost sections)· Land value summary
· Cost Approach value summary· Copy to clipboard· Hide or show various sections and items
Building Cost ComponentsThe cost analysis is populated with common building cost components in the drop-down lists. Choosean item from the list or type a new entry. Next select or enter the type of measure for the costcomponent (Sq. Ft., Lump Sum, etc.). Finally enter a quantity and cost for the item. @Value will thencalculate the component cost. Note this section can contain a detailed break-out of cost componentsor single cost item. The level of detail is very flexible.
Site Cost ComponentsSite costs are calculated the same way as the above building costs.
Soft Costs, Contingency and ProfitSoft costs can be calculated based on a percentage of the building cost or building and site costscombined. The soft cost categories can be changed by the user.
Contingency and profit are based on a percentage of the total project cost. Note that the Profit cellcontains a drop-down list with various profit labels, such as Developer's Profit and Builder's Profit.
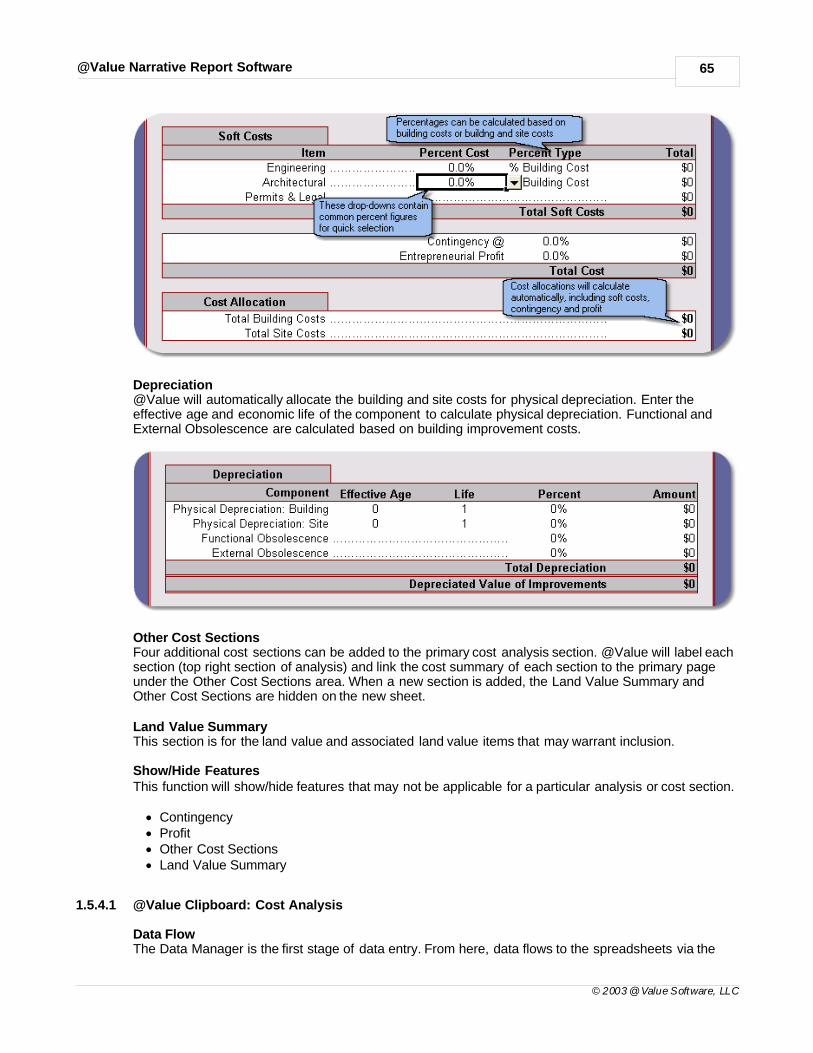
@Value Narrative Report Software 65
© 2003 @Value Software, LLC
Depreciation@Value will automatically allocate the building and site costs for physical depreciation. Enter theeffective age and economic life of the component to calculate physical depreciation. Functional andExternal Obsolescence are calculated based on building improvement costs.
Other Cost SectionsFour additional cost sections can be added to the primary cost analysis section. @Value will label eachsection (top right section of analysis) and link the cost summary of each section to the primary pageunder the Other Cost Sections area. When a new section is added, the Land Value Summary andOther Cost Sections are hidden on the new sheet.
Land Value SummaryThis section is for the land value and associated land value items that may warrant inclusion.
Show/Hide FeaturesThis function will show/hide features that may not be applicable for a particular analysis or cost section.
· Contingency· Profit· Other Cost Sections· Land Value Summary
1.5.4.1 @Value Clipboard: Cost Analysis
Data FlowThe Data Manager is the first stage of data entry. From here, data flows to the spreadsheets via the

@Value Narrative Report Software 66
© 2003 @Value Software, LLC
@Value Clipboard. After spreadsheets are completed, spreadsheet data flows back to the narrative, asgraphic images, via the @Value Clipboard. The Cost Analysis Clipboard is organized by two tabs:
1. General2. Cost Analysis Images
Use the @Value Clipboard for general data, such as property address, analysis date and certainsubject physical characteristics that are applicable to the cost analysis, such as number of units, grossbuilding area, etc.
Additionally, images of the Cost Analysis worksheets can be copied to the clipboard. Note that whenCost images are pasted from the @Value Clipboard to the narrative document, the software looks forcertain bookmarks to identify the location to paste the various images. See @Value Clipboard:Narrative for a table of bookmarks that @Value uses.
To copy, the item must be checked. Note there is a "Select All" toggle button. Only information on theGeneral tab may be pasted from the clipboard to the Cost Analysis. Images of the Cost Analysisworksheets can only be copied to the clipboard while in the Cost Analysis.
Use the Cost Analysis Images tab to copy images of the cost analysis worksheets @Value Clipboard,or to view the current clipboard content for these items.

@Value Narrative Report Software 67
© 2003 @Value Software, LLC
About General Clipboard DataAs noted, certain data pasted from the clipboard goes to the drop-down lists in the cost analysisworksheet. These drop-lists are always optional. To make changes to the information in drop-downlists, open the @Value Clipboard and make changes there. This way the changes will be available toall of the drop-down lists.
The Windows ClipboardTo bypass the @Value Clipboard, use the Windows clipboard option, located on the Cost AnalysisImages tab. This will copy the print area of the active sheet to the Windows Clipboard. For best resultsin Word, paste the spreadsheet as a picture. In Word, click Edit, Paste Special and select Picture.

@Value Narrative Report Software 68
© 2003 @Value Software, LLC
1.5.5 Other Analysis Tools
@Value's capitalization rate tools that are part of the income analysis worksheet are also available asstand-alone tools. See Capitalization Rate Tools.

Index- $ -$/Mo 57
$/SF 57
$/Unit 57
- @ -@Value Customers 4
@Value Database 53
@Value Directory Structure 52
- A -Add To List 46
Adding a New AutoText Entry 29
Adding Components to the Report Wizard 29
adjustment categories 52
Adjustment Grid 44
adjustment methods 39
Advisory Opinion No. 15 9
Allow Duplicates 55
Analysis Grid 52
Analysis Grid Options 39
Analysis Mode 39
analysis tools 38
Annual Income 57
annual return 59
AntiVirus 6
Appraisal date 8
Appraisal Institute Commercial Database 47
Appraisal Purpose 8
Appraisal Type 9
Area/Market Analysis 12
Assessment 12
AutoText 29
AutoText Entries 29
AutoText Utilities 29
Average 44
AVG 6
avnarrative.dot 29
- B -Backup 29, 32
Backup @Value 32
Backup @Value AutoText 32
Backup AutoText 32
Backups 29, 32
Band of Investment 59
bookmark 36
- C -calculate the unit price 47
Calculation Method 57
cameras 34
cap rate 38
Capitalization 38, 59
Capitalization Rate 15, 59
Certification 16
change the order of comps 52, 55
Client 8
comp sheet template 39
comp sheets 47
Comp sheets are optional 50
comparison row 44
comparison rows 39
Complete 9
Complete Appraisal 24
comps 47
Comps Index.xls 52, 53
Conditions of Sale 39
Copy a Report 24
Copy to Clipboard 39
Cost Analysis 13
Cover Page 12
Create comp 47
Create new bookmarks 36
cross reference 36
Custom Entries 28
custom template 46
custom templates 52
customize a comp sheet 52
customized Sales Analysis 46
@Value Narrative Report Software 69
© 2003 @Value Software, LLC

- D -Data Manager 17
Data Manager Overview 17
Database 26, 52
database folder 47
Database index 52, 53
date of sale 39, 44
Debt Coverage Ratio 59
debt service 59
Delete bookmarks 36
Delete Comp 55
Departure 9, 10
Departure Rule 9
Departure Wizard 10
Depreciation Analysis 13
Destination file 32
digital maps 47
Discount Rate 15
Distribute AutoText 32
dollar adjustment 44
Drop-Downs 47
- E -Economic Trends 39
Edit Analysis Grid Lists 46
Edit Comp Sheet Lists 47
Edit Drop-Downs 39
Edit Lists 46
email support 4
Embed A Spreadsheet 26
Embedded Spreadsheet 26
Enter/Edit Notes 47
Entering Expenses 57
equity 59
equity cap rate 59
equity dividend rate 59
equity yield rate 59
Expense Analysis 15
Expense History 15
expense reimbursement 38
Expense Reimbursements 61
Expense Stops 61
Expenses 57
- F -fields 17
Financing 39, 44
fixed categories 39
footers 16
Format Object 47
free copy of the software 29
free upgrades 4
- G -global changes 17
Grid Lists 46
Grid Options 39
Gross Building Area 47
- H -headers 16
Hide/Show Rows 57
Highest and Best Use 12
Hypothetical 8
- I -Import The Comps 55
Importing Appraisal Data 28
improved comps 47
Income 57
Income Analysis 57
Income Cap 57
Income Capitalization 57
Income Capitalization Analysis 38, 57
Income History/Actual 15
Income Per Month 57
Income Per Square Foot 57
Income Projections 57
Insert blank comp 55
Insert blank comp sheets 55
insert bookmark 36
Insert Images 34, 47
install 2
Installation 2
Installation Instructions 2, 3
Intended Use 8
Index 70
© 2003 @Value Software, LLC

Intended User 8
Interest Appraised 8
investors 59
- L -land and improved comps 47
Land Valuation 13
license 4
Limited 9
Limited Appraisal 9, 24
Limiting Conditions and Assumptions 16
Limiting Conditons 8
loan term 59
loan to value 59
loan-to-value 59
loan-to-value ratio 59
Local 53
Local Database 53
location 44
location adjustment 44
Locked Cells 47
- M -Main Menu 39
Make Available To Report Wizard 29
Manage Comps 39
map network 3
map network connections 3
Market Data 14
McAfee 6
Methodology 12
Modes of Operation 17
mortgage 59
Mortgage Constant 59
mortgage interest rate 59
Multi-Family 24
- N -narrative component 12
narrative description rows 39
Navigate 36
Net Leasable Area 47
Network 32, 53
Network AutoText 32
network connections 3
Network Database 53
Network Installation 3
Network Narrative 32
networking capability 56
Networking The Database 56
new comp 47, 55
new comparable 53
new comps 47
Norton 6
Number of Comps 39
- O -Office 24
Open Database 39
Order Comp 55
order of comps 55
Organizer 29
Other Income 57
- P -percent adjustment 44
percent adjustments 39
percent of effective gross income 57
percent of value 57
photograph 34
picture 34
Picture Tables 34
picture tool 34
Placeholder 28
post sale expenses 44
preview/edit 52
Pricing 4
property address 47
Property Rights 39, 44
Purchase 4
- Q -Qualifications 16
- R -razing improvements 44
Reconciliation 16
@Value Narrative Report Software 71
© 2003 @Value Software, LLC

references 17
Refresh Analysis Grid 39
Refresh Database 56
Register 4
Registration 4
Remove comps 55
Rent Per Month 57
Rent Per Square Foot 57
Rent Projections 57
Rental/Income 15
Report 24
report component 29
Report Mode 18
Report Type 9
Report Wizard 7, 8
Reports 24
Restore 29, 32
Restore @Value AutoText 32
Restore @Value AutoText Entries 32
Restore AutoText 32
Restricted 9
Restricted Appraisal 24
Retail 24
Retail/Office 24
- S -Sales Analysis 14
Sales Comparison Analysis 26
Sales Comparison Analysis and Database 38
Save as Template 39
save comp 53
save comp to database 53
save comparable 53
save comps 47
Save/Clear List 53
Saving Comps 47
scale 34
Scope 12
Search Comparables 53
Select Comparables 53
Self-Contained 9
Set Individual Adjustments 39
set the unit price 47
Set Unit Price 47
Share Comp 56
Sharing Comp Data 56
Show Locked 47
sort comps 53
stand-alone 38
Stand-Alone Spreadsheet 38
Standards No. 7 9
Starting @Value Analysis Tools 38
Subject Description 12
Summary 9
Summary Data 18
Summary of Salient Facts 12
Support 4
Support agreements 4
- T -Time 39
Time Adjustment 44
Toll free 4
transmittal 8
- U -unique address 47
Unique Unit Types 47
unit price 44, 47
user-defined adjustments 39
USPAP Departure 7
USPAP Departure Rule 9
- V -Vacancy 15, 57
Vacancy and Collection Loss 57
Virus 6
- W -Weighted Average 44
Worksheet Object 26
write comp 47
- Z -Zoning 12
Index 72
© 2003 @Value Software, LLC


