VALUE INVEST by Valuation & Research Specialists www.valueinvest.gr Issue 1, 2 nd Semester 2007 • Greek Economy & Equities • Market Risk • Real Options & Pricing of Shares • Creating an Effective IR Paradigm • Saving versus Investing • Greek M&A in Turkey • Past Oil Crises • Valuing Banking Stocks • Case Studies • The Art of Minimalism
When we started forming the Value Invest Magazine atVRS (Valuation & Research Specialists) a few monthsago, we had in mind a “new generation” magazine thatincorporates new voices and ideas destined for theinternational market of professionals in the securitiesand investment banking industry.This magazine is written and applied by practitioners.We wish to offer the readers, insights from some of ourfavorite commentators in the finance area, from boththe professional and the academic community.
As we are professionals in financial analysis andvaluation of listed and non-listed companies, withextensive insight in several businesses, our magazine’smission is also to serve our business philosophy andvision. As a result, we have put a lot of effort onpresenting a number of relevant issues and real casestudies that we believe will provide useful information,way of thinking and methodologies to the readers.In the current issue, as well as future ones, we will tryto present “fresh” financial tools and business ideasthat combine innovation and technology featuringsmall and medium sized organizations.
Here at Value Invest Magazine, we have made aconcerted effort to deliver more valuableinformation to readers like you.
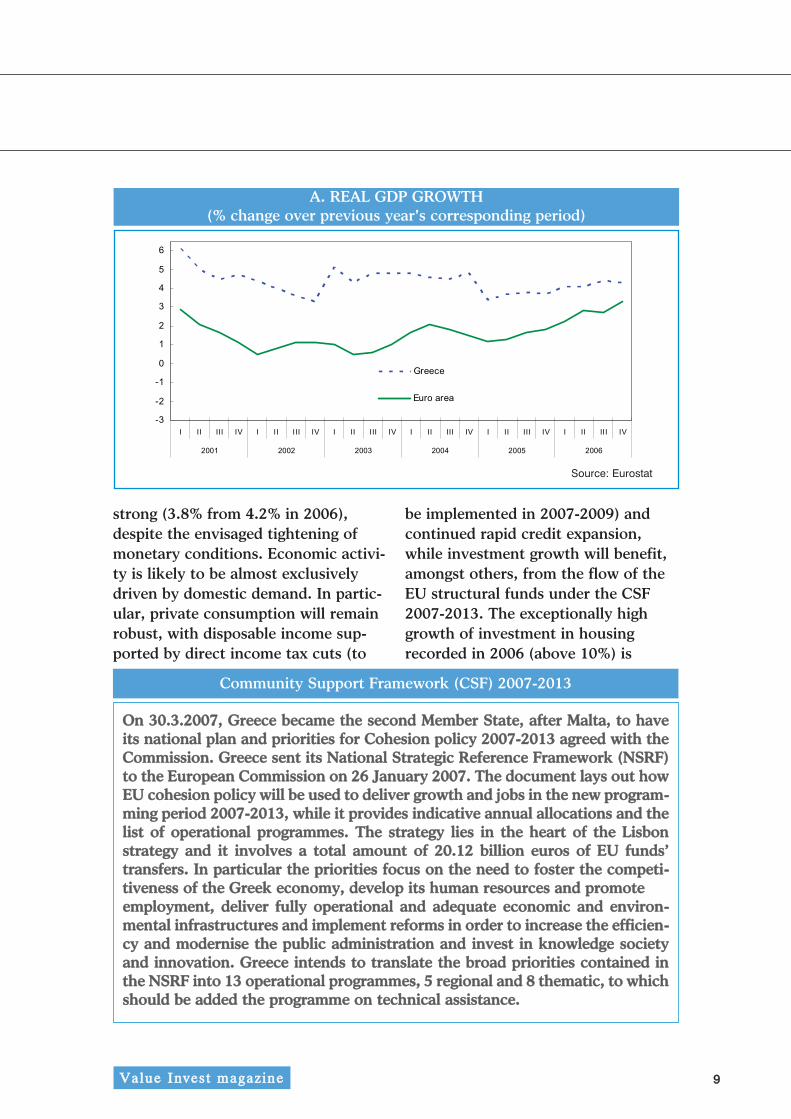
The Greek economy continued toexpand at a buoyant rate, recording areal GDP growth of 4.3% y-o-y in Q42006 and of 4.2% in 2006 as a whole,despite the high and volatile energyprices and the tightening of the fiscaland the monetary policy. This annualrate of growth was significantly higherthan the respective rate of 2.6% of theeuro area and 3.2% of the EU-27,placing Greece amongst the fastestgrowing advanced economies inEurope. The main factors that havesupported the strong and continuousgrowth over the last decade (4.1%period average), i.e. the high rates ofprivate consumption and investmentgrowth, are still in effect. Indeed, pri-vate consumption grew by 3.4% in2006, underpinned by rising real dis-posable income -which grew roughlyby 4.0% in 2006 compared to 2.0% in2005-, increasing household wealth,due to the rising market value of realestate property, and continued rapidcredit expansion. In the same vein,gross fixed capital formation increasedby 6.3% in 2006, driven mainly bystrong corporate investment and pri-vate investment in the housing sector.
The improved profitability of the busi-ness sector, supported by robustdomestic and foreign demand, coupledwith the favourable lending conditionsand the considerable investmentincentives within the framework ofthe Investment Law (in effect sinceMarch 2005) have resulted in accelera-tion of corporate investment by 6 to8% in 2006. On the other hand, theannual contribution of net exports toGDP growth continued to be negative.Consistent with sustained growth, inQ4 2006 unemployment fell sharply to8.8% (from 9.7% in Q4 2005), whileemployment further increased.Looking forward, growth is projectedto decelerate in 2007, but remain
DYNAMIC SECURITIESVALUATION & RESEARCH SPECIALISTS
VVaalluuee IInnvveesstt mmaaggaazziinnee
Greek Economy & EquitiesQuarterly Review, April 2007
99
strong (3.8% from 4.2% in 2006),despite the envisaged tightening ofmonetary conditions. Economic activi-ty is likely to be almost exclusivelydriven by domestic demand. In partic-ular, private consumption will remainrobust, with disposable income sup-ported by direct income tax cuts (to
be implemented in 2007-2009) andcontinued rapid credit expansion,while investment growth will benefit,amongst others, from the flow of theEU structural funds under the CSF2007-2013. The exceptionally highgrowth of investment in housingrecorded in 2006 (above 10%) is
Α. REAL GDP GROWTH(% change over previous year's corresponding period)
Source: Eurostat
1100
expected to ease somewhat in 2007, asthe stock of available houses hasincreased along with the households’mortgage repayment burden, due tothe interest rates rise. Exports’ volumeof goods and services is likely toincrease as well, due to the sustainedgrowth of the international economyand trade. The annual unemploymentrate is projected to drop towards8.3%, the lowest of the last decade.The Greek authorities revised upwardsthe level of GDP by 25.7% in 2006.The Greek Statistical Office hasexplained that this major revision is,amongst others, the result ofimproved measurement of the fast-growing services sector. The revisedGDP figures are currently being exam-ined thoroughly by Eurostat, so thefinal approval should not be expectedearlier than autumn 2007.Turning to price developments, thefall in oil prices has had a sizeableeffect on headline inflation sinceSeptember 2006, while indirect tax
increases and secondary effects fromhigh energy prices and high unitlabour cost growth have resulted inrelative high core inflation (i.e. head-line inflation excluding fresh food andenergy prices). Headline inflation fellto 3.2% in 2006 (from 3.5% in 2005) -and is expected to continue its down-ward trend in 2007, but remain elevat-ed (2.9%) - while core inflationreached 2.7%. Given the favourableeconomic environment, monetary pol-icy continues to be on the accom-modative side, with the key ECB inter-est rates moderate, money and creditgrowth vigorous, and liquidity in theeuro area as a whole ample. However,as upside risks on the demand sideremain, the ECB raised once again itspolicy rate on 14 March 2007 by 25basis points to 3.75%.The implementation of the 2006 budg-et may be considered as satisfactorywith current revenues growing at ratesof 10.4% in 2006 from 5.6% in 2005,considerably above the rate of nomi-
Dynamic Securities - Valuation & Research Specialists
VVaalluuee IInnvveesstt mmaaggaazziinnee
Β. INFLATION RATE(% change over previous year's corresponding period)
1111VVaalluuee IInnvveesstt mmaaggaazziinnee
C. Greece: International Trade
Source: Greek Statistical Office.
nal GDP growth (7.8%), aided by therecovery of VAT revenues and, to alesser extent, the increased settlementrates of overdue tax liabilities. Thereis still room, however, for the govern-ment to cash in larger part of the sub-stantial amount of overdue tax liabili-ties, which have ballooned during thepast few years. The negative effect onthe fiscal revenues from the reductionof corporate tax rate from 32% in2005 to 29% in 2006 was partly offsetby some indirect tax increases ontobacco, mobile phones and gasolinein July 2006, the introduction of VATon real estate transactions and somelump sum revenues, such as the 315million euros from the taxation ofcommercial banks’ reserves. Primaryexpenditure decelerated significantlyto 3.7% in 2006, from the substantial-ly elevated levels in 2004-2005, whilethe deficit of the public investmentbudget has been retained to 2.3% of
GDP, due to increased flows of EUfunds and reduced public investmentexpenditure. Overall, the general gov-ernment deficit fell substantially to2.6% of GDP in 2006 from 5.5% ofGDP in 2005 and 7.9% of GDP in2004, as recently confirmed byEurostat. In structural terms, theadjustment has been expenditure-driv-en, but also several measures intro-duced in order to tackle tax fraud andevasion, like the improvement of taxadministration, combined with thebroadening of tax bases have raisedthe level of revenues. According to theEuropean Commission’s estimates,Greek fiscal deficit will remain in 2007below the Maastricht Treaty’s 3% ofGDP limit, increasing thus the likeli-hood of Greece soon exiting from theExcessive Deficit Procedure. The long-term consolidation and sustainabilityof public finances, however, will notbe possible without wide-range
1122
reforms of the pension and health caresystems.On the external front, despite the rela-tive strong growth of exports of goods(13.8%) and of tourist receipts (4.8%),the current account deficit furtherworsened to 12.1% of GDP in 2006, asimports of goods accelerated to23.2%, mainly due to increased oiland shipping payments [Note 1] androbust private consumption. RecentBoG data indicate that in January-February 2007, the current accountdeficit widened by 41,136 million overthe same period of 2006 and reached45,913 million, reflecting mainly ahike in the trade deficit. In the sameperiod, direct investment showed anet outflow of 41,901 million (com-pared with a net inflow of 4364 mil-lion in the same period of 2006).Overall, developments in the balanceof payments indicate that the highgrowth of domestic demand and thecontinuous worsening of competitive-ness with respect to unit labour costsare the cause of the rapid deteriora-tion of the current account balance. Infact, real effective exchange rate hasappreciated by 20-30% on a unitlabour cost basis and by 10% on a CPIbasis since EMU accession [Note 2].In the same vein, conjectural indica-tors point to continuing robust growthin domestic demand. According to thelatest figures, the turnover in retailtrade recorded a rise by 14.7% at cur-rent prices in December 2006 as com-pared to December 2005, while thevolume of retail trade (i.e. turnover in
retail trade at constant prices)increased by 10.5% in the respectiveperiod. The increase derived mainlyfrom furniture, electrical equipment,household equipment, clothes andfootwear sales.Several of the large global retailerswho have recently entered the marketare already expanding rapidly acrossthe country, attempting to gain mar-ket share through highly competitiveoffers, boosting durable goods sales.Growth in manufacturing productionrose by 1.4% in 2006, despite the con-tinuing substantial decline in the pro-duction of textiles and clothing as aresult of international competitionthat affects both Greece’s domesticmarket and its main trading partners.Amongst the main industrial group-ings, of particular importance was theproduction increase in capital goodsand consumer durables. Business con-fidence as measured by the PMI indexmoved above the neutral 50 mark inJanuary 2007 to 51.8, after havingfallen to 49.9 in December. The vol-ume of residential construction activi-ty (as measured by building permits)
Dynamic Securities - Valuation & Research Specialists
VVaalluuee IInnvveesstt mmaaggaazziinnee
1133
registered a decrease of 14.4% in2006, as the frenzied activity in permitissuance in 2005 cooled down signifi-cantly in the course of 2006. In 2005,prospective home owners attemptedto secure a permit prior to the intro-duction of the new tax measures,which came into effect at the start of2006 (19% VAT in combination with asubstantial rise in tax-assessed valuesof houses).Total credit expansion continued togrow at double-digit rates in Q4 2006(14.5%), despite the increase in inter-est rates, but is expected to slow downgradually to more sustainable levels in2007 and 2008. In January 2007, totalcredit eased somewhat at 12.9% y-o-y,reflecting, to a great extent, thedecrease in credit supplied to the gen-eral government (January 2007: -8.1%, Q4 2006: -3.0%). Indeed, totalcredit to the general governmentshowed high volatility in 2006 andnegative growth from October andonwards, due, primarily, to the lowernet borrowing needs of the public sec-tor and, secondarily, to the MFIs’portfolio adjustments in holdings of
securities issued by the Greek state.Meanwhile, credit growth to enterpris-es and households slightly deceleratedin 2006 to 20.6% from 21.8% in 2005(January 2007: 19.9%, compared to21.0% a year earlier), but remainedstrong [Note 3]. This development islinked with the buoyant growth ofcorporate investment during 2006supported by improved business confi-dence, favourable terms of borrowing,relatively relaxed credit screening cri-teria and low interest rates, despitethe increases. Also, corporate bondshave gradually gained ground as a pre-ferred method of funding due mainlyto tax exemptions [Note 4]. Loans todomestic households reached 44.0%of GDP at end-December 2006, from38.0% at end-December 2005 (incl.securitized loans), compared to 54.3%of GDP in the euro-zone over thesame period. Mortgage lendinggrowth, although it cooled down com-pared to the 2005 hikes (Q4 2006:28%, Q4 2005: 31.5%), remained wellabove the respective one in the euroarea (December 2006: 9.5%).
VVaalluuee IInnvveesstt mmaaggaazziinnee
1144
Dynamic Securities - Valuation & Research Specialists
VVaalluuee IInnvveesstt mmaaggaazziinnee
Sources: IMF, European Commission, Bank of Greece, OECD, Ministry of Finance
1155
BBuullggaarriiaa::Bulgaria’s economy expanded by 6.2%in 2006 (compared to 5.5% in 2005)and is projected to achieve the samelevel of growth in 2007. Despite therestrictive measures undertaken torestraint credit expansion and the risein consumer prices, private consump-tion expanded, as well as investment,which had only marginally slowed inH2 2006. The economy currentlyenjoys large capital inflows, which areprojected to increase further in thefollowing years, benefiting from EUaccession and transfers and theannounced cut of the corporate taxrate from its current level of 15% to10% in 2007. Developments in theexport market improved, but growthof imports’ outpaced that of exports,resulting in further deterioration ofthe current account deficit to 15.9%of GDP in 2006 from 11.3% of GDP in
2005. Although these deficits havebeen largely financed by inflows offoreign direct investment in recentyears, they are associated with strongdomestic demand growth and repre-sent an important challenge for theauthorities. Inflation, as measured bythe CPI, increased to 7.3% in 2006(from 5.0% in 2005), mainly due to ahike of excise duties, as a result of taxharmonization with the EU, and highinternational energy prices. CPI infla-tion is forecasted to decrease at 5.3%in 2007. Unemployment fell in 2006for the first time in recent years toone-digit figure (9.0%) and is expectedto continue its downward trend.Turning to fiscal policy, the govern-ment, mimicking developments in itsneighbour and accession partnerRomania, approved a future reductionof the budget surplus, which exceededthe target budget surplus of 3% in
VVaalluuee IInnvveesstt mmaaggaazziinnee
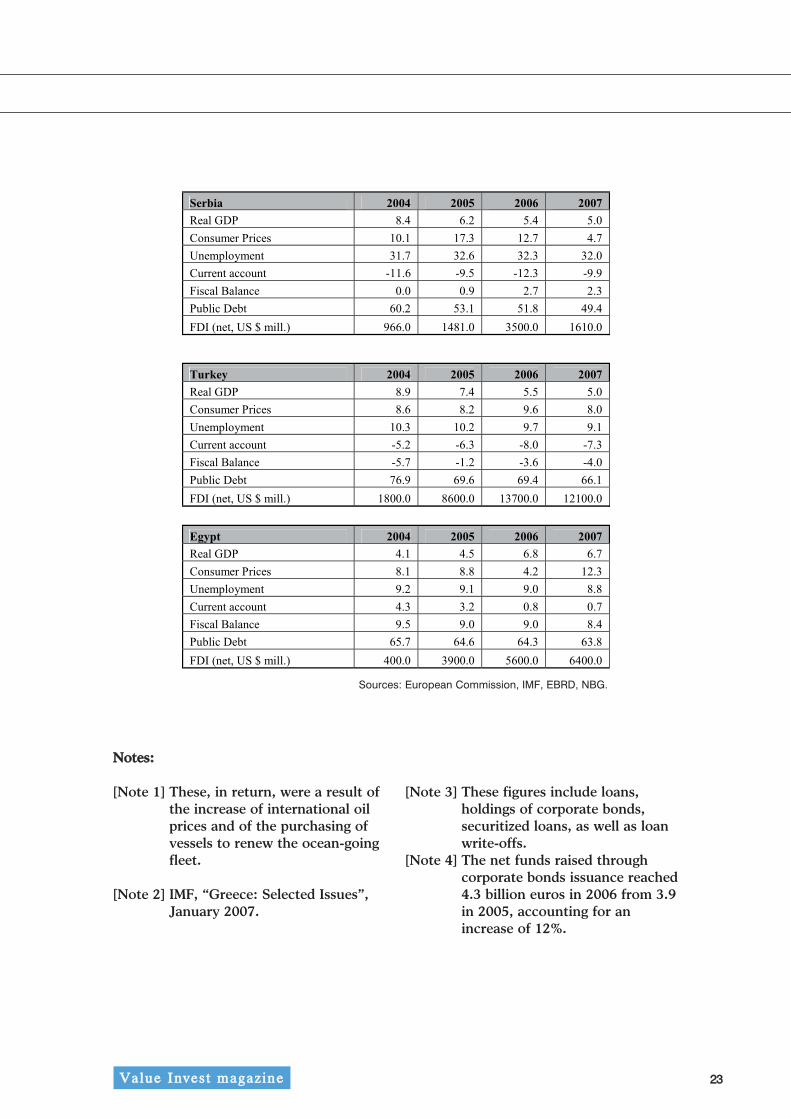
Note on South-eastern Europe (Bulgaria, Romania, Albania,FYROM, Serbia and Montenegro) and Mediterranean countries(Turkey, Egypt)
2006, to 0.8% of GDP in 2007 and0.6% in 2008, on the basis of neededEU accession-related infrastructureinvestments. Government also plansto enter the Exchange RateMechanism- 2 (ERM-II) around spring2007 with the aim to adopt euro by2012.
RRoommaanniiaa::Economic activity in 2006 bouncedback strongly to 7.7%, after the slow-down to 4.1% in 2005, driven by abroad-based recovery in industrialactivity, construction and agriculture.Particularly in Romania, total outputis generated to a relatively largedegree in agriculture (14.3%) andindustry (36.8%, including construc-tion), compared with 1.9% and 26.2%respectively in the EU-25. Since thestart of the transition process towardsa market economy, however, a pro-found structural reorientation hastaken place from agriculture andindustry towards services. Domesticdemand, fostered by rapid privateconsumption and investment growth,has been the main engine of growth inthe post-flooding reconstruction peri-od. Net exports remained a drag onthe economy with imports growingalmost twice as fast as exports.Despite the growth in export volumes,after the slump in 2005 due to theremoval of trade and textile quotas onChinese imports, the current accountdeficit widened considerably in 2006to 10.3% of GDP. CPI Inflation fell to6.6% in 2006 (from 9.0% in 2005), as
a result of lower oil and food pricesand the appreciation of the Leu (7% vsthe euro and 16% vs the dollar).Unemployment increased only moder-ately to 7.4% in 2006 (from 7.2% in2005) and is foreseen to remain broad-ly stable. The fiscal authorities ran ageneral government budget deficit of1.7% of GDP in 2006, targeting adeficit of 2.8% in 2007 as a result ofthe EU-accession related expenditureneeds. The Romanian government hasset as target date for entry in the euroarea the year 2014, in order to securethat all necessary preparations willhave been completed till then.
AAllbbaanniiaa::Albania's macroeconomic perform-ance has remained strong. Inflation islow, the external position hasimproved, and economic growth wasrobust, although real GDP decreasedto 5.0% in 2006 from 5.5% in 2005.Economic expansion has continued tobe driven by private consumption andinvestment, based on rapid householdcredit expansion and strong remit-tance inflows. Although activity inconstruction slowed down—in partowing to a sharp reduction in thenumber of construction permits anddelays in the execution of publicinvestment—a faster-than-anticipatedrecovery in electricity production andan improvement of exports served asmitigating factors. Inflation over thepast year has generally been close tothe Bank of Albania’s lower boundaryof the 2-4% target range, while the
Dynamic Securities - Valuation & Research Specialists
VVaalluuee IInnvveesstt mmaaggaazziinnee
1177
current account deficit decreased to5.9% from 6.5% in 2005, as traditionalexports such as footwear recoveredand new export opportunitiesemerged. These favourable develop-ments owe much to sound macroeco-nomic policies and continued strongcommitment to program implementa-tion, but maintaining these gainsalongside further reduction in povertyrequires additional growth-enhancingstructural reforms. The authorities arecommitted to fiscal discipline, and areimplementing a fiscal program thataims to reduce public debt while pro-viding adequate funding for priorityprojects in infrastructure, health, andeducation. The recent measures takenby the Bank of Albania to strengthenthe regulatory and prudential frame-works will further reduce the risksposed by rapid credit growth. In theenergy sector, the InternationalFinance Corporation has been selectedas an advisor for the privatization ofthe distribution arm of the nationalelectricity company (KESH).Concerted efforts are needed toensure stable energy supply and fur-ther improve the financial perform-ance of KESH.
FFYYRROOMM::Economic growth slightly acceleratedin 2006 to 4.0% from 3.8% in 2005and is expected reach 4.5% in 2007.Economic expansion is driven by pri-vate consumption and investmentsupported by improved confidence,increasing real disposable income and
rapid credit expansion, benefitingfrom the country’s candidate statusfor EU membership. Export activitystill remains weak, but workers remit-tances form a significant part of theprivate transfers’ inflow. These havehelped to reduce the current accountdeficit from 7.7% of GDP in 2004 to1.3% of GDP in 2005. In 2006, thecurrent account balance turned posi-tive (0.5%). Inflation picked up to3.2% in 2006 from 0.5% in 2005,reflecting higher transport prices, dueto elevated energy prices, and largeincreases in excise taxes on tobaccoand beverages, as a result of EU har-monization policies. The currency pegand the very tight fiscal policies, part-ly contained the inflationary pres-sures, but their effect was limited.Unemployment remained excessivelyhigh at 36.1% by mid-2006. The pub-lic finances continued to remain closeto balance, but future efforts shouldfocus on improving tax administrationand containing upward wage pres-sures.
SSeerrbbiiaa::Economic activity decreased at 5.4%in 2006 (from 6.2% in 2005), but stillremains on positive track supportedby continued credit expansion and ris-ing wages. Inflation despite its sharpdrop at 12.7% in 2006 from 17.3% in2005 still remains high, while the cur-rent account deficit dramaticallywidened to 12.3% of GDP in 2006from 9.5% of GDP in 2005, despiteenhanced export activity, strong
VVaalluuee IInnvveesstt mmaaggaazziinnee
1188
Dynamic Securities - Valuation & Research Specialists
VVaalluuee IInnvveesstt mmaaggaazziinnee
remittances and privatization-orientedFDI inflows. The high inflation andcurrent account deficits need to bebrought under control without damag-ing the real economy through anappropriate mix of policies. TheNational Bank of Serbia (NBS) under-took a policy shift in 2006, opting forgreater exchange rate flexibilitythrough a new focus on inflation tar-geting. The NBS reduced the key poli-cy rate to 11.5% in February 2007(from 18% in September 2006), butthere seems to be no room for anexpansionary monetary policy, giventhe current high inflation rate. TheIMF noted recently that governmentneeds to proceed with tax and pensionsystem reform, as well as the privati-zation of state owned monopolies.Political uncertainties, especially con-cerning the future of Kosovo and howto resume association talks with theEU (suspended in May 2006) remainin the spotlight. Since the generalelections on 21 January 2007, therehas been no official governmentformed, but only an interim one.
MMoonntteenneeggrroo::Real GDP grew by 5.5% in 2006,recording the strongest performancesince the start of transition. Consumerprices increased to 3.5% from 2.6% in2005, but still compared to the hyper-inflation of the past years (2000:97.1%), inflationary pressures appearto be well contained. The fiscal andcurrent account deficits continued
their declining trend. Severe unem-ployment remains a key political andeconomic problem for this entireregion. Montenegro is in a similar situ-ation to other transition countriesthat attempt fundamental reforms.The reform process initially generateshardship and pressures on the budget.A stable currency and a balancedbudget are only first steps towards theestablishment of a market economy.Currently, the government is alsolaunching further comprehensivereforms, including the judicial system,education, public sector, and privati-sation of the remaining state ownedenterprises. There have already beensome important privatizations (alu-minium complex KAP and financialsector), as well as significant inflowsof foreign investments that are expect-ed to enhance private sector ledgrowth. This especially relates to serv-ice sectors (tourism, trade and trans-port) which have great potential. On18 January 2007, Montenegro joinedthe World Bank and IMF. Montenegrois also pursuing membership in theWorld Trade Organization and is nego-tiating a Stabilization and Associationagreement with the European Unionin anticipation of eventual member-ship.
TTuurrkkeeyy::In Turkey, concerns about the widen-ing current account deficit led tosharp downward pressure on the liraduring the May-June 2006 emerging
1199VVaalluuee IInnvveesstt mmaaggaazziinnee
market correction, triggering anabrupt tightening of monetary policy.Growth has subsequently deceleratedsignificantly from 7.4% in 2005 to5.5%. Domestic demand continued toslow down in response to rapid inter-est rate increases (by 425 bps) and isexpected to contract further, loweringGDP growth forecast to 5.0% in 2007.The most worrying development hasbeen the dramatic increase in inflationto 9.6% in 2006 (year’s target: 5%)from 8.2% in 2005, reflecting in largepart the high oil prices and the depre-ciation of the Turkish lira vis-à-vis theeuro and the dollar, estimated to be asmuch as 30%, but inflation is expectedto fall to 8.0% in 2007. The exchangerate pass-through to inflation is highand a source of future concern, as itmakes the Turkish economy vulnera-ble to external shocks. Unemploymentrecorded a small fall to below 10.0%,while the public finances worsened.The general government deficitexceeded 4.0% of GDP, affected byexcessive public sector wage increasesand contraction of GDP growth, andis projected to be even higher in 2007due to expected increased publicspending prior to the presidential andparliamentary elections. Currentaccount deficit has deteriorated in2006 to 8.0% of GDP, the highest levelin recent years, reflecting strongdomestic demand and import growth.Nevertheless, it is expected to befinanced relatively easy through pri-vate debt and FDI, although the levelof risk aversion of portfolio investors
towards the emerging markets hasincreased globally. Turkey continuesto be oriented towards future EUmembership, but no comprehensibleefforts have been initiated yet.
EEggyypptt::GDP growth has gathered additionalmomentum in 2006 (6.8% from 4.5%in 2005) and is projected to remain atthe same level in 2007. Surprisingly,inflation has considerably cooleddown to 4.2% in 2006 from 8.8% in2005, perhaps as a result of the timelyand appropriate tightening of mone-tary policy by the Central Bank ofEgypt, but is forecasted to pick upagain to double-digit rates (12.3% in2007). The current account balancehas remained in surplus (0.9% in2006). Overall, the Egyptian reformslaunched in 2004 appear to havefocused well on the most critical con-straints—reducing red tape and taxrates, and improving access to foreignexchange—thereby getting a stronggrowth response out of a limited set ofreforms. However, inefficient bureau-cracy remains an important obstacleto higher growth and reforms in thisarea should continue to have highpayoffs. Ongoing reforms are alsoaddressing constraints that are likelyto become binding soon (or havebecome so already), such as inefficientfinancial intermediation and high pub-lic debt. Improvements in educationmay rapidly become a critical factorfor sustaining higher growth.
With so many MBA programmes on offer, your choice of school is crucial. An MBA from the University of Strathclyde's Graduate School of Business, a constituentpart of the Strathclyde Business School faculty, is the best investment you can make in your career as a professional manager. Strathclyde’s international reputation,combined with its high academic and selection standards, is your guarantee that your MBA will retain its value in the years to come.The Strathclyde MBA has been available outside the UK since 1988. Over 2000 course participants have now graduated, and over 1500 are currently studying theprogramme in their own country. This success is due to the unique delivery structure developed with the local partner incorporating elements of full-time, part-timeand open learning modes of study.The programme has been available in Greece since 1996, and is run in partnership with International Management Studies (IMS).
IIMMSS –– GGrreeeeccee CCeennttrreeInternational Management Studies was set up in Greece by a team of British management education specialists to provide high quality management development pro-grammes to experienced and talented professionals. IMS runs a wide range of business seminars for both companies and individuals and offers a number of Britishpostgraduate management degrees, including the MSc in Finance and the MSc in Marketing with the University of Strathclyde.Located at 85 Dinokratous in Kolonaki, IMS houses seminar rooms, a computer network and a management education library. Locally appointed tutors combineexcellent academic qualifications with solid professional experience.International Management Studies is responsible for promoting the MBA in Greece, handling enquiries, providing information and receiving applications. In order tomaintain high standards of consistency throughout the world, all admissions decisions are made by the University of Strathclyde. IMS provides local administrativeservices as well as holding counselling sessions, seminars and examinations. USGSB provides core teaching materials and sends Strathclyde University faculty membersto Greece to run intensive seminars. IMS also has a number of local management education specialists who provide ongoing counselling support. All assessment is theresponsibility of Strathclyde and successful participants will be awarded a University of Strathclyde Master of Business Administration.
22 MMeetthhooddss ooff ssttuuddyyThe Strathclyde University MBA in Greece incorporates a flexible style of delivery – full-time, part-time and open learning elements in a 180 credit format. Many par-ticipants continue to work while taking the course over two years. This makes the programme a viable and valuable alternative for the busy professional and his com-pany since it combines the benefits of learning with immediate practical application to his working environment.
HHooww ddooeess tthhee pprrooggrraammmmee wwoorrkk??Each year is divided into two six-month semesters. For the first four months participants will study core learning materials and attend local counselling sessions.Strathclyde staff then come to Athens to run intensive seminars. Examinations are held in the sixth month.These intensive seminars ensure that all MBA students have the same learning experience and reach the same standards. They also enable Strathclyde staff to modifytheir teaching so that it is relevant to the contexts in which the course participants are working. The intensive seminars are mainly based around the core learningelements, but also cover business simulations and management skills i.e. the development of managerial competence. This flexibility allows busy executives to gain afirst class international MBA in their own country, without interrupting their careers.
AAccccrreeddiittaattiioonnAccreditation is a good guide to how a business school is regarded by its peers. This year has seen the business school gain full international accreditation, with allthree accrediting bodies around the world - EQUIS (Europe), AMBA (International MBA quality assurance) and AACSB (North America) – approving the school asoffering excellent management education.As one of only 23 business schools in the world with this standing, and the only business school in Scotland to be accredited so highly, Strathclyde continues to leadthe way in high quality business education. We also hold excellent ratings for both our research and the quality of our teaching.
AAMMBBAA ((TThhee AAssssoocciiaattiioonn ooff MMBBAAss))All Strathclyde MBA programmes are accredited by AMBA and all students are eligible to join after enrolment on an MBA course. www.mba.org.uk
EEQQUUIISS ((EEuurrooppeeaann FFoouunnddaattiioonn ffoorr MMaannaaggeemmeenntt DDeevveellooppmmeenntt))Strathclyde is one of only 16 UK business schools to receive EQUIS accreditation. www.efmd.be
AAAACCSSBB ((TThhee AAssssoocciiaattiioonn ttoo AAddvvaannccee CCoolllleeggiiaattee SScchhoooollss ooff BBuussiinneessss))Strathclyde received accreditiaton from this prestigious body in December 2003. www.aacsb.edu
While offered in partnership with IMS, responsibility for academic quality control resides with Strathclyde, and is the same as for the United Kingdom programmes.Successful MBA students (via international centres) will be awarded the same Strathclyde University MBA as all UK students and will be invited to attend the gradua-tion ceremony held annually at Strathclyde University, Glasgow.
CCoouurrssee DDuurraattiioonnThe Strathclyde MBA (part-time via international centres) has been specially designed for busy executives who need to combine career and family commitments withthe demands of MBA studies. This flexibility enables students to graduate within two years. However, studies may be spread over a longer period to a maximum ofsix years. Subject to availability, those students wishing to accelerate their studies may be able to join the full-time MBA programme at Strathclyde University inGlasgow at the elective stage during June and July each year. This enables them to complete their electives within a shorter period as well as experience working withparticipants from all over the world.
IInnttaakkee ddaatteessThere are two intakes for the Strathclyde MBA in Greece each year – in April and October. Finalised course dates and timetables are available from IMS.
AApppplliiccaattiioonnssEntry requirements are a good first degree, proficiency in English and several years' work experience (a minimum of 3 years is mandatory). Candidates who do nothold the normal requirements but are clearly of MBA potential may be offered entry to the MBA via the Diploma route. Visit the Graduate School of Business (www.worldclassmba.com) website for detailed information about the programme such as the syllabus and reputation of theStrathclyde MBA. Contact International Management Studies to request a brochure or to arrange an appointment at which you can discuss whether the MBA is suitable for you andwhether it meets your career needs.
[Note 3] These figures include loans,holdings of corporate bonds,securitized loans, as well as loanwrite-offs.
[Note 4] The net funds raised throughcorporate bonds issuance reached4.3 billion euros in 2006 from 3.9in 2005, accounting for anincrease of 12%.
2244
Dynamic Securities - Valuation & Research Specialists
VVaalluuee IInnvveesstt mmaaggaazziinnee
The Greek Equity Market in the First Quarter 2007
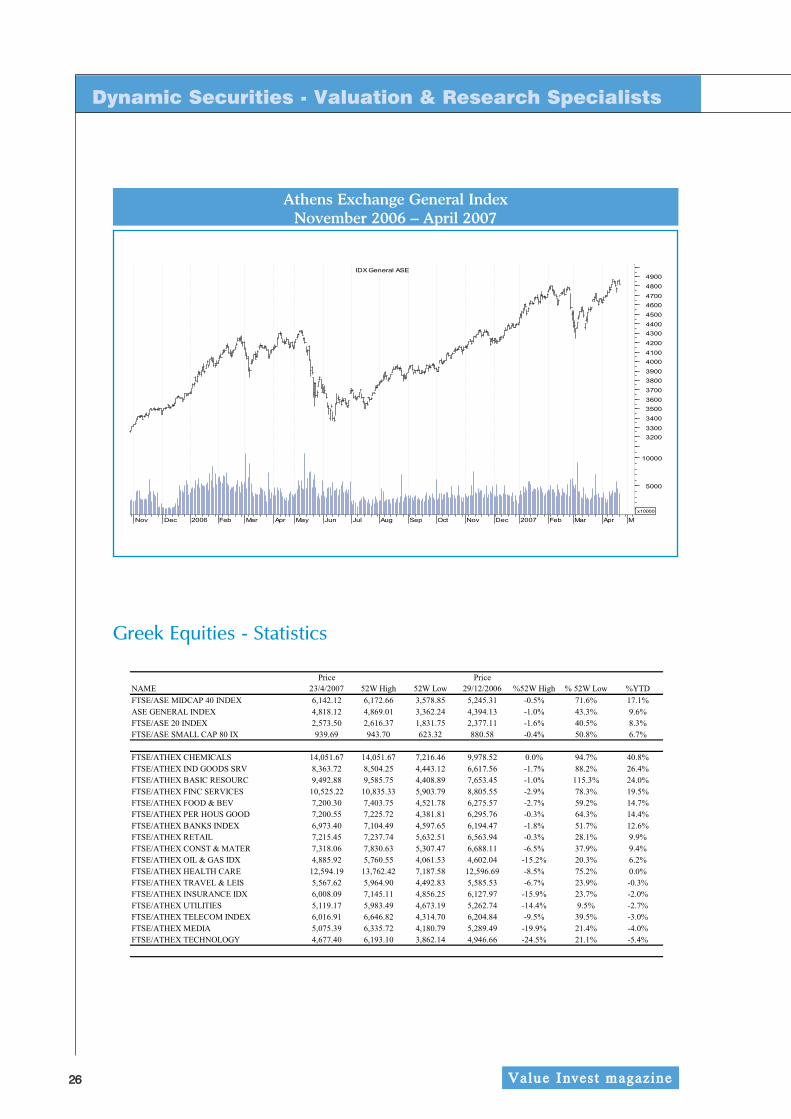
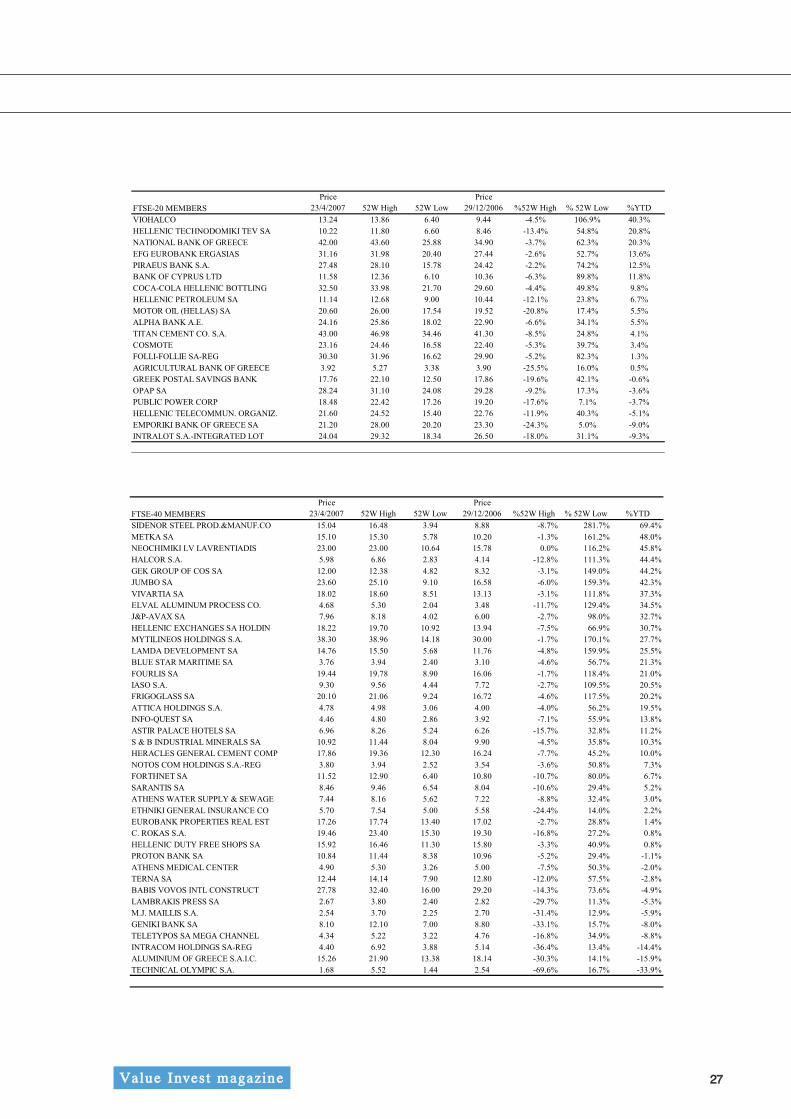
In tandem with the other devel-oped stock markets across theglobe, the positive sentimentremained in Athens Exchange inthe first months of 2007 despitethe short-period sell-off observedat the end of February as investorsworried about the status of the USeconomy and the drop in Shanghaistock exchange.The high growth rates of the globaleconomy, the remaining excess liq-uidity and the corporate profitabili-ty supported the rebound in pricesand in April the global stock mar-ket indices re-gained their highs.Following this trend, the Athensstock exchange composite indexclimbed to 7-year highs in Aprilsupported by strong corporateprofitability that approached 30%y-o-y. M&A deals maintained theinterest while foreign investorsincreased their participation intotal market capitalization.Overall, the composite index ended9.6% up y-t-d (for the periodJanuary the 1st till April the 23rd).The Mid-cap 40 index continued itsimpressive performance (17.1%),while FTSE-20 and FTSE-80indices, although remained in posi-
tive grounds, lagged the compositeindex. Chemicals reported animpressive 40.8% followed byIndustrial goods (26.4%) and Basicresources (24%), while six sectoralindices reported losses for the year.Looking at the performance ofindividual companies that consti-tute the three FTSE indices,Viohalco group of companies con-tinued its strong performancereporting a 40.3% y-t-d return sup-ported by the corporate develop-ments of its subsidiaries, whilebanking shares are back in fashionfollowing the developments in theirprofitability especially to the partthat is attributed to Balkans.Five FTSE-20 members reportednegative performance as they werehit by unsuccessful corporatedevelopments. Healthy mid-capcompanies reported substantialdouble digit performance figures ascorporate deals continued, andonly 11 out of 40 companies thatconstitute the FTSE-40 reportednegative performance.
NNootteess:: Year to date performanceconcerns the period 30 December2005 – 23 April 2007.
2266
Dynamic Securities - Valuation & Research Specialists
VVaalluuee IInnvveesstt mmaaggaazziinnee
Athens Exchange General IndexNovember 2006 – April 2007
Greek Equities - Statistics
2277VVaalluuee IInnvveesstt mmaaggaazziinnee
2288
Dynamic Securities - Valuation & Research Specialists
VVaalluuee IInnvveesstt mmaaggaazziinnee
2299
DISCLOSURE STATEMENT
This document has been prepared and issuedby DYNAMIC SECURITIES SA which is regu-lated by the Hellenic Capital MarketCommission and is subject to the rules of con-duct applicable to investment firms (EPEYs) asestablished under Greek regulations. DYNAM-IC SECURITIES SA is not engaged in anyagreement with the subject companies for thepreparation of this document.
Dynamic Securities SA has prepared the aboveresearch material and its contents are for infor-mation purposes only and should not be con-strued as an offer to sell or a solicitation tobuy any securities. The information containedin this report including any expression of opin-ion has been taken from sources believed to bereliable but it cannot be guaranteed and nowarranty is given that such information isaccurate or complete and it should not berelied upon as such and are subject to changewithout further notice. Dynamic Securities SAand/or its associated group companies or a per-son or persons connected with the companymay from time to time act on their ownaccount in transactions covered in its researchreports. Dynamic Securities SA may do andmay seek to do business with companies cov-ered in its research reports. As a result,investors should be aware that the firm mighthave a conflict of interest that could affect theimpartiality of this report. Investors shouldconsider this report as only a single factor inmaking their investment decision. Securitiesmentioned in this report are subject to invest-ment risks including the loss of initial capitalinvested. Dynamic Securities SA does notaccept any liability whatsoever for any director consequential loss arising from any use ofthis document or its contents. This report isaddressed to professional investors only andno part of this report may be reproduced orpassed on in any manner without prior permis-sion.
• At the date of the issuance of this report(mentioned in the first page of the report)DYNAMIC SECURITIES SA does not holdmore than 5% of a class of common equitysecurities on any company mentioned in thisreport.
• At the date of the issuance of this report(mentioned in the first page of the report)none of the subject companies mentioned inthis report owns more than 5% of DYNAMICSECURITIES SA or any of its affiliated com-panies. DYNAMIC SECURITIES SA does notact as a market maker for the securities ofthe company.
• DYNAMIC SECURITIES SA has not providedunderwriting services to the company cov-ered in the report.
• DYNAMIC SECURITIES SA has not receivedcompensation from the company for finan-cial advisory services during the past 12months.
• DYNAMIC SECURITIES SA has not receivedcompensation from the company for thepreparation of the research report.
Internal procedures: a) The research depart-ment is situated in an area where only employ-ees of the department have access in order toensure secured confidentiality. The data andrecords of the department are out of reach ofthe other departments. Chinese Walls are setbetween the research department and otherdepartments so that DYNAMIC SECURITIESSA can abide by the provisions regarding confi-dential information and market abuse.
Analyst CertificationThe analyst responsible for the content of thisresearch report (in whole or in part), certifiesthat a) all the views about the companies andsecurities contained in this report accuratelyreflect the personal views of the respectiveauthor and b) no part of our compensationwas or will be directly or indirectly related tothe specific recommendations or view of thisreport. The author of this report may haveheld or hold in the future shares of the compa-ny covered in its research reports. The analystor at least one of the analysts mentioned inthis report are Certified as “Analyst of Equitiesand the Market” by the Hellenic CapitalMarket Commission.
Analyst Stock Ratings All of the above denote investment ratings (notrecommendations) which refer to our overallview of the company based not only on valua-tion but on qualitative factors as well.
VVaalluuee IInnvveesstt mmaaggaazziinnee
3300
IInnttrroodduuccttiioonn
Market risk, as defined by the BaselCommittee, is the risk of losses in on-and off-balance-sheet positions arisingfrom movements in market prices.The issue has become of specialimportance as the increased exposureof financial institutions to a widerange of financial products ignited anera of increased market risk. Value-at-Risk (VaR) has become themain theoretical tool for quantifyingmarket risk for the trading book offinancial institutions, and the tradi-tional methodologies applied for theestimation of VaR (variance-covari-ance, Historical Simulation, MonteCarlo) utilise the standard deviation asa measure of the variability of tradingor theoretical values of many prod-ucts.
Over the years, many attempts haveemerged as alternatives in forecastingfinancial volatility, the main input inVAR models. RiskMetricsTM approachto forecast volatility with the IGARCHmodel often proved ineffective againstthe classic method of equally weightedvolatility [Alexander και Leigh (1997)].Additionally, conventional methods toestimate VaR such as variance-covari-ance and historical simulation do notaccount for market dynamics, het-
eroscedastic behaviour and the distri-bution of risk factors [Kuester et al.(2003)]. For the application of histori-cal simulation (HS) some alternativemethodologies were proposed by[Barone–Adesi et al. (1999)] toaccount for the heteroscedasticity ofmarket risk factors. Despite their relative advantages anddisadvantages, none of the conven-tional approaches to estimate VaR isfocused completely on the extremevalues of the market risk factors dis-tributions. Danielsson and de Vries(1997) showed that the estimation ofVaR with EVT produces better resultsto that of HS coupled with IGARCH,mainly because it combines some ofthe advantages of both parametric(IGARCH) and non-parametric (HS)models. [Gencay and Selcuk (2004)]demonstrated that Extreme ValueTheory (EVT) is more efficient com-pared to Variance Covariance (VC)and HS on the estimation of the dailyVaR values from the stock market ofnine emerging markets for higher con-fidence intervals. [McNeil and Frey(2000)] when trying to account staticforecasts produced by parametric[Kellezi and Gilli (2000)] and semi-parametric [Dacorogna et al. (1995)]variations of EVT, suggested the useof conditional EVT that accounts forheteroscedastic effects of the residuals
Quantifying market risk:an evaluation of alternativetechniques
3311
and creates the respective quintiles toestimate VaR. Within the aforemen-tioned framework, the present studypresents an evaluation of threemethodologies to estimate VaR thataccount for heteroscedasticity (condi-tional EVT) and conventional models(VC and HS) on a combined portfolioof two financial products, stocks asrepresented by the S&P500 index andopen exchange rate position in USdollars (the $/4 exchange rate). Thedata cover the period from January 2,1997 to March 14, 2004 and the com-bined portfolio was formed using ran-dom positions which change on adaily basis.
MMeetthhooddoollooggyy
Internal VaR models attempt to esti-mate the losses of a portfolio that mayarise during a predefined interval(usually next working day) and notexceed a specified frequency ofappearances (e.g. confidence level of99%, 95%, etc.). Every VaR toolassumes the modelling of logarithmicreturns as:
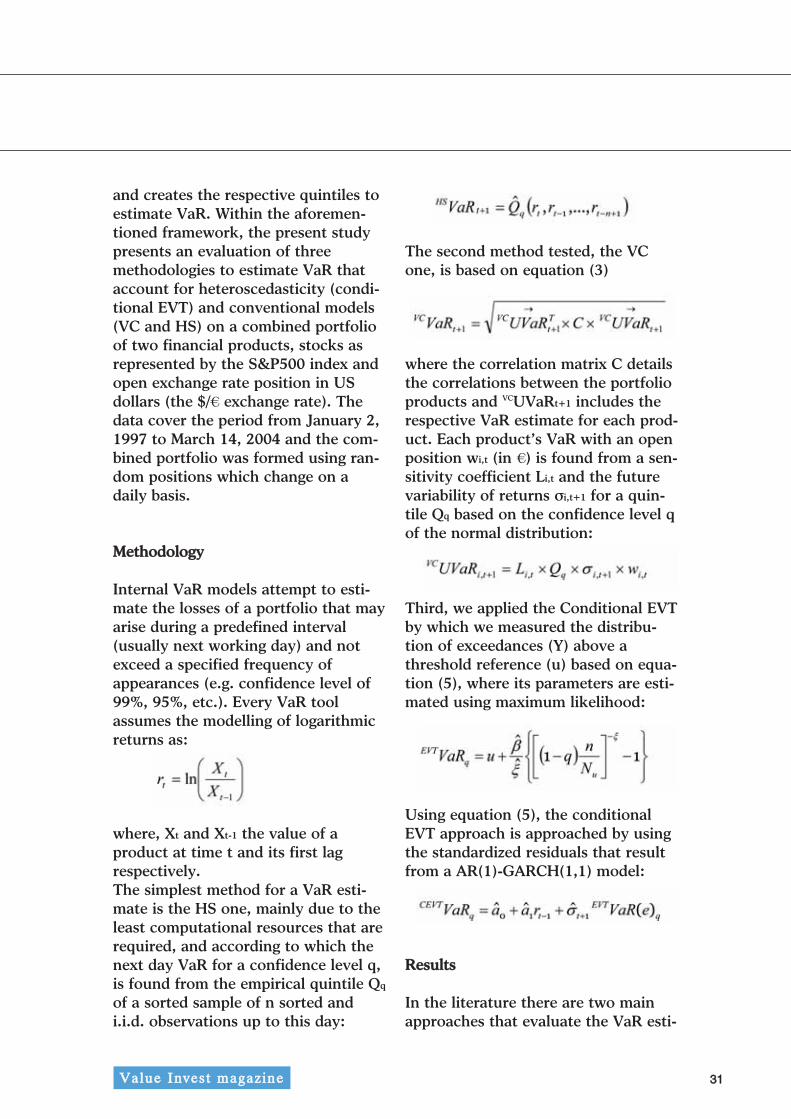
where, Xt and Xt-1 the value of aproduct at time t and its first lagrespectively. The simplest method for a VaR esti-mate is the HS one, mainly due to theleast computational resources that arerequired, and according to which thenext day VaR for a confidence level q,is found from the empirical quintile Qq
of a sorted sample of n sorted andi.i.d. observations up to this day:
The second method tested, the VCone, is based on equation (3)
where the correlation matrix C detailsthe correlations between the portfolioproducts and VCUVaRt+1 includes therespective VaR estimate for each prod-uct. Each product’s VaR with an openposition wi,t (in 4) is found from a sen-sitivity coefficient Li,t and the futurevariability of returns σi,t+1 for a quin-tile Qq based on the confidence level qof the normal distribution:
Third, we applied the Conditional EVTby which we measured the distribu-tion of exceedances (Y) above athreshold reference (u) based on equa-tion (5), where its parameters are esti-mated using maximum likelihood:
Using equation (5), the conditionalEVT approach is approached by usingthe standardized residuals that resultfrom a AR(1)-GARCH(1,1) model:
RReessuullttss
In the literature there are two mainapproaches that evaluate the VaR esti-
VVaalluuee IInnvveesstt mmaaggaazziinnee
3322
mates of any method: statistical, suchas root mean square error (RMSE),mean error (ME), mean absolute error(MAE), etc., and economic, such asthe number of exceedances of predic-tions from real values, the success of atrading rule and etc. However, the for-mer are often biased and noisy estima-tors [Christodoulakis and Satchell(2004)]. Thus, in the present study thefinancial measures included in theBasel Committee Amendment wereselected. This approach shows themost efficient model as the one withthe least number of over-shootingsusing back-testing [Kalyvas et al.(2006)].
The results reported that EVT is themost conservative method reportingby far the highest daily VaR estimateduring the entire 7 years period. Thebiggest percentage difference betweenthe VaR estimates of the three modelsfor the same day was found betweenEVT and VC, in favour of the first,while the respective differencebetween the estimates of EVT to theother models was much smaller onaverage. The other two models (VC,and HS) exhibit, on average, similarestimates. Accordingly, the resultingcapital requirements according to theEVT are higher compared to the othermodels.
In addition, EVT appears to producethe least number of over-shootings on‘back-testing’ (9) when these are esti-mated using a moving window of thelast 250 observations against 22 forthe VC and 20 for the HS. The maxi-mum number produced by EVT wasfound equal to 4 where as the other
models produce a maximum of 7(Figure 1).
CCoonncclluussiioonn
This study was focused in the study ofportfolios created by open positions inforeign exchange and stock productsthat are traded in spot market com-pareing three different methodologiesto estimate VaR, namely VC, HS, andconditional EVT, for randomly select-ed portfolios. EVT was found to pro-duce the most conservative estimatesof VaR against the other methods, aresult that may impose some disad-vantages for its daily calculation byfinancial institutions.The findings of this study are in accor-dance with those found in the litera-ture according to which the semi-parametric EVT is the optimal estima-tor of VaR against other methodolo-gies. Adding to the conclusions ofother studies, the empirical findingsshowed that novel methodologies inthe estimation of VaR appear to beeffective for every risk factor theyhave been applied to, but for themoment they do not seem to be theoptimal solution, in terms of capitalrequirements, for financial institu-tions, when their portfolios is com-prised from the examined products.However, since EVT includes the ele-ment of extreme events, the benefitsto other portfolios with highly riskproducts (e.g. options, swaps etc.)should be thoroughly examined.Furthermore, the fact that EVT is alsoto model crisis situations should alsobe accounted for, which may signifi-cantly reduce operational risk.
Lampros Kalyvas - Athanasios Sfetsos - Ioannis Asimakopoulos
VVaalluuee IInnvveesstt mmaaggaazziinnee
3333VVaalluuee IInnvveesstt mmaaggaazziinnee
10987654321
10987654321
10987654321
Figure 1:Overshootings of VaR estimates against observed losses
Conditional EVT
Historical Simulation
Variance Covariance
3344
RReeffeerreenncceess
Alexander, C. O. and Leigh, C. T., Onthe Covariance Matrices used inValue-at-Risk Models, Journal ofDerivatives, 4:3, pp. 50-62, 1997.
Barone-Adesi, G., Giannopoulos, K.and Vosper, L., VaR withoutCorrelations for Portfolios ofDerivative Securities, Journal ofFutures Markets, 19, pp. 583-602,1999.
Christodoulakis, G. and Satchell, S.,Forecast Evaluation in the Presence ofUnobserved Volatility, EconometricReviews, Vol. 23, No. 3, pp. 175-198,2004.
Dacorogna, M., Muller, U., Pictet, O.and de Vries, C. The distribution ofextremal foreign exchange ratesreturns in extremely large data sets,Preprint, Olsen and Associates, June1995.
Danielsson, J., and de Vries, C. G.,Value at Risk and Extreme Returns,London School of Economics,Financial Markets Group Discussion
Paper no. 273, 1997.
Kalyvas, L. and Akkizidis I. withZourka, I. and Bouchereau, V.,Integrating Market, Credit andOperational Risk: A guide for bankersand risk professionals, RiskBooks,London, 2006
Kellezi, E. and Gilli, M., Extreme valuetheory for tail-related risk measures,Preprint, Department of Econometricsand FAME, University of Geneva,2000.
Kuester, K., Mittnik, S. and Paolella,M., Value-at-Risk Prediction: A com-parison of alternative strategies, CFSworkshop, Frankfurt, 2003.
McNeil, A. J. and Frey, R., Estimationof tail-related risk measures for het-eroskedastic financial time series: anExtreme Value Approach, Journal ofEmpirical Finance, 7, pp. 271-300,2000.
Lampros Kalyvas - Athanasios Sfetsos - Ioannis Asimakopoulos
VVaalluuee IInnvveesstt mmaaggaazziinnee
AAuutthhoorrss
LLaammpprrooss KKaallyyvvaass Bank of GreeceDepartment for the Supervision ofCredit and Financial InstitutionsRisk Analysis and SupervisoryTechniques Division
In some cases, option theory isbelieved to be superior to the naïvediscounted cash flow approach to val-uation because it captures the value ofreal options arising from managerialand strategic flexibility. Bearing this inmind, we investigate the extend towhich company valuation of listedcompanies is associated with the exis-tence of real options. In particular, thestudy evaluates the real options ofcompanies listed on the Athens StockExchange during the time period ofJanuary 1990 to December 1999. Initially, we examine the events thatreveal the existence of real optionsheld by the companies and eventuallytheir exercise. For this purpose, plansand decisions about company-widecapital expenditure and about specificprojects are included into the sample.In addition, plans or decisions, whichinclude funds for the purpose ofacquisitions and tender offers andplans or decisions by corporate sub-sidiaries, are included. The originalsample of events was compiled byexamining the company capitalincrease leaflets and company annualreports, information revealed to the
press and discussion with the compa-ny management. First, it is shown thatthe presence of growth options isassociated with excessive returns dur-ing the event period. The results rejectthe hypothesis that real options arenot recognised in the market placeand indicate that market participantsare normally informed one day beforethe announcement. The value of com-panies that have growth optionsincreases till the third day after realoption announcement. Furthermorewe examine whether the real optionsare value relevant in the context ofresidual income valuation model fol-lowing mainly the Ohlson (1995)residual income model and methodol-ogy developed in Green, Stark andThomas (1996). Our study indicatesthat the growth options are a signifi-cant explanatory variable in the con-text of the residual income valuationmodel. Our results provide some sup-port of the predictive ability of theresidual income model and are gener-ally in line with findings from UK andUSA researchers. Besides there issome support over the hypothesis thatgrowth options are value relevant,
Konstantinos Vergos
VVaalluuee IInnvveesstt mmaaggaazziinnee
Real Options and the pricingof shares: empiricalevidence from the AthensStock Exhange
3377
since they contribute in the predictiveability of residual income models.Also, our findings from cross-sectionalmodels match to our findings from theexamination of the effect of optionannouncements to companies' value.Our findings are also similar to find-ings over the effect of R&D announce-ments in other markets. Overall ourstudy should provide a link betweenthe real option theory and market val-uation. Moreover, these findings arepromising, because they reveal thatmarket valuation practices and thereal option theory converge in thecase of the growth options.
11.. IInnttrroodduuccttiioonn
In our study we will examine eventsthat reveal the existence and exercis-ing of real options of companies listedon the Athens Stock Exchange. Forthis purpose, plans and decisionsabout company-wide capital expendi-tures and about specific projects areincluded into the sample. In addition,plans or decisions, which includefunds for the purpose of acquisitionsand tender offers and plans or deci-sions by corporate subsidiaries, areincluded. We will examine events forthe 1989-1999 period. We examineddaily closing share prices and only onetype of share of every company, themost marketable one. To be includedin the sample, the share of a companythat is examined in our study had tobe listed on the Athens StockExchange at the time the manage-ment’s intentions were revealed and atthe time the announcement wasmade. The share prices are adjustedfor capital increases and dividends.
We use data from the electronicEFFECT database. The original sampleof events was compiled by the exami-nation of the companies’ capitalincrease leaflets and companies’ annu-al reports, information revealed to thepress and discussion with the compa-ny’ s management. The articles werecollected from daily and weekly news-papers. We also use the electronicdatabase of Reuters Business Briefingto crosscheck the time of informationreleases.
We examine five types of businessdecisions that have growth optioncharacteristics and their economiceffect can be quantified. These are theoptions
• to acquire other companies,• to take an exclusive representation
of a series of products, • to expand production capacity/
distribution network, • to develop a production unit in a
new area, • to launch an advertisement
campaign.
The management considers acquiringother companies so as to expand thecompany’s production capacity, toextend its distribution network, or toenter new markets. If acquisition leadsto the entry in new markets, then thecompany holds a corporate growthoption.Similarly, the option to acquire othercompanies or the option to merge isexamined in cases the acquisition (ormerger) may induce identifiable bene-
VVaalluuee IInnvveesstt mmaaggaazziinnee
3388
fits for the potential acquirer (or forpotentially merging companies).Also, the expansion of the company’sdistribution network in another coun-try is regarded as a growth option.Finaly, when the company plans tolaunch an advertisement campaign, or
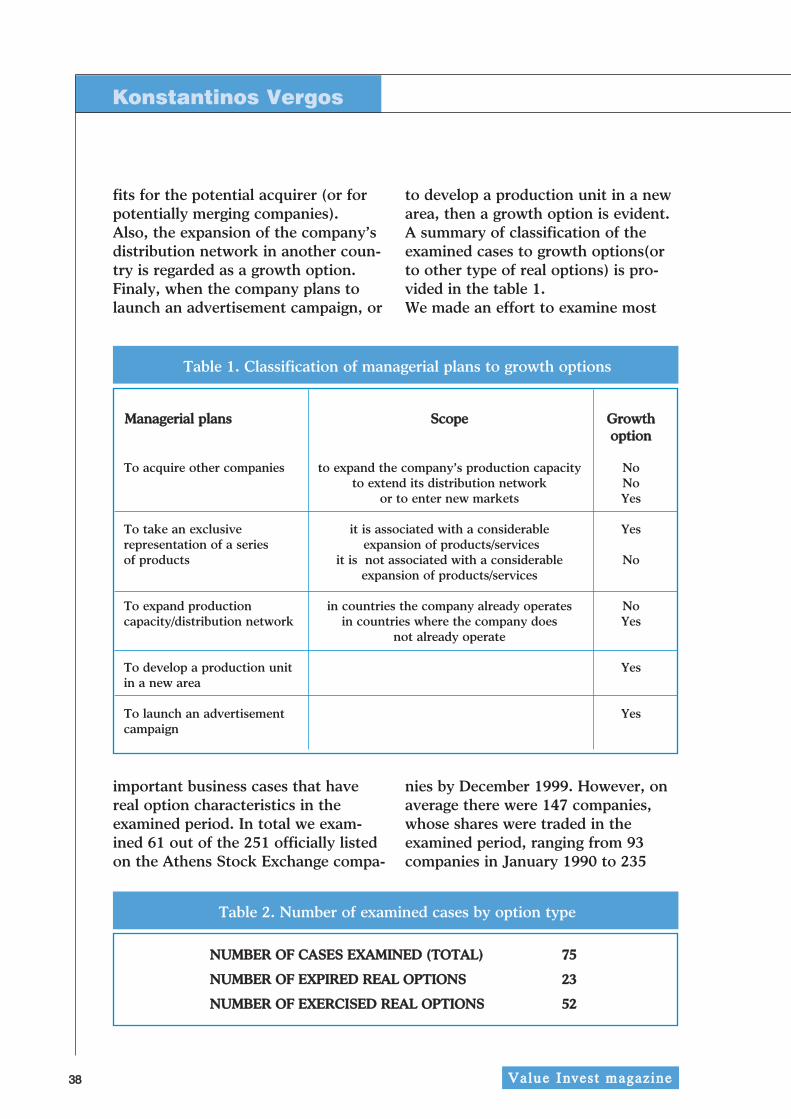
to develop a production unit in a newarea, then a growth option is evident. A summary of classification of theexamined cases to growth options(orto other type of real options) is pro-vided in the table 1.We made an effort to examine most
Konstantinos Vergos
VVaalluuee IInnvveesstt mmaaggaazziinnee
Table 1. Classification of managerial plans to growth options
To acquire other companies to expand the company’s production capacity Noto extend its distribution network No
or to enter new markets Yes
To take an exclusive it is associated with a considerable Yesrepresentation of a series expansion of products/servicesof products it is not associated with a considerable No
expansion of products/services
To expand production in countries the company already operates Nocapacity/distribution network in countries where the company does Yes
important business cases that havereal option characteristics in theexamined period. In total we exam-ined 61 out of the 251 officially listedon the Athens Stock Exchange compa-
nies by December 1999. However, onaverage there were 147 companies,whose shares were traded in theexamined period, ranging from 93companies in January 1990 to 235
3399
companies in December 1999.The number of examined cases byoption type is illustrated in thetable 2.There are two main research questionsto investigate. First, we investigatewhether real options are recognised bythe marketplace. Second, we examinecontribution of real options to compa-ny's value in the context of residualincome valuation.
33.. RReeaall OOppttiioonn RReeccooggnniittiioonn
An important assumption made byfinance researchers (e.g. Trigeorgis(1991)) is that the real options con-tribute significantly to a firm’s value.We test the hypothesis that growthoptions, a type of real options, arerecognised by the ASE market, byexamining the abnormal returns overthe real option announcement period
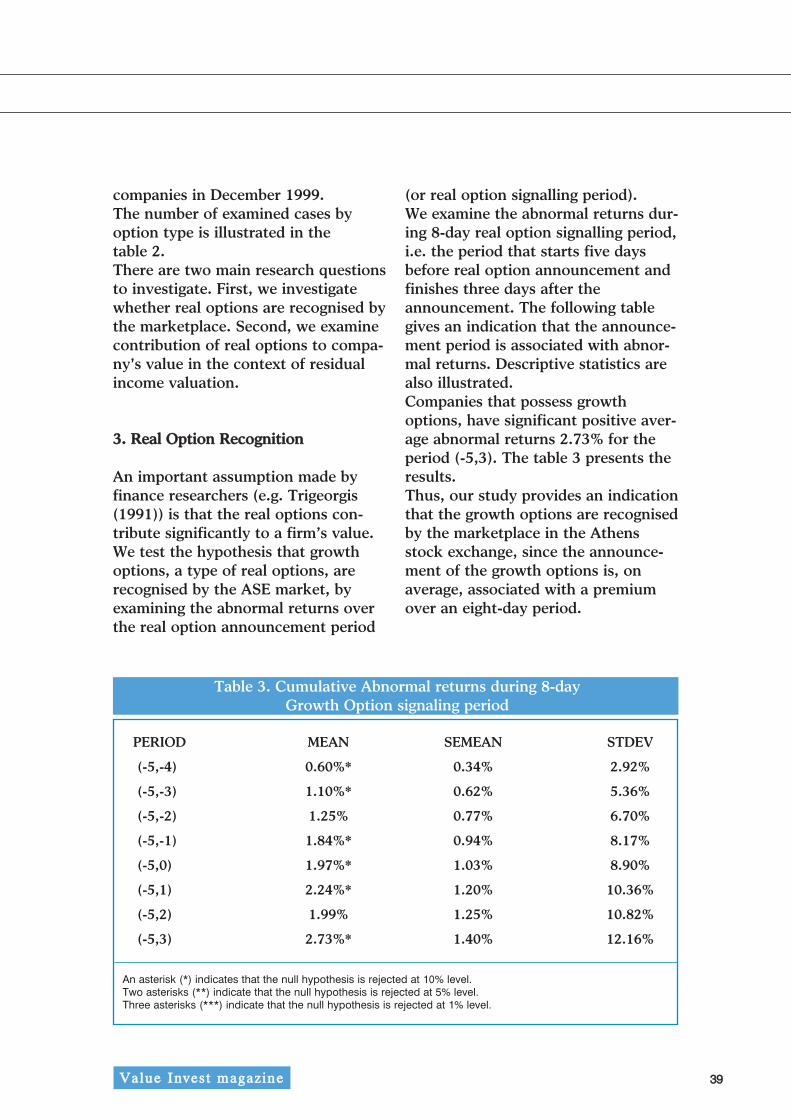
(or real option signalling period). We examine the abnormal returns dur-ing 8-day real option signalling period,i.e. the period that starts five daysbefore real option announcement andfinishes three days after theannouncement. The following tablegives an indication that the announce-ment period is associated with abnor-mal returns. Descriptive statistics arealso illustrated.Companies that possess growthoptions, have significant positive aver-age abnormal returns 2.73% for theperiod (-5,3). The table 3 presents theresults.Thus, our study provides an indicationthat the growth options are recognisedby the marketplace in the Athensstock exchange, since the announce-ment of the growth options is, onaverage, associated with a premiumover an eight-day period.
VVaalluuee IInnvveesstt mmaaggaazziinnee
Table 3. Cumulative Abnormal returns during 8-dayGrowth Option signaling period
PERIOD MEAN SEMEAN STDEV
(-5,-4) 0.60%* 0.34% 2.92%
(-5,-3) 1.10%* 0.62% 5.36%
(-5,-2) 1.25% 0.77% 6.70%
(-5,-1) 1.84%* 0.94% 8.17%
(-5,0) 1.97%* 1.03% 8.90%
(-5,1) 2.24%* 1.20% 10.36%
(-5,2) 1.99% 1.25% 10.82%
(-5,3) 2.73%* 1.40% 12.16%
An asterisk (*) indicates that the null hypothesis is rejected at 10% level.Two asterisks (**) indicate that the null hypothesis is rejected at 5% level. Three asterisks (***) indicate that the null hypothesis is rejected at 1% level.
According to the "clean surplus equa-tion", as presented by Ohlson (1995),the market value of a company can bemodelled as a linear function ofEarnings, Closing Book Value and netDividends,
and
given thatdt are net dividends at time txt are earnings in period tbt is book value at time txt
a are abnormal earmingsr is the risk-free interestA less restricted form of the "cleansurplus equation", allows for othercontrol variables.
wherePt is the market value of the firm'sstock at time tYt is the book value of equity at time tXt is reported accounting earnings attime tr is the risk-free interest(Xt-rYt-1) is abnormal earningsZt is a vector of other informationvariables at time tWe investigate the value relevance ofreal options by incorporating factors
in these models. Equation (3), can betransformed to the following equationthat is deflated by Book Value, so asto allow for control for size factors.
To examine whether the real optionscontribute during their lifetime to thecompany’s value in the share market,in the context of "clean surplus" litera-ture we compute regression coeffi-cients and t-statistics of the followingregression.
whereMVi,t is market value for firm I sixmonths after the end of year tBVi,t is book value for firm I at the endof financial year tRIi,t is residual income for firm I inyear tGRO is the number of months of pres-ence of growth option before itbecame exercisedGRO is the number of months of pres-ence of growth option before itexpired unexercisedOur results, expressed on Table 4 pro-vide some evidence that leads to thesupport of clean surplus hypothesis.Both the coefficients of 1/BV andRI/BV are positive (0.38 and 1.153respectively) and significant at 1%level of significance. The presence ofthe growth options for a monthincreases the company's MarketValue by 0.265 times the BookValue(Coefficient of GRO variable).Growth options that expired unexer-cised had an insignificant effect on
Konstantinos Vergos
VVaalluuee IInnvveesstt mmaaggaazziinnee
4411VVaalluuee IInnvveesstt mmaaggaazziinnee
Table 4. Regression statistics over the period 1990-1998, Examined model:
Sample requirements: Companies having MV/BV>9 or BV<0 are excluded
PERIOD 1990-1998
Intercept 1.597***
t-stat 22.258
1/BVi,t 0.38***
t-stat 5.229
RIi,t/BVi,t 1.153***
t-stat 5.472
GRO 0.265***
t-stat 4.286
GROXT 0.106
t-stat 0.780
R-sq-adj 5.06%
Sample 1150
An asterisk (*) indicates that the null hypothesis is rejected at 10% level.
Two asterisks (**) indicate that the null hypothesis is rejected at 5% level.
Three asterisks (***) indicate that the null hypothesis is rejected at 1% level.
company value. The Regression fit is low(R square adjusted is 5.05%). Equally, the effect of the real options oncompanies' value is weak and insignifi-cant when we examine data on an annu-al base (Table 5). The growth optionshave positive effect on corporate marketvalue in most of the years (five out of
seven). Nevertheless, regression coeffi-cients are unstable over time. The smallsample size at an annual base, may givean explanation to real option coefficientinstability as well as to their generallylow statistical significance in annualregressions. Our findings can be partlycompared to other studies in the area of
4422
residual income valuation. Regressingdeflated Residual Income, Book Valueand real Options against the differenceof Book Value from Market Valueleads to lower predictive ability com-pared to the predictive ability of themodels examined in Sougiannis(1994)and Green, Stark and Thomas (1996). The R-sq in our study is 5.7% whilein Green, Stark and Thomas (1996) itis 91.4% - 91.7% and in Sougiannis itis 32%. The coefficient of residualincome (RI) is higher than the unity(1.153) and significant at 1% level.However, the coefficient of RI is high-
er in previous studies (in Sougiannisstudy it is 2.75 and in Green, Starkand Thomas study it is 4.65 and 4.77).Maybe the inclusion of growth optionvariable captures an important part ofresidual income value. Nevertheless,intercept, closing Book Value andresidual income are found statisticallysignificant and positive as in Green,Stark and Thomas (1996) study. Theregression coefficient of Book Value isfound higher in our study (1.59 versus0.86 and 0.91 found in the Green,Stark and Thomas (1996) study).
Konstantinos Vergos
VVaalluuee IInnvveesstt mmaaggaazziinnee
Table 5. Annual Regression statistics over the period 1990-1998,Examined model:
Sample requirements: Companies having MV/BV>9 or BV<0 are excluded
PERIOD 1990 1991 1992 1993 1994 1995 1996 1997 1998
An important assumption made in thisstudy is that market efficiency exists.If market efficiency is not evident,investors do not form their expecta-tions in terms of risk and return or atleast they do not form these expecta-tions with uniform criteria. If this isevident, our model simply breaksdown.Not including additional control vari-ables in cross-sectional regressions isalso a limitation. However, R&Dexpenditures, which is the single mostimportant factor included in otherstudies, were particularly small andmade by less than 5% of the examinedcompanies, whilst part of these expen-ditures is associated with real options.Similarly, we did not find sufficientdata to examine the effect of advertis-ing expenditure on companies' marketvalue, examined in Shah and Stark(2001).Also, although pooled data pro-vide some support over real optionvalue relevance, annual data aresomewhat unstable, probably due tosmall sample deficiencies.Nevertheless, our research designincludes all sectors, so it leads to thegeneralization of our conclusions. Ourdata include financial companies sincepast studies do not provide any evi-dence that earnings, book value andreal options are not determinants ofthe value of financial institutions. We do not account for the role ofinformation costs. According toBellalah (2003) there are sunk costsincurred during the phase of gatheringinformation about the project and theopportunity to invest. Bellalah (2003)proposes some models that providesome insights into the importance of
these costs and may explain why com-panies that let their growth optionsexpire do not have market premium.Also, the models developed by Lintand Pennings (2003) may provide arationale to part of our findings. Lintand Pennings (2003) use an optionapproach to the New ProductDevelopment process to develop aframework that incorporates marketand technology uncertainties in allgo/no-go decisions. According to Lintand Pennings (2003) the projects dur-ing the R&D phase or after the R&Dstage that combine negative Net pres-ent Value and low uncertainty will beabandoned. In our view these casesmay fit to the growth options that themanagement let them expired. Also,issues useful to be examined in thefuture should be the benefits of firstmovers. Tsekrekos (2003) develops anequilibrium framework for real optionexercise where the focus is on theeffect of first-mover's advantages.First-mover advantages are found tohave an asymmetric effect on rivalfirms' values. The more volatile indus-tries should experience more separat-ed firm entries over time the moresubstantial the first-mover privileges.Paxson and Pinto (2003) model theleader and follower value functionsfor a duopoly environment. Assumingthe leader's market share evolvesaccording to an immigration anddeath process, the follower's valuefunction is less sensitive than theleader's value function to marketshare until the expected revenueexceeds the follower's trigger invest-ment level. Besides, the follower's trig-ger increases with market share and
Konstantinos Vergos
VVaalluuee IInnvveesstt mmaaggaazziinnee
4455
revenue volatility. Overall, our study leads to some indi-cations. First, it is shown that thepresence of growth options is associat-ed with abnormal returns during theevent period. The results reject thehypothesis that real options are notrecognised in the market place andindicate that market participants arenormally informed before theannouncement. The value of compa-nies that have real options increasestill the third day after real optionannouncement. Second, there is somesupport over the hypothesis that thegrowth options are value relevant dur-ing their life, since they can explain asignificant part of the appreciation ofMarket Value over Book Value.Thirdthere is some support of the predictiveability of the residual income model.Also, our findings over the predictiveability of residual income model aregenerally in line with findings fromUK and USA researchers. Therefore,our study provides some support overthe validity of residual income marketin the Greek share market.Furthermore, our study shows thatmarket seems to compensate thegrowth options that were finally exer-cised. Besides, the longer the durationof the growth options, the higher theappreciation of companies' marketvalue. The latter finding is in line withobserved practices of market valueappreciation of companies having highduration growth options, like Internetcompanies. Therefore our findingsmay partly give validity the continu-ous appreciation of Internet compa-nies. Finally, our findings from cross-sectional models match to our find-ings from the part of our study that
examines the effect of optionannouncements to companies' value.In particular, our event study findsthat exercised growth options com-pensate to company market value.These findings are also similar to find-ings over the effect of R&D announce-ments in other markets. Overall ourstudy should provide a link betweenthe real option theory and market val-uation. Moreover, these findings arepromising, because they reveal thatmarket valuation practices and thereal option theory converge in thecase of the growth options.
BBiibblliiooggrraapphhyy
1. Bellalah M., On irreversibility, sunkcosts and investment under incom-plete information, in Real R&Doption, 2003, Paxson (ed.),Buttererworth-Heinemann, Oxford,UK
2. Green J., Stark A., Thomas H., UKEvidence on the market valuationof research and development expen-ditures, Journal of Business Financeand Accounting, March 1996,pp.191-216.
3. Lint O., Pennings E., An optionsapproach to new product develop-ment: experience from PhilipsElectronics, in Real R&D option,2003, Paxson (ed.), Buttererworth-Heinemann, Oxford, UK
4. Ohlson J., Earnings, book valuesand dividends in security valuation,Contemporary AccountingResearch, spring 1995, pp.661-687.
VVaalluuee IInnvveesstt mmaaggaazziinnee
4466
5. Paxson D., Pinto H., Leader/follow-er real value functions if the marketshare follows a birth/death process,in Real R&D option, 2003, Paxson(ed.), Buttererworth-Heinemann,Oxford, UK
6. Trigeorgis L., A Log TransformedBinomial Numerical AnalysisMethod for Valuing Complex Multi-Option Investments, Journal ofFinancial and Quantitative Analysis,September 1991, pp. 309-326.
7. Tsekrekos E., The effect of first-
mover’s advantages on the strategicexercise of real options, in RealR&D option, 2003, Paxson (ed.),Buttererworth-Heinemann, Oxford,UK
8. Shah Z., Stark A., On the value rel-evance of major media advertisingexpenditures in the UK, 2001,Unpublished working paper
9. Sougiannis T., The accountingbased valuation of corporate R&D,The Accounting Review, Jan 1994,pp.44-68.
Konstantinos Vergos
VVaalluuee IInnvveesstt mmaaggaazziinnee
1 The variables are deflated by Closing Book Value
2 (MV-BV)/BV=α0+α1(1/BV)+α2(Ε/BV)+α3 (RI/BV)+λ1 Z1 + λ2 Z2+λ3 Z3 + λ4 Z4 + λ5 Z5 + λ6 Z6 + εi,t, given that z1 isthe market share possessed by firm I in year t,z2 is the degree of concentration for the industry to which firm ibelongs in year t,z3 is the ratio of short- and long-term debt to shareholders' equity plus reserves for firm i in yeart,z4 is the ratio of short- and long-term debt to shareholders' equity plus reserves for the industry to which firm Ibelongs in year t,z5 is (z3-z4)2,, z6 is the average variance of the stock returns for firm I for the four quarters endingin the quarter of the financial year-end.
AAuutthhoorr
Konstantinos Vergos, PhD President of Hellenic Association ofCertified Stock Market Analyst Head of Research, PentedekasSecurities S.A., Greece
Presented in 1st International Seminarin Quantitative Methods in Industryand Commerce, 26-27 May 2003, TEIof Athens, Athens, Greece
Investor relations (IR) is becomingslowly but progressively a disciplineand/or an art between a rock and ahard place. In other words a functionthat makes the difference for the list-ed companies’ communication processto the markets. Especially nowadayswith so many issues on corporateaccountability and effectiveness, theIR function is the one that arisesbeyond and above the corporate gov-ernance guidelines, which are univer-sal and standardised to many nationalequity markets and countries, espe-cially to the economic building blockssuch as European Union, NAFTA, etc.It is the one that makes the invest-ment case of a listed company and itslisted stock to be recognised and beon the radar system of the fund man-agers. The objective of this article is to pin-point/identify the involuntary and vol-untary disclosure strategies used bylisted companies and to evaluate theireffectiveness. As a consequence, I tryto extract an effective IR path/methodin order to attain the predeterminedgoals such as increase firm visibility,improve its liquidity and share pricethrough upgraded disclosure.
However to measure the effectivenessof the IR activities is a difficult task aswell as a dilemma and there is nostandard answer to it. I believe, as anIR practitioner that, ultimately the IRis measured up with some identifiablefactors. These factors mostly belongto the voluntary disclosure pool thatthe IRO and the senior managementcan use. The friendly, interactive andwell-informed company’s web site, theincreasing number of private meetingswith investors especially institutionalinvestors, the implementation of aroadshow policy, even the adequateand timely feedback to analysts arevariables which the IRO can intensifyor minimize well beyond theCorporate Governance principles andregulations. Other factors are moreobvious and simpler such as the num-ber of institutional investors year byyear, the retaining of existinginvestors, the number of people (endusers, institutional and individualinvestors) that know the companywell (through constant communica-tion and disclosure) and the increaseof the share price of the underlyingstock.Furthermore, as the local and globalmoney managers and analysts indi-cate, the Investor Relations Officer(IRO) has to plan strategy and tactics
on a global scale with clarity,resourcefulness and flexibility. For asmall, periphery but somehow dynam-ic market such as Greece, the IROmust add professionalism, seriousnessand reputation. Then, if properlyorchestrate his/her IR options, activi-ties and communication effectivenesseven the most disbelieving, pessimisticand suspicious targeted local andespecially global fund manager willinvest in the underlying Greek stock.Nevertheless, in order to attract USand European pension funds andother institutional investors into amarket such as Greece, which in reali-ty is still an emerging market, betterdisclosure, transparency and high gov-ernance standards and practices arealso key elements. Indeed, globalexperience indicates that investorsultimately pay more if they are com-
fortable with good returns coupledwith disclosure.
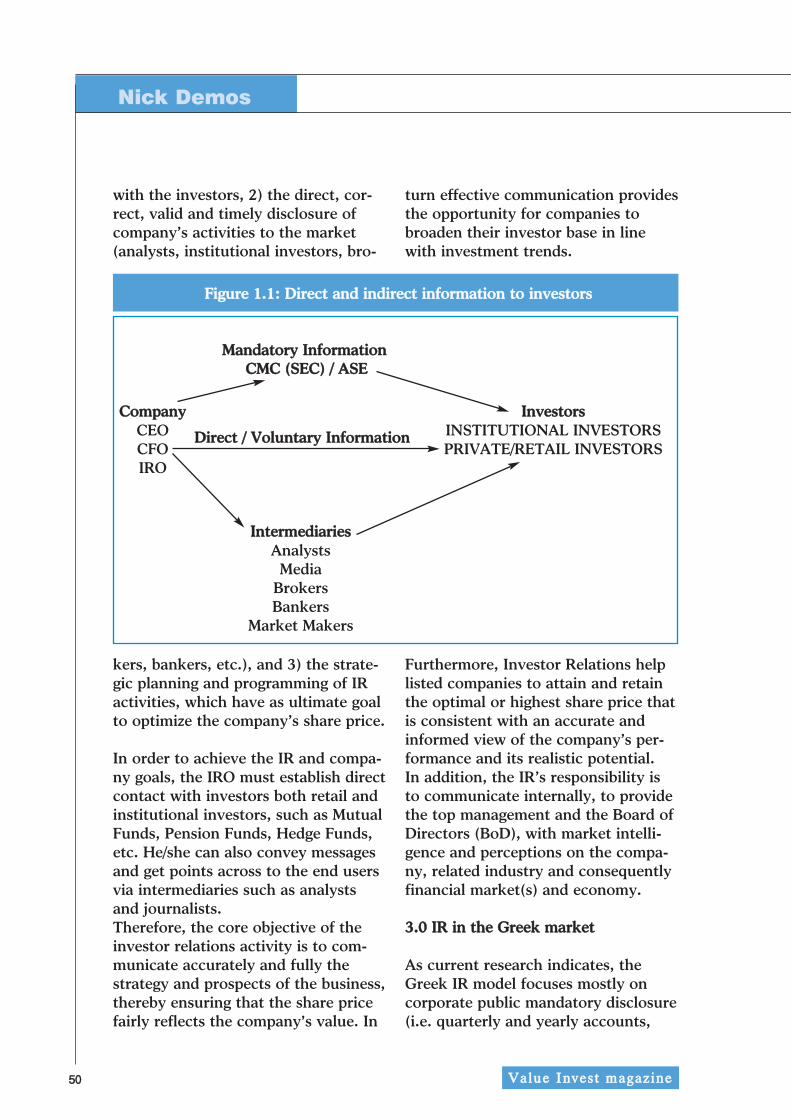
IR is a multidisciplinary function thatcombines principles, methods andtools from sciences and arts such asfinance, accounting, marketing, eco-nomics, game theory, public relationsand psychology.Most people accept that the IR func-tion does help the information flowbetween the listed companies andtheir audience (figure 1.1). It comesout of the basic need of communicat-ing the company’s information to themarket but as a silo of informationcan be used by the different interestedparties to their benefits. Exactly thenthe regulators appear in order to con-trol and direct the communicationchannel to a/the mutually benefit ofthe market.Managers run the listed firms (intrust), who plan and implement thestrategic and marketing plans andtherefore control all vital companyinformation. On the other side, allshareholders and stakeholders (i.e.suppliers, bankers, customers, etc)have little or no information on thecompany’s activities and performance.Thus this information asymmetry,between the two groups, creates theneed for an information processorsuch as the IR function. And the IRadventure begins, since as processor,is always between a hard place and arock.The basic aim of the InvestorRelations (IR) department, accordingto my experience is: 1) the creationand cultivation of relations of trust
VVaalluuee IInnvveesstt mmaaggaazziinnee
5500
with the investors, 2) the direct, cor-rect, valid and timely disclosure ofcompany’s activities to the market(analysts, institutional investors, bro-
kers, bankers, etc.), and 3) the strate-gic planning and programming of IRactivities, which have as ultimate goalto optimize the company’s share price.
In order to achieve the IR and compa-ny goals, the IRO must establish directcontact with investors both retail andinstitutional investors, such as MutualFunds, Pension Funds, Hedge Funds,etc. He/she can also convey messagesand get points across to the end usersvia intermediaries such as analystsand journalists.Therefore, the core objective of theinvestor relations activity is to com-municate accurately and fully thestrategy and prospects of the business,thereby ensuring that the share pricefairly reflects the company's value. In
turn effective communication providesthe opportunity for companies tobroaden their investor base in linewith investment trends.
Furthermore, Investor Relations helplisted companies to attain and retainthe optimal or highest share price thatis consistent with an accurate andinformed view of the company’s per-formance and its realistic potential.In addition, the IR’s responsibility isto communicate internally, to providethe top management and the Board ofDirectors (BoD), with market intelli-gence and perceptions on the compa-ny, related industry and consequentlyfinancial market(s) and economy.
33..00 IIRR iinn tthhee GGrreeeekk mmaarrkkeett
As current research indicates, theGreek IR model focuses mostly oncorporate public mandatory disclosure(i.e. quarterly and yearly accounts,
press releases, etc) according to by-laws and regulation and on any“impulsive action” internally by thepeople from the registry (metocholo-gio) department. In addition, in theGreek model we observe that themedia people not only substitute theinternal people who process the infor-mation but also affect at a large scalethe message given to the marketdirectly or via the sell side analysts’dailys.
Moreover, it looks as if most Greekcompanies, especially the small ones,ignore the requirements of the partic-ular IR position and rush to fill themwith non-qualified individuals. Insteadof hiring individuals with a strong per-sonality who combine market, sector,company and even some legal knowl-edge, and have some experience inportfolio management, public rela-tions and marketing, they attempt tofill the IRO positions with individuals
VVaalluuee IInnvveesstt mmaaggaazziinnee
IR CONSTRAINTS (REQUIREMENTS)
IR OPERATIONAL SET UP
IIRR TTOOOOLLSS // MMEEAANNSS
REGULATED DISCLOSURE VOLUNTARY DISCLOSURE via INTERMEDIARIES DISCLOSURE
whose most important asset may betheir relationship with the owners orthe top executives of the company, oranalysts or brokers simply trying toflee the shrinking brokerage business.These people, as a whole, fail toimpress foreign institutional investors.Adopting voluntary and mostly invol-untary disclosure policies and engag-ing in pre-marketing and proactiveroadshows abroad should be part ofthe listed firms’ “tool kit.” Failing todo so in an increasingly competitivelandscape for international institution-al funds may result in stock underper-formance, which could possibly hurtthe firm’s image among shareholdersand on aggregate undermine theAthens bourse’s future.Experience and opinions indicate thata number of factors may deter activeforeign funds from investing inAthens. The small sizes of the localstock market, its lack of depth in liq-uidity, etc are some of them.However, the biggest problem facinglocal firms is their inability to “sellthemselves” to the group of activeinternational investors. This is the jobof the Investor Relations Officer (IRO)but most Greek firms do not haveone. Although it is necessary forGreek firms to go out, market them-selves and attract the foreign funds bypursuing active and proactive IRstrategies, few seem to have takennotice and tried to comply.
The basic attributes for the effective-ness of the IR activity is the appropri-ate diagnosis of the specific firm’sneeds as well as the creative strategic
planning by the IR department com-bined with the personal attributes andcharacteristics of the IRO. Indeed, theimplementation of a strategic IR pro-gram might be good for one companybut marginal and detrimental for otherlisted companies. For instance, themain target for a small cap firm isusually the hedge and venture capitalfund manager, while for a maturecompany is the dividend institutionalinvestor.
An effective IR programme can beseparated in to five primary sections,which come to a fundamental market-ing strategic planning. A detailed stepby step process is exposed in ourupcoming book. Firstly, strategic planning. The plan-ning process involves creating a localbut most importantly a global commu-nications framework and forwardstrategy. The strategy will then berefined geographically as local marketconditions dictate. Central to thestrategy will be agreeing objectivesand specific benchmarks. Secondly, the IR programme includesthe creation of overall positioning andmessaging. Specifically this will entailgrafting compelling business defini-tions and central marketing themes tobe used across all communicationmaterial. Given the intense competi-tion for news as well as space in theglobal financial market, the ability forthe top management to precisely, suc-cinctly and creatively define the com-pany in a variety of market situationsis crucial. Thirdly, the IR programme is responsi-ble for executing global strategy at a
Nick Demos
VVaalluuee IInnvveesstt mmaaggaazziinnee
5533
local level. Every market has its ownidiosyncrasies. For example, in Greecetop big capitalization companies aresplit into joint-stock (government)companies, family controlled con-glomerates and subsidiaries of multi-nationals. In the USA, publicityrestrictions are particularly stringent.This can have wide ranging implica-tions for activity in other markets. Fourthly, the IR programme providesan ongoing issues and crisis manage-ment element to the project. Finally, the IR programme plays animportant role on a day-to-day basisidentifying opportunities, managingthe local and global communicationsand providing a sounding advice forthe company. This kind of proactiveapproach is fundamental to a solid IRprogramme and style of project man-agement and ensures the avoidance atall times of being placed in a reactiveor defensive position.
• Targeting fund managers / prospec-tive shareholders – The main IR targetand job is to thoroughly and exten-sively know the shareholders insideout and effectively in person by visit-ing them regularly. Our goal should beto ADD TARGETS AND PROSPECTSon the existing “funds”.
• Increasing the company’s shareprice
• Minimizing the IR expenses
44..33 IIRR PPrreerreeqquuiissiitteess
The requirements for an effective IRpolicy could be distinguished intocompany’s related constraints andpeople related prerequisites. Similarly,we can identify financial and non-financial requirements. Giving theseconstraints the IR office should:
• Develop a compelling investmentrationale -- Why should an investorbuy the company's stock? Primarily,a company's investment rationaleneeds to be communicated through-out all mandatory and voluntary dis-closure forums.
• Disclose timely company’s informa-tion -- When to disclose; Why dis-close; Who should disclose; andHow to disclose.
It is extremely important for everylisted firm to be aware and cater forthe different requirements of differentaudiences. For example, institutionalinvestors require information on strat-egy and prospects while equityresearch analysts demand informationon accounting and forecasting. It isclear that by adjusting the content ofits corporate communications, a listedcompany can
• Attract potential investors• Empower the long term relation-
ships with the current shareholders • Differentiate itself from its peer
group• Demonstrate its future growth
potential• Focus on the implicit under valua-
tion at which its shares trade
VVaalluuee IInnvveesstt mmaaggaazziinnee
5544
• Create positive news flow, whichwill have an immediate impact onshare price
When rules and regulations createinformation controlled and disclosurestandardized environment the needand existence of the IR is deterioratingif not disappearing. Disclosure tools such as:a. Annual Report (in Greek)b. Annual Report (in English)c. AGM voting decisions d. AGM vote participatione. AGM vote executionleave limited space to the IRO whiledoes not pinpoint the agency issuesand information asymmetries norspeculates on the insiders’ use ofinformation.
bb)) IIRR vviiaa IInntteerrmmeeddiiaarriieess
Major IR goals is also to
• Target sell-side analysts — The IRprogram would begin with the iden-tification of a "target list" for aproactive investor communicationseffort. Moreover, the IR officeshould use extensively databases ofanalysts who follow companies withsimilar profiles.
• Increase sell side analyst coverage –If one Global Analyst and two GreekAnalysts cover the stock, this is amediocre success and the IROshould double the number ofAnalysts covering the stock.
• Build relationship with stockbrokers/ market makers – The “middle”people can become important andvital marketing elements to promotethe story, the high calibre and quali-ty of the management and the groupprospects.
• Empower media relations -- Finally,the IR office should continuouslybuild solid relationships with themajor national and internationalbusiness media. Working with thelocal editors of the newspapers andmagazines as well as the editors ofThe Wall Street Journal, The NewYork Times, Business Week, Forbes,Barron 's and Fortune has led tomajor placements.
cc)) VVoolluunnttaarryy IIRR
The most effective tools belong to theIRO’s arsenal ready to be used discre-tionary in order to get high visibilitystatus and capital placement in thecompany’s share.Therefore, the IRO should:
• Set group and one-on-one meetings— Establishing an active program ofindividual and group meetings toexpand interest in the company.Management would provide a strate-gic overview of the market and thecompany. The IR office would coor-dinate the meetings, provide counselon the presentation, and follow upwith attendees to encourage invest-ment and to build lasting relation-ships with the company.
• Target buy-side analysts — The IRprogram would begin with the iden-tification of a "target list" for a
Nick Demos
VVaalluuee IInnvveesstt mmaaggaazziinnee
5555
proactive investor communicationseffort. Moreover, the IR officeshould use extensively databases ofanalysts and money managers whofollow companies with similar pro-files.
• Prepare interesting and motivatingcorporate materials — The IR officeshould have an in-house graphicsdepartment that can produce com-puter-generated slide presentationsthat correlate with the theme anddirection of management's strategy.
• Direct mail/surveys -- The conductof periodic surveys of analysts toobtain opinions and impressionsabout the company that can help tostrengthen management presenta-tion.
55..00 CCoonncclluussiioonn
By synthesizing the aforementionedparts, we create a benchmark formeasuring the IR effectiveness thatcould bring about the expected resultsfor the senior management as well asthe investors.Indeed the significant value the ΙR
office might add to the company isbased on the voluntary disclosurepolicies. With this I mean that eachcompany creates its own communica-tion and disclosure strategy forinvestors, analysts, bankers, brokers,etc., always within the framework ofthe market’s regulations. The foreign institutional investors,analysts and other market players,have formed a perception of Greeceand the Greek stock market.Historically, their bias is entrenched inthe uncertainty, lack of confidence,poor information, inconsistency etc.In order for the Greek companies toclarify any info and dissolve anyuncertainty either itself alone or alongwith the Greek state officials (i.e. theMinistry of Finance or Development)they should apply voluntary disclosurepolicies and their IR departmentsshould implement very proactive mar-keting plan.The concept not only of disclosingbrutally and bluntly the proper infor-mation but also of visiting the FMs’offices and briefing on the company’shistory and perspective is the best wayof selling the company’s share.
VVaalluuee IInnvveesstt mmaaggaazziinnee
AAuutthhoorr
Nick Demos is the HIRI (HellenicInvestor Relations Istitute) president
5566
In simple economies, there is little dis-tinction between savings and invest-ments. One saves by reducing present con-sumption, while he invests in the hopeof increasing future consumption.Therefore, a fisherman who spares afish for the next catch reduces hispresent consumption in the hope ofincreasing it in the future.Most of the people probably have sav-ings accounts with ATMs to accesstheir hard-earned cash and be able tostore away any extra cash in a place alittle safer than a mattress. A few ofyou may even have some stocks orbonds.Let me explain why while a savingsaccount in the bank may seem like asafer place than the mattress to storeyour money, in the long-term it is alosing proposition! If you open a savings account at thebank, they will pay you interest onyour savings. So you think that yoursavings are guaranteed to grow andthat makes you feel extremely good!But wait until you see what inflationwill do to your investment in the long-term! The bank may pay you 5 percentinterest a year on your money, if infla-tion is at 4 percent though, yourinvestment is only growing at a mere1 percent annually. Saving and investing are often usedinterchangeably, but they are quitedifferent!
Saving is storing money safely, suchas in a bank or money marketaccount, for short-term needs such asupcoming expenses or emergencies. Typically, you earn a low, fixed rate ofreturn and can withdraw your moneyeasily. Investing is taking a risk with a por-tion of your savings such as by buyingstocks or bonds, in hopes of realizinghigher long-term returns.Unlike bank savings, stocks andbonds over the long term havereturned enough to outpace inflation,but they also decline in value fromtime to time. The rate of returns and risk for sav-ings are often lower than for otherforms of investment.Return is the income from an invest-ment.Risk is the uncertainty that you willreceive an expected return and preser-vation of capital.Savings are also usually more liquid.That is, you may quickly and easilyconvert your investment to cash.The decision about which investmentto choose is influenced by factorssuch as yield, risk, and liquidity.Investments may produce currentincome while you own the investmentthrough the payment of interest, divi-dends or rent payments. When you sell an investment for morethan its purchase price, the profit isknown as a capital gain, also calledgrowth or capital appreciation.
Ioannis - Evangelos C. Haramis
VVaalluuee IInnvveesstt mmaaggaazziinnee
Saving Versus Investing
5588
Greece and Turkey have experiencedstrong growth in recent years and areexpected to continue to attract furtherinternational capital as well as gener-ate internal corporate activity as fami-ly groups rationalise, governmentsdivest and industries consolidate:
• Both have become major centres ofinward investment - Greece as thecornerstone EU economy in SouthEast Europe and Turkey as a majoreconomy in its own right with majorsuccessful recent institutionalreforms; and
• Both are increasingly becomingregional centres of investment forthe surrounding areas of theBalkans and, in the case of Turkey,the Turkic Republics.
With both markets of such interest, itis worth addressing some of the keyissues in Greek-Turkish investmentflows. After all, these are two attrac-tive, large, contiguous markets, withmany similarities. It is natural there-fore to consider that cross-borderinvestments could give rise both togrowth opportunities, in accessingnew markets, and to cost synergies, insuch areas as manufacturing, distribu-tion and logistics.Historically, however, political reality
belied this commercial opportunity:national and personal prejudicesplayed a big role in curtailing potentialflows. In more recent years, through acombination of factors, this situationhas improved considerably, thoughsome obstacles still remain. In terms of direction, investmentsseem to flow more easily to the East(ie from Greece into Turkey); andthere have been more of them. Thelargest, by a long shot, was the 44.5billion acquisition of Finansbank by
Markos Komondouros
VVaalluuee IInnvveesstt mmaaggaazziinnee
Crossing the Aegean:Greek M&A investmentinto Turkey
5599
National Bank of Greece just under ayear ago. This was a watershed trans-action and, as such, tested percep-tions. Rumours and newspaper gossipabout customer withdrawals atFinansbank abounded on the news,but in practice were insignificant andthe noise quickly died down. Today, itis doubtful that many customers ofFinansbank register that they are deal-ing with a Greek bank. Follow-upacquisitions by both Eurobank andAlpha Bank in the Turkish bankingsector reinforce this point. Other,longstanding Greek investors in
Turkey include Intracom, Intralot andSilver & Baryte. On the other hand, Turkcell's attemptto acquire TIM Hellas a few monthsago from TPG and Apax was morecontroversial, and they received aquiet word from the authorities todesist. Newspaper reports in Greecesuggested " it is one thing for a Greekbank to buy a Turkish one, and quiteanother for a Turkish company to buyinto such a strategically sensitive sec-tor as telecoms". The fact that the tar-get in question represented only 10%of the mobile telecoms market, andwas of course itself already foreign-owned, was not commented on!Interestingly, TIM Hellas has nowbeen sold to an Egyptian buyer.Turkish companies do of course oper-ate in Greece but, to date, principally
through distributors; and someTurkish food and clothes retailershave successfully set up shop here. Amore significant industrial investmenthas yet to happen but that day willalso come. Against this background, we focus onsome of the key factors that a Greekcompany may consider in evaluating apotential investment in Turkey.
GGrroowwtthh aanndd ssttaabbiilliittyy::For decades Turkey seemed unable tobreak out of the notorious boom-and-bust cycles of heady growth followed
regularly by sharp downturns, devalu-ations and financial crises. Successiveweak coalition governments weremainly responsible for this, lackingthe political will and determination topush through necessary reforms. Thischanged in November 2002 with theAKP party winning a majority in par-liament. Their political agenda wasnot necessarily popular with theTurkish business world. The govern-ment has nevertheless delivered aseries of structural reforms, which, incombination with a strict IMF pro-gramme, have produced remarkablestability and encouraged inwardinvestment. FDI in each of 2005 and2006 exceeded US$10 billion, com-pared to an average annual figure ofless than US$1 billion over the tenprevious years.
2007 was generally expected to be amore difficult year, with creepingparalysis due to presidential and par-liamentary elections in May andNovember (now brought forward toJuly) respectively, and uncertaintysurrounding the outcome of both.Nevertheless, for those more familiarwith Turkey, the fundamentals of theeconomy (a young and growing popu-lation, a broad industrial base, dynam-ic private sector and skilled, relativelylow-cost workforce) underpin contin-ued growth and suggest 2007 may bea buying opportunity if anything.
EEUU aacccceessssiioonn::Another issue is whether the difficultpath towards EU accession mayundermine investment stability. Overthe past few months the accessionprogress seems to have got stuck inthe mud, over Cyprus primarily, withEU entry becoming a distant if notcompletely fading prospect. Clearlythe EU accession path has played animportant role in guiding Turkeytowards reforms and in encouragingforeign investment to date. The thesiscould be made, though, that theTurkish economy is now so inter-twined with the European markets,and that there is so much fixed for-eign investment in Turkey, in bothservices and manufacturing, thatTurkey is effectively already integrat-ed with Europe; and that integrationis so deep as to appear irreversible.This could be the strongest guaranteeof continuing stability and disciplinein the markets.
CCuurrrreennccyy eexxppoossuurree::Persisting high local currency interest
rates (currently around 20%) continueto tempt Turkish borrowers to fundtheir operations by borrowing in for-eign currency. In the case ofexporters, this can provide a naturalhedge. However, for most companies,this practice, while boosting profitabil-ity in the short-term, creates a curren-cy exposure which can be quitepainful in the case of sharp falls in theTurkish Lira, as most recently hap-pened last May. Turkish entrepre-neurs and managers claim to be expe-rienced at managing and takingadvantage of this exposure; on theother hand, a potential investor needsto be clear whether he is making abusiness investment or taking a viewon currencies, and structure a poten-tial investment or partnership accord-ingly.
IInnffllaattiioonn aanndd iinntteerreesstt rraatteess::Institutional reforms, particularly inthe banking sector, seem to have suc-ceeded in breaking inflation expecta-tions after decades, and have broughtannual price changes close to singledigit territory. This has in turn had abeneficial impact on the domesticlending market, with Turkish Lira bor-rowing beginning to be available forlonger-term maturities. Over the pasttwo years, this has mainly operated ina virtuous circle, with falling inflationfigures helping drive foreign invest-ment flows, thereby counterbalancingthe pressure on the currency of otherpotential imbalances such as the sig-nificant current account deficit. Ingeneral, this downward trend isexpected to continue, albeit with somepossible turbulence due to the difficultpolitical calendar mentioned above.
Markos Komondouros
VVaalluuee IInnvveesstt mmaaggaazziinnee
6611
TTaarrggeett sseeccttoorrss::A further flow of Greek investmentinto financial services could be expect-ed. Banks like Piraeus and Marfinboth have stated regional expansionstrategies, and targeting the largestregional market would seem natural.We would also expect Greek flowsinto other financial services sectorssuch as insurance, factoring and leas-ing. Other diverse areas where Greekinterest in Turkey could reasonably beexpected are in food, retailing, trans-port, IT services and building materi-als. In tourism, another natural targetarea, there have been some minorefforts at cooperation, but no majorinvestments as yet. Amongst somehoteliers, the reaction has been heardthat they would not want to "taketourists away from Greece" by invest-ing in Turkey; others may howevertake a more constructive view andlook at the significant opportunitiescreated by covering both markets.
PPrrooffeessssiioonnaall sseerrvviicceess aanndd hhuummaannrreessoouurrcceess:: For those less familiar with Turkey, apleasant surprise is often the qualityand depth of professional manage-ment available. Western-style (oftenWestern-trained) managers are plenti-ful and experienced. This is criticalbecause Turkey is a market with itsown particularities and having stronglocal management is an essential partof a successful investment. There isalso a high quality supply of profes-sional services firms that can adviseon transactions, be they lawyers,accountants or consultants.All these aspects suggest to us thatthere is significant further potential in
the short to medium term for Greekinvestment into Turkey. With respectto helping such transactions happen,we believe that in regional marketssuch as Greece and Turkey there is aniche for high-level advice to interna-tional standards but with an in-depthlocal understanding and capability.The combination of experienced,internationally-accomplished invest-ment bankers providing a tailored,specialised financial advisory serviceon a small-scale, local and committedbasis addresses this need. This iswhat Vector Partners, a financial advi-sory boutique with offices in London,Athens and Istanbul, provides. VectorPartners' aim is simple: to providetop-quality financial advice to thehighest international standards in rela-tion to the Greek, Turkish and region-al markets. It has been set up by pro-fessionals with decades of experiencein the international financial and capi-tal markets with leading global invest-ment banks. One of Vector Partners'founders established and ran UBS'sbusiness in Turkey for five years. Wetherefore have an intimate under-standing of the market, speak thelocal language in all senses of theword, and can offer the contacts andideas that a Greek potential investorinto Turkey needs.
TThhee aauutthhoorr::Markos Komondouros is aprincipal of Vector Partners(www.vectorpartners.eu). He spent 15years with S.G. Warburg/UBS, includ-ing 5 years in charge of their Turkishbusiness, before moving to Greecerecently to co-found Vector Partners.
VVaalluuee IInnvveesstt mmaaggaazziinnee
6644
The chart below shows the real pricesin oil adjusted to inflation until 2004.It shows clearly how oil behaved the
past 35 years amid significant geopo-litical developments.What can oneobserve by looking at the chart at first
H&F Analysis
VVaalluuee IInnvveesstt mmaaggaazziinnee
Past Oil Crises A quick overview Originally published in 2005
glance is that on real terms crude oilhas gone up to almost $90 per barrelin early 80’s which was a result of thepanic in the oil industry due to theIraq-Iran war that was declared in1980 following a seizure of power inIran from Ayatollah Khomeini in1979. That was the 5th post war oilcrisis. Before that another great increase in
oil prices happened in 1973 at theArab Oil Embargo when prices rosefrom $2.90 in September 1973 to$11.65 in December of the same year.That was the 4th post war oil crisis. (Just for the readers interest the previ-ous first 3 post war oil crisis were:1st - In 1951 when Iran nationalizedthe Anglo-Iranian oil industry.2nd – In 1956 at the Suez crisis.
Asian economic crisis; oil oversupply; prices fall sharply
Prices rise sharply on OPEC cutbacks,
Prices fall sharply on 9/11 attacks; economic weakness
Prices spike on Iraq war, rapid demand increases, constrained OPEC capacity, low inventories, etc.
Saudi Light
Imported RAC
Source: EIA
Major Events and Real World Oil Prices, 1970 - 2006(Prices adjusted by CPI for all Urban Consumers, 2005)
6655
3d – In 1967 and the Suez canal clo-sure due to the Six Day War).The invasion of Iraq into Kuwait in1990 caused the Gulf War in 1991 thatput in risk a total production ofalmost 6 million barrels per day (Iraq+ Kuwait) and resulted in the sabo-tage of the Kuwaiti oil fields by theIraqi army that kept burning for more
than a year! That was the 6th postwar oil crisis that drove prices at $40(something less than $50 in 2004 realprices).It was a major oil crisis since 2 bigOPEC producers were at war whichled to the sabotage of the hugeKuwaiti oil fields.
From the past 6 oil crises since 1951,five of them included a war and/or anembargo, and all of them were drivenfrom fears of a sudden loss of signifi-cant oil supply – (major supplyshock).
According to past oil crisis trigger fac-tors, what may have contributed totoday’s major oil crisis was the US ledinvasion in Iraq in 2003. It lead to atemporary loss of all of Iraqi oil pro-duction and to permanent loss of oil
6666
supply of almost 1 million barrels perday since Iraq never restored pre-warproduction levels of 2.8 mbpd. It alsotriggered a spree of sabotage actionsagainst oil installations in the MiddleEast. The 2003 Iraqi war followed the majorgeneral strike of a major OPEC pro-ducer Venezuela, that caused the per-manent loss of something between500,000 – 1,000,000 million barrelsper day since 12,000 employees ofPDVSA (national oil company) werefired and the oil industry of Venezuelanever fully recovered production atthe pre-strike levels of 3.4 mpd.Analysts estimate current productionbetween 2.4 – 3.0 mbpd.As a result we can say that the current7th oil crisis which is caused due tothe inability of supply to coverdemand, may find it’s origins at the2003 Iraqi war and the Venezuelanstrike which shaved-off 2 million bar-rels per day of existing spare capacityand minimized the world’s cushionagainst price shocks such as the oneswe are experiencing today!
A lack of supply cushion means thatany geopolitical change, any terroristact or a major hurricane (like lastyear’s Ivan ) will be hard to be antici-pated by global supply. The only supplier with spare capacityfor the winter of 2005 is Saudi Arabia(another 1-1.5 mbpd) and theEmergency Reserves of IEA and USA(Strategic Petroleum Reserve – SPR)which are used only under an extremeemergency.What is clear from current world’ssupply/demand balance is that for thewinter of 2005, the world is vulnera-ble to any supply shock since theavailable cushion is minimal.Anything from a heavy winter to anatural disaster or geopolitical devel-opment will push prices higher.Unfortunately in the oil industry addi-tional supply takes year to come onstream while supply shock only need afew hours or less sometimes!
H&F Analysis
VVaalluuee IInnvveesstt mmaaggaazziinnee
6688
Over the past decade, a centralmethod used by equity analysts tovalue banks was a variant of theGordon Growth Model. In variousreports, analysts across manyEuropean financial institutions wereobserved to derive the price / bookvalue multiple that a banking stockshould trade at, by comparing thebank’s profitability to its cost of equi-ty capital adjusted for the growth rate.The above method is shown in the fol-lowing formula:
P = Share PriceBV = Book Value per ShareROE = Return on EquityCoE = Cost of (Equity) Capitalg = Long Term Growth Rate
The above equation – also known asthe “Net Asset Value Approach” – hasfor years been a simple method togauge a bank’s fair value by using
straightforward numbers with theminimum complexity.Although the constituents of the equa-tion are relatively easy to calculate,they are still very critical numbers. Tomeasure a bank’s profitability analystsuse “Return on Equity” (net profitdivided by net shareholders’ funds),one of the most popular and meaning-ful ratios among shareholders. Also, tocalculate the “Cost of Capital” (or“Cost of Equity”) they only have toadd market (or equity) risk premium,adjusted for beta, to risk free rate(CoE = RF + MRP x Beta). Finally, toestimate the long-term growth rate or“g” analysts have to use not only abank’s historic performance but alsotheir intuition with regard to its futureprospects. In other words, it seemsimpossible for analysts to unanimous-ly agree on one target (fair) pricewhen they analyze a particular bank.The implied price of a banking stockis derived through the following equa-tion:
Valuing banking stocksA Synopsis on the BasicModelsThe Pros & Cons Utilizing Evidence fromEuropean Equity Research Practices
6699
Divergence of opinion does not appearto be a serious obstacle for an efficientmarket; however, no model or valua-tion method is flawless, despite theextent to which it is being used byequity analysts.In the case of the valuation methodunder review, criticism is focusedupon the assumptions that have to bemade and their reliability in the longerterm. More specifically, this modelseems to be especially sensitive tomany assumptions, possessing highleverage. Meaning, that it is easy tomake small changes in its assumptionsand produce big differences in thefinal valuation number. In addition,assumptions are quite subjective andconsequently cannot be verified oreven rejected. For example, a range of8% - 9% in sustainable ROE may pro-duce a range of 0% to 20% in the
upside potential of a banking stock,when other parameters are held con-stant.As equally important weaknesses withregard to this model, we should high-light the following:
a) The model is biased towards shortterm and medium term profitability.When analysts estimate “g” forshort-term periods, the rate tendsto be higher, producing larger valu-ation numbers (when ROE > CoE).
b) The model is not very well suitedfor banks operating in emergingmarkets or regions that providefinancial data for short periods.This makes some parameters eitherdifficult to calculate or meaninglessto use (risk free rate or beta forexample).
VVaalluuee IInnvveesstt mmaaggaazziinnee
7700
c) The final valuation number tends tocome out bigger since the formulais being adjusted for “g” (this alsoapplies when ROE > CoE).
The following table presents the keyassumptions which analysts mustmake applying this model:
On the other hand it is important tonote that the model does demonstratesome key advantages:
a) It takes into account the most criti-cal factors highlighting the financialperformance of a banking institu-tion (ROE, CoE, g, BV).
b) It has a focus on shareholder value.
c) It incorporates the risk factor.
d) It incorporates expectations ofgrowth in earnings and / or divi-dends.
TThhee MMooddeell AApppplliiccaattiioonn
Analysts use this model mainly as sup-port to strengthen their argumentsover the fair value of a banking stock.Under this perspective, assumptionshave to be clearly stated and some-times thoroughly explained in terms ofcalculation. However, “ …the moresophisticated and theoretically sounda model is, the more inputs it relieson, and consequently but not para-
doxically as many analysts believe, theless accountable it becomes… ” forboth analysts and investors.When analysts use this model in theirreports, they also construct a sensitiv-ity matrix, showing how the target(fair or implied) price of a bankingstock changes due to small changes in“g” or “ROE.”
There are many different paths fol-lowed by equity analysts to estimatethe appropriate values of the model’sparameters:““gg””:: It reflects the prospective growthof the bank in the long term. It is esti-mated by taking into account dividendor net profit CAGR (for historic aswell as future periods). Many analystsassume this rate above the long-termGDP growth of a country, when thelatter is under-banked and vice versa.““CCoosstt ooff CCaappiittaall””:: It is calculated asthe sum of risk free rate and marketrisk premium2 (adjusted for beta).Based on the level of disclosure trans-parency, the free float, and the marketcap, the equity risk premium can beadjusted accordingly. For example, ahistory of negative news surprisesimplies higher risk.““RROOEE”” SSuussttaaiinnaabbllee oorr AAcchhiieevvaabbllee:: Thisestimate can become especially sub-jective. It reflects the bank’s ability todeliver profitability under stable mar-ket conditions in the long term.Looking at the bank’s history may beenlightening.Some versions of the model oftenused by analysts to value bankingstocks are presented below:
Nicholas I. Georgiadis
VVaalluuee IInnvveesstt mmaaggaazziinnee
7711
SSoouurrcceess:: Financial analysis bibliog-raphy, European equity researchreports.
AAuutthhoorr Nicholas I. GeorgiadisDirector of Research - “VRS”(“Valuation & Research Specialists”)
Analysts choose the most appropriate value according to the most likely scenario at the time of issuing theresearch report.
1It usually stands for the long-term government bond yield.2The yield on long-term sovereign bonds is used as proxy.3Significant corporate activity may distort price behaviour and weaken reliability of beta.
SFiT (Specialized Financial Translations) is an expert in the provision of integrat-
ed services in the area of specialized financial translations for more than 10
years. Through several years of experience, with responsibility and reliability, we
have developed lasting relations with our customers, providing high quality serv-
ices. We collaborate with experts, financial analysts, and specialist translators
with graduate level education and academic experience. At SFiT, we cater to
your actual translation needs and offer you solutions for the efficient promotion
of your company.
Our experience stems from long-term collaboration with companies listed on the Stock Exchange. Ourservices relate to translations and editing of a broad range of texts, such as:
• Annual Reports, • Annual Bulletins,• Press Releases, • Company Profiles,• Financial Statements, • Certified Auditor - Accountant Reports,• Notes on Financial Accounts, • Business Correspondence.• Advertising Promotion, etc
Our company maintains a relation of mutual respect with its corporate clients, meeting the strictestconfidentiality requirements for data and information.
Today companies, striving to expand their business activities abroad, seek to establish an internationalpresence. Pursuing this logic, they communicate closely and regularly with customers, suppliers,collaborating companies, as well as interested investors from abroad.Consequently, market requirements as well as the necessity for companies to put forward a competi-tive new face, make financial translation an essential tool to better publicize their corporate identity tocollaborating suppliers, potential customers, as well as foreign investors.
TTrraaiinniinngg SSeemmiinnaarrss
Our company, independently or in collaboration with prestigious Greek institutions, undertakes thetraining of the executive staff of companies in various areas of specialized financial translations, inorder to provide interested companies with useful expertise for their day-to-day operations.
PPootteennttiiaall CCuussttoommeerrss
• Companies listed on the Stock Exchange • Telecommunications Companies• Industries, Commercial Companies, • Public Corporations
Construction Companies • Private Customers• Food Industries & Companies • Translations of Corporate Websites