VALUE OPPORTUNITIES FUND Bay County Charles F. Hofer, CFA Partner, Investment Strategist, Equity Brian P. Roach, CRPS Director, Institutional Investor Services Lord Abbett 90 Hudson Street Jersey City, NJ 07302 This presentation has been prepared exclusively for use with the Bay County Retirement Board of Trustees. It is not intended for, and should not be used with, any third party or the public in written or oral form or for any other purpose. DECEMBER 8, 2015
Transcript
VALUE OPPORTUNITIES FUND
Bay County
Charles F. Hofer, CFAPartner, Investment Strategist, EquityBrian P. Roach, CRPSDirector, Institutional Investor Services
Lord Abbett90 Hudson Street
Jersey City, NJ 07302
This presentation has been prepared exclusively for use with the Bay County Retirement Board of Trustees. It is not intended for, and should not be used with, any third party or the public in written or oral form or for any other purpose.
DECEMBER 8 , 2015
11
OUR FIRM
Investment-Led Active management characterized by a deliberate process, teamwork, and collaboration
Rigorous research that challenges consensus and identifies opportunities
Comprehensive risk management that enhances investment decisions
Investor-Focused Perspectives shaped and decisions sharpened by our independence
Resources dedicated to the markets we serve
Strategies intelligently designed to meet client needs
A singular focus since 1929
22
LORD ABBETT AT A GLANCE
Note: Assets under management data is as of 09/30/2015 unless noted and includes approximately $1.4 billion for which Lord Abbett provides investment models to managed account sponsors.
$127.7 BILLION IN ASSETS UNDER MANAGEMENTIncluding approximately $1 billion from current and former partners, employees and their families
U.S. Equity: $29.4 billion Large to Micro Value Large Cap Core Large to Micro Growth Dividend Growth Equity Income
International: $2.6 billion Core Equity Dividend Income Small Cap Core
Short, Intermediate, & Long Short Duration High Yield AMT Free State Specific High Yield
Tax-Free Income: $16.8 billion
Fixed Income: $73.0 billion Short Credit Government Core & Core Plus Inflation Focused Corporate Credit Bank Loan Multi-Sector Emerging Markets Corporate Debt Emerging Markets Currency Long Duration High Yield Convertible Emerging Markets Local Bond
EQUITY FIXED INCOMEMULTI-ASSET CLASS
Equity & Fixed Income: $5.9 billion
Income Balanced Opportunity Growth Global Opportunity
33
ORGANIZATIONAL STRUCTURE & INVESTMENT TEAMS
1 Associate Portfolio Manager
6 Small/Smid Cap Research Analysts
7 Traders
1 Risk Officer
Daria L. FosterManaging Partner
ClientServices
CoreServices
139 Investment Professionals with an average of 17 years industry experience
InvestmentServices
Global EquityResearch
David J. Linsen, CFAPartner & Director
Fixed Income
Robert A. LeePartner & Director
Tax-Free Income
Dan S. Solender, CFAPartner & Director
International Equity
Vincent J. McBridePartner & Director
Equity Risk Management
Alec I. CrawfordPartner & Chief Risk
Officer
QuantitativeResearch
Walter H. Prahl, Ph.D.Partner & Director
U.S. EquityPortfolio Management
11Portfolio Managers
As of 09/30/2015.
11 Portfolio Managers 8 Associate Portfolio
Managers 19 Credit Research
Analysts 8 Traders 2 Research Analysts 1 Portfolio Analyst
2 Portfolio Managers 4 Associate Portfolio
Managers 8 Research Analysts
7 Research Analysts
Robert I. Gerber, Ph.D.Partner & Chief Investment Officer
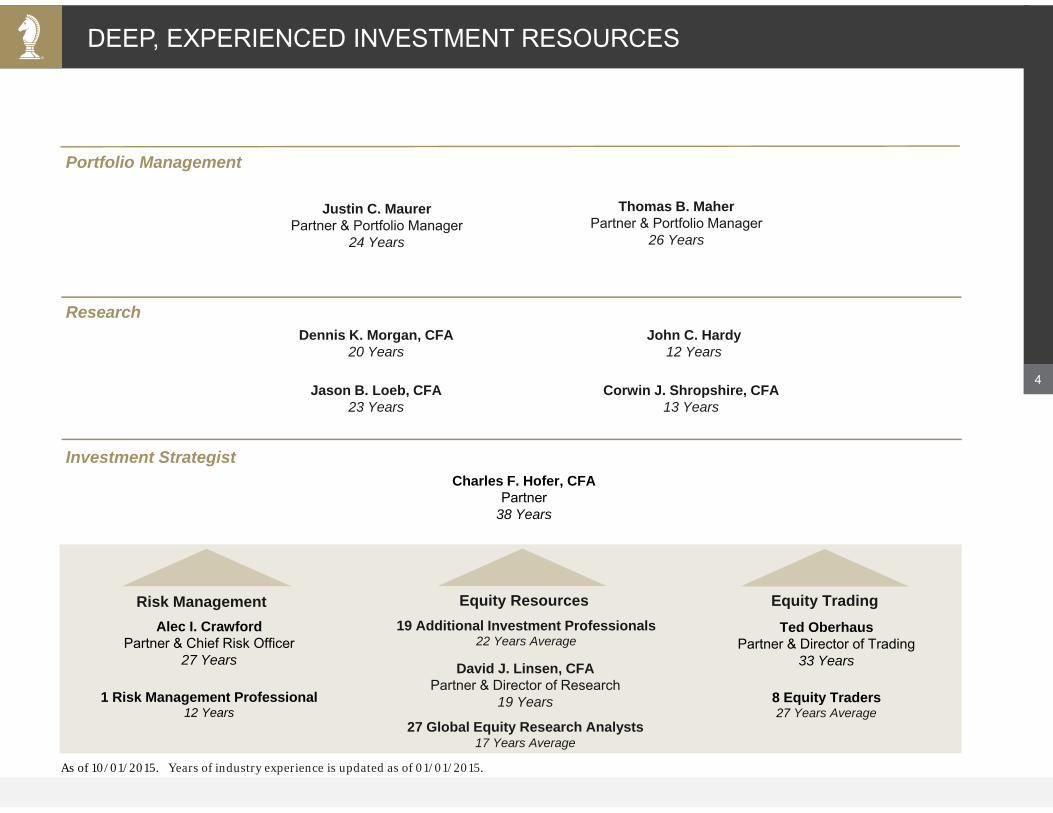
19 Additional Investment Professionals22 Years Average
David J. Linsen, CFAPartner & Director of Research
19 Years
27 Global Equity Research Analysts17 Years Average
As of 10/01/2015. Years of industry experience is updated as of 01/01/2015.
5
We believe strong long-term risk-adjusted returns can be achieved by: Active management that utilizes a repeatable process and collaborative teamwork
Comprehensive research that rigorously challenges consensus to identify opportunities
Insightful risk management designed to enhance investment decisions
QUALITY VALUE INVESTMENT PHILOSOPHY
Analysis period includes Value Opportunities Fund from 01/01/2006 through 06/30/2015. Performance data quoted reflect past performance and are no guarantee of future results. Please see Performance and Attribution sections for Fund performance. Current performance may be higher or lower than the performance data quoted. The investment return and principal value of an investment in the Fund will fluctuate so that shares, on any given day or when redeemed, may be worth more or less than their original cost. You can obtain performance data current to the most recent month end by calling Lord Abbett at (888) 522-2388 or referring to our website at lordabbett.com.Indexes are unmanaged, do not reflect the deduction of fees or expenses, and are not available for direct investment.
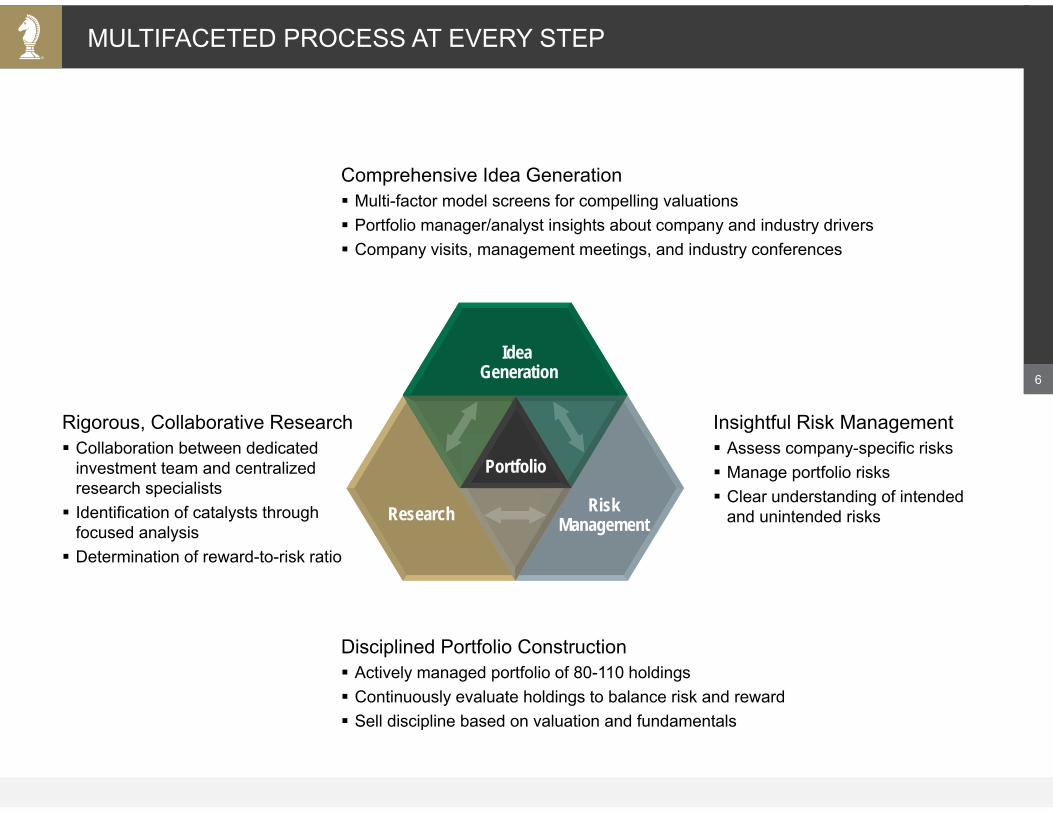
Rigorous, Collaborative Research Collaboration between dedicated
investment team and centralized research specialists Identification of catalysts through
focused analysis Determination of reward-to-risk ratio
Comprehensive Idea Generation Multi-factor model screens for compelling valuations Portfolio manager/analyst insights about company and industry drivers Company visits, management meetings, and industry conferences
Disciplined Portfolio Construction Actively managed portfolio of 80-110 holdings Continuously evaluate holdings to balance risk and reward Sell discipline based on valuation and fundamentals
Portfolio
MULTIFACETED PROCESS AT EVERY STEP
7
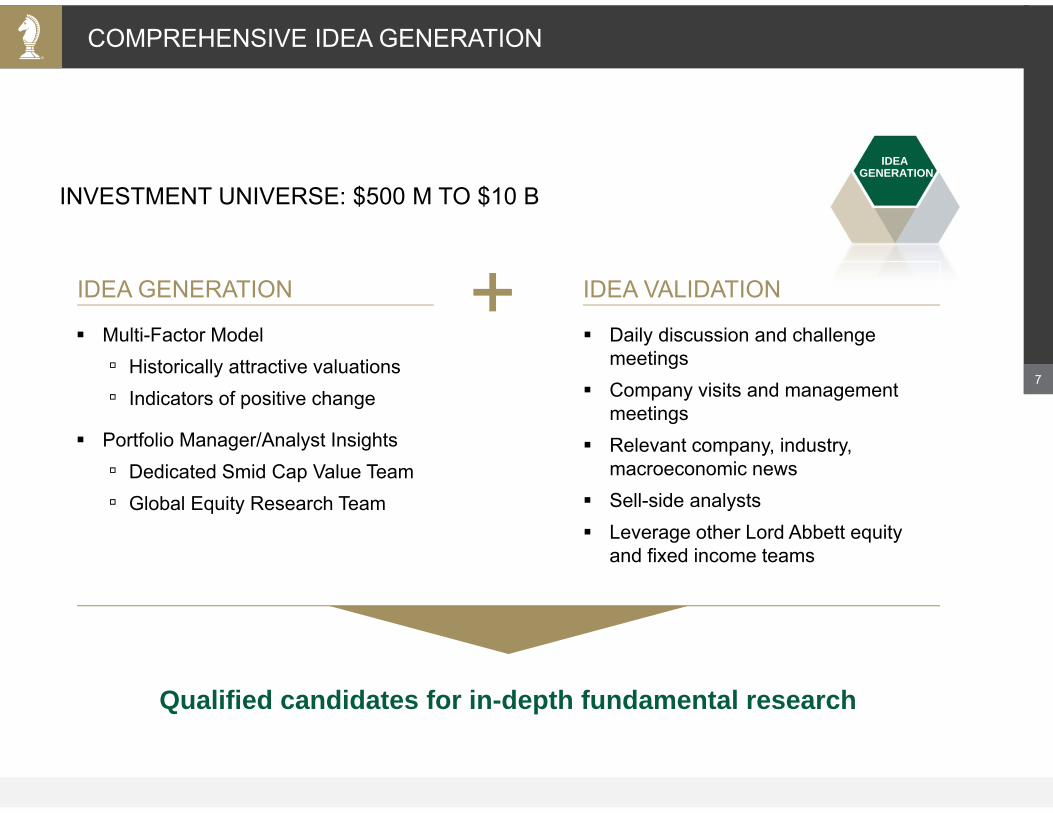
INVESTMENT UNIVERSE: $500 M TO $10 B
COMPREHENSIVE IDEA GENERATION
IDEA GENERATION
Multi-Factor Model▫ Historically attractive valuations▫ Indicators of positive change
Portfolio Manager/Analyst Insights▫ Dedicated Smid Cap Value Team▫ Global Equity Research Team
Daily discussion and challenge meetings
Company visits and management meetings
Relevant company, industry, macroeconomic news
Sell-side analysts Leverage other Lord Abbett equity
and fixed income teams
Qualified candidates for in-depth fundamental research
IDEA GENERATION IDEA VALIDATION
8
RESEARCH
Collective framework▫ Generalists for broad market
perspectives▫ Specialists for industry expertise
Focus of analysis▫ Business model▫ Industry trends▫ Regulatory environment▫ Relevant drivers
Identification of catalysts
Analysts project earnings and multiple potential based on fundamental factors
Prospective reward-to-risk ratio calculated using historical valuations
FUNDAMENTAL RESEARCH VALUATION ANALYSIS
High-conviction ideas distinct from consensus
RIGOROUS, COLLABORATIVE RESEARCH
9
RISKMANAGEMENT
Focus on stocks trading below historical valuations
Deep understanding of company fundamentals
Emphasis on competency of management
Impact analysis of key drivers
Comprehensive risk analysis▫ Sector/style exposures▫ Market cap exposures▫ Cyclical vs. defensive positioning
Thematic scenario analysis▫ Macroeconomic events▫ Industry conditions
ASSESSING COMPANY RISKS MANAGING PORTFOLIO RISKS
Clear understanding of intended and unintended risks
INSIGHTFUL RISK MANAGEMENT
10
Actively managed portfolio of 80-110 holdings
Position weights determined by reward-to-risk ratios and conviction in catalysts
Strategic adjustments to position sizes to mitigate unwanted risks and potentially capitalize on opportunities
Continuous evaluation of current holdings vs. new ideas
Sell discipline based on valuation and fundamentals
DISCIPLINED PORTFOLIO CONSTRUCTION
PORTFOLIO
Diversified portfolio that seeks to balance risk and reward
11
SECTOR ALLOCATION
INDUSTRY ALLOCATION
Value Opportunities Fund Russell 2500 Index
ACTIVELY MANAGED EXPOSURES
AS OF 09/30/2015
Active Weight
TOP UNDERWEIGHTSTOP OVERWEIGHTS
Source: Wilshire AtlasSM ("Wilshire"). Indexes are unmanaged, do not reflect the deduction of fees or expenses, and are not available for direct investment. Please see Appendix for information "About Wilshire" and the calculation of performance attribution information and for "Important Performance and Other Information." GICS Sectors/Industries. Sectors may include many industries. The Fund's portfolio is actively managed and portfolio characteristics, such as individual holdings and sector weightings, may change significantly over time.
0% 2% 4% 6% 8% 10% 12%
IT Services
Insurance
Health Care Prvdrs
Road & Rail
Construct & Engineering
0% 2% 4% 6% 8% 10% 12%
Software
Real Estate Inv Trusts
Biotechnology
Health Care Eqpt & Spls
Elec Eqpt, Instru & Comp
0%
5%
10%
15%
20%
25%
30%
35%
40%
Utili ties Financials Information Technology Energy TelecommunicationServices
Materials Consumer Staples Health Care Industr ials Consumer Discretionary
The Fund's portfolio is actively managed and Fund characteristics, including the ten largest holdings, may differ as of a more recent date and will vary significantly over time. *GICS Sectors & Industries
Pinnacle Foods Group LLC Consumer Staples Food Products 1.9
Portland General Electric Co. Utilities Electric Utilities 1.8
Total 21.5%
13
Source: Wilshire AtlasSM ("Wilshire"). Represents attribution relative to the Russell 2500TM Value Index, which was the primary benchmark for the strategy prior to 06/30/2014. Effective 06/30/2014, the primary benchmark has been changed to the Russell 2500TM Index. Performance data shown above is historical. Past performance is not indicative of future results. Current performance may be higher or lower than the performance data shown. Indexes are unmanaged, do not reflect the deduction of fees or expenses, and are not available for direct investment. Please see Appendix for information "About Wilshire" and the calculation of performance attribution information and for "Important Performance and Other Information." The Fund's portfolio is actively managed and portfolio characteristics, such as individual holdings and sector weightings, may change significantly over time.
CONSISTENTLY STRONG STOCK SELECTION
YearStock Selection*
(%)Sector Allocation
(%)Total Variance
(%)
2006 14.0 -2.5 11.5
2007 9.2 10.4 19.6
2008 4.7 0.5 5.2
2009 1.7 6.6 8.3
2010 0.9 0.4 1.3
2011 3.2 -2.8 0.4
2012 -6.6 -1.6 -8.1
2013 4.1 -0.1 4.0
2014 2.5 -1.0 1.5
POSITIVE STOCK SELECTION IN 8 OF 9 YEARS
14
As an investment-led, investor-focused firm, we bring: An experienced team
Comprehensive research
Insightful risk management
Disciplined portfolio construction
BENEFITS OF LORD ABBETT VALUE OPPORTUNITIES FUND
Analysis period includes Value Opportunities Fund from 01/01/2006 through 06/30/2015. Performance data quoted reflect past performance and are no guarantee of future results. Please see Performance and Attribution sections for Fund performance. Current performance may be higher or lower than the performance data quoted. The investment return and principal value of an investment in the Fund will fluctuate so that shares, on any given day or when redeemed, may be worth more or less than their original cost. You can obtain performance data current to the most recent month end by calling Lord Abbett at (888) 522-2388 or referring to our website at lordabbett.com.Indexes are unmanaged, do not reflect the deduction of fees or expenses, and are not available for direct investment.
Source: Zephyr Associates, Inc.
RISK–RETURN CHART AS OF 09/30/2015
Standard Deviation
Ret
urn
Lord Abbett Value Opportunities Fund (A Share)
Russell 2500 Value Index
Russell 2500 Index
PERFORMANCE AND ATTRIBUTION
16
AVERAGE ANNUAL RATES OF RETURN
Performance data quoted reflect past performance and are no guarantee of future results. Current performance may be higher or lower than the performance data quoted. The investment return and principal value of an investment in the Fund will fluctuate so that shares, on any given day or when redeemed, may be worth more or less than their original cost. You can obtain performance data current to the most recent month end by calling Lord Abbett at (888) 522-2388 or referring to our website at lordabbett.com.
*Average Annual Total Returns are based on changes in net asset value and assume reinvestment of all distributions and do not reflect deduction of any front-end sales charges which are not applicable for Class I Shares, if these charges were included returns would be lower. Class I Shares are not subject to sales charges and are available only to institutional investors and certain others, including retirement plans. Instances of high double-digit returns were achieved primarily during favorable market conditions and may not be sustainable over time. Indexes are unmanaged, do not reflect the deduction of fees or expenses, and are not available for direct investment. Returns for periods of less than one year are not annualized. **Source: Russell. ***Source: Lipper Analytical Services. Lipper Funds Averages are based on a universe of funds with similar investment objectives as the Fund. Please see "Important Performance and Other Information."
AS OF 09/30/2015
Expense Ratio: 0.92%
17
CALENDAR YEAR RETURNS
L d Abb tt F d t l E it F d Cl A Sh L d Abb S ll C V l F d Cl A Sh L d Abb V l O i i F d Cl I Sh
Performance data quoted reflect past performance and are no guarantee of future results. Current performance may be higher or lower than the performance data quoted. The investment return and principal value of an investment in the Fund will fluctuate so that shares, on any given day or when redeemed, may be worth more or less than their original cost. You can obtain performance data current to the most recent month end by calling Lord Abbett at (888) 522-2388 or referring to our website at lordabbett.com.
*Average Annual Total Returns are based on changes in net asset value and assume reinvestment of all distributions and do not reflect deduction of any front-end sales charges which are not applicable for Class I Shares, if these charges were included returns would be lower. Class I Shares are not subject to sales charges and are available only to institutional investors and certain others, including retirement plans. Instances of high double-digit returns were achieved primarily during favorable market conditions and may not be sustainable over time. Indexes are unmanaged, do not reflect the deduction of fees or expenses, and are not available for direct investment. **Source: Russell.Please see "Important Performance and Other Information."
Value Opportunities Fund (Class I Shares)* Russell 2500™ Index** Russell 2500™ Value Index**
2014 9.45% 7.07% 7.11%
2013 36.53% 36.80% 33.32%
2012 10.13% 17.88% 19.21%
2011 -3.83% -2.51% -3.36%
2010 24.91% 26.71% 24.82%
2009 34.27% 34.39% 27.68%
2008 -27.49% -36.79% -31.99%
2007 11.28% 1.38% -7.27%
2006 29.41% 16.16% 20.18%
18
MUTUAL FUND PEER GROUP COMPARISON
Performance data quoted reflect past performance and are no guarantee of future results. Current performance may be higher or lower than the performance data quoted. The investment return and principal value of an investment in the Fund will fluctuate so that shares, on any given day or when redeemed, may be worth more or less than their original cost. You can obtain performance data current to the most recent month end by calling Lord Abbett at (888) 522-2388 or referring to our website at lordabbett.com.
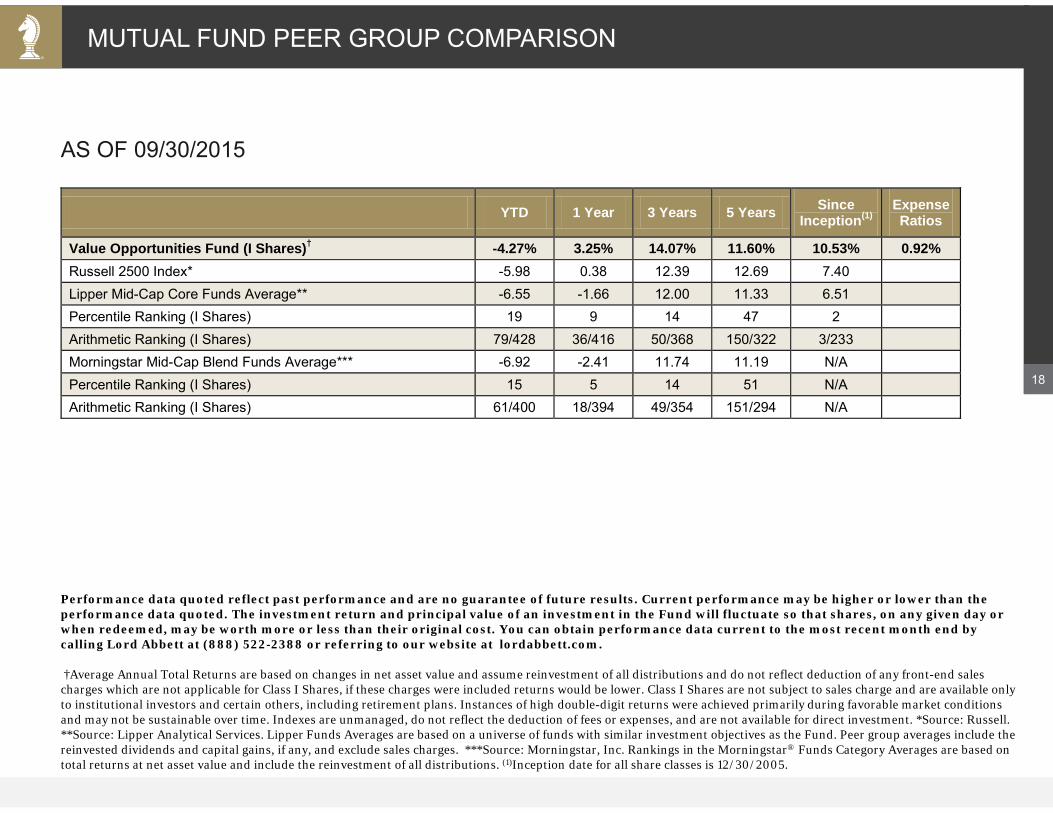
†Average Annual Total Returns are based on changes in net asset value and assume reinvestment of all distributions and do not reflect deduction of any front-end sales charges which are not applicable for Class I Shares, if these charges were included returns would be lower. Class I Shares are not subject to sales charge and are available only to institutional investors and certain others, including retirement plans. Instances of high double-digit returns were achieved primarily during favorable market conditions and may not be sustainable over time. Indexes are unmanaged, do not reflect the deduction of fees or expenses, and are not available for direct investment. *Source: Russell. **Source: Lipper Analytical Services. Lipper Funds Averages are based on a universe of funds with similar investment objectives as the Fund. Peer group averages include the reinvested dividends and capital gains, if any, and exclude sales charges. ***Source: Morningstar, Inc. Rankings in the Morningstar® Funds Category Averages are based on total returns at net asset value and include the reinvestment of all distributions. (1)Inception date for all share classes is 12/30/2005.
AS OF 09/30/2015
YTD 1 Year 3 Years 5 Years Since Inception(1)
Expense Ratios
Value Opportunities Fund (I Shares)† -4.27% 3.25% 14.07% 11.60% 10.53% 0.92% Russell 2500 Index* -5.98 0.38 12.39 12.69 7.40 Lipper Mid-Cap Core Funds Average** -6.55 -1.66 12.00 11.33 6.51 Percentile Ranking (I Shares) 19 9 14 47 2 Arithmetic Ranking (I Shares) 79/428 36/416 50/368 150/322 3/233 Morningstar Mid-Cap Blend Funds Average*** -6.92 -2.41 11.74 11.19 N/A Percentile Ranking (I Shares) 15 5 14 51 N/A Arithmetic Ranking (I Shares) 61/400 18/394 49/354 151/294 N/A
19
ATTRIBUTION ANALYSIS: 3Q 2015
Source: Wilshire AtlasSM ("Wilshire"). Performance data shown above is historical. Past performance is not indicative of future results. Current performance may be higher or lower than the performance data shown. Indexes are unmanaged, do not reflect the deduction of fees or expenses, and are not available for direct investment. Please see Appendix for information "About Wilshire" and the calculation of performance attribution information and for "Important Performance and Other Information." *GICS Sectors. Sectors may include many industries. The Fund's portfolio is actively managed and portfolio characteristics, such as individual holdings and sector weightings, may change significantly over time.
AS OF 09/30/2015
Value Opportunities Fund Russell 2500™ Index Variance
Sectors* Average Weight %
Base Return %
Average Weight %
Base Return %
Stock Selection %
Group Weight % Total %
Health Care 9.9 -9.1 13.2 -15.6 0.7 0.1 0.8
Utilities 6.5 11.0 4.3 4.2 0.4 0.3 0.7
Information Technology 16.9 -7.2 14.9 -10.5 0.5 0.0 0.5
“% contribution” reflects the effect of the individual stock's performance on the Fund's overall performance. Individual holdings and their effect on Fund performance may change significantly over time. Investors should consider the overall performance of the Fund before making a decision on whether or not to invest in the Fund. GICS Sectors.
AS OF 09/30/2015
Largest Contributors Ticker % Contribution
American Water Works Co., Inc. Utilities AWK 0.23
CMS Energy Corp. Utilities CMS 0.18
Portland General Electric Co. Utilities POR 0.18
Vantiv, Inc. Information Technology VNTV 0.17
Arch Capital Group Ltd. Financials ACGL 0.15
Largest Detractors Ticker % Contribution
Marvell Technology Group Ltd. Information Technology MRVL -0.48
HealthSouth Corp. Health Care HLS -0.40
Ascena Retail Group, Inc. Consumer Discretionary ASNA -0.39
Lam Research Corp. Information Technology LRCX -0.38
WestRock Co. Materials WRK -0.31
21
ATTRIBUTION ANALYSIS: SIX MONTHS
Source: Wilshire AtlasSM ("Wilshire"). Please see Appendix for information "About Wilshire" and the calculation of performance attribution information, including information about Not Classified securities. The statistical information provided above is supplemental to the Smid Cap Value Equity Institutional Composite presentation, which is included in the Appendix, and is subject to change. Past performance is not a reliable indicator or guarantee of future results. *GICS Sectors. Sectors may include many industries.
AS OF 09/30/2015 Value Opportunities Fund Russell 2500™ Index Variance
Sectors* Average Weight %
Base Return %
Average Weight %
Base Return %
Stock Selection %
Group Weight % Total %
Financials 26.8 1.5 24.3 -5.0 1.6 0.1 1.7
Health Care 9.7 -3.7 13.3 -11.4 0.8 -0.1 0.7
Utilities 6.1 -0.3 4.3 -3.0 0.2 0.2 0.4
Consumer Staples 2.5 4.6 2.9 -9.6 0.3 0.0 0.3
Information Technology 17.2 -7.6 15.3 -9.1 0.2 0.0 0.2
Holdings are based on the representative portfolio. “% contribution” reflects the effect of the individual stock's performance on the Portfolio's overall performance. The holdings identified above do not represent all of the securities purchased, sold, or recommended for advisory clients. Past performance is not a reliable indicator or guarantee of future results. The calculation methodology for determining the holdings that contributed most positively and negatively to the representative account's performance for the period as well as a list of the contribution of each holding in the account to the account's performance are available upon request. The statistical information provided above is supplemental to the Smid Cap Value Equity Institutional Composite presentation, which is included in the Appendix, and is subject to change. Sector information for each holding is based on GICS classifications.
AS OF 09/30/2015
Largest Contributors Ticker % Contribution
HCC Insurance Holdings, Inc. Financials HCC 0.76
Amsurg Corp. Health Care AMSG 0.30
Arch Capital Group Ltd. Financials ACGL 0.26
Vantiv, Inc. Information Technology VNTV 0.19
Community Health Systems, Inc. Health Care CYH 0.14
Largest Detractors Ticker % Contribution
Marvell Technology Group Ltd. Information Technology MRVL -0.66
Genesee & Wyoming, Inc. Industrials GWR -0.47
HealthSouth Corp. Health Care HLS -0.39
Rovi Corp. Information Technology ROVI -0.39
Ryder System, Inc. Industrials R -0.38
23
ATTRIBUTION ANALYSIS: YEAR TO DATE
Source: Wilshire AtlasSM ("Wilshire"). Performance data shown above is historical. Past performance is not indicative of future results. Current performance may be higher or lower than the performance data shown. Indexes are unmanaged, do not reflect the deduction of fees or expenses, and are not available for direct investment. Please see Appendix for information "About Wilshire" and the calculation of performance attribution information and for "Important Performance and Other Information." *GICS Sectors. Sectors may include many industries. The Fund's portfolio is actively managed and portfolio characteristics, such as individual holdings and sector weightings, may change significantly over time.
AS OF 09/30/2015
Value Opportunities Fund Russell 2500™ Index Variance
Sectors* Average Weight %
Base Return %
Average Weight %
Base Return %
Stock Selection %
Group Weight % Total %
Financials 26.5 5.8 24.2 -1.8 1.9 0.1 2.0
Utilities 6.0 -1.4 4.4 -5.9 0.3 0.1 0.4
Information Technology 17.5 -1.5 15.3 -3.7 0.3 0.0 0.4
“% contribution” reflects the effect of the individual stock's performance on the Fund's overall performance. Individual holdings and their effect on Fund performance may change significantly over time. Investors should consider the overall performance of the Fund before making a decision on whether or not to invest in the Fund. GICS Sectors.
AS OF 09/30/2015
Largest Contributors Ticker % Contribution
HCC Insurance Holdings, Inc. Financials HCC 0.93
Amsurg Corp. Health Care AMSG 0.42
Pinnacle Foods Group LLC Consumer Staples PF 0.38
Akamai Technologies, Inc. Information Technology AKAM 0.38
Vantiv, Inc. Information Technology VNTV 0.34
Largest Detractors Ticker % Contribution
Marvell Technology Group Ltd. Information Technology MRVL -0.64
Rovi Corp. Information Technology ROVI -0.63
Allegheny Technologies, Inc. Materials ATI -0.42
Genesee & Wyoming, Inc. Industrials GWR -0.41
HealthSouth Corp. Health Care HLS -0.41
25
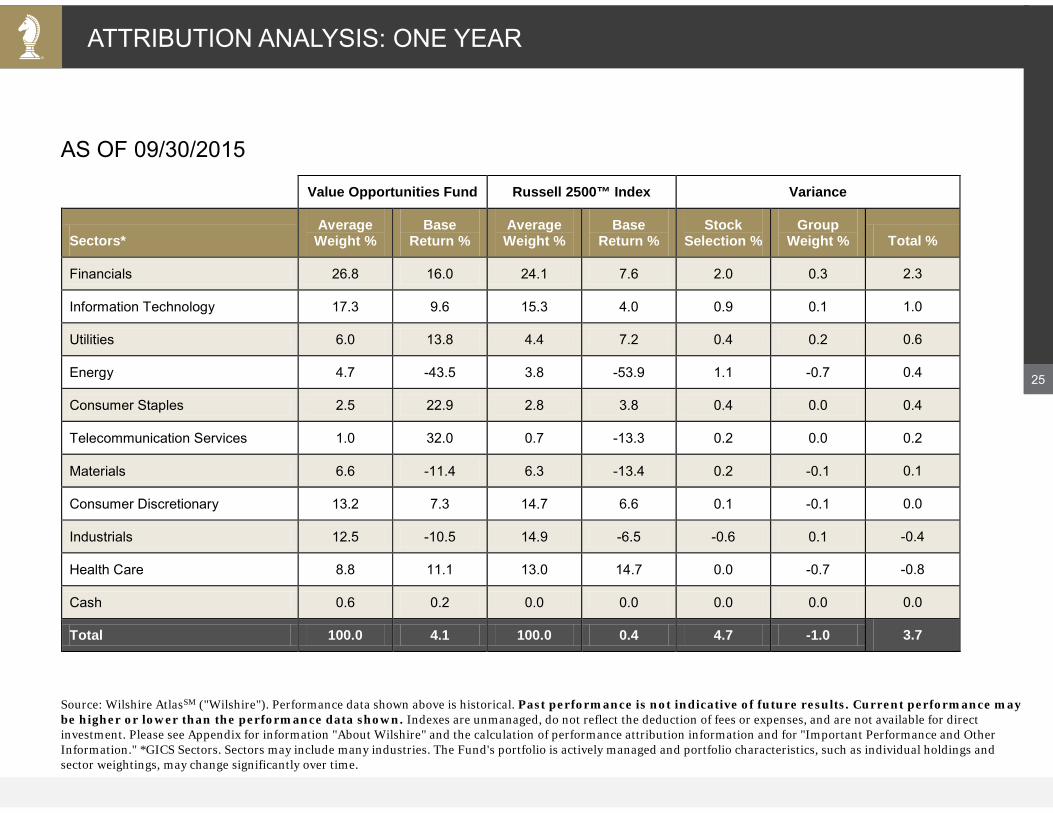
ATTRIBUTION ANALYSIS: ONE YEAR
Source: Wilshire AtlasSM ("Wilshire"). Performance data shown above is historical. Past performance is not indicative of future results. Current performance may be higher or lower than the performance data shown. Indexes are unmanaged, do not reflect the deduction of fees or expenses, and are not available for direct investment. Please see Appendix for information "About Wilshire" and the calculation of performance attribution information and for "Important Performance and Other Information." *GICS Sectors. Sectors may include many industries. The Fund's portfolio is actively managed and portfolio characteristics, such as individual holdings and sector weightings, may change significantly over time.
AS OF 09/30/2015
Value Opportunities Fund Russell 2500™ Index Variance
Sectors* Average Weight %
Base Return %
Average Weight %
Base Return %
Stock Selection %
Group Weight % Total %
Financials 26.8 16.0 24.1 7.6 2.0 0.3 2.3
Information Technology 17.3 9.6 15.3 4.0 0.9 0.1 1.0
“% contribution” reflects the effect of the individual stock's performance on the Fund's overall performance. Individual holdings and their effect on Fund performance may change significantly over time. Investors should consider the overall performance of the Fund before making a decision on whether or not to invest in the Fund. GICS Sectors.
AS OF 09/30/2015
Largest Contributors Ticker % Contribution
HCC Insurance Holdings, Inc. Financials HCC 1.22
Sapient Corp. Information Technology SAPE 0.64
Pinnacle Foods Group LLC Consumer Staples PF 0.56
Akamai Technologies, Inc. Information Technology AKAM 0.54
Vantiv, Inc. Information Technology VNTV 0.50
Largest Detractors Ticker % Contribution
Rovi Corp. Information Technology ROVI -0.55
Marvell Technology Group Ltd. Information Technology MRVL -0.53
Allegheny Technologies, Inc. Materials ATI -0.53
Genesee & Wyoming, Inc. Industrials GWR -0.51
Rice Energy, Inc. Energy RICE -0.49
APPENDIX
28
Name RoleYears of Industry
Experience
Years with Lord Abbett
Prior Professional Experience Education
Robert I. Gerber, Ph.D.* Chief Investment Officer 28 18
Sanford C. Bernstein & Co., Inc.; First Boston
Corporation; State University of New York at Albany
BA, Union College; MA, Ph.D., Columbia
University
Justin C. Maurer* Portfolio Manager 24 14Merrill Lynch; McDonald
Investments; Key Corporation
BA, Baldwin-Wallace College;
MBA, Case Western Reserve University
Thomas B. Maher* Portfolio Manager 26 12Invesco; Centurion
Investment Group; Lynch & Mayer, Inc.
BS, Georgetown University;
MBA, New York University
Dennis K. Morgan, CFA Research Analyst 20 7Neuberger Berman; Bear Stearns; Dreman Value
Advisors
BS, The College of New Jersey
John C. Hardy Research Analyst 12 3 Gleacher & Co.; American Technology Research, Inc. BS, Cornell University
Jason B. Loeb, CFA Research Analyst 23 18BlackRock Financial
Management; HibbardBrown & Company
BA, Richard StocktonCollege of New Jersey
KEY TEAM MEMBER BIOGRAPHIES
As of 10/01/2015. *Partner of Lord Abbett. Years of industry experience is updated as of 01/01/2015.
29
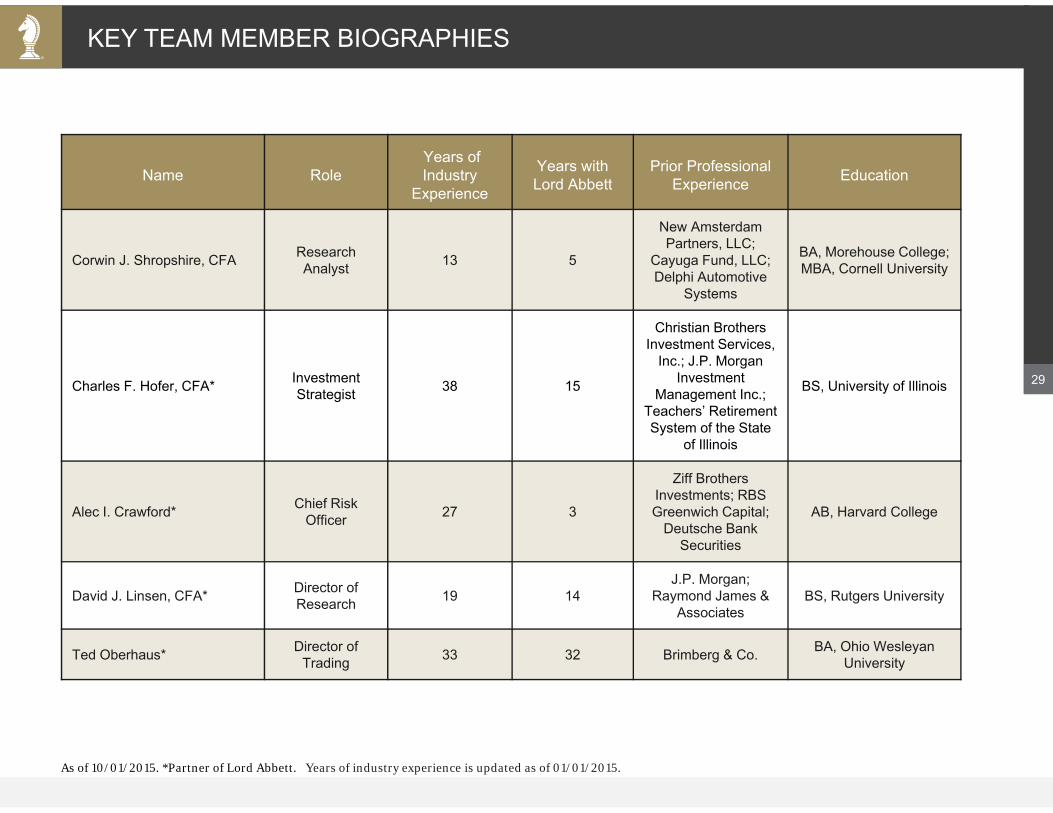
Name RoleYears of Industry
Experience
Years with Lord Abbett
Prior Professional Experience Education
Corwin J. Shropshire, CFA ResearchAnalyst 13 5
New Amsterdam Partners, LLC;
Cayuga Fund, LLC; Delphi Automotive
Systems
BA, Morehouse College; MBA, Cornell University
Charles F. Hofer, CFA* Investment Strategist 38 15
Christian Brothers Investment Services,
Inc.; J.P. Morgan Investment
Management Inc.; Teachers’ Retirement System of the State
of Illinois
BS, University of Illinois
Alec I. Crawford* Chief Risk Officer 27 3
Ziff Brothers Investments; RBS Greenwich Capital;
Deutsche Bank Securities
AB, Harvard College
David J. Linsen, CFA* Director of Research 19 14
J.P. Morgan; Raymond James &
AssociatesBS, Rutgers University
Ted Oberhaus* Director of Trading 33 32 Brimberg & Co. BA, Ohio Wesleyan
University
KEY TEAM MEMBER BIOGRAPHIES
As of 10/01/2015. *Partner of Lord Abbett. Years of industry experience is updated as of 01/01/2015.
3030
David J. Linsen, CFA Partner & Director of Research, 19 Years
David J. Linsen, CFA Partner & Director of Research, 19 Years
GLOBAL EQUITY RESEARCH TEAM
John M. McMillin III, CFA, PartnerU.S.
Consumer Staples35 Years
Yarek Aranowicz, CFA, PartnerInternational
Health Care, Industrials, Media23 Years
Lavina Talukdar, CFA, PartnerU.S.
Health Care20 Years
Yoginder Kak, CFAU.S.
Energy25 Years
Glenn P. McIsaacU.S.
Utilities33 Years
Anthony Attardo, CFAU.S.
Consumer Discretionary22 Years
Rick Vallieres, CFAU.S.
Information Technology21 Years
Subrata Ghose, CFAU.S.
Information Technology20 Years
Devesh KarandikarU.S.
Health Care20 Years
So Young LeeU.S.
Consumer Discretionary, Technology18 Years
Randy M. Reynolds, CFAU.S.
Telecommunications18 Years
Gregory M. Wachsman, CFAU.S.
Financials18 Years
Naimish ShahInternational
Autos, Info Technology, Retail17 Years
Helen Gim WoronoffU.S.
Consumer Discretionary16 Years
Todor PetrovInternational
Materials, Telecom16 Years
Eric A. GhernatiU.S.
Technology15 Years
Jamie Sullivan, CFAU.S.
Industrials15 Years
Christopher WigginsU.S.
Industrials15 Years
Jeff ArricaleU.S.
Financials14 Years
Heidi A. LawrenceU.S.
Health Care14 Years
Steven R. BenyikU.S.
Financials13 Years
Janet C. King, CFAInternational
Consumer Staples13 Years
Sue KimInternational
Consumer Discretionary11 years
Thomas Daniels, CFAU.S.
Oil Services, Energy Services10 years
Tulu Yunus, CPAU.S.
Business Services9 Years
Betsy M. GeorgeInternationalIndustrials
8 Years
R. Rama BondadaU.S.
Industrials7 Years
As of 10/01/2015. Years of industry experience as of 01/01/2015.
Team of 28 investment professionals with 17 years average industry experience
31
HISTORICAL MARKET CAP DISTRIBUTION
Source: Morningstar. Percentage of the Lord Abbett Value Opportunities Fund in Large Cap, Mid Cap, Small Cap Market Segments as defined by Morningstar.
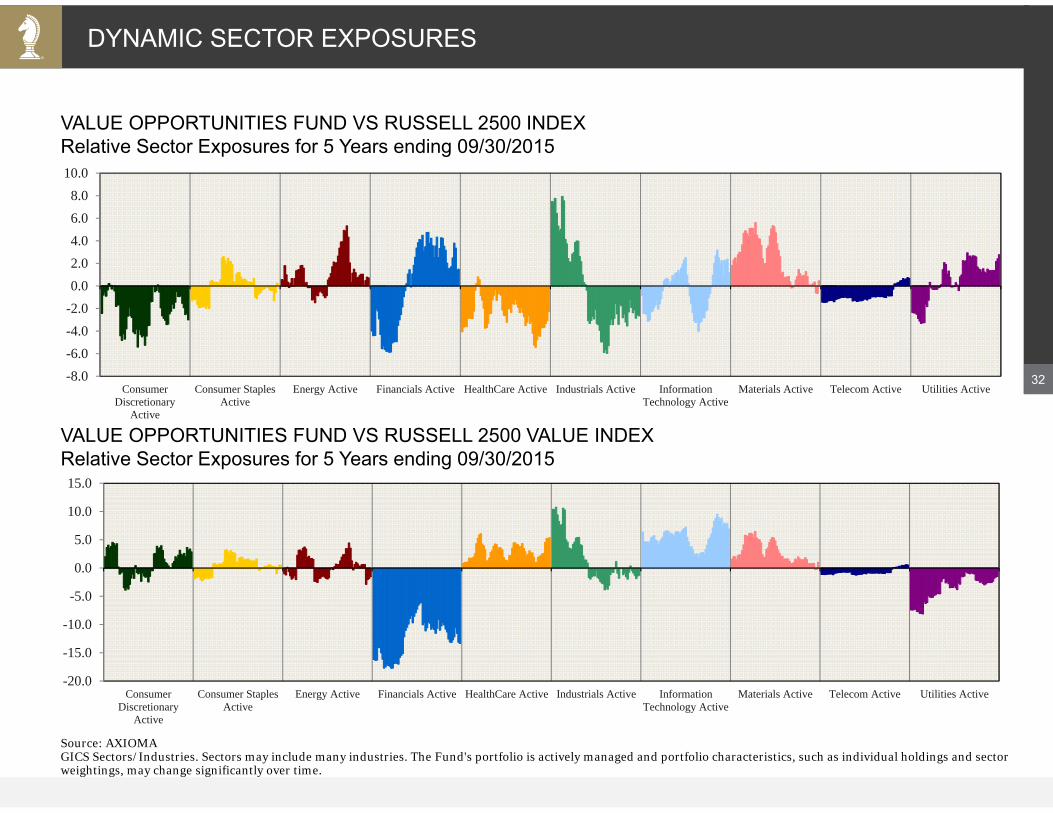
Source: AXIOMAGICS Sectors/Industries. Sectors may include many industries. The Fund's portfolio is actively managed and portfolio characteristics, such as individual holdings and sector weightings, may change significantly over time.
DYNAMIC SECTOR EXPOSURES
VALUE OPPORTUNITIES FUND VS RUSSELL 2500 VALUE INDEXRelative Sector Exposures for 5 Years ending 09/30/2015
VALUE OPPORTUNITIES FUND VS RUSSELL 2500 INDEXRelative Sector Exposures for 5 Years ending 09/30/2015
-8.0-6.0-4.0-2.00.02.04.06.08.0
10.0
ConsumerDiscretionary
Active
Consumer StaplesActive
Energy Active Financials Active HealthCare Active Industrials Active InformationTechnology Active
Materials Active Telecom Active Utilities Active
-20.0
-15.0
-10.0
-5.0
0.0
5.0
10.0
15.0
ConsumerDiscretionary
Active
Consumer StaplesActive
Energy Active Financials Active HealthCare Active Industrials Active InformationTechnology Active
Materials Active Telecom Active Utilities Active
33
GLOSSARY OF PORTFOLIO CHARACTERISTICS
5 Year EPS Growth (IBES Median) The consensus outlook for a portfolio's EPS growth. I/B/E/S provides medians of research analysts' estimates for companies' long-term (typically five years) growth rates.
Price/Earnings Ratio (1 Year Forecast) A ratio that reflects how much a stock costs relative to its earnings. It is calculated by dividing the current stock price by the estimated future earnings per share.
Return on Equity (5 Year Average) A measurement of how much profit a company earned relative to the amount of shareholder's equity that is found on a company's balance sheet. It is calculated by taking the arithmetic average of the five most recent fiscal year-end ROE ratios.
Price/Cash Flow Ratio A ratio that reflects how much a stock costs relative to its cash flow. It is calculate by dividing the current stock price by the cash flow per share.
Standard Deviation A measure of the historical volatility of a mutual fund or portfolio. A higher standard deviation number indicates a wider range of returns and a higher degree of portfolio risk. The performance data quoted reflect past performance and are no guarantee of future results.
34
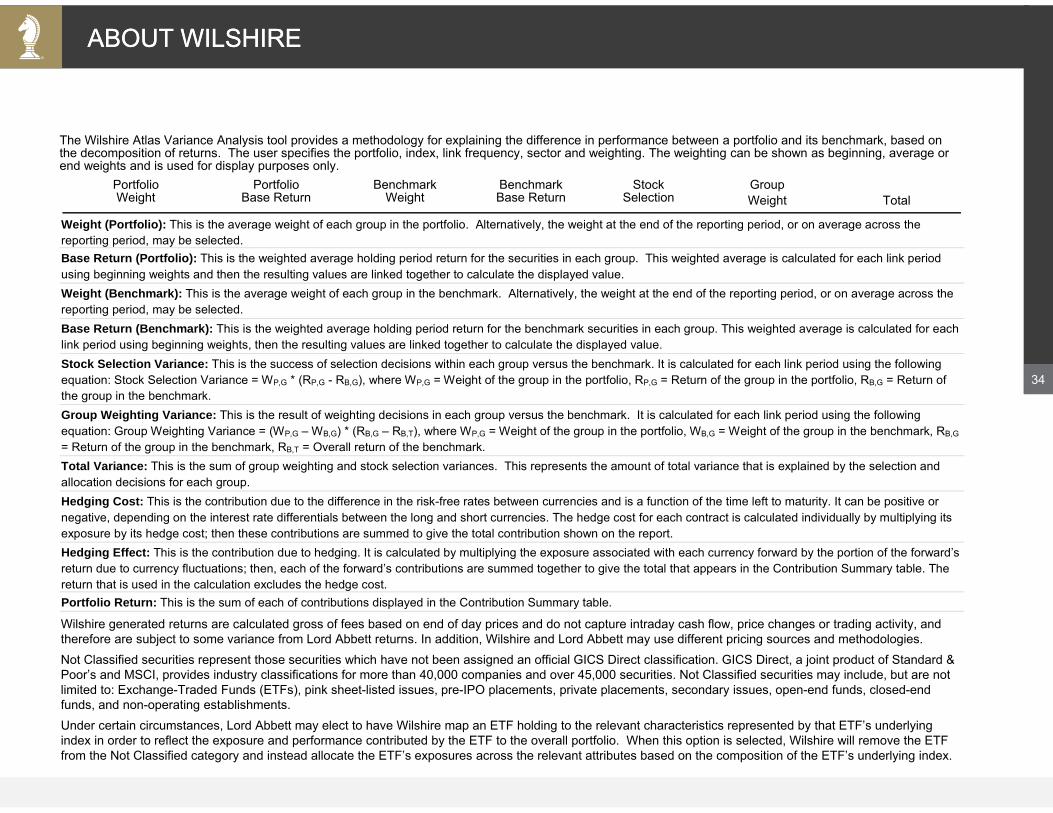
ABOUT WILSHIRE
The Wilshire Atlas Variance Analysis tool provides a methodology for explaining the difference in performance between a portfolio and its benchmark, based on the decomposition of returns. The user specifies the portfolio, index, link frequency, sector and weighting. The weighting can be shown as beginning, average or end weights and is used for display purposes only.
ABOUT WILSHIRE
Weight (Portfolio): This is the average weight of each group in the portfolio. Alternatively, the weight at the end of the reporting period, or on average across the reporting period, may be selected. Base Return (Portfolio): This is the weighted average holding period return for the securities in each group. This weighted average is calculated for each link period using beginning weights and then the resulting values are linked together to calculate the displayed value. Weight (Benchmark): This is the average weight of each group in the benchmark. Alternatively, the weight at the end of the reporting period, or on average across the reporting period, may be selected. Base Return (Benchmark): This is the weighted average holding period return for the benchmark securities in each group. This weighted average is calculated for each link period using beginning weights, then the resulting values are linked together to calculate the displayed value. Stock Selection Variance: This is the success of selection decisions within each group versus the benchmark. It is calculated for each link period using the following equation: Stock Selection Variance = WP,G * (RP,G - RB,G), where WP,G = Weight of the group in the portfolio, RP,G = Return of the group in the portfolio, RB,G = Return of the group in the benchmark. Group Weighting Variance: This is the result of weighting decisions in each group versus the benchmark. It is calculated for each link period using the following equation: Group Weighting Variance = (WP,G – WB,G) * (RB,G – RB,T), where WP,G = Weight of the group in the portfolio, WB,G = Weight of the group in the benchmark, RB,G = Return of the group in the benchmark, RB,T = Overall return of the benchmark. Total Variance: This is the sum of group weighting and stock selection variances. This represents the amount of total variance that is explained by the selection and allocation decisions for each group. Hedging Cost: This is the contribution due to the difference in the risk-free rates between currencies and is a function of the time left to maturity. It can be positive or negative, depending on the interest rate differentials between the long and short currencies. The hedge cost for each contract is calculated individually by multiplying its exposure by its hedge cost; then these contributions are summed to give the total contribution shown on the report. Hedging Effect: This is the contribution due to hedging. It is calculated by multiplying the exposure associated with each currency forward by the portion of the forward’s return due to currency fluctuations; then, each of the forward’s contributions are summed together to give the total that appears in the Contribution Summary table. The return that is used in the calculation excludes the hedge cost. Portfolio Return: This is the sum of each of contributions displayed in the Contribution Summary table. Wilshire generated returns are calculated gross of fees based on end of day prices and do not capture intraday cash flow, price changes or trading activity, and therefore are subject to some variance from Lord Abbett returns. In addition, Wilshire and Lord Abbett may use different pricing sources and methodologies.Not Classified securities represent those securities which have not been assigned an official GICS Direct classification. GICS Direct, a joint product of Standard & Poor’s and MSCI, provides industry classifications for more than 40,000 companies and over 45,000 securities. Not Classified securities may include, but are not limited to: Exchange-Traded Funds (ETFs), pink sheet-listed issues, pre-IPO placements, private placements, secondary issues, open-end funds, closed-end funds, and non-operating establishments. Under certain circumstances, Lord Abbett may elect to have Wilshire map an ETF holding to the relevant characteristics represented by that ETF’s underlying index in order to reflect the exposure and performance contributed by the ETF to the overall portfolio. When this option is selected, Wilshire will remove the ETF from the Not Classified category and instead allocate the ETF’s exposures across the relevant attributes based on the composition of the ETF’s underlying index.
Performance data quoted is historical. Past performance is no guarantee of future results. Current performance may behigher or lower than the performance data quoted. The investment return and principal value of an investment in any fund willfluctuate as the prices of the individual securities in which they invest fluctuate, so that shares, when redeemed, may be worth moreor less than their original cost. Different investments carry different risk.
Index Information: Indexes are unmanaged, do not reflect the deduction of fees or expenses, and an investor cannot invest directlyin an index.
A Note about Risk: Investments in equity securities will fluctuate in response to general economic conditions and to changes in theprospects of particular companies and/or sectors in the economy. Investing in small and mid-sized companies generally involvesgreater risks than investing in the stocks of large companies. These factors can affect Fund performance.
The Russell 2500™ Index is a market cap weighted index that includes the smallest 2,500 companies covered in the Russell 3000 universe of United States-based listed equities. The Russell 2500™ Value Index measures the performance of those Russell 2500 companies with lower price-to-book ratios and lower forecasted growth values.
36
IMPORTANT PERFORMANCE AND OTHER INFORMATION
Investors should carefully consider the investment objectives, risks, charges, andexpenses of the Lord Abbett Funds. This and other important information iscontained in the fund’s summary prospectus and/or prospectus. To obtain aprospectus or summary prospectus on any Lord Abbett mutual fund, contact yourinvestment professional, Lord Abbett Distributor LLC at (888) 522-2388 or visit us atlordabbett.com. Read the prospectus carefully before you invest.
Mutual funds are not insured by the FDIC, are not deposits or other obligations of, orguaranteed by banks, and are subject to investment risks including possible loss ofprincipal amount invested. Lord Abbett Distributor LLC is the principal underwriterof the Lord Abbett Mutual Funds.