Page 1
VALUE STREAM MAPPING FOR SOFTWARE DEVELOPMENT PROCESS
by
Ganesh S Thummala
A Research Paper
Submitted in Partial Fulfillment of the
Requirements for the
Master of Science Degree
In
Management Technology
Approved: 3 Semester Credits
__________________________ Dr. Fazi Amirahmadi
Research Advisor
The Graduate School
University of Wisconsin-Stout
April, 2004
Page 2
ii
The Graduate School
University of Wisconsin Stout
Menomonie, WI 54751
ABSTRACT
Thummala Ganesh S
_____________________________________________________________________ (Writer) (Last name) (First) (Middle initial)
Value Stream Mapping For Software Development Process
_____________________________________________________________________ (Title)
M.S in Management Technology
______________________________________________________________________ (Graduation Major)
Dr. Fazi Amirahmadi April 2004 25 ______________________________________________________________________ (Research Advisor) (Month / Year) (No. of Pages)
American Psychological Association, 5th edition
______________________________________________________________________
Every manufacturing company has implemented an enterprise resource planning software
to store the data for analysis purposes and for accounting needs. However this accounting
related software needs to be customized or personalized in order to meet the every day
technological changes and end user needs. In order to customize or personalize the
software the user submits a software requirements specification request to the
information technology department. The processing time of this request usually varies
Page 3
iii
depends on the complexity of the request. Many factors contribute to the completion and
deployment of the request in the production system. These factors have direct impact on
the lead time of the request which can significantly raise the costs for the deployment
request. This study looks at developing a value stream map for the software development
process for a medium sized manufacturing company and identifying the bottlenecks
which impact the increase in lead time of the request, eliminating the non value added
activities and developing a future state value stream map for the software development
process. This scenario led to 16 % improvement in overall lead time of the deployment of
the request which in turn has resulted in cost savings for the company.
Page 4
iv
ACKNOWLEDGMENTS
I would like to thank my research advisor Dr. Fazi Amirahmadi for his valuable
guidance, encouragement and support throughout this research work.
I would also like to thank everyone who had supported me directly and indirectly
in completing this research work.
Page 5
v
TABLE OF CONTENTS
.......................................................................................................................................Page
ABSTRACT........................................................................................................................ ii
LIST OF FIGURES ........................................................................................................... vi
CHAPTER I: INTRODUCTION....................................................................................... 1
Statement of the Problem ................................................................................................ 2
Purpose of the Study ....................................................................................................... 2
Assumptions of the Study ................................................................................................ 2
Definition of Terms ......................................................................................................... 3
Limitations of the Study .................................................................................................. 4
Methodology ................................................................................................................... 4
CHAPTER II: LITERATURE REVIEW ........................................................................... 5
CHAPTER III: METHODOLOGY .................................................................................. 10
Subject Selection and Description ................................................................................ 11
Data Collection Procedures ......................................................................................... 11
Data Analysis ................................................................................................................ 12
Limitations .................................................................................................................... 12
CHAPTER IV: RESULTS............................................................................................... 13
Item Analysis ................................................................................................................. 13
Current State Value Stream Map Analysis ................................................................... 13
Future State Value Stream Map Analysis ..................................................................... 17
CHAPTER V: DISCUSSION........................................................................................... 21
Limitations .................................................................................................................... 21
Conclusions................................................................................................................... 22
Recommendations ......................................................................................................... 23
References......................................................................................................................... 25
Page 6
vi
LIST OF FIGURES
Current State Value Stream Map ...................................................................................... 16
Future State Value Stream Map........................................................................................ 18
Page 7
1
CHAPTER I: INTRODUCTION
Every service offered by information technology department in a manufacturing
company involves significant costs. The top management obviously insists on offering
more service by incurring less cost. Hence the information technology departments are
forced to offer high quality services with less cost. Most of the Information Technology
departments in the companies are putting huge efforts in order to reduce the costs of the
services they offer. This research work concentrates on how to reduce the lead time in
deploying a project for software development division of the Information Technology
department of an XYZ manufacturing company. Reducing the lead time will further
reduce the costs of the services offered by Information Technology department.
This study utilizes value stream mapping for the software development process as
a step in order to reduce the lead time, costs and rework. This starts with identifying the
software development process flow, how long each step is going to take to complete,
what is the waiting time involved between each step and drawing a current state value
stream map. Then the bottlenecks in the entire process are identified, suggestions are
developed in order to reduce the cycle times, waiting times and a detailed future state
value stream map is developed. This study not only concentrates on minimizing the cycle
times and waiting times but also on increasing the communication flow of information
which makes the project more visible.
Value stream mapping is the first step towards lean thinking. To start with most of
companies focus on lean thinking towards their manufacturing operations. This research
work focuses on developing value stream map for software development and finally
realizing the benefits of it. Services functions represent significant costs of doing
Page 8
2
business. Eliminating costly waste from services functions is a great way to increase
profit margin and a vital part of creating a total lean enterprise.
Statement of the Problem
The objective of this research work is to reduce the total lead time of the software
development process and thereby reduce the costs involved in deploying a software
project. The perceived need in this area was due to growing concern among the end users
about the increasing lead times and reducing the rework of the software product. The
results of this research study will have direct effect on improving the quality of the
software product, improvising the information flow and reducing the communication gap
when deploying a software product.
Purpose of the Study
The research involved in the study is going to help the software development
division of an Information Technology department in the following ways
1. Reduced total lead time and rework in deploying the software product to the end
user.
2. Investigate the problems and make the improvements so as to deploy the quality
software product.
Assumptions of the Study
1. The management was committed to bring the change with the new software
development process flow.
2. All the people involved are willing and ready to accept the change.
3. Preexisting information collected is reliable and accurate.
4. Enough resources are available to complete the task in the process flow.
Page 9
3
Definition of Terms
Value stream - The flow of activities and work units that produce value for a
customer is a value stream. When you apply lean management principles to a
value stream, then it is called value stream management. (Tapping & Shuker,
2003)
Takt time – Takt time is the rate at which a company must produce a product to
satisfy customer demand. (Tapping, Luyster & Shuker, 2002)
Total cycle time – The total of all cycle times for each individual operation or cell
in a value stream. Total product cycle time ideally equals total value-added time.
(Tapping, Luyster & Shuker, 2002)
Cycle time – The time that elapses from the beginning of a process or operation
until its operation. (Tapping, Luyster & Shuker, 2002)
Queue time – The time that a work unit will wait for a downstream process to be
ready to work on it. (Tapping & Shuker, 2003)
Total cycle time – The sum of all cycle times for the individual processes in a
value stream. This is also referred to as value added time. (Tapping & Shuker,
2003)
Customer demand – The quantity of parts required by a customer. (Tapping,
Luyster & Shuker, 2002)
Supermarket – A system used to store a set level of finished goods or work in
process inventory and replenish what is pulled to fulfill customer orders. A
supermarket is used when circumstances make it difficult to sustain continuous
flow. (Tapping, Luyster & Shuker, 2002)
Page 10
4
Limitations of the Study
1. The research was limited to software development process of information
technology department in an XYZ manufacturing company.
2. It may be expensive to bring the new process changes.
3. If people are not ready to accept the change then the projected results are
unachievable.
4. The new changes may take long time to implement and it depends on how
much resources and costs are allocated
Methodology
This research work started with collection of information regarding the existing
process flow for the software development process, how many people were involved in
each step and identifying the cycle times and waiting times in each step. Based on the
information collected by interacting with various people from the software development,
end users and business analysts the current state value stream map is drawn showing the
process flow, product flow, information flow and the communication flow. The take time
is also calculated. Then based on the concepts in lean philosophy, the current state is
expanded to future state value stream map by eliminating the non value added activities,
elimination of waste, improving the communication and information flow and
implementing the pull system techniques. Finally the projected savings in terms of total
lead time are calculated and the advantages of pull system are demonstrated. The benefits
of new process changes in transforming into future state of value stream are projected and
the awareness, need for change management is created and communicated to all the end
users in the company.
Page 11
5
CHAPTER II: LITERATURE REVIEW
What is Value Stream Management?
Value stream management is a process for planning and linking lean initiatives
through systematic data capture and analysis. (Tapping, Luyster & Shuker, 2002) Value
stream management consists of eight steps (1) Commit to lean, (2) Chose the value
stream, (3) Learn about lean, (4) Map the current state, (5) Determine the lean metrics (6)
Map the future state, (7) Create Kaizen plans and (8) Implement Kaizen plans.
A value stream is all the actions of both value and non-value added required to
bring a product, or group of products that use many of the same resources in much the
same way, through the main flow essential to every product from raw materials to the
arms of the customer. (Rother & Shook, 1999). Value stream mapping is a pencil and
paper visualization tool that shows the flow of material and information as a product
makes its way through the stream. Value stream mapping is done in two steps. The first
step is to draw the current state value stream map to take snapshot of how things are
being done now, and the second step is to draw the future state map to show how things
ought to be done.
Value stream is a method of visually mapping the flow of materials and
information from the time products come back in the door as raw material, through all
manufacturing steps, and off the loading dock as finished products. (Williams, 2002) This
is the value stream. Mapping is a critical step in lean conversions. Mapping out the
activities in production or any process with cycle times, down times, in-process
inventory, material moves, information flow paths, will help visualize the current state of
the process activities and guides toward the future state.
Page 12
6
Value stream mapping can be a communication tool, can be a business planning
tool, and a tool to manage change process. The process includes physically mapping the
current state while also focusing on where we want to be, or the future state map, which
can serve as the foundation for other lean improvement strategies. Value stream
management can serve as a starting point to help management, engineers, production
associates, schedulers, suppliers, customers recognize waste and identify its causes. The
goal is to identify and eliminate the waste in the process. Waste being any activity that
does not add any value to the final product. Value stream management is a strategic tool
to figure out where to go with the flow of the entire process. This is also a tactical tool
that allows management to identify the bottlenecks and identify the problems in
individual value streams.
In an internal manufacturing context, there are three types of operations that are
undertaken. (Monden, 1993). They are (1.) non-value added activities which are pure
waste and involve unnecessary actions which should be eliminated completely, (2)
necessary but non-value added activities which may be wasteful but are necessary under
current operating procedures and (3) value added activities which add value to the
product.
The power of value stream lies in identifying the waste throughout the stream and
eliminating it in order to shorten the lead time and improve the value added percentage.
In other words, to transform the production system from a batch and push system into a
one piece flow and pull system. The only way to understand waste is to understand the
elements like overproduction, inventory, transportation, waiting, motion, over processing,
and correction (rework) that do not contribute value of the product.
Page 13
7
This visual technique of mapping is divided into two sections, flow of information
and flow of material and it describes how a business currently operates and could operate.
This vision provides the ability to eliminate the process that add no value, eliminate
redundant and unnecessary information flows, and combine or streamline those that do.
Value stream mapping provides both a picture of the current state of affairs as well as a
vision of how we would like to see things work. Identifying the differences in the current
and future state yields a roadmap for continuous improvement activities.
Value stream mapping is gaining as acceptance as a valuable tool for
manufacturers of all types. (Chaneski, 2001) This is because it is simple to use, yet it will
accurately depict the relationship between value added time represented as the sum total
of all cycle times processes in the value stream and process waste which is represented as
sum total of all inventory in the value stream.
Attributes of Value Stream Management
The value stream management process supports the transformation into a lean
enterprise by providing a structure to ensure that the lean implementation team functions
effectively. That structure, made visual through the storyboard format, encompasses the
strengths of proven problem solving methods: The main attributes for value stream
management are (a) it provides for clear and concise communications between
management and department teams about the lean expectations and about the actual
material and information flow. (b) Proven tools are used for implementation. (c) Team
recognition and ownership are included from beginning to end. (d) Management review
and reporting are incorporated. (e) It provides a good form of visual communication and
(f) Changes and updates can be reflected as they occur.
Page 14
8
Value Stream Management is a process that links together people, lean tools, metrics
and reporting requirements to achieve a lean enterprise. It is a mapping tool ensures that
lean is sustained, allows everyone to understand and continuously improve his or her
understanding of lean concepts, makes possible controlled process flow on the floor,
generates an actual lean design and implementation plan and it requires a lean
coordinator to make the process go smoothly.
Value Stream Management does not involve just forming kaizen teams and waiting
for results, just mapping the value stream to show material and information flow, just
forming self-directed work teams and waiting for results, appointing improvement
coordinators or “lean coordinators” and making them responsible for improvements.
Most important, value stream management is not a method for telling people how to
do their jobs more effectively. It is systematic approach that empowers people to plan
how and when they will implement the improvements that make it easier to meet
customer demand. Value Stream Management is not about making people work faster or
harder; it is about putting in place a system so that material flows through manufacturing
processes at the pace of customer demand.
Key lean principles
As we implement the Value Stream Management, it should be always kept in
mind about the lean management principles. They are (a) define value from your
customer’s perspective, (b) identify the value stream, (c) eliminate the seven deadly
wastes (wastes of overproducing, waiting, over processing, inventory, motion, defects or
correction and transport), (d) make the work flow continuously, (e) pull the work, don’t
push it, and finally (f) pursue to perfection.
Page 15
9
Three phases of lean application
The lean concepts are grouped into three phases. (Tapping & Shuker, 2003) They
are (A) Customer demand phase where the customer demand is thoroughly understood
and it was met for your work required. The various tools and concepts for determining
and meeting customer demand include takt time calculation, pitch calculation, buffer and
safety resources, 5S for the office, problem solving methods. (B) Continuous flow phase
where the continuous flow is established to ensure that the right work units arrive at the
right time, in the correct amounts to your customers-both internal and external. The tools
that can be used for continuous flow include in-process super markets, kanban system,
first-in-first-out (FIFO), line balancing, standardized work and work area design (C)
Leveling phase where we must perform leveling to distribute work evenly and effectively
after determining the customer demand and continuous flow was set up. The tools that
can be used leveling include visible pitch board, load leveling box and runner system.
Value stream management is not a management tool; it is a proven process for
planning the improvements that will allow the company to become lean. Successful lean
manufacturing initiative depends on four critical behaviors: (1) Make true commitment,
(2) Understand customer demand thoroughly, (3) Depict the current state accurately, and
(4) Communicate, communicate, and communicate.
.
Page 16
10
CHAPTER III: METHODOLOGY
The objective of this research work is to reduce the total lead time of the software
development process and thereby reduce the costs involved in deploying a software
project. The perceived need in this area was due to growing concern among the end users
about the increasing lead times and reducing the rework of the software product. The
results of this research work will have direct effect on improving the quality of the
software product, improvising the information flow and reducing the communication gap
when deploying a software product.
This research work started with collection of information regarding the existing
process flow for the software development process, how many people were involved in
each step and identifying the cycle times and waiting times in each step. Based on the
information collected by interacting with various people from the software development,
end users and business analysts the current state value stream map is drawn showing the
process flow, product flow, information flow and the communication flow. The take time
is also calculated. Then based on the concepts in lean philosophy, the current state is
expanded to future state value stream map by eliminating the non value added activities,
elimination of waste, improving the communication and information flow and
implementing the pull system techniques. Finally the projected savings in terms of total
lead time are calculated and the advantages of pull system are demonstrated. The benefits
of new process changes in transforming into future state of value stream are projected and
the awareness, need for change management is created and communicated to all the end
users in the company. This project is also aimed at improving the software development
process in the information technology department of the XYZ manufacturing company.
Page 17
11
Subject Selection and Description
This research study was internal study and limited to the Information Technology
division’s software development process of an XYZ manufacturing company. The
researcher used end users, business analysts, and software development team members as
the sample population to collect the information and the process flow. The population
who are going to experience the benefits of this research work are the entire set of
employees in the company who use the Enterprise Resource Planning software for their
business needs.
Data Collection Procedures
A 12 question questionnaire was administered for information gathering purpose
about the current process flow and operations. This questionnaire was administered using
verbal interaction and data gathering was also performed with the help of company’s
internal documentation and procedure flows. The questionnaire asks
1. What is the software development process flow?
2. How does the end user submit the software specification request?
3. How is the request evaluated and what are the potential consequences with the business process by doing the request is determined?
4. How is it estimated that how long it is going to take to complete the development
and testing?
5. How are the software requests prioritized?
6. How many software requests are sitting idle per day?
7. What is the time taken at each step of the software development process flow?
8. How many resources are being used at each step of the process?
Page 18
12
9. What is the reject or scrap rate at each step?
10. How does the user communication take place before, during and after the
software development process?
11. How and when is the end user involved in testing process? 12. How are the issues handled once the request is moved to production system?
Data Analysis
The data collected was used to calculate the takt time, total queue time, total cycle
time and total lead time. Takt time was calculated as the ratio of total available time in a
month and monthly demand. The total cycle time is calculated as the sum of all
individual cycle times for individual operations and total queue time is calculated as sum
of all queue times for individual operations. Finally the total lead time is computed as the
sum of total cycle time and total queue time. These calculations are performed for both
the current state and future state value stream maps. The bottlenecks are identified in the
entire process, the potential areas are identified in order to reduce the total lead time,
improve the product transformation flow and improve the communication flow.
Limitations
1. The research was limited to software development process of information
technology department in an XYZ manufacturing company.
2. It may be expensive to bring the new process changes.
3. If people are not ready to accept the change then the projected results are
unachievable.
4. The new changes may take long time to implement and it depends on how much
resources and costs are allocated
Page 19
13
CHAPTER IV: RESULTS
Item Analysis
The purpose of this study was to find out the potential areas in the software
development life cycle of a request where the where time is consuming more and identify
the possible solutions to reduce the total lead time. Value stream mapping was chosen in
order to do this because; this is the first step in order to implement a lean system in order
to achieve the excellence in company’s operations. Identifying the bottlenecks that
prevents from the achieving of deploying the request on time or ahead of the time from
the time estimated was one of the reasons why value stream mapping was chosen to
resolve the issues facing by the software development division of the XYZ manufacturing
company. The main objective was to show the information flow, material / software
request flow and the transformation process between each step, measuring and
identifying the waste and reduce the inventory levels.
Current State Value Stream Map Analysis
Value stream mapping for software development process for a software
specifications request started with drawing a current state map by identifying all the steps
in the process, calculating cycle time for each step by identifying how long each step is
going to take, what is the queue time between each step in the process. Then the total
cycle time, total queue time and total lead time for the entire process is calculated. The
Takt time is calculated based on the total available time and the average requests per
month. This Takt time will be formed as a basis for drawing the future state map.
Page 20
14
The steps in the software development process flow are described below:
1. The first step in the software development process flow starts with end
user submitting a software requirements specification to the business
analyst in the plant and the business analyst document it. The end user
submits this request electronically via email or fax. Once this is finished
the request is forwarded to the software development division of the
Information Technology department in the XYZ manufacturing company.
This step is handled by one person and it takes one hour to complete.
2. The second step in the software development process flow is prioritizing
the software requests and this usually takes place once in three months and
involves four people to complete.
3. The third step in the software development process flow involves
estimating how long the software developer takes to complete the
development of the request. This involves two people and takes ten
minutes to complete.
4. The fourth step in the software development process flow involves the
designing, developing and testing of software development request. This
will be completed by one developer and takes two days to complete
programming for a request.
5. The fifth step in the software development process flow is end user testing
acceptance and rework if required. This involves three people and it takes
two to four days to complete.
Page 21
15
6. The sixth step in the software development process flow is change control
board approval of the software request to move it to live system. This
involves five people and takes about ten minutes to complete this step.
7. The seventh and final step in the software development process flow
involves deploying the end software product into the production system.
This involves one developer and takes two hours to complete this step.
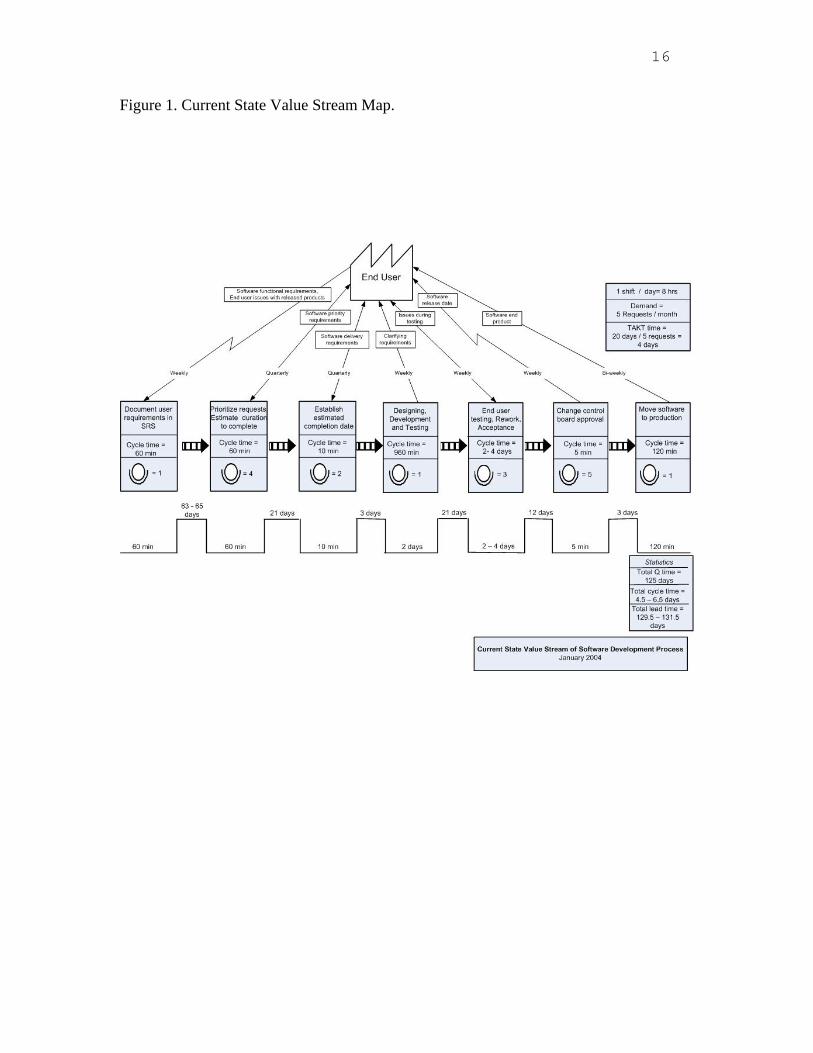
Once each step is depicted in the current state map, the number of operators
required for each step is identified and shown on the map. This is followed by identifying
what kind of flow system between each step in the software development life cycle. The
current state map has the push system with a type of first in first out request between each
step in the software development process. Whenever for a request, the priority becomes
higher due to the management needs or urgent demand from the user, the current request
is stopped developing by the developer and higher prioritized request is handled by the
developer. By doing this the lead time for a step will increase drastically, which finally
resulted in the increase of overall lead time of the halted request by the time it was
completed. With the push system, the software developer is overwhelmed with the
number of software requests and that simultaneously results in queue time between some
of the steps in the project life cycle. Also the irregular prioritization is one of the factors
that increase the overall lead time for a particular request. Similarly when the software
requirements specifications aren’t complete by the time the developer has started
developing the request, there will be rework involved at the step when user starts testing
the request. This is also one of the reasons for overall increase of lead time of the request.
Page 22
16
Figure 1. Current State Value Stream Map.
Page 23
17
The same is the case when the user isn’t aware or not sure about the test scenarios or
when the user needs some inputs when accepting the test results. If the user is unsure of
accepting the request the user requests for some additional resources for testing and
acceptance and that involves significant time for them to understand the request, identify
the test results, accept the test scenarios and finally accept the request to be moved into
the production system for their use. The manual and electronic information flows
between end user and software development department is shown in the value stream
map.
Future state value stream map analysis
Once the current state value stream map is analyzed the lean philosophy is applied
to the current stream map in order to design the future state map. The opportunities are
identified to design a more efficient and waste-free value stream.
The future state map has three stages and the first stage starts with the customer
demand stage which includes understanding the characteristics like quality, time and
price. Then instead of push system that was present in current state value stream map,
pull system is implemented in order to implement continuous flow so that both the users
and software developers receive the right product at the right time in the right quantity.
Finally in the leveling stage work is distributed evenly by volume and variety, to reduce
the inventory and Work-In-Process (WIP) and to allow any type of prioritized requests by
the end user.
Page 24
18
Figure2. Future State Value Stream Map.
Page 25
19
In designing the future stage the Takt time is determined first and it is determined
whether the software development team is meeting the demand using the current process
flow. After the first step in the software development process flow, the work in process
supermarket is chosen as flow system since there is a possibility that multiple requests
may be give to the software developer and this shipping method is the best possible
option to store a set of prioritized requests and replenish them as they are pulled to fulfill
customer orders. The supermarket is chosen since it is not possible to establish pure,
continuous flow. The reasons for longer queue time are identified and the requests are
prioritized more frequently in order to reduce the waiting time after this step.
After the first step in the future state value stream, it was determined that end user
demand can be easily met with the current available resources and software development
process flow and hence the focus was established to implement continuous flow for the
subsequent steps in the software development process flow. The third step present in the
current state value stream is eliminated and merged with the second step in the future
state as this step is considered to be not adding value to the end user.
After the second step in the future state value stream, the reasons for longer queue
time are determined and based on the end user demand and cycle time of the third step a
continuous flow with FIFO was chosen to be implemented. Similarly after the third step
the continuous flow process was implemented using FIFO method for subsequent steps.
Finally the total cycle time, total queue time and total lead time are calculated and the
information flow are depicted on the future state value stream map.
Page 26
20
Understanding and fulfilling the customer demand to promote flow and to level
the software development work is not enough to ensure a successful lean transformation.
The success depends on the ability to identify the problems after drawing the current state
value stream and resolving them. Hence the future state value stream is designed to be
continuous, flexible and maintain the takt time.
Page 27
21
CHAPTER V: DISCUSSION
The purpose of this research work was to reduce the total lead times in delivering
the quality software product with improved communication flow and visibility to the end
user. The analysis of current state value stream map and future state value stream map
has provided an insight about the potential areas for improvement in quality, costs and
time. It has not only identified the bottlenecks in the whole software development
process but also lead to significant process improvement. The future state value stream
map has given clear picture about the software process flow, information flow and the
product transformation flow and has shown that how a pull system functions when
compared to push system as shown in the current state value stream map. This chapter
provides information about the limitations of the value stream mapping, conclusions and
the recommendations.
Limitations
1. The research was limited to software development process of information
technology department in an XYZ manufacturing company.
2. It may be expensive to bring the new process changes.
3. If people are not ready to accept the change then the projected results are
unachievable.
4. The new changes may take long time to implement and it depends on how much
resources and costs are allocated.
Page 28
22
Conclusions
The value stream mapping process is an efficient tool and is the first step
to transform to a lean enterprise and it has proved for Software development process in
an Information Technology department.
Once the current state map is finished it has straight away shown what are the
focus areas that the software development that needed immediate attention. The longer
queue times almost between all the steps in the process flow and frequency of
communication with the end user in the process and the elimination waste are the
activities are concluded to be resolving most of the issues.
This was achieved by coming out with the future state map and addressing the
issues identified in the current state map. The future state map started with a pull system
rather than push system that was present in current state in order to reduce the work load
in the software development division. Based on the Takt time, the exact times required at
each step are determined and the unnecessary queue times between each step in the entire
process flow are reduced to minimum level. The frequency of information and
communication flow between end user and the software development department is
increased so that there is more visibility in the process regarding the software product
flow.
The benefits of this new future state map are going to be experienced with the
support and involvement of all the people involved in the process and with the support of
the management in the company. There is a significant change in software development
process flow before the value stream mapping and after the future state value stream map
Page 29
23
and the benefits of this are going to be felt by the users in the company if it is
implemented properly.
Recommendations
Although the future state map gave some visible areas where the benefits are
going to be felt, one area that needs to be improved is more involvement of software
developer in the designing of the software product. This can be addressed by
implementing the concurrent engineering methodology which can reduce the rework
performed by the developer in software developing and end-user testing stages. This will
not only improve the efficiency of the process but also decrease the total cycle time.
The second area is more prioritization of software projects as the end user and
management needs changes dynamically according to many internal and external factors.
This will improve the communication flow and visibility to track the status of the request
and the product delivery requirements.
The third area is to prepare ahead with the test scenarios and how the results
should look like for a software product and this will save significant amount of time in
the end user testing and acceptance stage of the process life cycle.
The fourth area was to implement an intranet for the software development
request showing the information about who is the actual developer, actual status of the
software request, information regarding actual start date and the projected end date, and
any other important notes that can be updated dynamically and daily. This will provide
the end user a faster and convenient access to see the status of the software request and
there by providing superior customer service.
Page 30
24
This research study was performed for the software development division of the
Information Technology department in the company. This can be extended to other areas
of Information Technology support namely Computer Infrastructure, Networking, End
user services etc. In order to become a lean office, this value stream mapping can be
implemented not only in the whole of Information Technology department sub divisions
but this can be extended to other areas like human resources, finance, sales and
marketing, customer service and support, etc. This will lead to an efficient way of
managing things in the whole of the company with substantial amount of savings in
performance measures like cost and time and with a quality product with better customer
service.
Page 31
25
References
Chaneski, W. (2001). Companies are learning from value stream. Retrieved April 10,
2004, from http://www.mmsonline.com/articles/0404ci.html
Monden, Y. (1993). An integrated approach to just-in-time. Norcross, GA: Industrial
engineering and management press
Rother, M., & Shook, J. (1999). Learning to see. Brookline, MA: Lean Enterprise
Institute, Inc.
Tapping, D., Luyster, T., & Shuker, T. (2002). Value stream management. New York,
NY: Productivity Inc
Tapping, D., & Shuker, T. (2003). Value stream management for the lean office. New
York, NY: Productivity Inc.
Williams, D. (2002). Value stream mapping. Retrieved April 10, 2004, from
http://www.dwassoc.com/value-stream-mapping.php