42
GREENLEA LANE CAPITAL Private Investment Partnership VALUEx Vail 2012 Josh Tarasoff – General Partner [email protected]
| Date post: | 24-Oct-2014 |
| Category: |
Documents |
| Upload: | vitaliykatsenelson |
| View: | 43,293 times |
| Download: | 12 times |
GREENLEA LANE CAPITAL Private Investment Partnership
VALUEx Vail 2012
Josh Tarasoff – General Partner [email protected]

THIS DOCUMENT SHALL NOT CONSTITUTE AN OFFER TO SELL OR THE
SOLICITATION OF ANY OFFER TO BUY. NO PART OF THIS DOCUMENT IS
A RECOMMENDATION OR A SOLICITATION. THE INFORMATION AND
BELIEFS CONTAINED HEREIN ARE BELIEVED TO BE CORRECT, BUT
THERE IS NO GUARANTEE.
2
3
Investment Idea: Amazon.com (AMZN)
• Amazon.com (AMZN)
– 2011 net sales of $48 billion
• 40% y/y growth
– $100 billion market capitalization (at 6/15/12)
• $218.35 per share
– 179x trailing GAAP EPS
• AMZN is the finest business of which I am
aware, and I believe it is (very) cheap
4
AMZN is a mass merchant
• AMZN offers 14 million SKUs
• As a percentage of 2011 revenue:
– 65% electronics & general merchandise (57%
growth)
– 35% media (16% growth)
– 5% other (advertising, AWS) (72% growth)
– 56% North American (43% growth)
– 44% international (38% growth)
5
• Mass merchants compete on price, selection,
and convenience
• Walmart is the dominant mass merchant, and
its formula for success is straightforward
– Scale efficiencies permit low prices, wide selection
– Low prices attract more customers
– More customers drive greater scale
– Greater scale permits further price decreases
– And so on…
Strategy for mass merchants is simple
6
AMZN possesses decisive advantages
• AMZN is structurally advantaged with respect
to the key competitive factors in physical
retailing:
– Price, selection, and convenience
• Moreover, AMZN’s business model affords it
advantages that unavailable to physical
retailers:
– Personalization
– Habit formation
7
Advantage #1: Cost structure / pricing
• Physical retailers’ largest operating expenses substituted with technology
– Labor and real estate are inflationary and largely variable
– Technology is deflationary and largely fixed
• Inventory management is more efficient
– Inventory need not be replicated over thousands of stores
– Pulled by demand rather than pushed by merchandising
– Inventory turnover: AMZN 12x; WMT 8x; TGT 6x
• Lower shrinkage
– Most shrinkage occurs in-store
8
Advantage #2: No selection constraint
• Because physical store size must be finite,
selection must be finite
• This creates a tradeoff between the number of
categories in which a physical retailer can
participate and the depth / specialization in
each category
• No such tradeoff exists online
9
Advantage #3: Convenience
• Online, customers can shop anytime, anywhere
• They need not:
– Travel to and from the store
– Search the aisles
– Wait in checkout lines
10
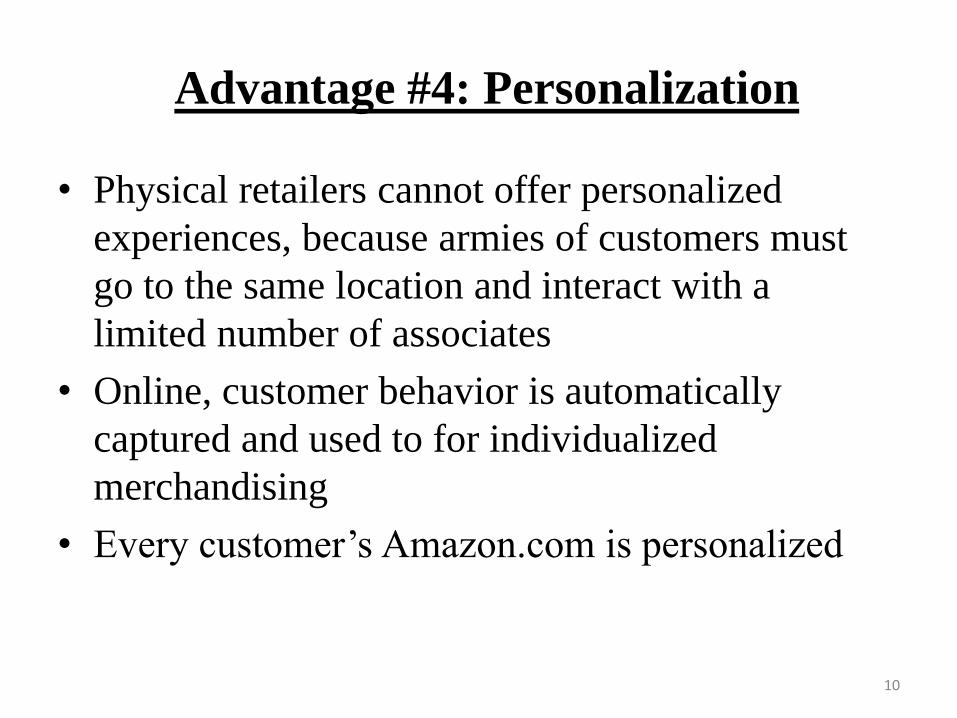
Advantage #4: Personalization
• Physical retailers cannot offer personalized
experiences, because armies of customers must
go to the same location and interact with a
limited number of associates
• Online, customer behavior is automatically
captured and used to for individualized
merchandising
• Every customer’s Amazon.com is personalized
11
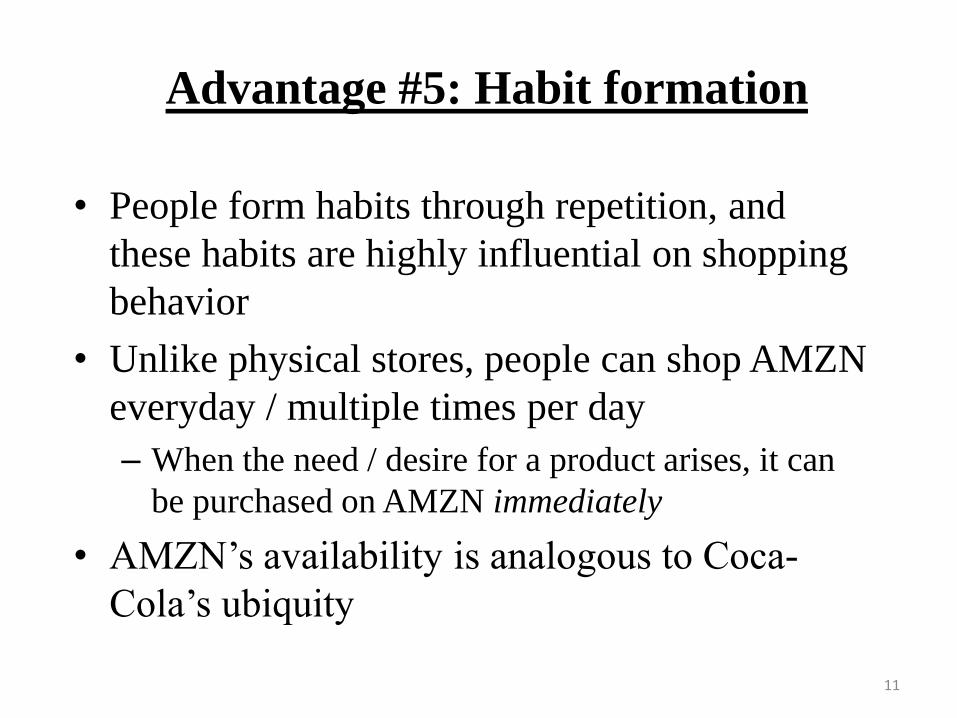
Advantage #5: Habit formation
• People form habits through repetition, and
these habits are highly influential on shopping
behavior
• Unlike physical stores, people can shop AMZN
everyday / multiple times per day
– When the need / desire for a product arises, it can
be purchased on AMZN immediately
• AMZN’s availability is analogous to Coca-
Cola’s ubiquity
12
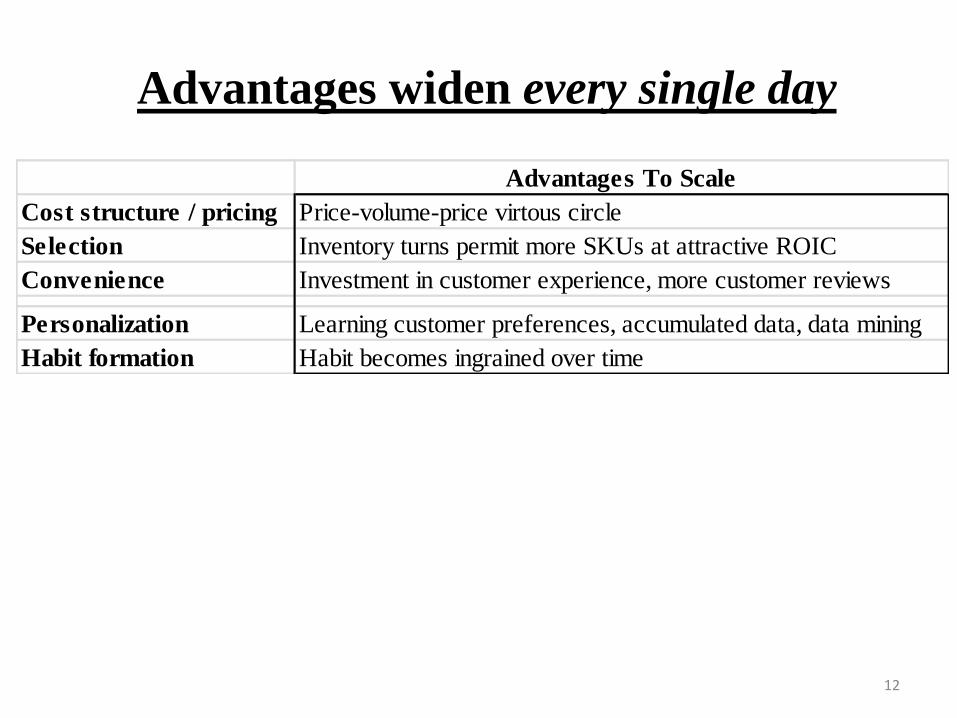
Advantages widen every single day
Advantages To Scale
Cost structure / pricing Price-volume-price virtous circle
Selection Inventory turns permit more SKUs at attractive ROIC
Convenience Investment in customer experience, more customer reviews
Personalization Learning customer preferences, accumulated data, data mining
Habit formation Habit becomes ingrained over time
13
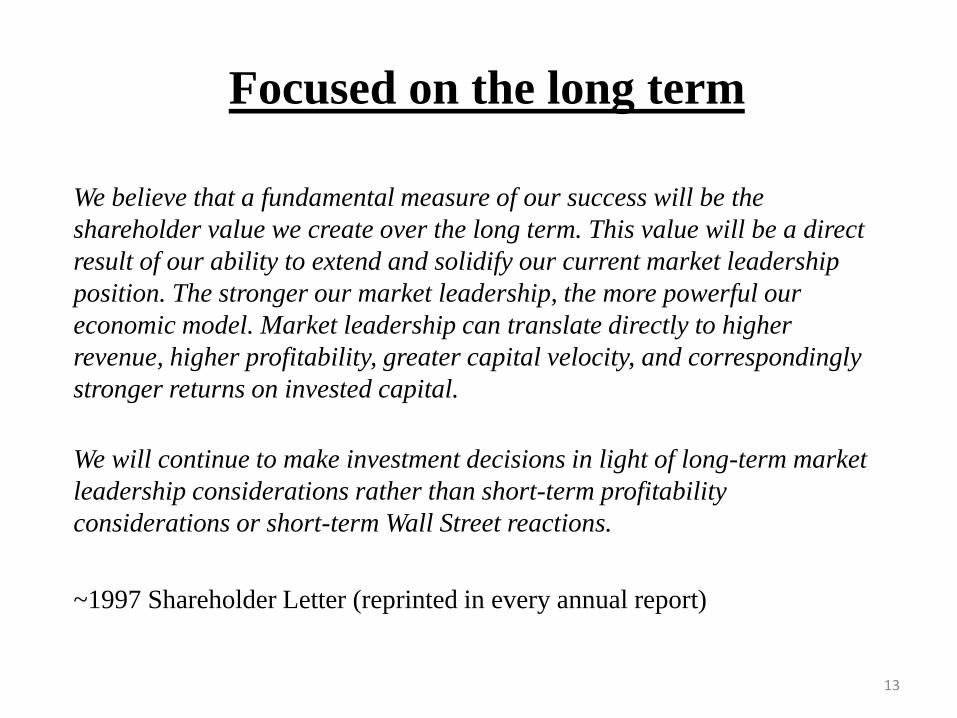
Focused on the long term
We believe that a fundamental measure of our success will be the
shareholder value we create over the long term. This value will be a direct
result of our ability to extend and solidify our current market leadership
position. The stronger our market leadership, the more powerful our
economic model. Market leadership can translate directly to higher
revenue, higher profitability, greater capital velocity, and correspondingly
stronger returns on invested capital.
We will continue to make investment decisions in light of long-term market
leadership considerations rather than short-term profitability
considerations or short-term Wall Street reactions.
~1997 Shareholder Letter (reprinted in every annual report)
14
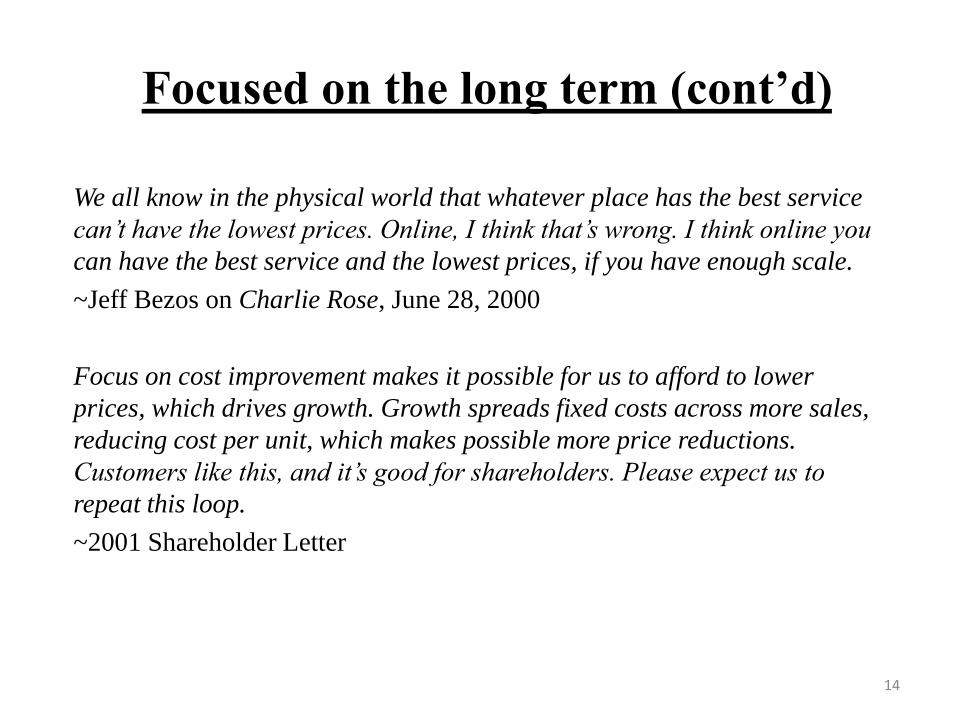
Focused on the long term (cont’d)
We all know in the physical world that whatever place has the best service
can’t have the lowest prices. Online, I think that’s wrong. I think online you
can have the best service and the lowest prices, if you have enough scale.
~Jeff Bezos on Charlie Rose, June 28, 2000
Focus on cost improvement makes it possible for us to afford to lower
prices, which drives growth. Growth spreads fixed costs across more sales,
reducing cost per unit, which makes possible more price reductions.
Customers like this, and it’s good for shareholders. Please expect us to
repeat this loop.
~2001 Shareholder Letter
15
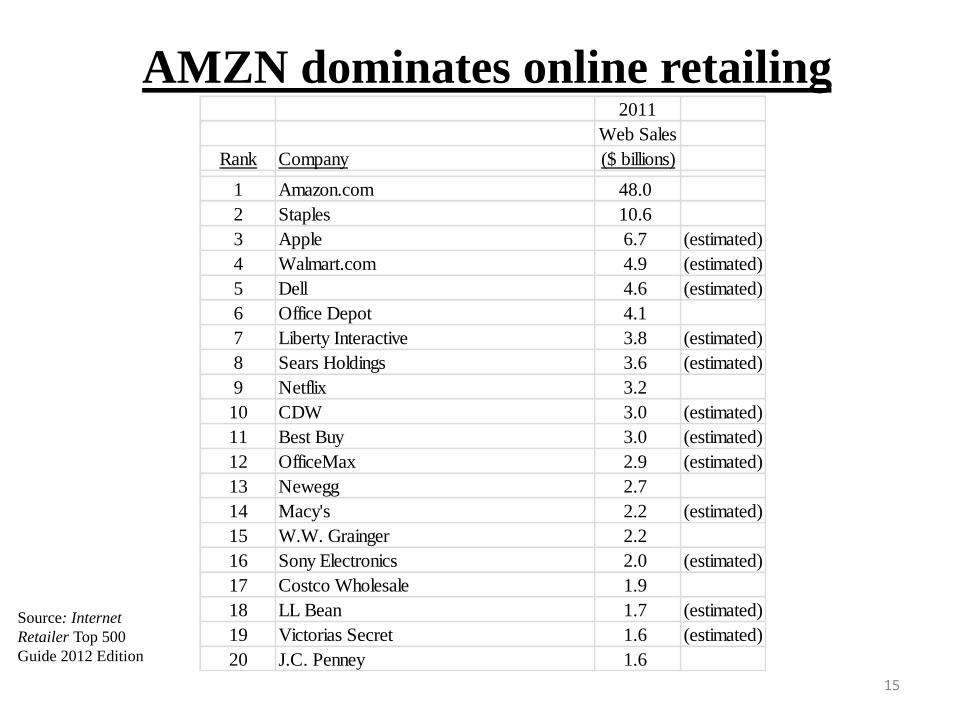
AMZN dominates online retailing
Source: Internet
Retailer Top 500
Guide 2012 Edition
2011
Web Sales
Rank Company ($ billions)
1 Amazon.com 48.0
2 Staples 10.6
3 Apple 6.7 (estimated)
4 Walmart.com 4.9 (estimated)
5 Dell 4.6 (estimated)
6 Office Depot 4.1
7 Liberty Interactive 3.8 (estimated)
8 Sears Holdings 3.6 (estimated)
9 Netflix 3.2
10 CDW 3.0 (estimated)
11 Best Buy 3.0 (estimated)
12 OfficeMax 2.9 (estimated)
13 Newegg 2.7
14 Macy's 2.2 (estimated)
15 W.W. Grainger 2.2
16 Sony Electronics 2.0 (estimated)
17 Costco Wholesale 1.9
18 LL Bean 1.7 (estimated)
19 Victorias Secret 1.6 (estimated)
20 J.C. Penney 1.6
16
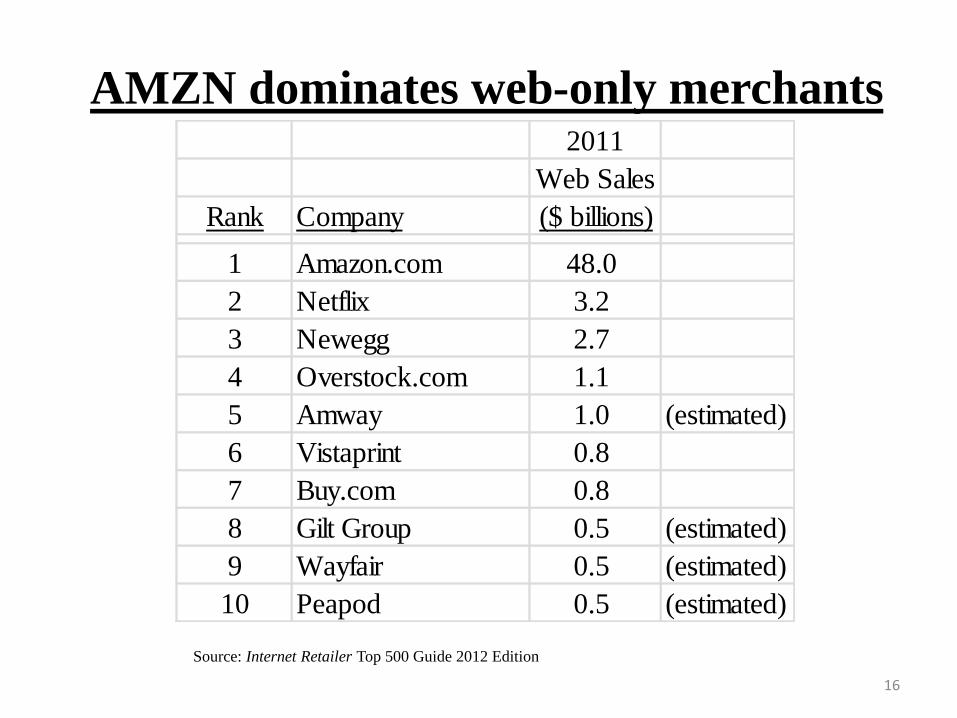
AMZN dominates web-only merchants
Source: Internet Retailer Top 500 Guide 2012 Edition
2011
Web Sales
Rank Company ($ billions)
1 Amazon.com 48.0
2 Netflix 3.2
3 Newegg 2.7
4 Overstock.com 1.1
5 Amway 1.0 (estimated)
6 Vistaprint 0.8
7 Buy.com 0.8
8 Gilt Group 0.5 (estimated)
9 Wayfair 0.5 (estimated)
10 Peapod 0.5 (estimated)
17
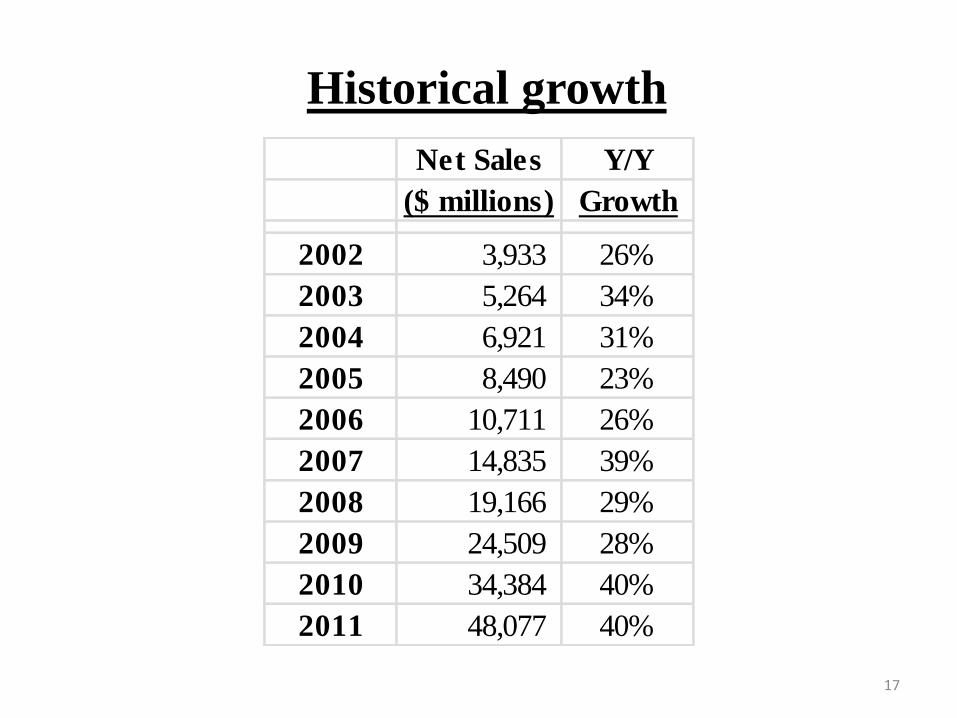
Historical growth
Net Sales Y/Y
($ millions) Growth
2002 3,933 26%
2003 5,264 34%
2004 6,921 31%
2005 8,490 23%
2006 10,711 26%
2007 14,835 39%
2008 19,166 29%
2009 24,509 28%
2010 34,384 40%
2011 48,077 40%
18
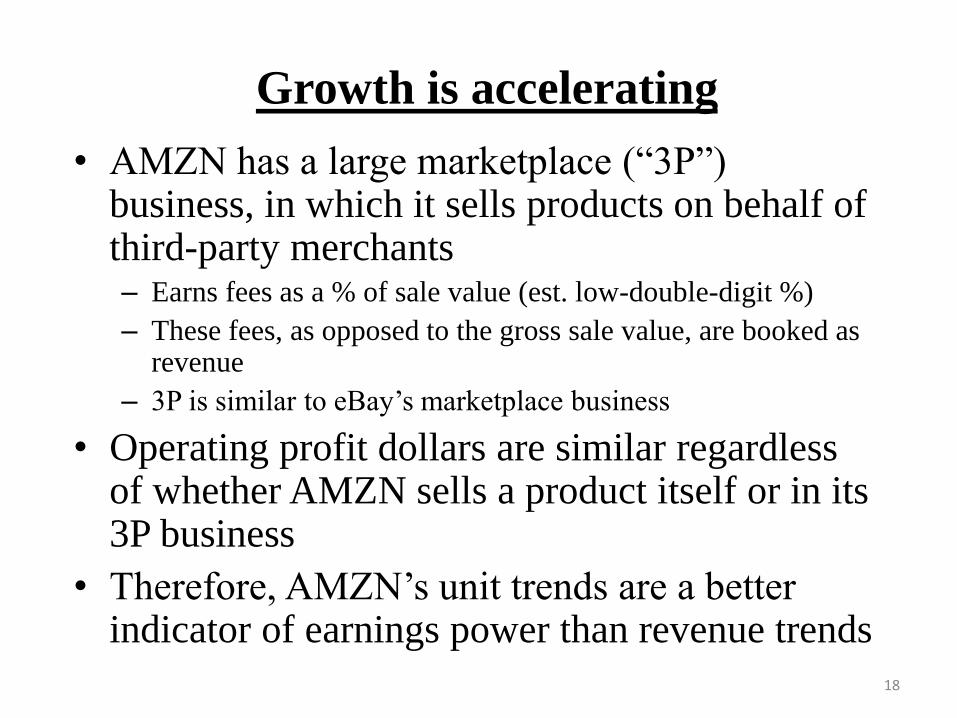
Growth is accelerating
• AMZN has a large marketplace (“3P”) business, in which it sells products on behalf of third-party merchants – Earns fees as a % of sale value (est. low-double-digit %)
– These fees, as opposed to the gross sale value, are booked as revenue
– 3P is similar to eBay’s marketplace business
• Operating profit dollars are similar regardless of whether AMZN sells a product itself or in its 3P business
• Therefore, AMZN’s unit trends are a better indicator of earnings power than revenue trends
19
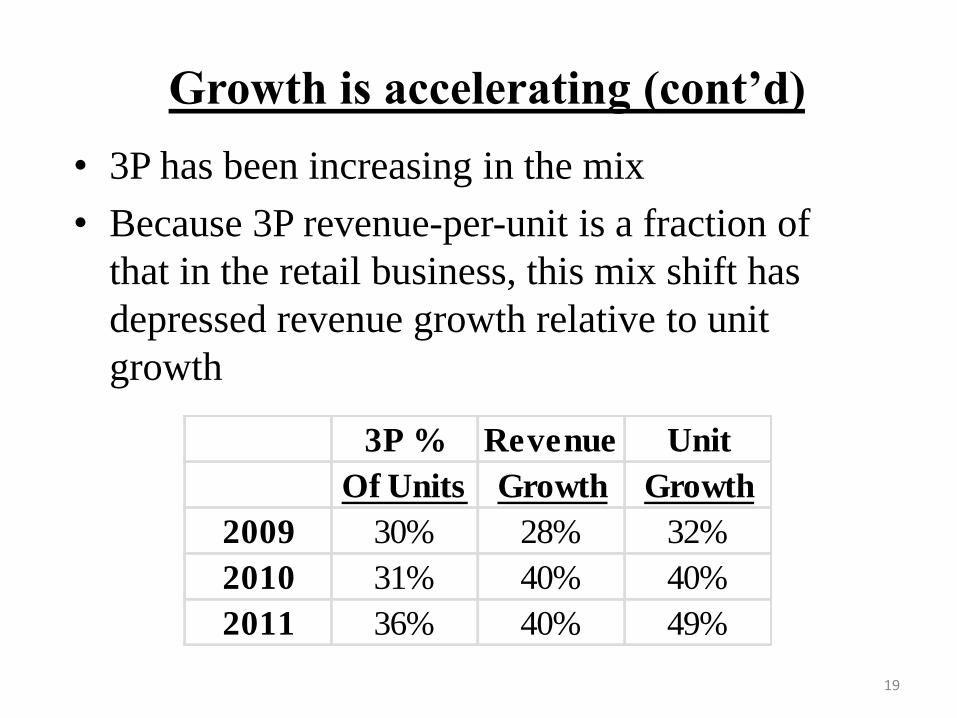
Growth is accelerating (cont’d)
• 3P has been increasing in the mix
• Because 3P revenue-per-unit is a fraction of
that in the retail business, this mix shift has
depressed revenue growth relative to unit
growth
3P % Revenue Unit
Of Units Growth Growth
2009 30% 28% 32%
2010 31% 40% 40%
2011 36% 40% 49%
20
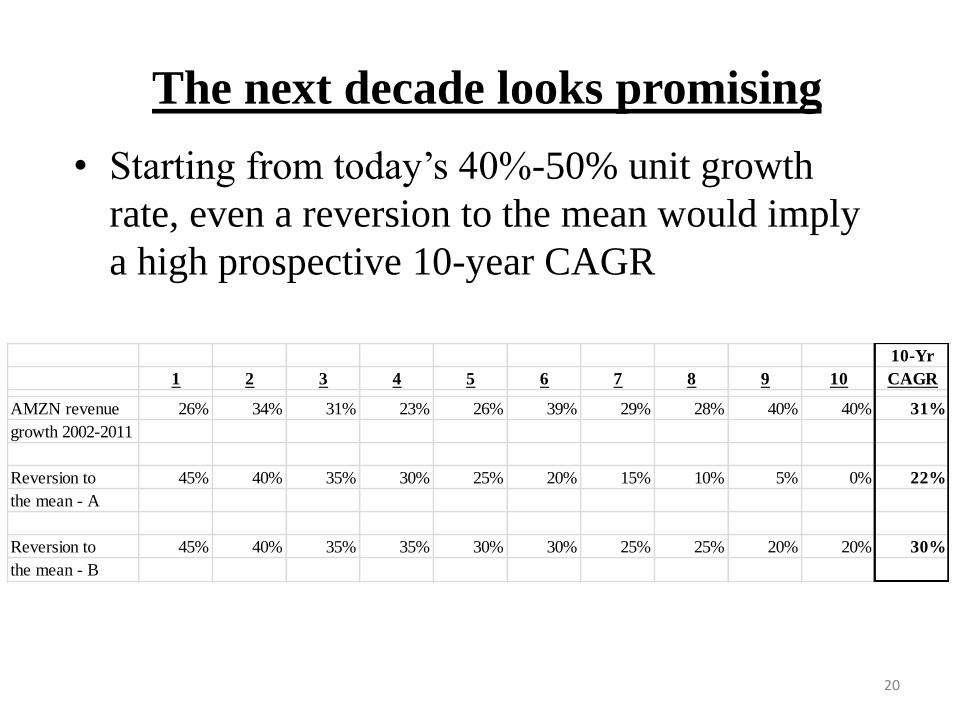
The next decade looks promising
10-Yr
1 2 3 4 5 6 7 8 9 10 CAGR
AMZN revenue 26% 34% 31% 23% 26% 39% 29% 28% 40% 40% 31%
growth 2002-2011
Reversion to 45% 40% 35% 30% 25% 20% 15% 10% 5% 0% 22%
the mean - A
Reversion to 45% 40% 35% 35% 30% 30% 25% 25% 20% 20% 30%
the mean - B
• Starting from today’s 40%-50% unit growth
rate, even a reversion to the mean would imply
a high prospective 10-year CAGR
21
Dramatic mean-reversion seems unlikely
• I estimated AMZN possesses only 1% market share of the categories in which it competes
• Growth is accelerating
– Active user accounts growing at 26%
– Spend per active account growing at 12%
• Selection is wider than ever
– Recent introduction of AmazonSupply
– Push into apparel category
• Customer service ratings are setting records
• Advantages are wider than ever, and widening
22
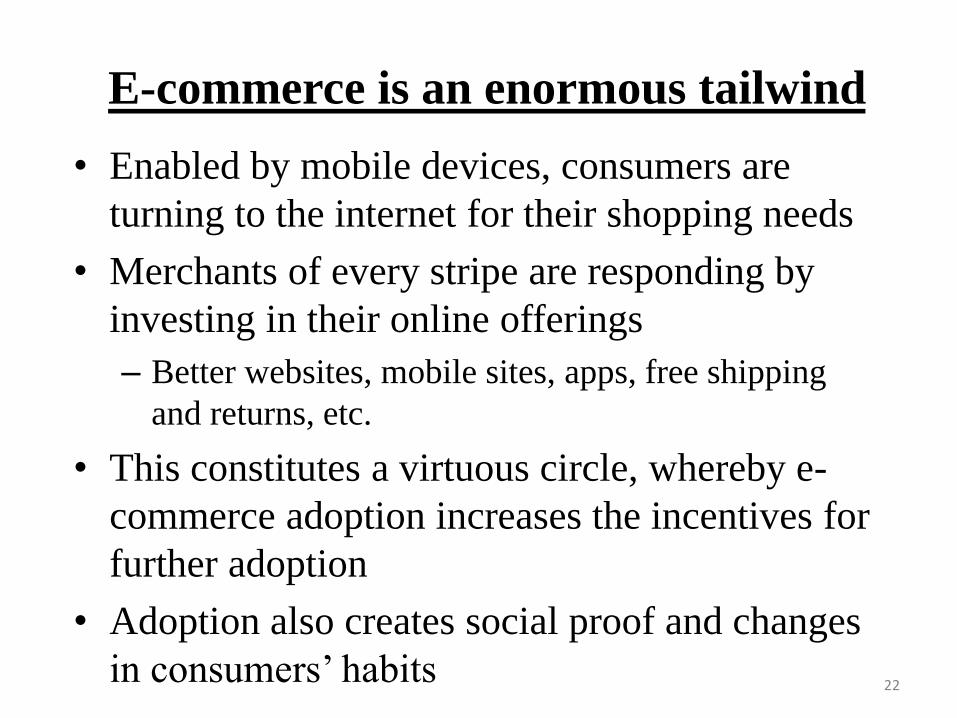
E-commerce is an enormous tailwind
• Enabled by mobile devices, consumers are
turning to the internet for their shopping needs
• Merchants of every stripe are responding by
investing in their online offerings
– Better websites, mobile sites, apps, free shipping
and returns, etc.
• This constitutes a virtuous circle, whereby e-
commerce adoption increases the incentives for
further adoption
• Adoption also creates social proof and changes
in consumers’ habits
23
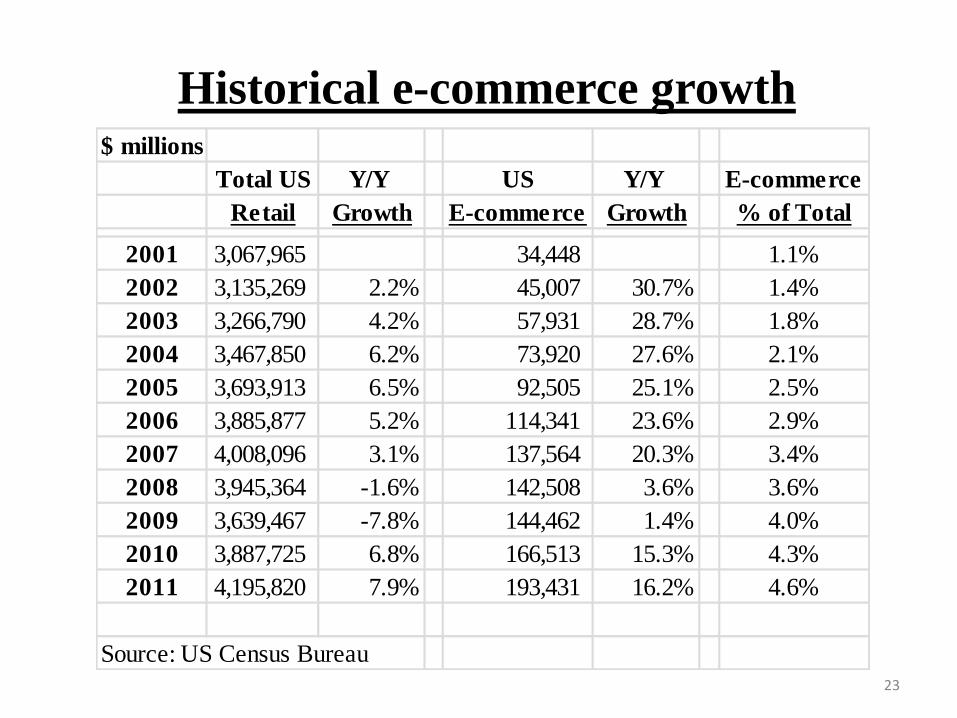
Historical e-commerce growth $ millions
Total US Y/Y US Y/Y E-commerce
Retail Growth E-commerce Growth % of Total
2001 3,067,965 34,448 1.1%
2002 3,135,269 2.2% 45,007 30.7% 1.4%
2003 3,266,790 4.2% 57,931 28.7% 1.8%
2004 3,467,850 6.2% 73,920 27.6% 2.1%
2005 3,693,913 6.5% 92,505 25.1% 2.5%
2006 3,885,877 5.2% 114,341 23.6% 2.9%
2007 4,008,096 3.1% 137,564 20.3% 3.4%
2008 3,945,364 -1.6% 142,508 3.6% 3.6%
2009 3,639,467 -7.8% 144,462 1.4% 4.0%
2010 3,887,725 6.8% 166,513 15.3% 4.3%
2011 4,195,820 7.9% 193,431 16.2% 4.6%
Source: US Census Bureau
24
Potential often underestimated
• I believe intuitions about the penetration
potential of e-commerce are often overly
conservative
• Intuitions and behavior are influenced by habit
• Habits die slowly, but ultimately people
respond to incentives
• E-commerce offers the incentives of better
prices, wider selection, and superior
convenience
25
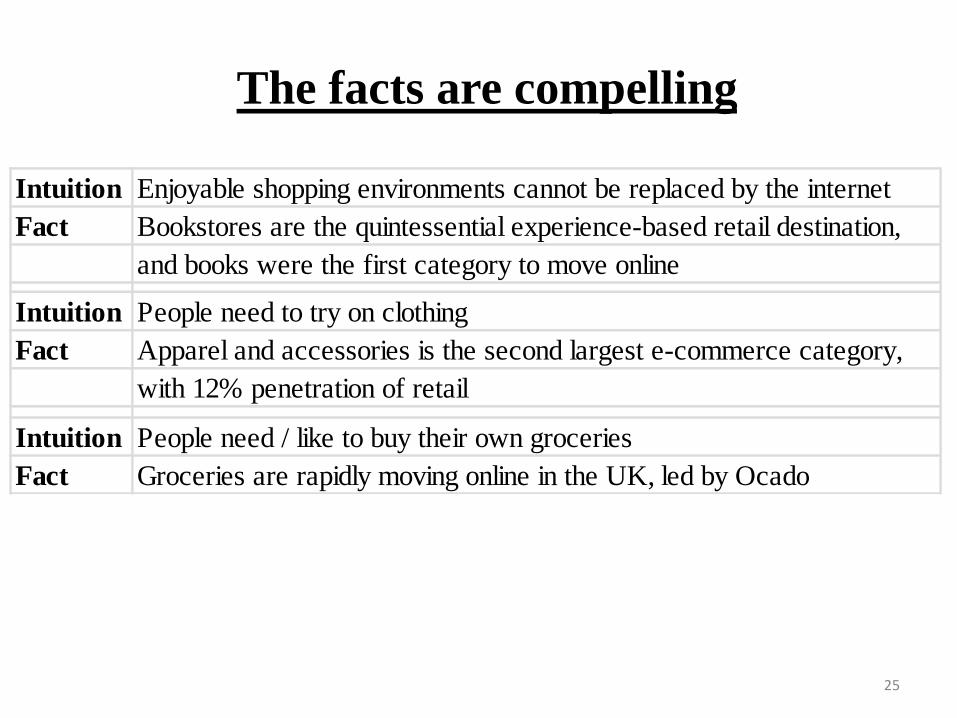
The facts are compelling
Intuition Enjoyable shopping environments cannot be replaced by the internet
Fact Bookstores are the quintessential experience-based retail destination,
and books were the first category to move online
Intuition People need to try on clothing
Fact Apparel and accessories is the second largest e-commerce category,
with 12% penetration of retail
Intuition People need / like to buy their own groceries
Fact Groceries are rapidly moving online in the UK, led by Ocado
26
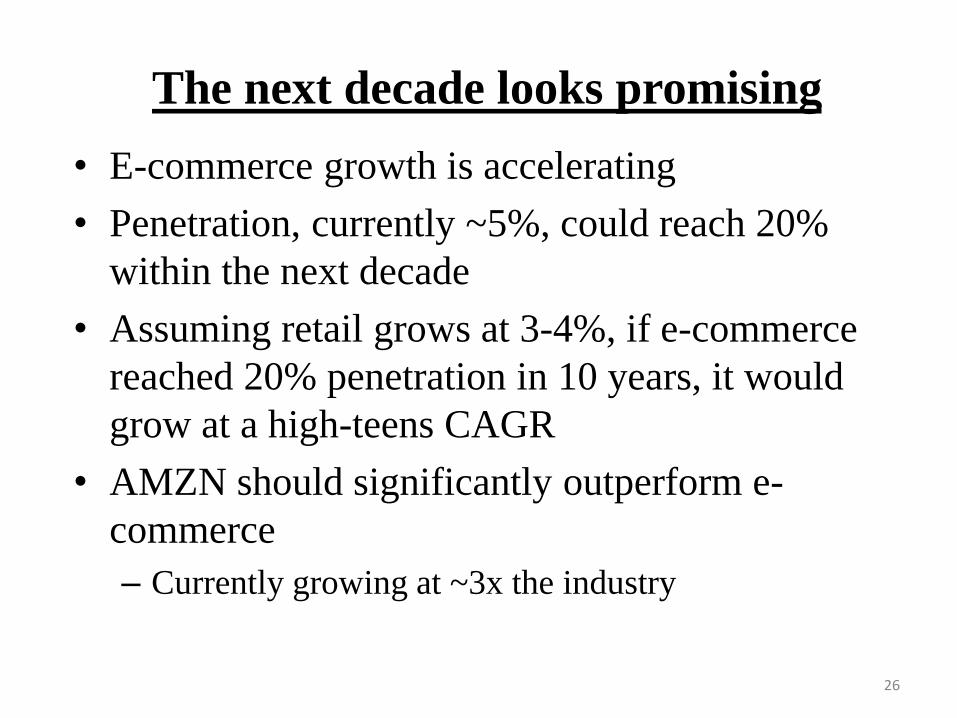
The next decade looks promising
• E-commerce growth is accelerating
• Penetration, currently ~5%, could reach 20%
within the next decade
• Assuming retail grows at 3-4%, if e-commerce
reached 20% penetration in 10 years, it would
grow at a high-teens CAGR
• AMZN should significantly outperform e-
commerce
– Currently growing at ~3x the industry
27
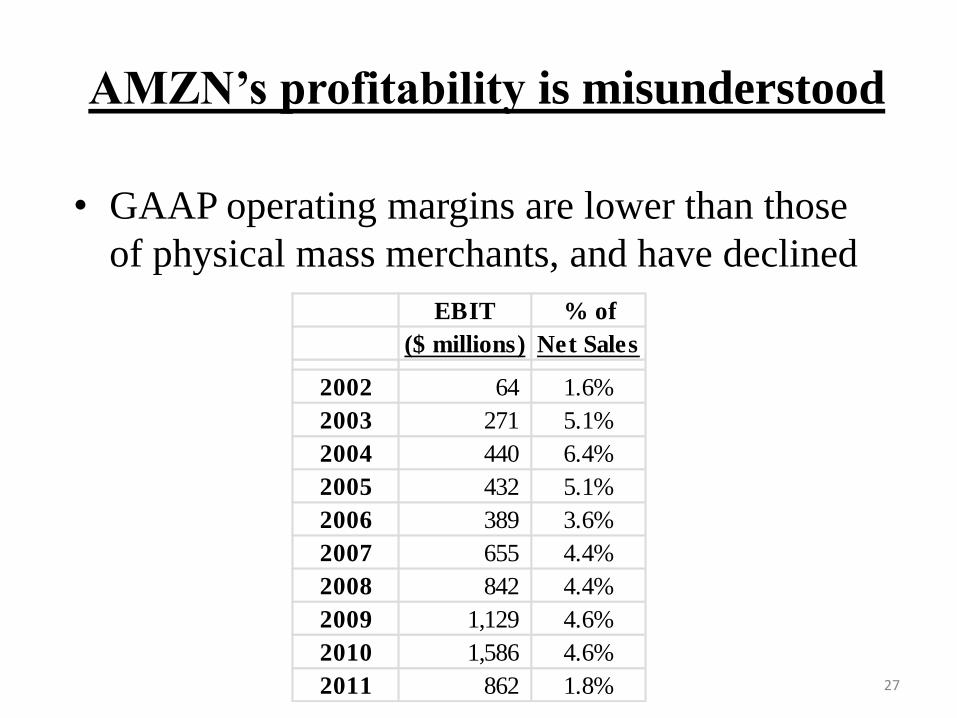
AMZN’s profitability is misunderstood
EBIT % of
($ millions) Net Sales
2002 64 1.6%
2003 271 5.1%
2004 440 6.4%
2005 432 5.1%
2006 389 3.6%
2007 655 4.4%
2008 842 4.4%
2009 1,129 4.6%
2010 1,586 4.6%
2011 862 1.8%
• GAAP operating margins are lower than those
of physical mass merchants, and have declined
28
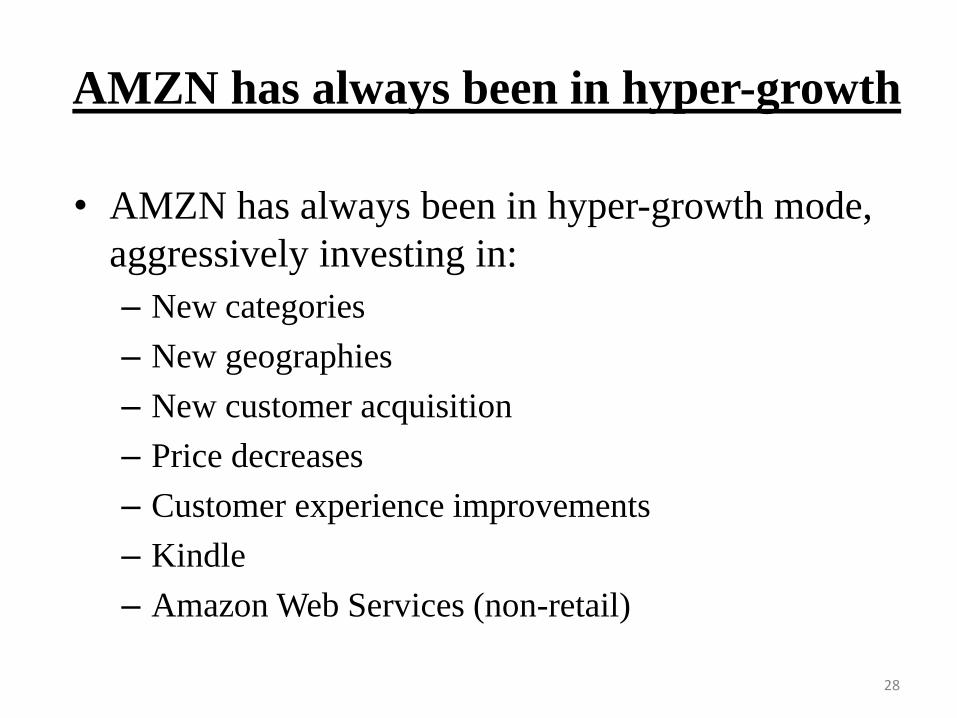
AMZN has always been in hyper-growth
• AMZN has always been in hyper-growth mode,
aggressively investing in:
– New categories
– New geographies
– New customer acquisition
– Price decreases
– Customer experience improvements
– Kindle
– Amazon Web Services (non-retail)
29
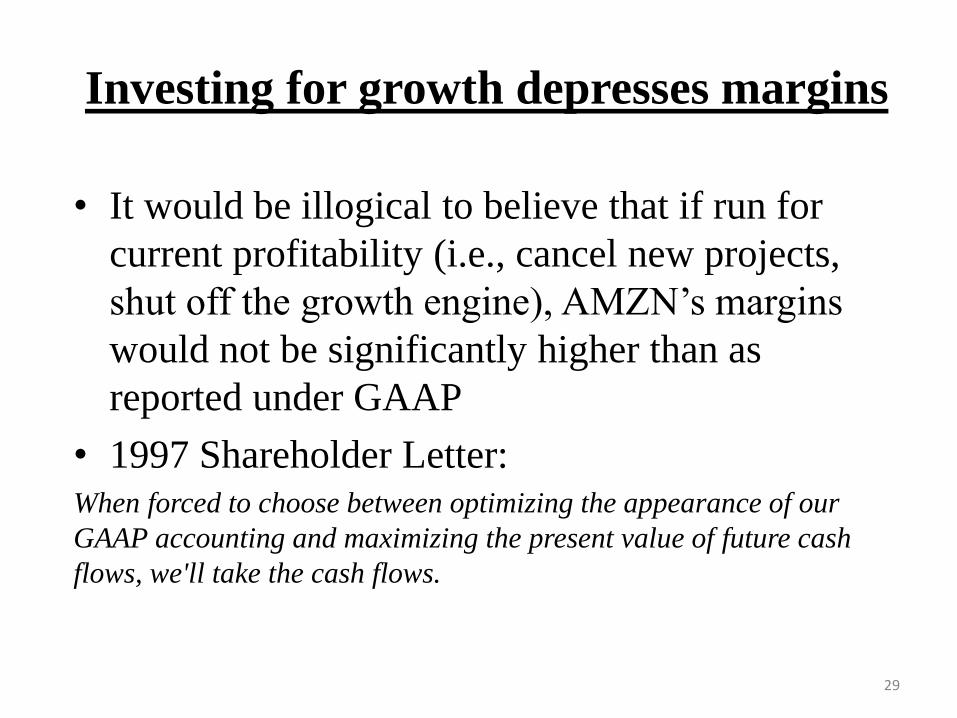
Investing for growth depresses margins
• It would be illogical to believe that if run for
current profitability (i.e., cancel new projects,
shut off the growth engine), AMZN’s margins
would not be significantly higher than as
reported under GAAP
• 1997 Shareholder Letter: When forced to choose between optimizing the appearance of our
GAAP accounting and maximizing the present value of future cash
flows, we'll take the cash flows.
30
Investors anchor on GAAP…
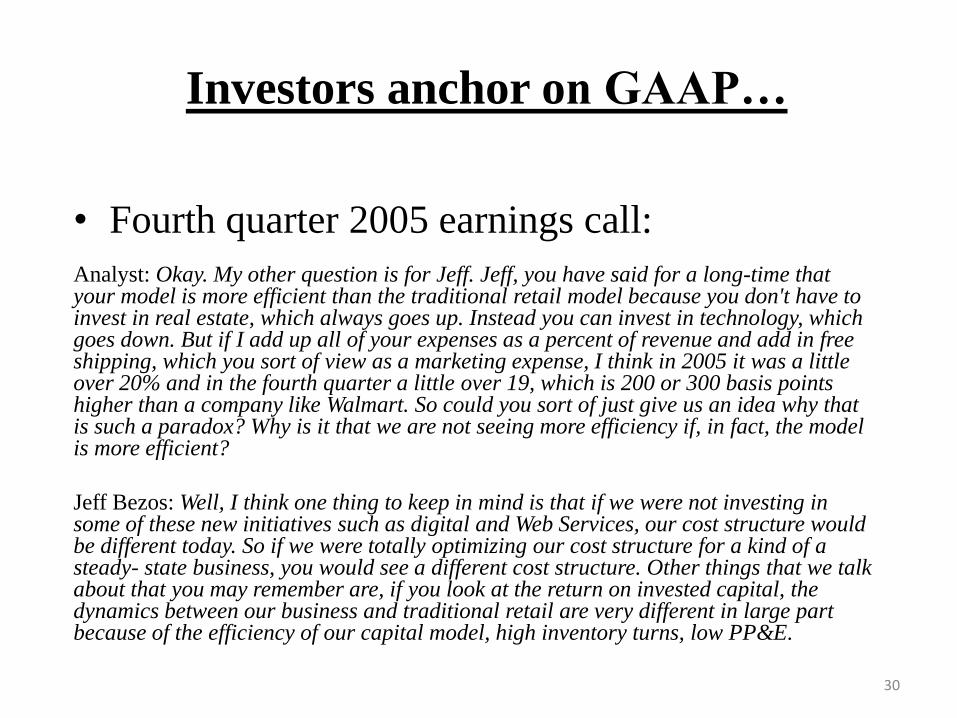
• Fourth quarter 2005 earnings call:
Analyst: Okay. My other question is for Jeff. Jeff, you have said for a long-time that your model is more efficient than the traditional retail model because you don't have to invest in real estate, which always goes up. Instead you can invest in technology, which goes down. But if I add up all of your expenses as a percent of revenue and add in free shipping, which you sort of view as a marketing expense, I think in 2005 it was a little over 20% and in the fourth quarter a little over 19, which is 200 or 300 basis points higher than a company like Walmart. So could you sort of just give us an idea why that is such a paradox? Why is it that we are not seeing more efficiency if, in fact, the model is more efficient?
Jeff Bezos: Well, I think one thing to keep in mind is that if we were not investing in some of these new initiatives such as digital and Web Services, our cost structure would be different today. So if we were totally optimizing our cost structure for a kind of a steady- state business, you would see a different cost structure. Other things that we talk about that you may remember are, if you look at the return on invested capital, the dynamics between our business and traditional retail are very different in large part because of the efficiency of our capital model, high inventory turns, low PP&E.
31
• We can define “normalized operating income”
as the pretax cash flow that would be available
for distribution to shareholders, were AMZN to
abruptly cut off its upward revenue trajectory
• The economic reality is that AMZN is actually
generating this operating income, but is
aggressively reinvesting in the business
…But should focus on normalized
32
AMZN versus WMT / TGT
• AMZN’s normalized operating margins should
be greater than WMT US and TGT’s operating
margins, which are 7% and 8%, respectively
– AMZN has no stores and a fraction of the
employees
– AMZN has a far more efficient distribution system
and virtually no shrinkage
– 3P (>35% of units) generates far higher margins
than a traditional retail business
33
Where are these growth investments?
• There are growth expenditures embedded in
each I/S line, but we will focus on only two:
– Advertising and other promotional costs (AOPC)
• Targeted, revenue generating advertising (mostly online)
• Contributed to ~30% average growth over past decade
• ~2% of revenue over the past decade
– Technology and content
• Growth investments, largely akin to R&D, and including
Amazon Web Services (non-retail)
• ~5% of revenue over the past decade
34
• Together, AOPC and technology & content
have averaged 7.5% of revenue over the past
decade
• It is probable that a majority of these items is
“growth” in nature, and should be added back
to get to normalized operating income
• However, we need to add back only 1/3 of
these expense lines to reach a 7% average
operating margin (comparable to WMT US)
over the past decade
Our growth add-back is conservative
35
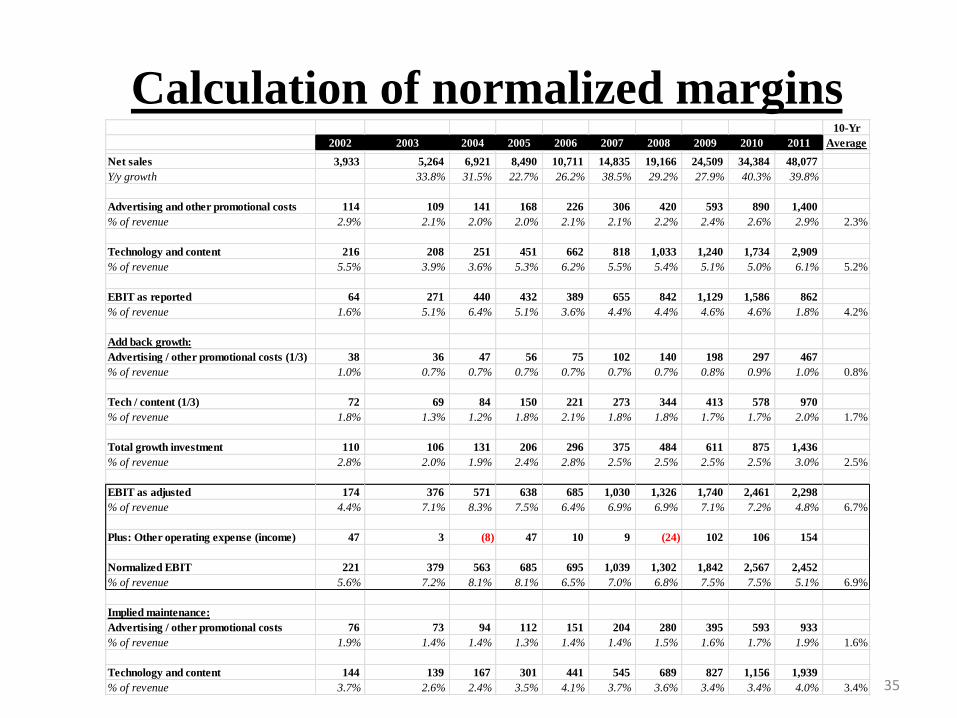
Calculation of normalized margins 10-Yr
2002 2003 2004 2005 2006 2007 2008 2009 2010 2011 Average
Net sales 3,933 5,264 6,921 8,490 10,711 14,835 19,166 24,509 34,384 48,077
Y/y growth 33.8% 31.5% 22.7% 26.2% 38.5% 29.2% 27.9% 40.3% 39.8%
Advertising and other promotional costs 114 109 141 168 226 306 420 593 890 1,400
% of revenue 2.9% 2.1% 2.0% 2.0% 2.1% 2.1% 2.2% 2.4% 2.6% 2.9% 2.3%
Technology and content 216 208 251 451 662 818 1,033 1,240 1,734 2,909
% of revenue 5.5% 3.9% 3.6% 5.3% 6.2% 5.5% 5.4% 5.1% 5.0% 6.1% 5.2%
EBIT as reported 64 271 440 432 389 655 842 1,129 1,586 862
% of revenue 1.6% 5.1% 6.4% 5.1% 3.6% 4.4% 4.4% 4.6% 4.6% 1.8% 4.2%
Add back growth:
Advertising / other promotional costs (1/3) 38 36 47 56 75 102 140 198 297 467
% of revenue 1.0% 0.7% 0.7% 0.7% 0.7% 0.7% 0.7% 0.8% 0.9% 1.0% 0.8%
Tech / content (1/3) 72 69 84 150 221 273 344 413 578 970
% of revenue 1.8% 1.3% 1.2% 1.8% 2.1% 1.8% 1.8% 1.7% 1.7% 2.0% 1.7%
Total growth investment 110 106 131 206 296 375 484 611 875 1,436
% of revenue 2.8% 2.0% 1.9% 2.4% 2.8% 2.5% 2.5% 2.5% 2.5% 3.0% 2.5%
EBIT as adjusted 174 376 571 638 685 1,030 1,326 1,740 2,461 2,298
% of revenue 4.4% 7.1% 8.3% 7.5% 6.4% 6.9% 6.9% 7.1% 7.2% 4.8% 6.7%
Plus: Other operating expense (income) 47 3 (8) 47 10 9 (24) 102 106 154
Normalized EBIT 221 379 563 685 695 1,039 1,302 1,842 2,567 2,452
% of revenue 5.6% 7.2% 8.1% 8.1% 6.5% 7.0% 6.8% 7.5% 7.5% 5.1% 6.9%
Implied maintenance:
Advertising / other promotional costs 76 73 94 112 151 204 280 395 593 933
% of revenue 1.9% 1.4% 1.4% 1.3% 1.4% 1.4% 1.5% 1.6% 1.7% 1.9% 1.6%
Technology and content 144 139 167 301 441 545 689 827 1,156 1,939
% of revenue 3.7% 2.6% 2.4% 3.5% 4.1% 3.7% 3.6% 3.4% 3.4% 4.0% 3.4%
36
Sanity check
• There are several ways to sanity check our conclusion: – Total growth expenditures over the past decade averaged
a not-unduly-large 2.5% of revenue
– In our calculation, maintenance AOPC averaged 1.6% of revenue, which is similar to the advertising budgets of physical retailers
– In our calculation, maintenance technology and content averaged 3.4% of revenue, which is significantly more than the IT budgets of most physical retailers (~2%)
– In 2004, AMZN earned a 6.4% GAAP EBIT margin, which is direct evidence the business can be run with higher-than-recent margins
37
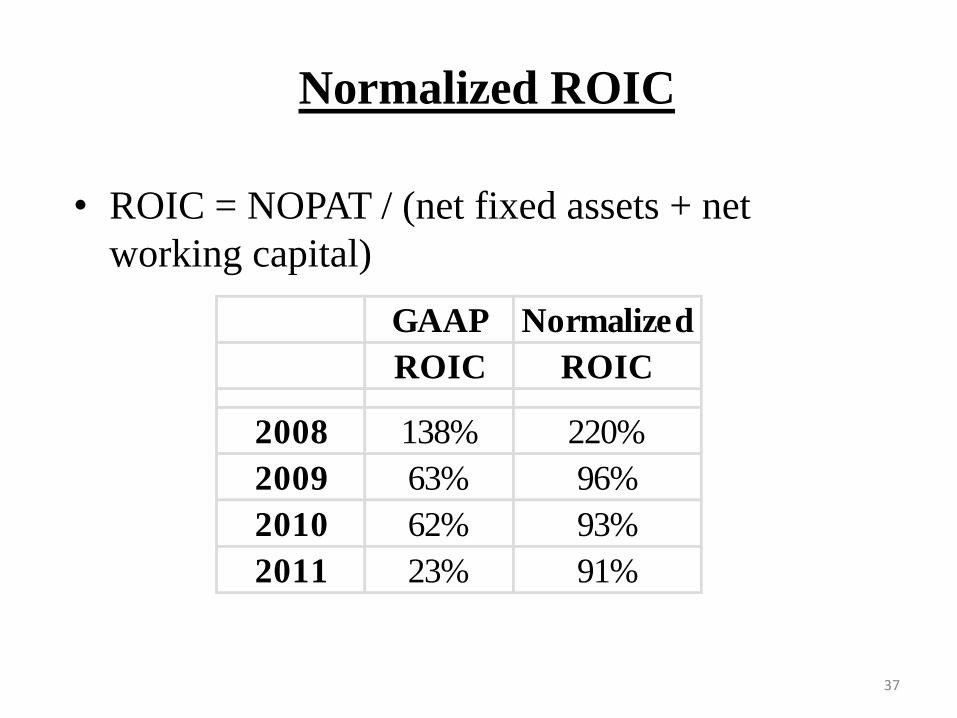
Normalized ROIC
• ROIC = NOPAT / (net fixed assets + net
working capital)
GAAP Normalized
ROIC ROIC
2008 138% 220%
2009 63% 96%
2010 62% 93%
2011 23% 91%
38
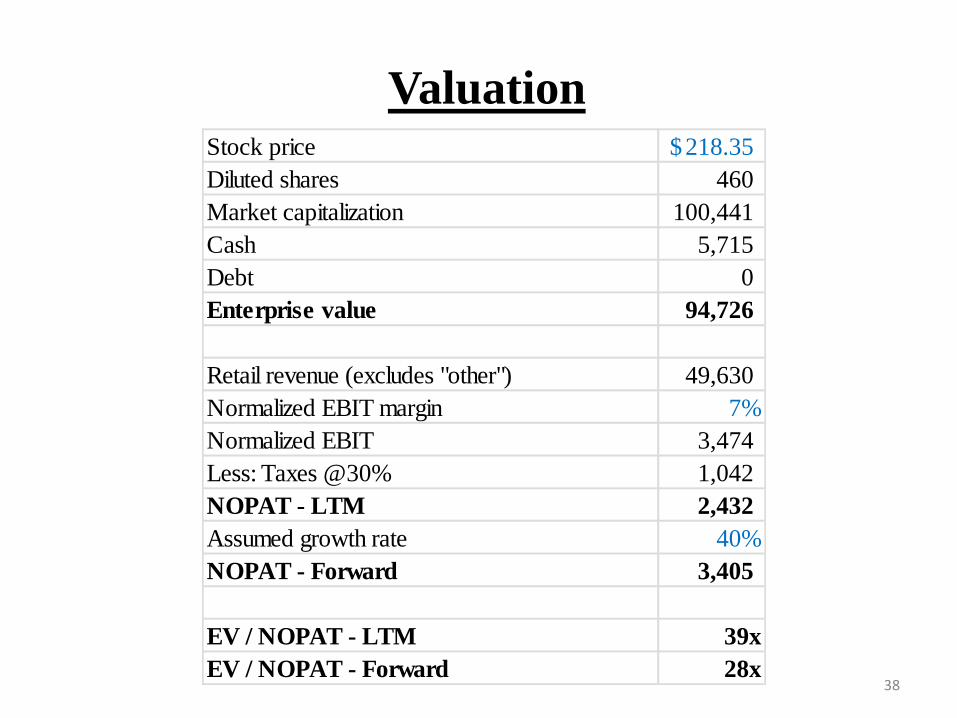
Valuation Stock price 218.35$
Diluted shares 460
Market capitalization 100,441
Cash 5,715
Debt 0
Enterprise value 94,726
Retail revenue (excludes "other") 49,630
Normalized EBIT margin 7%
Normalized EBIT 3,474
Less: Taxes @30% 1,042
NOPAT - LTM 2,432
Assumed growth rate 40%
NOPAT - Forward 3,405
EV / NOPAT - LTM 39x
EV / NOPAT - Forward 28x
39
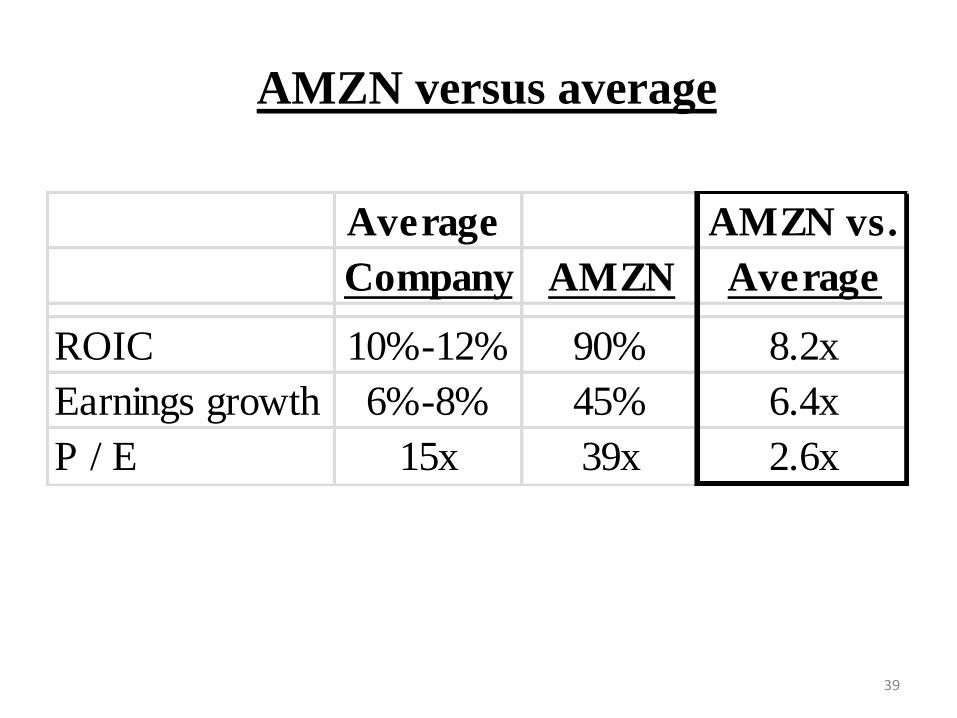
AMZN versus average
Average AMZN vs.
Company AMZN Average
ROIC 10%-12% 90% 8.2x
Earnings growth 6%-8% 45% 6.4x
P / E 15x 39x 2.6x
40
Prospective stock CAGR
• AMZN’s prospective stock CAGR is similar
to its prospective revenue CAGR
– Normalized EBIT margin is likely to expand from
7% (AMZN believes it can reach double-digits)
– P / FCF multiple may contract
– These two factors could roughly cancel out
• Therefore, I believe AMZN stock could return
~30% over the next decade
• This ignores excess cash generation
41
Why Now?
• AMZN trades at the low end of the historical
range of 35x-65x trailing normalized NOPAT
• The market is penalizing AMZN for depressed
margins (i.e., aggressive investment spending)
– 2011 GAAP operating margin of 1.8% was the
lowest in nearly a decade
• Aggressive investment indicates that AMZN
sees opportunity….