PRELIMINARY DRAFT PLEASE DO NOT CITE WITHOUT PERMISSION Valuing and Hedging Defined Benefit Pension Obligations – The Role of Stocks Revisited Deborah Lucas Northwestern University and NBER and Stephen P. Zeldes Graduate School of Business, Columbia University; and NBER First Draft: November 2005 This Draft: September 2006 We are indebted to Randy Goldstein for research assistance, and to Zvi Bodie, John Heaton, Wendy Kiska, Robert McDonald, George Pennacchi, Marvin Phaup, Joshua Rauh, and Suresh Sundaresan for insights and help on various aspects of this project. We also thank seminar participants at NYU, Stanford, Berkeley, the University of Maryland, the 2006 CSEF-IGIER Symposium, and the 2006 MMF conference at York for their comments. All errors are our own.
Transcript
PRELIMINARY DRAFTPLEASE DO NOT CITE WITHOUT PERMISSION
Valuing and Hedging Defined Benefit Pension Obligations – The Role of Stocks Revisited
Deborah LucasNorthwestern University and NBER
and
Stephen P. ZeldesGraduate School of Business, Columbia University; and NBER
First Draft: November 2005This Draft: September 2006
We are indebted to Randy Goldstein for research assistance, and to Zvi Bodie, John Heaton,Wendy Kiska, Robert McDonald, George Pennacchi, Marvin Phaup, Joshua Rauh, and SureshSundaresan for insights and help on various aspects of this project. We also thank seminarparticipants at NYU, Stanford, Berkeley, the University of Maryland, the 2006 CSEF-IGIERSymposium, and the 2006 MMF conference at York for their comments. All errors are our own.
1 The number of single- and multi-employer plans declined from more than 73,000 in 1992 to about 31,000 in 2003,with most of the decline occurring among smaller plans with fewer than 1000 participants. This decline has beenaccompanied by a marked increase in defined contribution plans, which now comprise the majority of privatepension assets and are the dominant choice among smaller and younger firms that offer pension benefits.
2 Black (1989) suggests a role for stocks, but does not quantify the effect.
3 Sundaresan and Zapatero (1997) also takes a derivatives pricing approach, but assumes a constant correlationstructure.
1
1. Introduction
Despite a significant decline in the prevalence of defined benefit (DB) pension plans
relative to defined contribution (DC) plans in the U.S. over the last twenty-five years, DB plans
remain an important part of the pension landscape. There are currently about 31,000 single and
multi-employer DB pension plans that together cover about 44 million U.S. workers and
retirees.1 Aggregate DB pension assets currently total about $ 2 trillion.
A series of recent events has generated renewed academic and policy interest in the DB
pension system. A spike up in bankruptcies of large sponsors with severely under-funded plans
(e.g., United Airlines, U.S Air, and Bethlehem Steel) caused the transfer of billions of dollars of
pension liabilities to the Pension Benefit Guarantee Corporation (PBGC), the Federal agency
that insures DB pension plans. This in turn has led to new legislation intended to contain the risk
to taxpayers by tightening funding rules. Partly in anticipation of such rule changes, a growing
number of apparently healthy companies (e.g., IBM and Alcoa) have announced a partial or full
freeze of their DB plans. At the same time, FASB continues to debate whether the provisions of
FAS 87, which govern how pensions are accounted for in financial statements, should be
modified. Also looming in the background is the broader question of the best way to structure
the private pension system and coordinate it with changes to Social Security.
This paper revisits two basic questions that are critical for understanding and controlling
DB pension risk: How should the value of DB pension liabilities be computed; and how should
pension assets be allocated? In particular, we reexamine the role of stocks in valuing and
hedging pension obligations.2 Our approach differs from others in the literature in at least two
ways. First, it is one of the few that focuses on market value, and does so by using a derivative
pricing approach.3 Second, it is novel in incorporating new evidence on the time-varying
correlation between labor earnings growth and asset returns.
A DB pension is deferred compensation that takes the form of a retirement annuity, with
4 Other firm cash flows do matter indirectly, as the assumed probability of firm bankruptcy affects liability value,which we measure from the perspective of the firm.
2
payments linked by formula to the number of years of employment and earnings in the final
year(s) of employment. Although the short-run correlation between earnings growth and stock
returns is negligible, economic theory suggests that there should be a long-run positive
correlation between labor earnings and stock returns, and there is some recent empirical
evidence supporting this (see, e.g. Benzoni et. al. 2006). We posit a model of the joint process
for earnings and stock returns that takes this long-run relationship into account. The derivatives
pricing model, which is used to value pension liabilities and characterize the hedge portfolio,
incorporates the assumption that the priced component of employee earnings risk is driven by
the same factor as stock returns. Risk-neutral derivative pricing methods are then used to value
the pension obligation as a contingent claim on the stock market. Determining the value of
various liability measures requires assumptions about the stochastic processes for labor earnings,
job separations, and stock returns. Particularly important is the correlation over different
horizons between employee earnings growth and stock returns. Sensitivity analysis illustrates
the effects of different assumptions about this correlation.
The model can be used to value a variety of liability measures, ranging from the
narrowest (accrued benefit obligation or ABO) that is based on current years of employment and
earnings to date for each former and current worker, to the broadest that is based on projected
future years of employment and earnings for all former, current, and future workers. We focus,
however, on two intermediate measures that are based on projected future earnings (projected
benefit obligation or PBO) and projected future earnings and years of employment (broad PBO)
for former and current workers only. The former is consistent with the current accounting
definition of the PBO used in financial statements, whereas the latter seems most relevant to
managing the current and future obligations associated with the current workforce. Our approach
treats the pension cash flows in isolation, for the most part ignoring other cash flows of the firm.4
In effect, we are asking what the market value of pension liabilities would be if they were traded
as stand-alone entities.
In addition to computing the present value of the pension obligation, we compute the
internal rate of return, i.e., the average discount rate consistent with the present value of pension
liabilities. Representing the valuation rule in terms of a discount rate is useful for evaluating the
5 For simplicity, we assume that both employee separations and aggregate mortality are uncorrelated with the stockmarket and that these risks have zero price in financial markets.
6 In addition, the tax exemption for income earned on plan assets should provide an incentive for firms to investpension assets in bonds (Black, 1980). For other arguments in favor of pension funds holding a 100% bondportfolio, see, for example, Gold and Hudson (2003) and Wilcox (2006). The most notable example of a companythat followed this advice is the U.K. pharmaceutical firm Boots, which shifted completely out of equities in 2001(they partially shifted back in 2005); see Jolliffe (2005) and Ralfe (2005).
3
biases that arise from statutorily set discount rates, which determine the liabilities reported in
financial statements and minimum regulatory funding levels.
Our valuation model implies a corresponding hedge portfolio that answers the question
of what the firm would invest in if it wanted to hedge the market risk of its pension liabilities.
This hedge portfolio has a number of interesting characteristics. First, in light of the long-run
relation between stock returns and earnings, we find that stocks are a part of this portfolio, and in
some cases an important part. Second, we show how the share of stocks in this hedge portfolio
changes over time with firm and worker characteristics such as the probability of bankruptcy,
worker separation, and mortality.5 A large share of the hedge portfolio for young active workers
is invested in stocks, with the share in stocks declining as employees age.
We then consider the broader question of the optimal dynamic asset allocation for a
firm’s DB pension assets, and how it relates to the hedge portfolio for valuation that we focus
on? Answering this question in general is difficult.. First, there are obviously many other
factors that enter the asset allocation decision in addition to the hedging demand, including
taxes, PBGC insurance and the moral hazard that could result, IRS, ERISA and FASB
regulations, corporate liquidity needs, and labor contracting considerations. Second, even if the
optimal policy is to hedge the pension obligation, there is still the question of which measure of
pension obligations should be hedged? In a future draft, we hope to suggest a plausible objective
function consistent with using the hedge portfolio for valuation as the basis for investment
policy.
Bodie (1990, 2006) and others have argued in favor of hedging the current accrued
benefit obligation (ABO). They conclude that pension plans should invest 100 percent in bonds
that match, exactly or in duration, the cash flows represented by the current ABO.6 By contrast,
our analysis suggests that the dynamic nature of the obligation in many instances requires taking
into account not just the current ABO, but obligations associated with expected future accruals
as well. We show that stocks typically comprise a portion of the hedge portfolio for the PBO
4
liability, even taking into account that future wages may be reduced by the value of current
pension accruals, as suggested by Bulow (1982).
In the final part of the paper, we examine survey data on actual asset allocations by large
pension plans. The model provides testable predictions about how pension plan portfolios would
vary with differences in firm and worker characteristics if the investment goal of management is
to hedge stand-alone pension liabilities. We ask 1) whether our model can explain the large
average allocation to stocks found in the data (over 60% of aggregate DB pension assets are
invested in stocks) and 2) whether the data are consistent with the cross sectional implication
that firms with a greater percentage of active workers invest more heavily in stocks. We find
that for companies with relatively few retirees and separated workers, the observed investment
practice appears roughly consistent with a hedging strategy. For the many firms with a high
proportion of retirees and separated workers, however, a hedge portfolio would be invested
almost entirely in bonds, a prediction sharply at odds with observed behavior. Thus, while we
disagree with the recommendation that firms shift pension assets completely to bonds, our
results imply that for many firms, a hedging demand is unlikely to explain the propensity to
invest the bulk of assets in stocks.
The remainder of the paper is organized as follows: The valuation model is developed in
Section 2. Section 3 describes the corresponding hedging strategy, and shows how it varies with
firm and worker characteristics. We also compute the constant discount rate at which the present
discounted value of the liabilities equals the market price. To illustrate the results, we focus on
the example of a single firm: Alcoa. Section 4 discusses the broader issue of when the hedge
portfolio used in pricing pension obligations is also the optimal asset allocation for a firm’s
pension plan. Section 5 presents our empirical results on the relationship between pension asset
allocation and employee demographics. Section 6 concludes with a discussion of the
implications for policy and extensions for future research.
2. Valuation Model
In this section, we develop a model for valuing pension obligations, based on the market
risk reflected in pension benefits.
7 In practice benefits can be more complex, with special provisions for early retirement, inflation indexation, andspousal survivorship. Firms may also voluntarily increase benefits, although that practice appears less common thanin the past. None of these features, whose first order effect would be to increase the present value of benefits atretirement, are explicitly considered here.
5
2.1 Measures of liabilities
A participant in a typical defined benefit pension plan is entitled to a life annuity with a
level payment each year, generally starting at age 65.7 The annual payment is set according to a
formula such as:
(1)iTiTiR WNkb ⋅⋅=
where biR equals the annual benefits throughout retirement, k is a fixed percentage (e.g. 2%), T is
the year preceding separation, retirement, or plan freezing, NiT is the number of years worked
through T, and WiT equals the worker’s wage earnings in year T. Thus, the benefits replace a
percentage of the workers final earnings, with the replacement rate increasing linearly with years
of service. In the event of separation prior to retirement, the future benefit is a function of
earnings in the year prior to separation.
A variety of liability measures are used in practice for a variety of purposes, including
financial reporting, determining minimum funding levels, and determining maximum tax
preferred funding levels. These measures differ in how comprehensively the obligation is
defined. We consider four possible definitions of claims, ranging from narrowest to broadest.
The narrowest of these measures holds constant at current levels both the number of years of
8 Throughout we use “retired workers” as shorthand for “retired workers and beneficiaries,” since many plans extendbenefits to surviving spouses and minor dependents.
9 The PBGC insures benefits up to a legally mandated maximum amount.
6
service and wage earnings, and sums these benefits across all current and retired 8 workers. The
present value of the future stream of these benefits is referred to as the ABO. The second
measure holds constant years of service, but is based on wage earnings at the separation date.
The third (whose present value we refer to as the “broad PBO”), is based on both on years of
service and wage earnings at the time of separation. Even broad PBO does not provide an all-
inclusive measure of pension liability, however, as it takes into account future separations by
current workers, but not the effect of new hires. Our broadest measure also takes into account
future hiring decisions by summing benefits (based on the future years of service and future
wage earnings) across both current and future workers at the firm. We refer to the present value
of this measure as “all-inclusive PBO.”
What constitutes the relevant liability measure depends on the question being asked. The
ABO represents a legal obligation of the firm that can be avoided only by bankruptcy. From the
perspective of the worker, the ABO is largely a safe asset due to PBGC insurance.9 FAS 87
requires that firms use the PBO measure to compute the effect of changes in pension liabilities
on reported earnings. From the perspective of a manager wishing to assess the future expense
associated with the current workforce, however, the PBO understates liabilities because it does
not take into account increases due to predictable future “service cost” increases – increases in
ultimate benefits based on the number of years with the company. The all-inclusive PBO may
be relevant to managers wishing to assess the comprehensive cost of DB obligations.
Each of these four sets of claims can be valued. From the perspective of the firm, the
value at any date will depend on known variables such as years of service and current earnings,
as well as on the joint probability distribution for future earnings, job tenure, worker lifespan,
bankruptcy and stock returns. In this version of the paper, we focus primarily on the broad PBO
measure, but similar considerations apply to the other measures, which we plan to consider in
more detail in future drafts.
7
2.2 Contract Value at Retirement
We define BR as the present value of benefits as of the retirement age R, conditional on
the firm having avoided bankruptcy and the worker staying alive until that time (for notational
simplicity, we drop the individual i subscript).Assuming a constant discount rate, we can
compute BR by multiplying annual benefits in each year by the corresponding probability of
survivorship and then discounting back to the retirement age at rate r. Thus,
(2)RRjr
RjjR beqB )( −−∞
=∑=
where bR is the annual benefit defined in equation (1), qj is the probability of living to age j,
conditional on having lived to age R, and r is the discount rate.
The liabilities for retired and separated workers are essentially fixed income obligations,
and can be valued and hedged as such. In the absence of firm bankruptcy risk, the appropriate
discount rate, r, for equation (2) is the riskless rate of interest. With bankruptcy risk, the
discount rate should be similar to the yield on other long-term liabilities, e.g., the rate on the
firm’s long-term debt. The liabilities for retired and separated workers can be hedged with
maturity matched bonds, or delta hedged.
For current workers, BR is a random variable that depends on future realizations of wages,
separations, etc. Valuing that random variable requires a model relating future wage earnings to
priced factors in the capital market.
2.3 Earnings and asset returns
The specification governing the joint distribution of future wage earnings growth and
stock returns is critical to the role of stocks in pricing and hedging pension obligations. In this
section, we specify a stochastic process that links labor earnings to the value of the stock market
over the long run, but allows for deviations in the short run. The specification chosen is
motivated by a number of empirical observations and economic considerations, and also by the
need for tractability.
Our specification is consistent with several key empirical observations. First, the annual
correlation between aggregate wage growth and stock returns is small (e.g., Goetzman, 2005).
Second, the volatility of the growth rate of labor earnings is far less than the volatility of stock
10 For a dissenting view, see Lustig and van Nieuwerburgh (2006).
8
returns. Finally, there is some evidence that labor earnings and stock prices are positively related
in the long run (see, for example, Cardinale, 2004, and the references therein). Benzoni, Colin-
Defresne, and Goldstein (2006) assume a positive long run correlation of wages and stock prices,
and present some summary evidence supporting their assumption.10 In addition, there is a
growing literature suggesting that there is time-variation in the correlation between consumption
growth and dividend growth, and accumulating evidence that long-run growth between these
series is much more closely linked than short-term growth (e.g., Bansal and Yaron (2004),
Hansen, Heaton and Li (2005), and Julliard and Parker (2005)). The observation that earnings
and consumption also are highly correlated over medium and long horizons provides additional
support for our assumption of a positive long-run correlation between labor earnings and the
stock market.
In order to employ a standard risk neutral pricing framework, it is convenient to model
stock returns as a discretized lognormal diffusion process, and to induce cointegration through
the specification of the earnings process. The aggregate value of stock evolves according to:
( )2exp ( .5 ) ( )t h t s s s sS S r div h h dzσ σ+ = − − + (3)
where dzs is a draw from a standard normal distribution. The expected return on stocks is rs, the
dividend yield is div, and the standard deviation is σs. The time step is h, taken in the calibrations
below to be one year.
The process for earnings captures the properties of low short run correlation between
earnings growth and stock returns but higher long-term correlation, and earnings growth that is
much smoother than stock returns. To motivate the earnings process, we assume that human
capital is also a log-normal diffusion, where dzw is its (non-priced or idiosyncratic) risk, and α is
its average drift. Human capital slowly adjusts towards the long-run human capital to stock
ratio, T*, at an annual rate of γ. The stock of human capital is reduced by earnings at time t, Wt,
which is analogous to a dividend. Specifically, the aggregate value of human capital evolves
according to:
9
( )2exp ( .5 ) ( ) * tt h t w w w t t
t
HH H h h dz h T S WS
α σ σ γ+
⎛ ⎞= − + + − −⎜ ⎟
⎝ ⎠ (4)
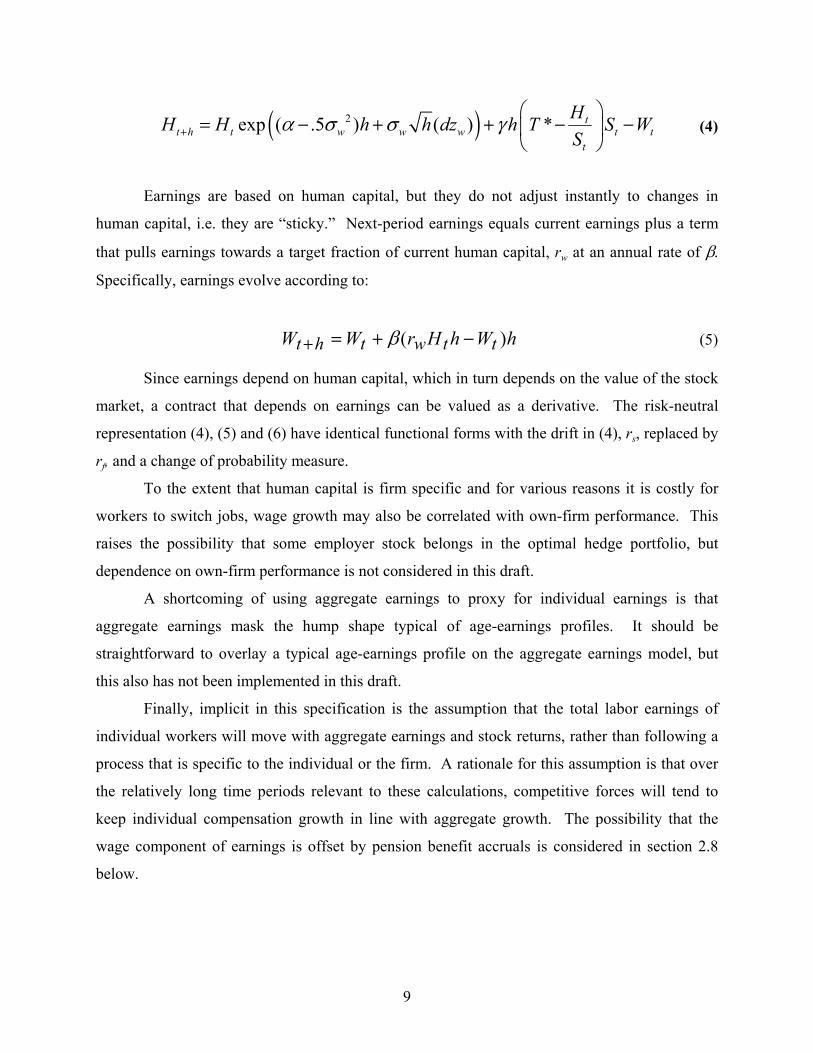
Earnings are based on human capital, but they do not adjust instantly to changes in
human capital, i.e. they are “sticky.” Next-period earnings equals current earnings plus a term
that pulls earnings towards a target fraction of current human capital, rw at an annual rate of β.
Specifically, earnings evolve according to:
(5)hWhHrWW ttwtht )( −+=+ β
Since earnings depend on human capital, which in turn depends on the value of the stock
market, a contract that depends on earnings can be valued as a derivative. The risk-neutral
representation (4), (5) and (6) have identical functional forms with the drift in (4), rs, replaced by
rf, and a change of probability measure.
To the extent that human capital is firm specific and for various reasons it is costly for
workers to switch jobs, wage growth may also be correlated with own-firm performance. This
raises the possibility that some employer stock belongs in the optimal hedge portfolio, but
dependence on own-firm performance is not considered in this draft.
A shortcoming of using aggregate earnings to proxy for individual earnings is that
aggregate earnings mask the hump shape typical of age-earnings profiles. It should be
straightforward to overlay a typical age-earnings profile on the aggregate earnings model, but
this also has not been implemented in this draft.
Finally, implicit in this specification is the assumption that the total labor earnings of
individual workers will move with aggregate earnings and stock returns, rather than following a
process that is specific to the individual or the firm. A rationale for this assumption is that over
the relatively long time periods relevant to these calculations, competitive forces will tend to
keep individual compensation growth in line with aggregate growth. The possibility that the
wage component of earnings is offset by pension benefit accruals is considered in section 2.8
below.
11 CBO (2005) uses a related options pricing framework to value pension guarantees, but under the assumption thatpension liabilities are bond-like.
10
2.4 Mortality, separation, and bankruptcy
Equations (3) - (5) describe the path of future earnings of a typical worker, which
terminate (from the perspective of the firm or pension insurer) in the event of death, voluntary or
involuntary separation (including retirement), or firm bankruptcy. In the calibrations, triggers for
these termination events are chosen to reproduce typical outcomes for U.S. workers and firms, as
described below. In applying the model to specific firms, the parameters could be adjusted to
match its characteristics. For instance, the expected bankruptcy rate and typical worker tenure
vary considerably across firms.
In the calibrations, the annual separation rate varies with a worker’s age, and retirement
is imposed uniformly at age 65. The annual mortality rate also is based on historical data. The
bankruptcy rate is held constant, effectively increasing the rate at which the firm discounts
projected liabilities. If the model were used to value liabilities form the perspective of the
pension insurer, the bankruptcy rate would of course increase the value of liabilities rather than
decrease it.11
The assumption that mortality, separation and bankruptcy risk are orthogonal to priced
risks is made for convenience, and because we do not have reliable estimates of the strength of
such correlations. It is likely, however, that separation and bankruptcy rates increase in market
downturns. That would increase the correlation between future liabilities and the market. Hence
it would increase the rate at which future liabilities are discounted and the share of stock in the
corresponding hedge portfolio.
2.5 Algorithm for computing liability value and hedge portfolio
We value the liabilities by projection onto the space of traded assets as represented by the
stock market; the component of liability risk orthogonal to the market is assumed to have zero
price. A standard risk neutral derivatives pricing framework and Monte Carlo simulation are
used to compute the present value of benefits for a given worker, as a function of the worker’s
age, current labor earnings, and current years of tenure with the firm. The values of the stock
market and the human capital stock are initialized at the target ratio of the two variables. A
firm’s total pension liabilities are calculated by summing individual liabilities across all current
12 See McDonald (2006) for a clear explanation of risk-neutral pricing.
11
and past workers.
We perform the Monte Carlo simulations of labor earnings and stock price histories as
follows. Each year, random draws from a normal distribution determine the innovations to stocks
under the risk-neutral and actual representations, human capital, and earnings. Further draws
from a uniform distribution determine whether the worker separates from the firm or dies. In the
event of death, the present value of the benefit along that path is zero. In the event of a
separation (or ultimately, separation due to retirement), current earnings are multiplied by the
current replacement rate and the annuity factor to calculate the future value of benefits at
retirement. The future value is discounted to the present at the risk free rate; the price of risk is
implicitly incorporated by the risk-neutral representation of the evolution of stock value.12 The
present value reported is the average under the risk-neutral measure across Monte Carlo
simulations.
The corresponding hedge portfolio implied by the model is dynamic. To find the share of
stocks in the hedge portfolio in the initial year, we compute the δ: the sensitivity of the present
value of benefits to a change in the initial stock price. This is accomplished with a parallel
Monte Carlo simulation that uses identical shocks. Under the assumption that the firm sets aside
the present value of the liability, investing a share in the stock market equal to δ equates the
sensitivity of the hedge portfolio and the sensitivity of the liability to a change in the stock price.
When the value of pension assets, A, is not equal to that of liabilities, L, the hedge
portfolio must also be adjusted.. In general this is accomplished by using the idea of a hedge
ratio, where the share of stock in the hedge portfolio is found by setting the delta of the assets, δA
equal to δLL/A.
2.6 Computing an average discount rate
Standard measures of pension obligations rely on a fixed discount rate (or set of fixed
rates reflecting the term structure). Our analysis demonstrates that the assumption of fixed rates
is theoretically incorrect. Because the risk of liabilities varies over time, and with
macroeconomic, firm, and worker characteristics, so does the appropriate discount rate. It is this
time-varying feature that makes a derivatives pricing approach a more reliable valuation
12
technique than a simple discounting method.
Nevertheless, to gauge the size of the error from ignoring risk-adjustment using an
interest rate metric, we solve for the discount rate such that the expected future value generated
by the model under the true probability measure is equal to the present value implied by the
model. That is, identical cash flows are valued using the derivative pricing model, and assuming
a fixed discount rate. The fixed discount rate that yields the same present value of liabilities as
the derivatives pricing model is reported in Section 3 below.
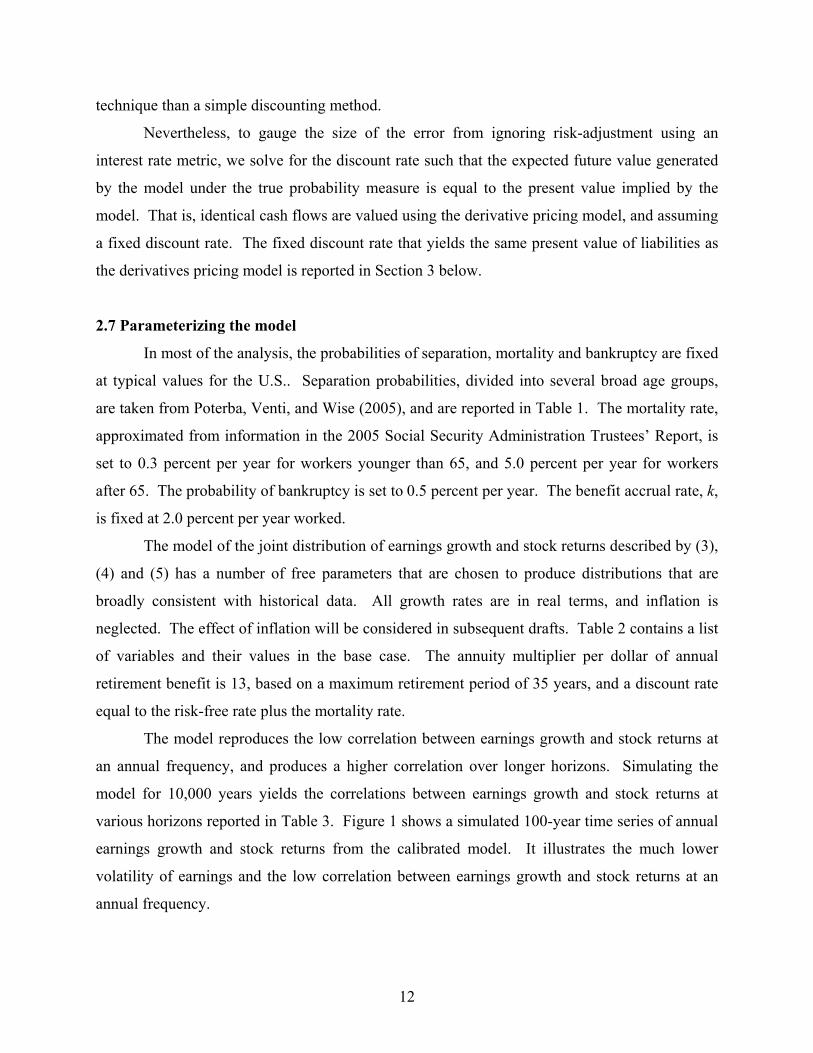
2.7 Parameterizing the model
In most of the analysis, the probabilities of separation, mortality and bankruptcy are fixed
at typical values for the U.S.. Separation probabilities, divided into several broad age groups,
are taken from Poterba, Venti, and Wise (2005), and are reported in Table 1. The mortality rate,
approximated from information in the 2005 Social Security Administration Trustees’ Report, is
set to 0.3 percent per year for workers younger than 65, and 5.0 percent per year for workers
after 65. The probability of bankruptcy is set to 0.5 percent per year. The benefit accrual rate, k,
is fixed at 2.0 percent per year worked.
The model of the joint distribution of earnings growth and stock returns described by (3),
(4) and (5) has a number of free parameters that are chosen to produce distributions that are
broadly consistent with historical data. All growth rates are in real terms, and inflation is
neglected. The effect of inflation will be considered in subsequent drafts. Table 2 contains a list
of variables and their values in the base case. The annuity multiplier per dollar of annual
retirement benefit is 13, based on a maximum retirement period of 35 years, and a discount rate
equal to the risk-free rate plus the mortality rate.
The model reproduces the low correlation between earnings growth and stock returns at
an annual frequency, and produces a higher correlation over longer horizons. Simulating the
model for 10,000 years yields the correlations between earnings growth and stock returns at
various horizons reported in Table 3. Figure 1 shows a simulated 100-year time series of annual
earnings growth and stock returns from the calibrated model. It illustrates the much lower
volatility of earnings and the low correlation between earnings growth and stock returns at an
annual frequency.
13 To the extent that pensions represent deferred compensation, however, the offset will only be partial.
13
2.8 Incorporating the effect of pension accruals on wage earnings.
So far, we have not distinguished between wage earnings and total labor compensation,
which include wages but also the value of benefits such as pension accruals and health insurance.
Bulow (1982) observes that in a competitive labor market, total compensation will equal the
marginal product of labor each period. He argues that for companies with DB pension plans, the
sum of current wages and current ABO pension accruals should equal the marginal product of
labor. Hence, all else equal, a worker’s pension accrual is offset by a reduction in wage
income.13 A question that arises is how Bulow’s proposition affects the role of stocks in valuing
and hedging DB liabilities. The idea that pension accruals reduce contemporaneous wages and
that total compensation is the marginal product of labor can be incorporated into the more
complicated model described by equations (3) – (5). Taking the offset into account simply
requires reinterpreting Wt in equations (4) and (5) as total compensation, and then separately
tracking the accrual and wage components of compensation over time. Simulations confirm that
the long-run correlation between total compensation and the return on capital implies that
pension accruals and the return on capital are positively correlated. That is, even under the
assumption that there is a one-for-one offset between wage compensation and pension accruals
at a point in time, the common shock to capital and labor compensation induces a positive
relation between the change in the pension liability and the change in the stock price, implying
that stocks still are a relevant to pricing, and comprise a share of the hedge portfolio. Simulation
results demonstrating this will be included in a future draft.
3. Results on valuation and discounting
We present quantitative results for valuation and the discount rate based on the example
of Alcoa. To preview the main findings, simulations reveal that for young active workers, stocks
comprise a large share of the optimal hedge portfolio. The optimal hedge portfolio is dynamic,
with the share of stocks decreasing in age. Separation triggers portfolio rebalancing, with stocks
sold and replaced by bonds.
14
3.1 Valuation: example of Alcoa
Data from the large aluminum manufacturer, Alcoa, provides a quantitative example of
the valuation and investment policy implied by the model. Firms with DB plans report
information on the earnings, age, and current tenure of employees on an attachment to Form
5500. Alcoa has multiple plans covering different groups of employees. The data used is in this
example is from Plan 1 for the year 2000, which covers 6,178 relatively highly paid workers.
Statistics are reported in 4-year windows for age and tenure; the midpoints are used in the
estimates. Table A1 shows the present value of liabilities under the “broad PBO” measure, and
the corresponding share of stocks in the hedge portfolio, for each age/tenure category in the data.
Under the base case parameters, the share of stock for active workers ranges from 86 percent for
young workers with short tenures, to 8 percent for workers aged 62 with tenure ranging from 12
to 37 years. The value of future pension benefits range from less than two times current salary
for young workers with short tenures, to almost 10 times current salary for long-time workers
near retirement age.
The Pensions and Investments database on pension asset allocation (described in the next
section) indicates that Alcoa had an overall allocation of 52 percent in stocks (44 percent
domestic, 4 percent in international equity, and 4 percent in private equity) in 2000. How does
this compare with model predictions? To answer this, requires separate consideration of active
participants, and retirees, separated workers, and dependents.
A value weighted average for the active participants in Plan 1 yields a stock share of 57
percent if the plan were fully funded. This provides an approximate upper bound on the share of
stock attributable to a broad-PBO-linked hedging motive, as liabilities for separated and retired
workers would be hedged with fixed income securities. It is only approximate, however,
because the demographic characteristics in other plans may differ from Plan 1, and because
pension assets may not equal the target measure of liabilities. We do not have data on individual
plan under-funding, but aggregate data for Alcoa indicates that the company is 18 percent under-
funded in 2003 relative to the narrow PBO measure reported. Using a hedge ratio to scale up the
allocation to stock to reflect this under-funding would increase the upper bound to 57/.82 = 69.5
percent.
To take into account the effect of separated and retired workers on asset allocation,
several approximations are necessary. Data on the number of active, retired, and separated
15
workers and dependents receiving benefits is available for 2003 for all Alcoa plans combined.
The company reports 22,500 active participants, 34,500 retirees, 14,000 separated workers and
9,600 beneficiaries of retired workers, for a total of 80,700 participants. If the ratio of active
workers to total workers is the same for Plan 1 as for the firm overall two years later, then active
participants represent approximately 28 percent plan participants. To impute the effect of
separated and retired workers and their dependents, it is necessary to estimate the portion of
liabilities attributable to this group. To get a ballpark estimate, we assume that separated
workers left the firm on average 10 years ago with 10 years remaining until retirement, with
average earnings equal to average current earnings discounted at 3 percent per year, and with a
replacement rate of 20 percent. Surviving beneficiaries are treated similarly. Retirees are
assumed to have left the firm on average 7 years ago, and retired with earnings equal to average
current earnings discounted at 3 percent, and with a replacement rate of 30 percent. Under these
assumptions, obligations to current workers account for just less than 16 percent of liabilities,
implying that no more than .16(57) to .16(69.5) = 9.1 to 11 percent of stocks could be accounted
for by a simple hedging demand.
This example shows that for firms like Alcoa with many more retirees and separated
workers than active participants, a hedging demand cannot justify the typical allocation of over
50 percent of pension assets to stocks. For firms with a higher percentage of active participants,
however, a significant allocation to stocks is perhaps justifiable.
For active participants, the share of stocks in the hedge portfolio is sensitive to the
parameterization, and especially to the rate, γ, at which human capital growth pulls toward its
target ratio with the stock market. In the base case, to keep the correlation between stock returns
and earnings growth moderate in the medium term, γ is set to 0.1. Increasing γ to 0.2 increases
the share of stock in the hedge portfolio considerably. The last two columns in Table A1 show
the results for the various cohorts of Alcoa workers assuming this higher rate of convergence
between human and physical capital. For active participants the weighted average share of
stocks increases from 57 percent in the base case to 74 percent with more rapid convergence.
The weighted average stock weight that includes retirees and separated workers, however,
remains much lower than the observed asset allocation.
16
3.2 Discount rate: example of Alcoa
The example of Alcoa Plan 1 is used to illustrate the range of implied discount rates for
active participants of different ages and tenures, and the relation between discount rates and the
optimal hedge portfolio. Recall that the model uses a real risk-free rate of 2 percent and a mean
stock return of 5 percent. The implied discount rate, which always falls between the expected
return on stocks and bonds, can be described by the share of stock corresponding to that rate.
For instance, under our assumptions a 50 percent stock share corresponds to a discount rate of
3.5 percent. Table A2 reports the implied share of stock in the discount rate for active workers
as a function of age and tenure, as well as the share of stock in the hedge portfolio, and the share
of workers in that cohort remaining with the firm until age 65. The weighted average discount
rate is 2.9 percent, based on a weighted average stock share of 30.8 percent.
For each cohort and overall, the implied discount rate involves a smaller share of stocks
than does the hedge portfolio. The reason is that as long as an employee remains with the firm,
the correlation between earnings growth and stock growth imply a heavy weighting towards
stocks. Upon separation, however, the hedge portfolio is converted entirely to bonds. For
instance, for a 27 year old worker has only a 14 percent chance of retiring with the firm at age
65, and a 52 year old workers has only a 52 percent chance. The discount rate is an unequally
weighted average of rates relevant to periods with high and low allocations to stock in the hedge
portfolio. The averaging underlying the choice of a single discount rate also has the effect of
compressing the range of discount rates relative to the range of stock shares in the hedge
portfolio.
How does the discount rate used by Alcoa compare to the rate implied by the model?
Answering this requires taking into account the effect of retired and separated workers, and
scaling up rates to match market conditions in 2003. Using the share of liabilities estimated
above for retired and separated workers and their dependents of 84 percent, the weighted average
discount rate for Alcoa overall is .16(.035) + (1-.16)(.02) = 2.24 percent, or the equivalent of
placing a weight on stocks of (.16)(.308) = .049 or 4.9 percent. This modest weighting of stocks
in the discount rate is in contrast with the discount rates assumed by Alcoa in computing the
pension liability for their financial statements. Alcoa’s 2001 Annual Report indicates an
expected 9 percent long-term return on plan assets in 2000, presumably based on their pension
asset allocation of 52 percent to stocks and 48 percent to relatively safe assets (primarily bonds,
17
and some real estate). Pension liabilities, as measured by the narrow PBO, are discounted at 7.75
percent. In 2001, long-term Treasury rates were around 5.5 percent. Assuming an expected
return on risky assets of 10 percent, the model implies that liabilities should be discounted at
approximately 5.7 percent (.049(.1) + .951(.055)), more than 2 percent lower than the rate used
by Alcoa for financial reporting.
A conclusion that can be drawn from this analysis is that for companies like Alcoa with a
high proportion of retirees and separated workers, the FASB rule allows firms too much latitude
in selecting the discount rate for reporting liabilities. That is, although the rules require firms to
use an economically correct rate -- one that reflects the rate implicit in the current price of an
annuity contract that would effectively defease the obligation -- common practice is to assume a
significantly higher rate for discounting. pension liabilities
4. Optimal Pension Fund Asset Allocation: Why Hedge and What to Hedge?
For a firm with a DB pension plan, there are two related but distinct decisions to be made
with respect to funding. First, to what extent should the plan be pre-funded? Second, how
should pension assets be allocated across various investment categories? As pointed out in the
introduction, answering these questions is more difficult than determining the hedge portfolio for
valuation. Funding levels are only partially a matter of individual firm choice. Legally, firms
are obligated to meet minimum funding levels based on an ABO measure of liabilities, and
additional contributions when assets are in excess of 120 percent of full funding do not receive
preferential tax treatment.
Nevertheless, firms have considerable discretion over the speed with which they close
funding gaps, and the extent to which funding exceeds the minimum required. In principle a
firm could hold financial assets in excess of legal funding requirements outside of the plan, in
anticipation of obligations that exceed the ABO. The funding and location decision is
complicated by the illiquidity of assets held in pension accounts – effectively firms pay a high
tax to extract funds from over-funded plans. Further, ambiguity about who owns plan assets in
excess of explicit liabilities may discourage over-funding. For instance, Bulow and Scholes
(1983) cite examples of unions successfully blocking firms from using excess funds for
corporate purposes.
18
The usual starting point for a discussion of hedging is to point out that in a frictionless
market, firms have no incentive to hedge contractual obligations, as the total value of claims held
against a firm’s assets is invariant to the allocation of risk. Frictions such as bankruptcy costs,
taxes and asymmetric information must be present for financial structure to matter. In the case
of pensions, tax effects, moral hazard arising from PBGC insurance, gaming of accounting rules,
and managers’ beliefs about the appropriate policy are the most often-cited influences on asset
allocation. Labor contracts, which are the focus of further discussion here, also affect the
incentive to hedge.
To the extent that pensions are part of optimally deferred compensation, there may be
contractual reasons for the firm to hedge and fund broadly defined pension obligations. Imagine,
for instance, that there is a high return on the development of firm specific human capital, but
that performance is not verifiable and so a complete and enforceable contract cannot be written.
If the worker pays for human capital investment, there is the risk that the firm will be able to
expropriate the return later on. If the employer pays, it risks losing its investment if the worker
leaves the firm sooner than expected. Credible deferred compensation has the potential to
mitigate this two-sided risk. It provides workers with a return on their investments in firm-
specific human capital, and an incentive to remain with the firm long enough for the firm to
recoup its investments. The deferral also allows firms to pay less to employees that separate
early, reducing investment losses.
For a DB pension plan to serve this incentive function, it must be possible to prevent
employers from cutting salaries to offset benefit increases, for instance by publishing binding
minimum salary levels for specific job descriptions. If the firm funds and hedges pension
obligations, the credibility of its promises, and hence their ex ante value to workers, is enhanced.
The fund effectively serves as collateral against the partially implicit contract. Further,
competitive pressures are less likely to cause a firm with a funded plan to renege (for instance by
unexpectedly freezing its plan) than if it has to meet its obligations entirely out of current
revenues. The present situation in the auto industry illustrates this phenomenon. U.S.
manufacturers, facing foreign competitors with lower labor costs, lament that unfunded
obligations to retirees (primarily health benefits) have saddled the industry with unsustainably
high costs. Had those obligations been fully funded, it seems likely that they would be paid,
14 Rauh (2006b) uses the same data to investigate the relation between pension investment policy, managerialincentives, and credit quality. For some firms, we supplement the Pensions and Investments data with hand-collected asset allocation data from firm financial disclosures.
19
even as the salaries and benefits of current workers are cut to respond to competitive pressure
going forward.
One way to determine how the hedging demand should influence pension asset
allocation would be to write down a firm’s objective function, and then solve for the optimal
pension funding and asset allocation decisions. Van Binsbergen and Brandt (2006) for example,
posit an objective function for firms that yields a hedging motive for pension asset allocation.
Their analysis, however, does not model the accrual of liabilities, and simply assumes that the
liabilities are bond-like. We plan to pursue the objective function approach in a future draft of
this paper. In the meantime, we have used the share of stocks in the hedge portfolio as a
suggestive proxy for the share that would arise under a more broadly defined optimization
problem.
5. Empirical Evidence
5.1 Aggregate trends in DB assets and liabilities (TBA)
5.2 Firm level data
We obtained data on the investment practices of the 1,000 largest pension plans from
Pensions and Investments (P&I), a private organization that gathers and sells this data and other
pension-related information. P&I administers a survey to large pension plans in which they ask
questions on liabilities, total assets, and asset allocation. We use data from calendar year 2004.
We restrict the sample to public firms with defined benefit plans, thus excluding firms with only
a defined contribution plan and non-public entities such as state governments and unions.14
We match these data on DB pension asset allocation with data from Compustat on
corporate assets and liabilities and pension plan assets and liabilities, and with data from the
Department of Labor’s Form 5500 on the number of active participants, retirees and their
dependents, and separated workers. The approach of Merton (1974) is used to impute firm asset
volatility and the expected return on firm assets, which are also considered as explanatory
15 We thank Wendy Kiska for these estimates.
16 http://pages.stern.nyu.edu/~adamodar/
20
variables.15 Specifically, using Compustat data on the book value and average maturity of firm
liabilities and the market value of equity, and estimates of equity volatility from Damodaran
Online,16 the market value of firm assets and their volatility are estimated. The matched sample
includes 168 firms with pension benefit obligations totaling $900 billion.
Figure 2 summarizes the cross-section of pension asset allocation. Risky assets are the
sum of domestic equities, international equities, private equity, own-firm stock, and other.
Assets included in the low-risk category include domestic and international fixed income,
mortgages, real estate, and cash. An equally weighted average across firms gives an average
allocation to risky assets of 70 percent, with a standard deviation of 11 percent.
5.3 Empirical results on the relationship between demographics and asset allocation
If asset allocation is influenced by a hedging motive, then a testable implication of our
model is that firms with a higher proportion of active workers will have a higher percentage of
pension assets invested in risky assets. In this section, we use the firm data described above to
directly test this implication. In addition, we also examine the importance of several alternative
factors that might influence asset allocation. The first is that moral hazard arising from PBGC
insurance would cause firms with more under-funded plans and riskier firms to shade their
portfolios toward risky assets. The second is that riskier firms cut back on pension asset risk to
avoid having to contribute additional capital. The third, which is consistent with anecdotal
evidence but not with standard theory, is that managers that require a relatively high rate of
return on firm assets are reluctant to make investments that have a lower return, even if on a risk
adjusted basis the return is fair.
Ordinary least squares is used to investigate to what extent the cross-section of
investment policy is correlated with observable characteristics related to the various hypotheses.
First, the share of risky assets is regressed on a constant and the following variables in univariate
regressions.: (1) the ratio of retirees, separated workers and dependents to total plan participants;
(2) under-funding as a percentage of ABO; (3) the estimated volatility of firm assets; (4) firm
21
leverage as measured by book value debt over estimated market value of assets; and (5) the
estimated expected rate of return on firm assets. The results are reported in Table 4.
The findings are consistent with the prediction of the model that firms with more
separated and retired workers invest less in risky assets. Separately, they are also consistent with
the idea that firms with higher expected rates of return on firm assets are less inclined to make
low-risk investments. In a regression that includes both of these variables (not reported here) the
coefficients on both are similar and remain significant, and the adjusted R2 increases to .069.
Consistent with the findings of Rauh (2006b), the variables associated with moral hazard (under-
funding, leverage and asset volatility), do not appear to influence portfolio allocation, either
individually nor in unreported regressions including a combination of independent variables.
6. Conclusions and Policy Implications
This paper develops a framework for estimating a risk-adjusted discount rate for
discounting pension liabilities, and uses it to assess to what extent a hedging demand might
explain the high level of stock holdings in DB pension plans. The analysis demonstrates that the
appropriate discount rate, and also the portfolio allocation to stocks consistent with a hedging
motive, varies significantly with participant demographics. Stocks play a much larger role for
“young firms” -- firms with mostly active workers and relatively few retirees -- than for “old
firms” with many separated and retired workers. Assuming that the results are indicative of the
equity share that firms should hold in pension plan assets, our model can only explain a part of
the large equity holdings observed in the data. It remains an open question, then, as to why firms
hold as much equity as they do.
6.1 Implications for regulated discount and accrual rates
What rate firms should be required to use to discount pension liabilities is a topic of
current interest, as policymakers contemplate imposing tighter funding rules to reduce PBGC’s
exposure, and as FASB revisits its rules for pension accounting. As we have emphasized, the
appropriate discount rate depends on the definition of liabilities, which varies depending on the
application at hand. The various actuarial liability measures used in practice are present values
in the sense that they are calculated by taking expected future cash flows and discounting them
to the present. The discount rate, however, is set by regulation or chosen by the firm for
17 Smoothing is also problematic, but does not create a systematic bias in funding levels. Van Bisbergen and Brandt(2006) point out that smoothing the discount rate make it more difficult to hedge the ABO through asset allocation.
18 A shortcoming of the current liability measure is that it does not take into account the higher costs associated withterminated plans (CBO (2005)).
19 For a clear explanation of these rules and their implications, see Revsine, Collins and Johnson (2005).
22
financial reporting within regulatory limits, and is often not based on financial valuation
principles. Thus in general, these actuarial measures of liabilities are not consistent with market
values.
ERISA funding rules, which control the risk exposure of the PBGC, currently require
firms to use a discount rate based on a smoothed long-term high grade corporate bond yield,
whereas in the past it required discounting at smoothed a long-term Treasury bond rate.17 Plan
sponsors are then required to fund the “current liability,” which is an accrual measure similar to
the ABO. For funding purposes, under- or over-funding is measured by a comparison of current
liabilities to the market value of assets. Since at any point in time the PBGC’s risk exposure is
only to accrued liabilities (plans of bankrupt sponsors are immediately frozen), accrued
liabilities are a reasonable reference point for minimum funding requirements to protect the
PBGC.18 For these known cash flows, however, and from the perspective of the PBGC, the
correct discount rates are current, maturity-matched Treasury rates. The rule that allows
discounting at a low-risk corporate rate implies that under-funding relative to the current liability
is systematically under-reported.
Financial accounting standards require firms to use both the ABO and PBO concepts in
financial statements. Specifically, FAS87 requires firms to base the accrual adjustment to
earnings from pension activity on the PBO, which FASB views as a more accurate and
comprehensive measure of the pension liabilities that accrue in a given year. However, like
other balance sheet items that are essentially backward looking, the accrued liability reported on
balance sheet is based on the ABO (FASB, 1985).19
The principal under FAS87 for computing PBO liabilities – that discount rate that reflect
the rate implicit in the current price of an annuity contract that would effectively defease the
obligation -- is consistent with the valuation principles emphasized here. However, the way
pension accruals affect reported earnings creates a bias that favors equity investment. To see
why requires understanding the details of the earnings calculation. Annual earnings are reduced
23
by the amount that year-to-year increases in the PBO exceed earnings from pension assets. The
change in the PBO is based on actuarial projections, and the interest charge is based on the
assumed discount rate (e.g., 7.75% in for Alcoa in 2003). The change in pension assets, by
contrast, is based on an assumed rate of return on assets that is largely independent of actual
investment outcomes. In fact, firms typically assume a rate of return on assets that is
significantly higher than the discount rate used to compute the PBO, presumably because of the
higher returns expected on equity and other risky investments. A small amount of discipline is
imposed by the rule that if actual cumulative experience differs by more than a threshold amount
from assumed experience, firms are forced to amortize the error over the remaining average
service life of employees and include the amortized amount in earnings. The effect, however, is
to allow very smooth adjustments to earnings, no matter how risky the pension investment
policy. In other words, by investing pension assets in equity, firms can book the equity
premium, without bearing the consequence of the added volatility in reported earnings.
6.2 Implications for regulating pension investments
Recognizing the bond-like nature of its liabilities, in recent years the PBGC has reduced
the allocation in stocks in its own portfolio. Some have suggested that PBGC’s reduction in
stockholdings could serve as a model for corporate pension asset allocation guidelines. Our
analysis suggests that it is incorrect to infer the correct asset allocation policy for firms from the
situation of the PBGC. Firms are responsible for pension liabilities in distinctly different states
of the world than is the PBGC. The obligations already assumed by the PBGC are exclusively
for retired workers and effectively separated workers, and are unaffected by subsequent wage
appreciation. Thus adopting PBGC’s investment policy for pension assets does not necessarily
minimize risk from the perspective of young firms.
The risk to the PBGC, and ultimately to taxpayers, from apparently excessive
investments in equity by some DB sponsors have led to proposals for legal limits on pension
asset allocation. Our analysis suggests reasons that some firms, particularly those with a young
and active workforce, might want to use stocks to hedge. While our analysis does not measure
the strength of this hedging demand, it is possible that such restrictions could further the trend
20 PBGC assesses a per capita premium, rather than a charge based on the overall size of a firm’s liabilities. Thisresults in young firms paying a much higher premium for a given level of coverage than old firms (CBO, 2005).
24
away from offering DB plans.20 More generally, the analysis suggests that heterogeneity could
be important, and that caution should be taken to avoid imposing overly restrictive regulations
that discourage the provision of DB plans for non-economic reasons. The model may be helpful
in this regard, as it suggests how investment guidelines and discount rates for financial reporting
could be based on participant demographics and other firm characteristics.
25
Table 1: Annual Separation Ratesseparation rate x < age 35 0.060separation rate age 34 < x < age 46 0.045separation rate age 45 < x < age 56 0.040separation rate age 55 < x 0.050
Table 2: Earnings Model Parameters
mean stock return (rs) 0.05payout rate on human capital (rw) 0.02dividend yield (div) 0.02std dev stock return σs 0.18std dev idiosyncratic human capital return (σw) 0.04risk free rate (rf) 0.02mean growth human capital (α) 0.02speed of reversion of human capital to target (γ) 0.10speed of reversion in earnings (β) 0.33
Bansal, Ravi and Amir Yaron (2004), “Risks For the Long Run: A Potential Resolution of AssetPricing Puzzles,” Journal of Finance
Benzoni, L, P. Collin Dufresne, and R. Goldstein (2006), “Portfolio Choice over the Life-cyclewhen the Stock and Labor Markets are Cointegrated,” manuscript, University ofMinnesota.
van Binsbergen, Jules H., and Michael W. Brandt (2006), “Optimal Asset Allocation in AssetLiability Management,” working paper, Duke University, May.
Black, Fischer (1980), "The Tax Consequences of Long-Run Pension Policy," FinancialAnalysts Journal, 21-28.
____________ (1989), "Should You Use Stocks to Hedge Your Pension Liability?" FinancialAnalysts Journal, January/February 1989, 10-12.
Bodie, Zvi (1990), “The ABO, the PBO, and Pension Investment Policy,” Financial AnalystsJournal
_________ (2006), “On Asset-Liability Matching and Federal Deposit and Pension Insurance,”proceedings of the Federal Reserve Bank of St. Louis, 30th Annual Economic PolicyConference, Federal Credit And Insurance Programs, forthcoming.
Bulow, Jeremy (1982), “What are Corporate Pension Liabilities? The Quarterly Journal ofEconomics, Vol. 97, No. 3. (Aug., 1982), pp. 435-452.
Bulow, Jeremy, and Myron Scholes (1983), "Who Owns the Assets in a Defined-Benefit PensionPlan?" Chapter 1 in Bodie and Shoven, eds., Financial Aspects of the U.S. PensionSystem, Chicago: University of Chicago Press, 1983.
Cardinale, Mirko (2004), “The Long-run Relationship Between Pension Liabilities and AssetPrices: a Cointegration Approach,” unpublished manuscript, Watson Wyatt.
Congressional Budget Office (2005), “The Risk Exposure of the Pension Benefit GuaranteeCorporation,” available at http://www.cbo.gov/showdoc.cfm?index=6646&sequence=0
Financial Accounting Standards Board (1985), Statement of Financial Accounting Standards No.87, Employers’ Accounting for Pensions, available at http://www.fasb.org/pdf/fas87.pdf
Goetzman, William N., "More Social Security, Not Less" (2005). Yale ICF Working Paper No.05-05.
Gold, Jeremy and Nick Hudson (2003), “Creating Value in Pension Plans (or, Gentlemen PreferBonds) ,” Journal of Applied Corporate Finance 15(4), 51-57.
31
Hansen, Lars, John Heaton and Nan Li (2005), “Consumption Strikes Back?: Measuring Long-Run Risk,” NBER working paper 11476.
Harrison, J. and William Sharpe (1983), “Optimal Funding and Asset Allocation Rules forDefined Benefit Pension Plans,” Financial Aspects of the U.S. Pension System, Zvi Bodieand John Shoven, eds., Chicago, University of Chicago Press, 92-106.
Lustig, Hanno, and Stijn Van Nieuwerburgh (2006), “The Returns on Human Capital: GoodNews on Wall Street is Bad News on Main Street,” Working Paper. Forthcoming, Reviewof Financial Studies.
McDonald, Robert (2006), Derivatives Markets, 2nd Edition, Addison Wesley.
Merton, Robert C. (1974), “On the Pricing of Corporate Debt: The Risk Structure of InterestRates,” Journal of Finance, 29 (2), 1974, 449—470.
Parker, Jonathan and Christian Julliard (2005), "Consumption Risk and the Cross-Section ofExpected Returns," Journal of Political Economy, 113(1), February 2005, 185-222.
Poterba, James, Steven Venti, and David Wise (2005), “Demographic Change, RetirementSaving, and Financial Market Returns, working paper
Rauh, Joshua (2006a), “Investment and Financing Constraints: Evidence from the Funding ofCorporate Pension Plans,” Journal of Finance 61, 33-71.
Rauh, Joshua (2006b), “Risk Shifting versus Risk Management: Investment Policy in CorporatePension Plans,” Working paper, Graduate School of Business, University of Chicago.
Revsine, Lawrence, Daniel W. Collins, and W. Bruce Johnson (2005), Financial reporting andanalysis, 3rd edition, Upper Saddle River, NJ: Pearson/Prentice Hall.
Smith, Andrew (1998), “Salary Related Cash Flows: Market Based Valuation,” unpublishedmanuscript, Bacon and Woodrow, prepared for Conference on Actuarial Valuations,Accounting Standards and Financial Economics, The Royal Society, January 20, 1998.
Sundaresan, Suresh, and Fernando Zapatero (1997), “Valuation, Optimal Asset Allocation, andRetirement Incentives of Pension Plans,” The Review of Financial Studies, Vol 10, No. 3,631-660.
32
Wilcox, David (2006), “Reforming the Defined-Benefit Pension System in the United States,”working paper, Federal Reserve Board. Forthcoming, Brookings Papers on Economic Activity.