58
Valuing Investments in Start-Ups Travis W. Harms, CFA, CPA/ABV Senior Vice President | Mercer Capital [email protected] 901.685.2120 AICPA 2017 Forensic & Valuation Services Conference 1
| Date post: | 07-May-2018 |
| Category: |
Documents |
| Upload: | hoangthien |
| View: | 217 times |
| Download: | 1 times |

Valuing Investments in Start-UpsTravis W. Harms, CFA, CPA/ABVSenior Vice President | Mercer [email protected]
AICPA 2017 Forensic & Valuation Services Conference 1

Topics to Cover• VC Market Overview
• Valuing the Enterprise
– Calibration
– Measuring Current Value
• Valuing the Interest in the Enterprise
– PWERM
– OPM
AICPA 2017 Forensic & Valuation Services Conference 2

VC Market Overview
SECTION 1
AICPA 2017 Forensic & Valuation Services Conference 3
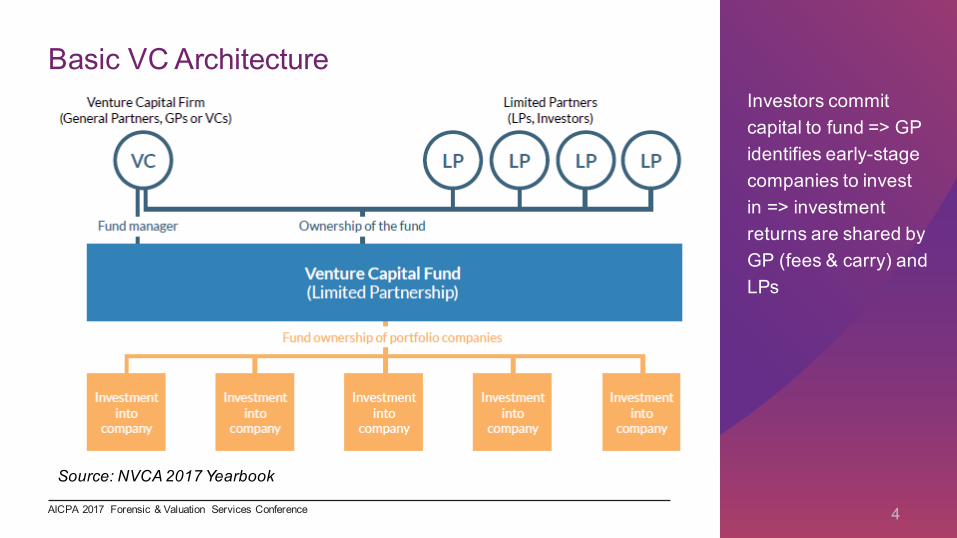
Basic VC ArchitectureInvestors commit capital to fund => GP identifies early-stage companies to invest in => investment returns are shared by GP (fees & carry) and LPs
Source: NVCA 2017 Yearbook
AICPA 2017 Forensic & Valuation Services Conference 4

Relation to Private EquityStrictly speaking, VC is a subset of private equity. There are, however, some primary characteristics that separate VC from the rest of the PE universe
Venture Capital Other Private Equity
Life Cycle Stage Early / Development Mature
Transaction Type Primary Secondary
Financial Leverage Not used Significant source of returns
Managerial Assistance More likely Less likely
Holding Periods Depends on strategy –on balance, potentially longer than PE
Depends on strategy –on balance, potentially shorter than PE
AICPA 2017 Forensic & Valuation Services Conference 5

Comparison to Traditional PE
Source: NVCA 2016 Yearbook
During 2015, capital commitments to VC funds accounted for approximately 20% of total private equity commitments
The number of VC funds receiving commitments actually exceeded traditional LBO and mezzanine funds
Because VC funds typically make smaller investments, the fund sizes tend to be much smaller. VC funds received average capital commitments of $120 million during 2015, compared to $705 million for non-venture private equity funds
AICPA 2017 Forensic & Valuation Services Conference 6

Development Company Life CycleAICPA Practice Aid Life Cycle Stage FrameworkStage 1 Stage 2 Stage 3 Stage 4 Stage 5 Stage 6
Product Revenue None None None Some Growing Established History
Expense History Limited Substantive Substantive Substantive Established History Established History
Profitability Losses Losses Losses Losses Breakeven / Profitable Established History
Management Team Incomplete Expanding Complete Complete Complete Complete
Product Development Limited Underway Beta Testing Shipping Orders Shipping Orders Ongoing
Financing Sources Angels / Early VC Venture Capital VC / Strategics Mezz / Strategics Strategic / IPO Self-Funding
Source: AICPA Practice Aid – Valuation of Privately-Held-Company Equity Securities Issued as Compensation
Paragraph 2.02: An enterprise typically builds value throughout the various stages of development but generally not in a linear fashion. In valuing the securities within an enterprise, it is important to recognize the enterprise’s stage of development and its achievement of developmental milestones. The stage of development will influence the perceived risk of investing in the enterprise, which, in turn, will influence the valuation.
AICPA 2017 Forensic & Valuation Services Conference 7

Development Milestones• Finalize original business plan
• Obtain initial outside financing
• Achieve proof of concept
• Beta test product or service
• Successfully assemble management team
• Establish relationship with strategic partners
• Obtain key customer(s)
• Obtain regulatory approval
• Develop manufacturing plan
• Secure key raw materials, equipment, or work force
• Execute customer contracts
• Deliver product or service
• Achieve positive cash flows / breakeven
• Achieve profitability
Examples from AICPA Practice Aid
Source: AICPA Practice Aid – Valuation of Privately-Held-Company Equity Securities Issued as Compensation
AICPA 2017 Forensic & Valuation Services Conference 8
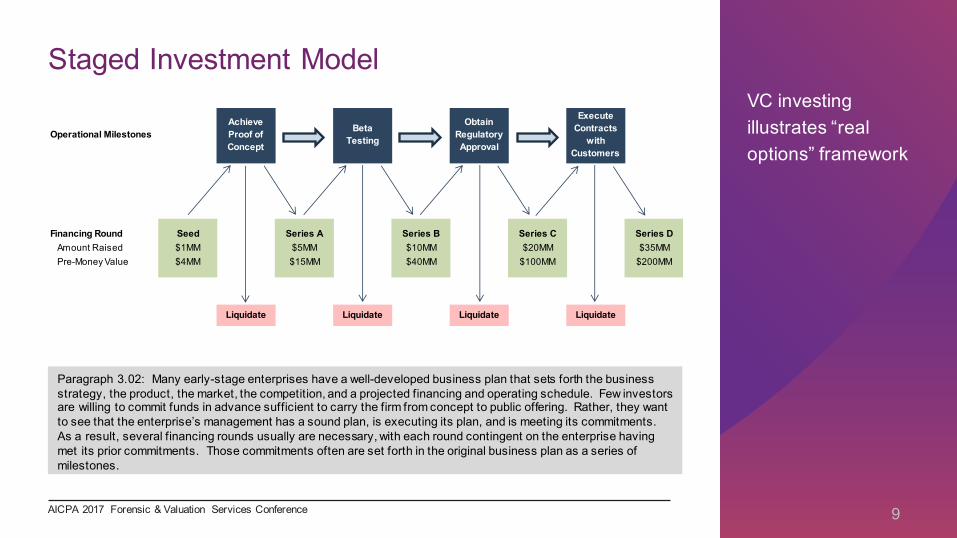
Staged Investment ModelVC investing illustrates “real options” framework
Operational MilestonesAchieve Proof of Concept
Beta Testing
Obtain Regulatory Approval
Execute Contracts
with Customers
Financing Round Seed Series A Series B Series C Series DAmount Raised $1MM $5MM $10MM $20MM $35MMPre-Money Value $4MM $15MM $40MM $100MM $200MM
Liquidate Liquidate Liquidate Liquidate
Paragraph 3.02: Many early-stage enterprises have a well-developed business plan that sets forth the business strategy, the product, the market, the competition, and a projected financing and operating schedule. Few investors are willing to commit funds in advance sufficient to carry the firm from concept to public offering. Rather, they want to see that the enterprise’s management has a sound plan, is executing its plan, and is meeting its commitments. As a result, several financing rounds usually are necessary, with each round contingent on the enterprise having met its prior commitments. Those commitments often are set forth in the original business plan as a series of milestones.
AICPA 2017 Forensic & Valuation Services Conference 9
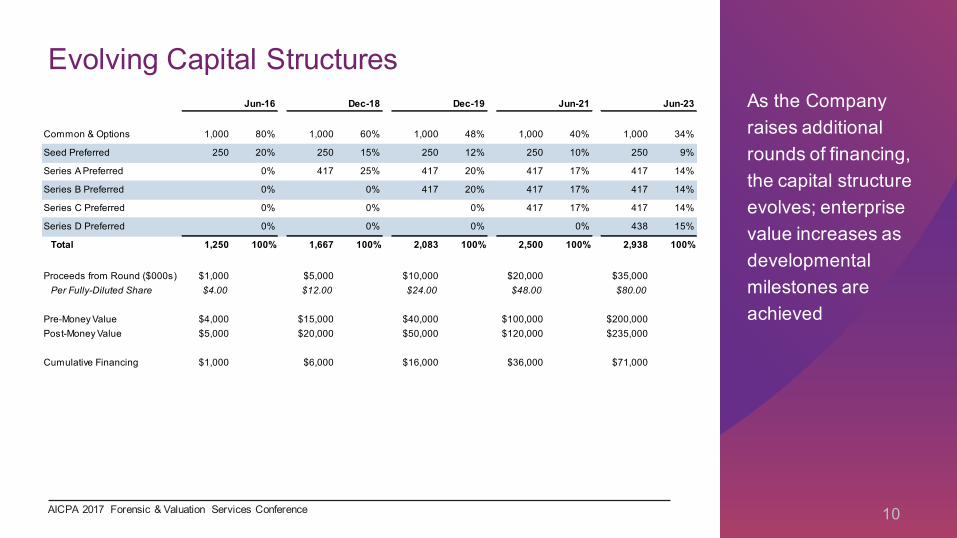
Evolving Capital StructuresAs the Company raises additional rounds of financing, the capital structure evolves; enterprise value increases as developmental milestones are achieved
Jun-16 Dec-18 Dec-19 Jun-21 Jun-23
Common & Options 1,000 80% 1,000 60% 1,000 48% 1,000 40% 1,000 34%
Seed Preferred 250 20% 250 15% 250 12% 250 10% 250 9%
Series A Preferred 0% 417 25% 417 20% 417 17% 417 14%
Series B Preferred 0% 0% 417 20% 417 17% 417 14%
Series C Preferred 0% 0% 0% 417 17% 417 14%
Series D Preferred 0% 0% 0% 0% 438 15%
Total 1,250 100% 1,667 100% 2,083 100% 2,500 100% 2,938 100%
Proceeds from Round ($000s) $1,000 $5,000 $10,000 $20,000 $35,000Per Fully-Diluted Share $4.00 $12.00 $24.00 $48.00 $80.00
Pre-Money Value $4,000 $15,000 $40,000 $100,000 $200,000Post-Money Value $5,000 $20,000 $50,000 $120,000 $235,000
Cumulative Financing $1,000 $6,000 $16,000 $36,000 $71,000
AICPA 2017 Forensic & Valuation Services Conference 10
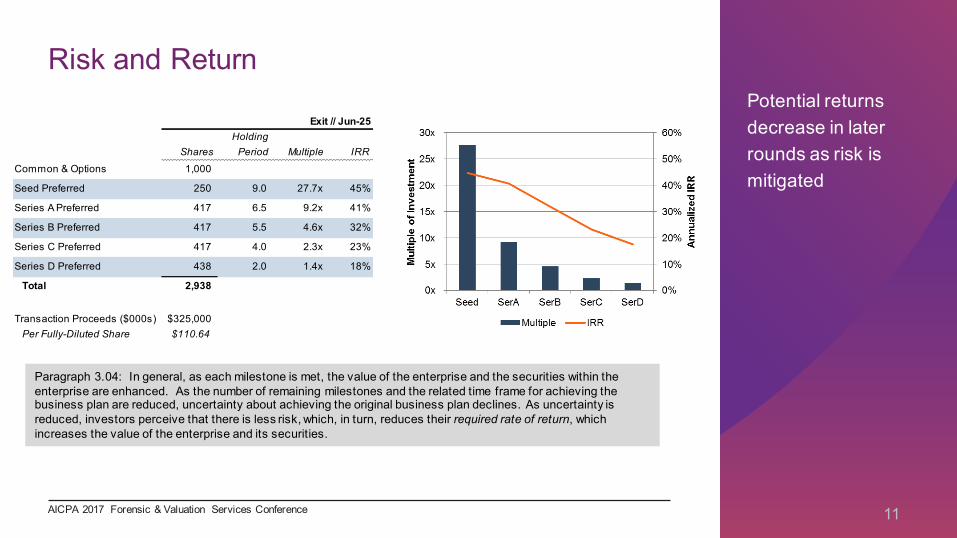
Risk and ReturnPotential returns decrease in later rounds as risk is mitigated
Exit // Jun-25Holding
Shares Period Multiple IRR
Common & Options 1,000
Seed Preferred 250 9.0 27.7x 45%
Series A Preferred 417 6.5 9.2x 41%
Series B Preferred 417 5.5 4.6x 32%
Series C Preferred 417 4.0 2.3x 23%
Series D Preferred 438 2.0 1.4x 18%
Total 2,938
Transaction Proceeds ($000s) $325,000Per Fully-Diluted Share $110.64
Paragraph 3.04: In general, as each milestone is met, the value of the enterprise and the securities within the enterprise are enhanced. As the number of remaining milestones and the related time frame for achieving the business plan are reduced, uncertainty about achieving the original business plan declines. As uncertainty is reduced, investors perceive that there is less risk, which, in turn, reduces their required rate of return, which increases the value of the enterprise and its securities.
AICPA 2017 Forensic & Valuation Services Conference 11

Other Enterprise Value Considerations• State of industry and economy
• Management & BoD
• Marketplace and major competitors
• Barriers to entry
• Competitive forces
• Existence of proprietary technology, product, or service
• Workforce / human capital
• Customer and vendor characteristics
• Strategic relationships with major suppliers or customers
• Major investors
• Cost structure and financial condition
• Attractiveness of industry segment
Factors from AICPA Practice Aid
Source: AICPA Practice Aid – Valuation of Privately-Held-Company Equity Securities Issued as Compensation
AICPA 2017 Forensic & Valuation Services Conference 12
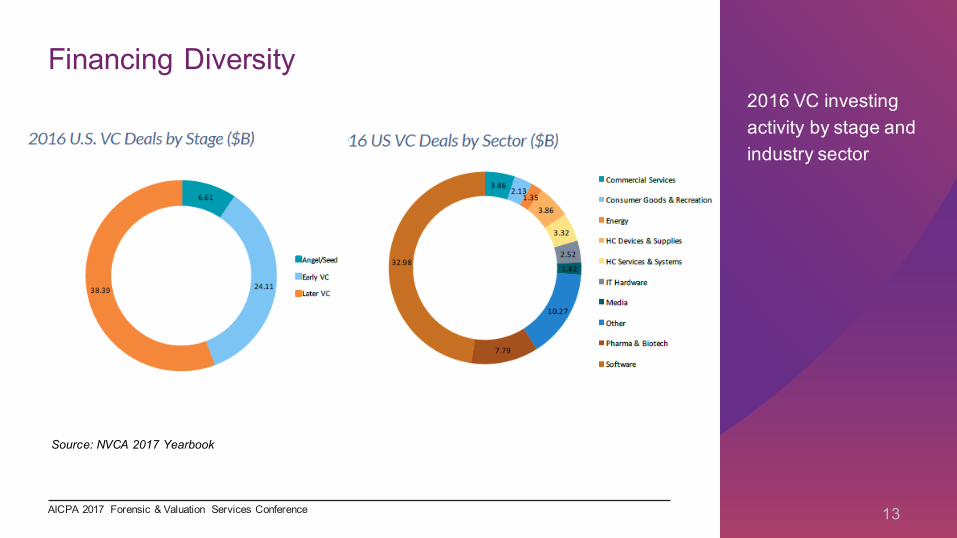
Financing Diversity2016 VC investing activity by stage and industry sector
Source: NVCA 2017 Yearbook
AICPA 2017 Forensic & Valuation Services Conference 13
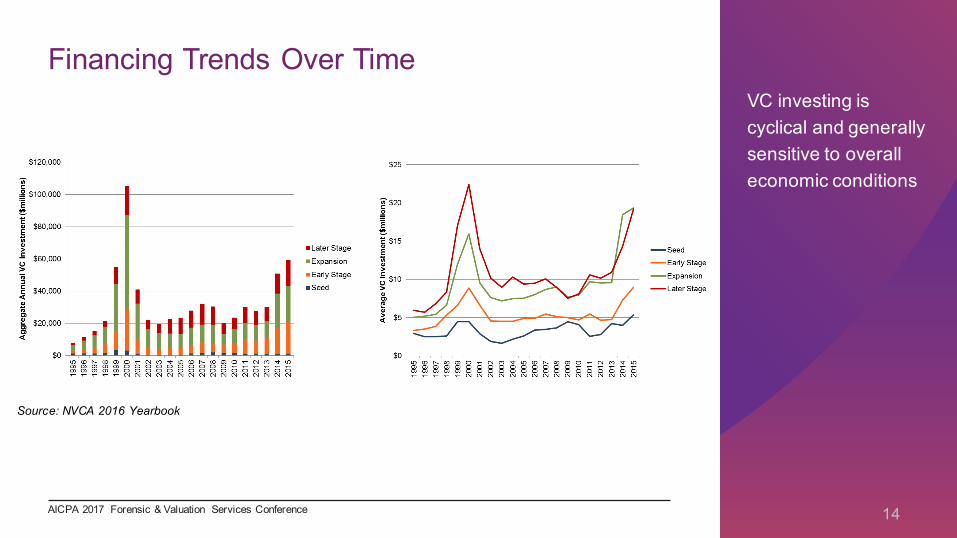
Financing Trends Over TimeVC investing is cyclical and generally sensitive to overall economic conditions
Source: NVCA 2016 Yearbook
AICPA 2017 Forensic & Valuation Services Conference 14
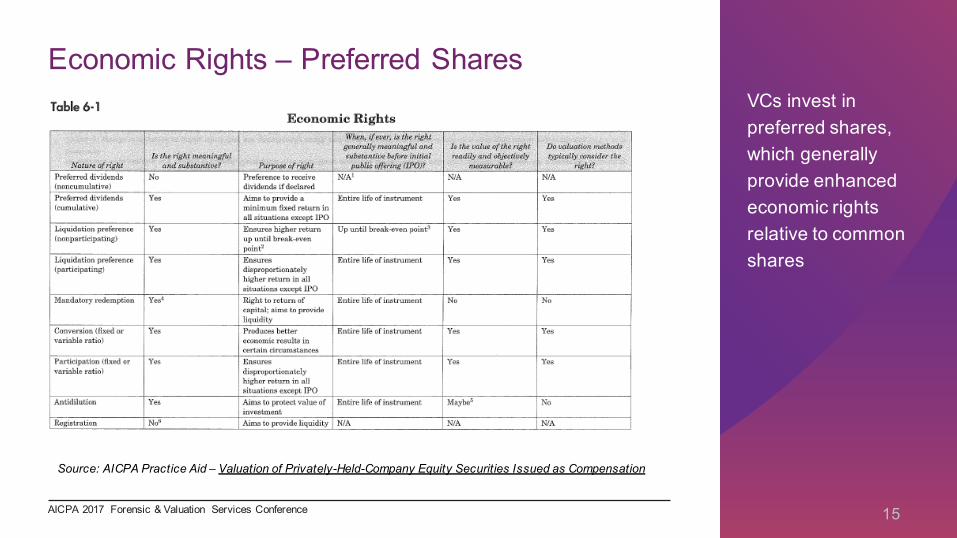
Economic Rights – Preferred SharesVCs invest in preferred shares, which generally provide enhanced economic rights relative to common shares
Source: AICPA Practice Aid – Valuation of Privately-Held-Company Equity Securities Issued as Compensation
AICPA 2017 Forensic & Valuation Services Conference 15
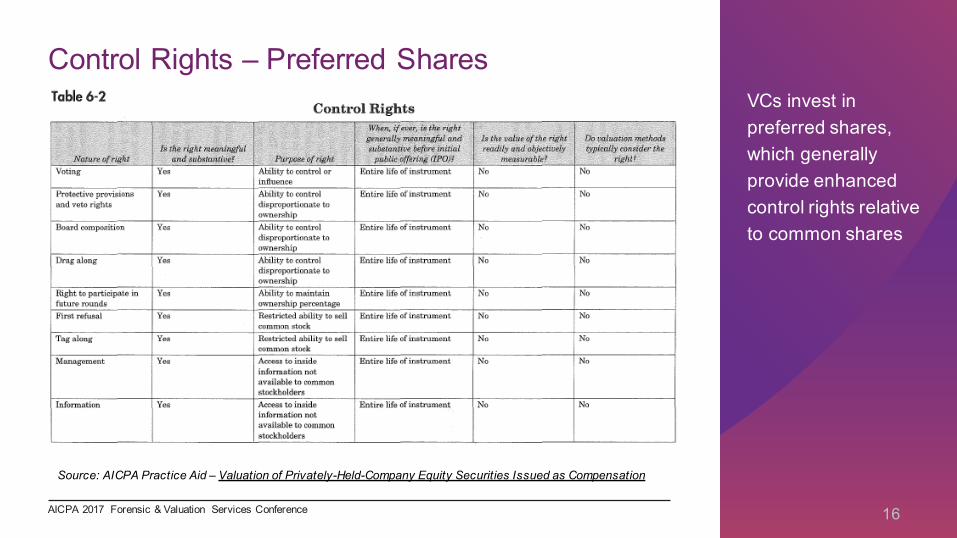
Control Rights – Preferred SharesVCs invest in preferred shares, which generally provide enhanced control rights relative to common shares
Source: AICPA Practice Aid – Valuation of Privately-Held-Company Equity Securities Issued as Compensation
AICPA 2017 Forensic & Valuation Services Conference 16
Valuing the Enterprise
SECTION 2
AICPA 2017 Forensic & Valuation Services Conference 17
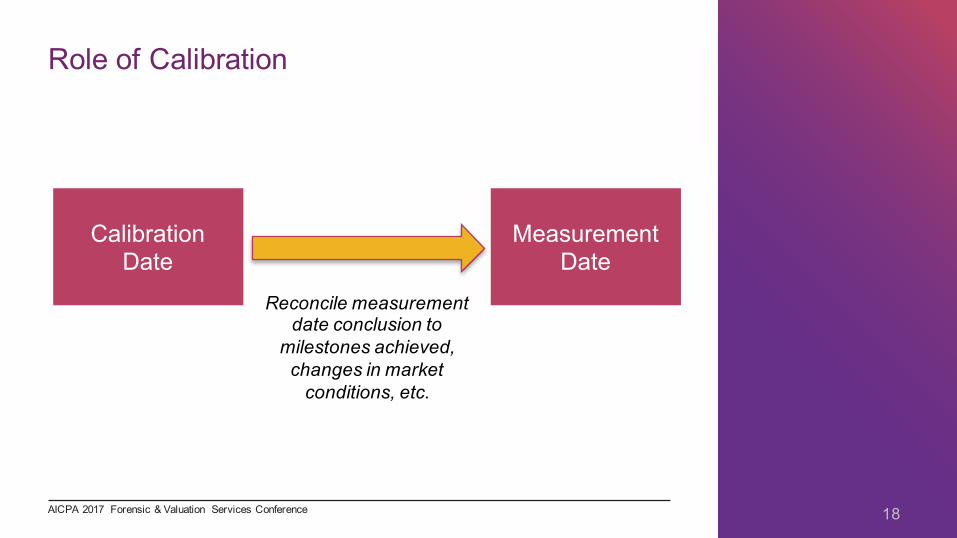
Role of Calibration
Measurement Date
Calibration Date
Reconcile measurement date conclusion to
milestones achieved, changes in market
conditions, etc.
AICPA 2017 Forensic & Valuation Services Conference 18

Calibration :: What Was the Last Valuation?Developing a Calibration Date Enterprise Value
Last External Round
Issue Date Price Shares ProceedsSeries E Preferred 4/15/2015 $7.1405 4,971,641 $35,500,003
As-If Converted BasisFully-Diluted Share Count 77,494,506
times: Series E Issue Price $7.1405Implied Equity Value (Post-Money) $553,349,520
Weight Assigned to Indication 50.0%
Option Pricing Model BacksolveShares Per Share Total
Series A Preferred 3,666,666 $1.9749 $7,241,480Series B Preferred 9,400,764 $2.0362 $19,142,277Series C Preferred / Warrants 8,409,088 $2.1958 $18,464,963Series C-1 Preferred 1,198,019 $3.6190 $4,335,618Series D Preferred 12,256,960 $3.4919 $42,799,698Series E Preferred 4,971,641 $7.1405 $35,500,052Options: 2007 Stock Plan / Warrants 14,680,052 $1.7894 $26,268,052Common Stock 22,911,316 $1.9236 $44,072,577
Total 77,494,506 $197,824,718Weight Assigned to Indication 50.0%
Indicated Equity Value - Last External Round $376,000,000less: Cash ($61,416,003)plus: Interest-Bearing Debt $20,823,000
Indicated Enterprise Value - Last External Round $335,406,997
Overstates value because it treats every share as if it were
the most senior class
Understates value because it tends to ascribe too much
value to seniority preferences
AICPA 2017 Forensic & Valuation Services Conference 19

Enterprise Valuation Methods
• Asset-based approaches
• Discounted cash flow analysis
• Market multiples
• PWERM => Probability-Weighted Expected Return Method
AICPA 2017 Forensic & Valuation Services Conference 20
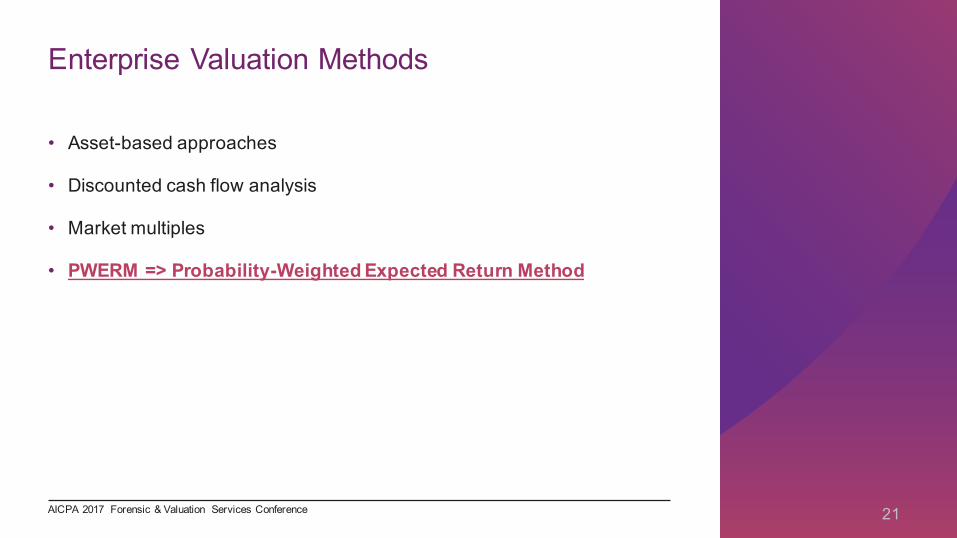
Enterprise Valuation Methods
• Asset-based approaches
• Discounted cash flow analysis
• Market multiples
• PWERM => Probability-Weighted Expected Return Method
AICPA 2017 Forensic & Valuation Services Conference 21
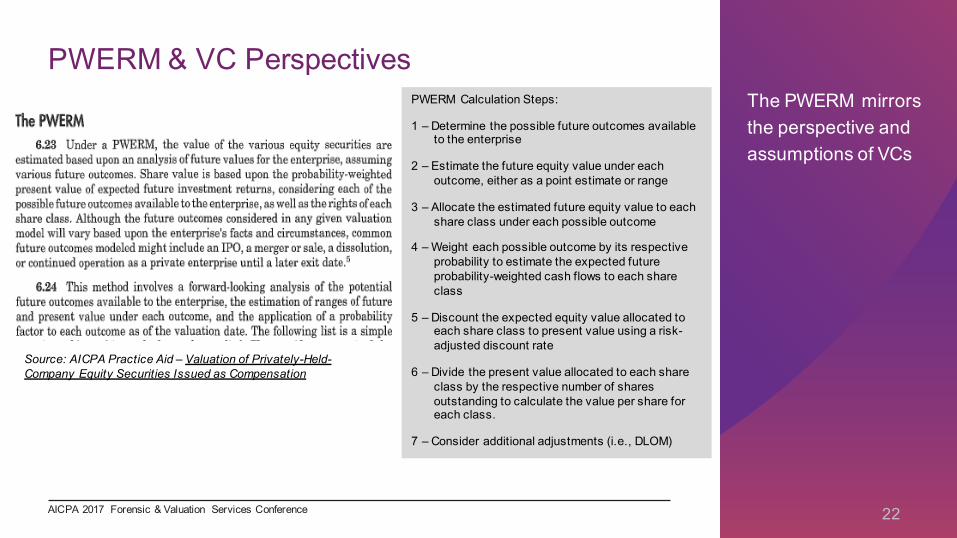
PWERM & VC PerspectivesThe PWERM mirrors the perspective and assumptions of VCs
PWERM Calculation Steps:
1 – Determine the possible future outcomes available to the enterprise
2 – Estimate the future equity value under each outcome, either as a point estimate or range
3 – Allocate the estimated future equity value to each share class under each possible outcome
4 – Weight each possible outcome by its respective probability to estimate the expected future probability-weighted cash flows to each share class
5 – Discount the expected equity value allocated to each share class to present value using a risk-adjusted discount rate
6 – Divide the present value allocated to each share class by the respective number of shares outstanding to calculate the value per share for each class.
7 – Consider additional adjustments (i.e., DLOM)
Source: AICPA Practice Aid – Valuation of Privately-Held-Company Equity Securities Issued as Compensation
AICPA 2017 Forensic & Valuation Services Conference 22
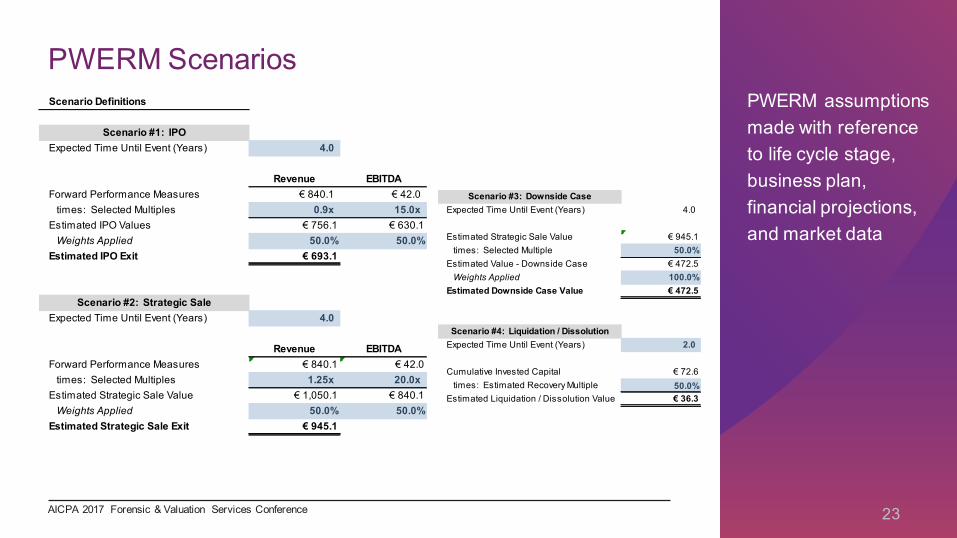
PWERM ScenariosPWERM assumptions made with reference to life cycle stage, business plan, financial projections, and market data
Scenario Definitions
Scenario #1: IPOExpected Time Until Event (Years) 4.0
Revenue EBITDAForward Performance Measures € 840.1 € 42.0
times: Selected Multiples 0.9x 15.0xEstimated IPO Values € 756.1 € 630.1
Weights Applied 50.0% 50.0%Estimated IPO Exit € 693.1
Scenario #2: Strategic SaleExpected Time Until Event (Years) 4.0
Revenue EBITDAForward Performance Measures € 840.1 € 42.0
times: Selected Multiples 1.25x 20.0xEstimated Strategic Sale Value € 1,050.1 € 840.1
Weights Applied 50.0% 50.0%Estimated Strategic Sale Exit € 945.1
Scenario #3: Downside CaseExpected Time Until Event (Years) 4.0
Estimated Strategic Sale Value € 945.1times: Selected Multiple 50.0%
Estimated Value - Downside Case € 472.5Weights Applied 100.0%
Estimated Downside Case Value € 472.5
Scenario #4: Liquidation / DissolutionExpected Time Until Event (Years) 2.0
Cumulative Invested Capital € 72.6times: Estimated Recovery Multiple 50.0%
Estimated Liquidation / Dissolution Value € 36.3
AICPA 2017 Forensic & Valuation Services Conference 23
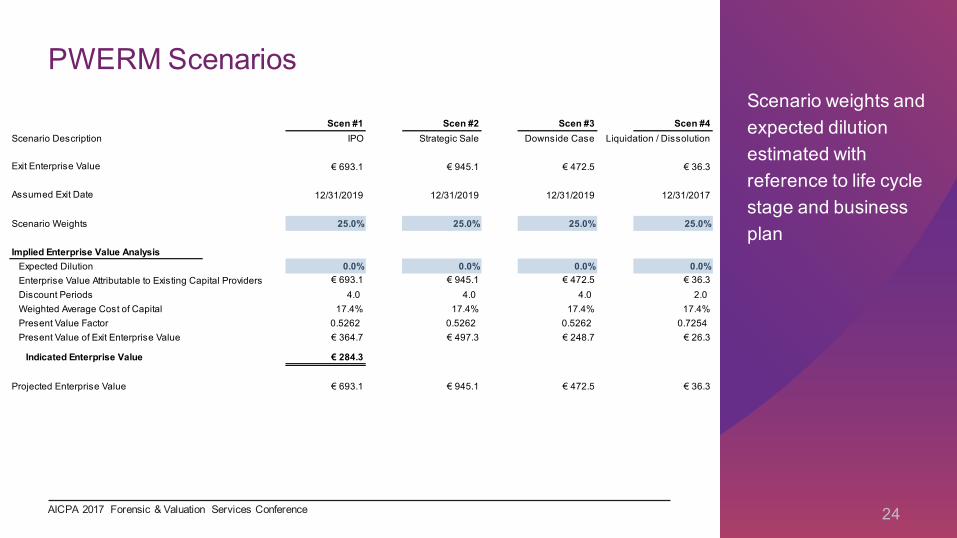
PWERM ScenariosScenario weights and expected dilution estimated with reference to life cycle stage and business plan
Scen #1 Scen #2 Scen #3 Scen #4Scenario Description IPO Strategic Sale Downside Case Liquidation / Dissolution
Exit Enterprise Value € 693.1 € 945.1 € 472.5 € 36.3
Assumed Exit Date 12/31/2019 12/31/2019 12/31/2019 12/31/2017
Scenario Weights 25.0% 25.0% 25.0% 25.0%
Implied Enterprise Value AnalysisExpected Dilution 0.0% 0.0% 0.0% 0.0%Enterprise Value Attributable to Existing Capital Providers € 693.1 € 945.1 € 472.5 € 36.3Discount Periods 4.0 4.0 4.0 2.0Weighted Average Cost of Capital 17.4% 17.4% 17.4% 17.4%Present Value Factor 0.5262 0.5262 0.5262 0.7254Present Value of Exit Enterprise Value € 364.7 € 497.3 € 248.7 € 26.3
Indicated Enterprise Value € 284.3
Projected Enterprise Value € 693.1 € 945.1 € 472.5 € 36.3
AICPA 2017 Forensic & Valuation Services Conference 24
PWERM Inputs• Discount rate
• Time to liquidity event
• Exit multiples
• Consider IPO data
• Consider public company data
• Downside case exit value
• Liquidation recovery multiple
• Scenario weights
• Expected dilution
AICPA 2017 Forensic & Valuation Services Conference 25

Discount RateCost of Equity References and CommentsRisk-Free Rate 2.66% Note (1)
Equity Risk Premium 5.50% Note (2)
Guideline Beta 2.00 Note (3)
Beta Adjusted Common Stock Premium 11.00%Size Premium 3.74% Note (4)
Specific Company Risk Premium 0.50% Note (5)
Equity Discount Rate (Required Rate of Return) 17.90%
Cost of DebtBase Cost of Debt 4.86% Note (6)
Applicable Spread Over Base Cost 0.00% Note (7)
Total Pre-tax Cost of Debt 4.86%Estimated Tax Rate 38.0% -1.85%
After-Tax Cost of Debt Capital 3.01%
Weighted Average Cost of Capital (WACC)
Capital Component Cost Weight(8) ProductEquity 17.90% 100.0% 17.90%Debt 3.01% 0.0% 0.00%Weighted Average Cost of Capital (WACC) 17.90%
Rounded to: 0.01%
Rounded to: 0.01%
Weighted Average Cost of Capital
At the calibration date, the objective of the WACC
analysis is to establish a baseline framework for
the enterprise WACC. The enterprise WACC is
distinguished from the conditional returns
achieved on successful VC investments, and is
instead representative of an investor’s expected
return on a portfolio of VC investments (likely 15-
20%)
At the calibration date, the specific company risk
premium is implied such that the resulting WACC
corresponds to the IRR on the enterprise value
At subsequent fair value measurement dates, the
specific company risk premium is reassessed
relative to fundamental changes in the business.
AICPA 2017 Forensic & Valuation Services Conference 26

VC Returns Fund returns, net of fees // Source: AICPA Practice Aid
AICPA 2017 Forensic & Valuation Services Conference 27

VC ReturnsExpected enterprise-level returns Source: AICPA Practice Aid
AICPA 2017 Forensic & Valuation Services Conference 28
Discount Rate Perspective• Extension of CAPM to incorporate four factors:
• Excess market returns
• Size
• Value
• Liquidity
• Market, value, and liquidity factors appear significant in looking at data from c. 1981 to c. 2008
• Concluded estimate of VC cost of capital: 15%
Source: Venture Capital & the Finance of Innovation, Metrick et al
AICPA 2017 Forensic & Valuation Services Conference 29
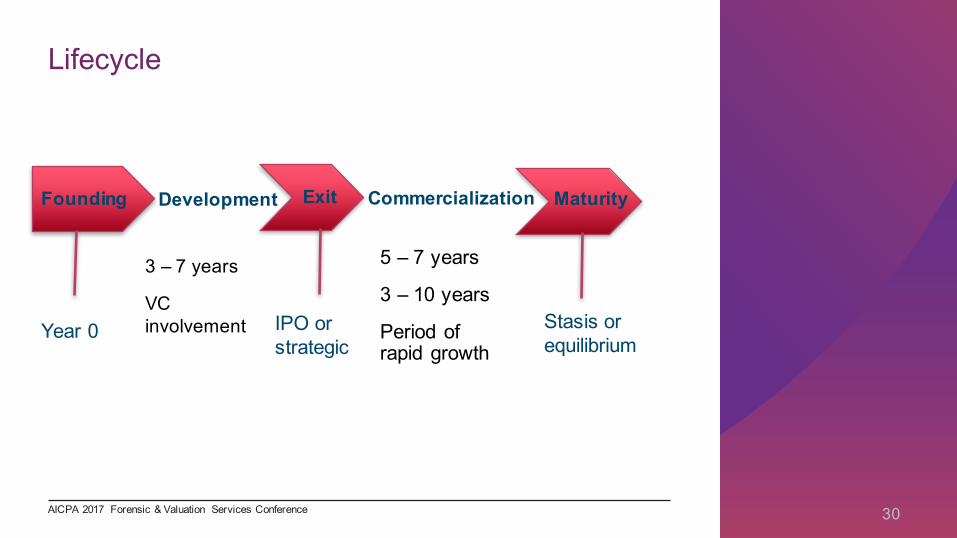
Lifecycle
Development Exit CommercializationFounding Maturity
Year 0
3 – 7 years
VC involvement IPO or
strategic
5 – 7 years
3 – 10 years
Period of rapid growth
Stasis or equilibrium
AICPA 2017 Forensic & Valuation Services Conference 30

Exit Perspectives :: IPO
AICPA 2017 Forensic & Valuation Services Conference 31
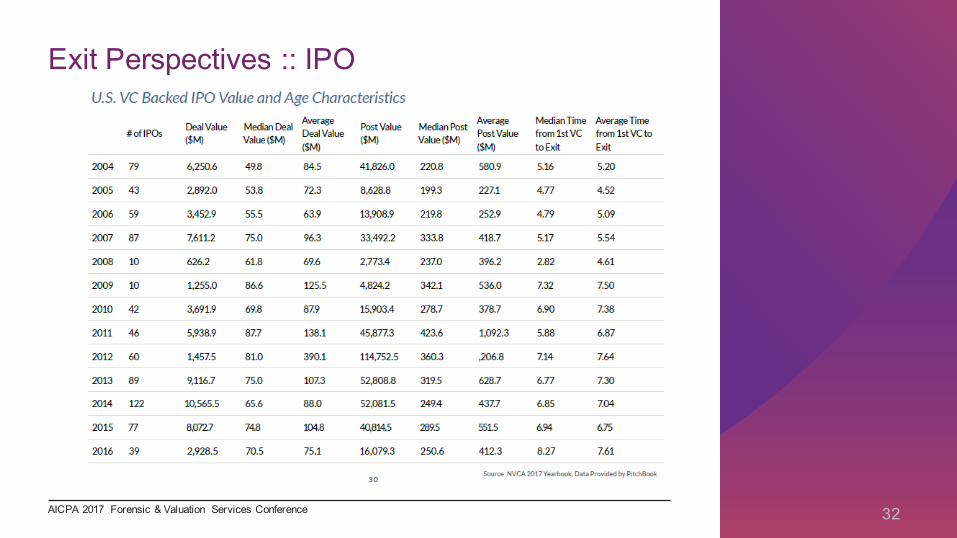
Exit Perspectives :: IPO
AICPA 2017 Forensic & Valuation Services Conference 32
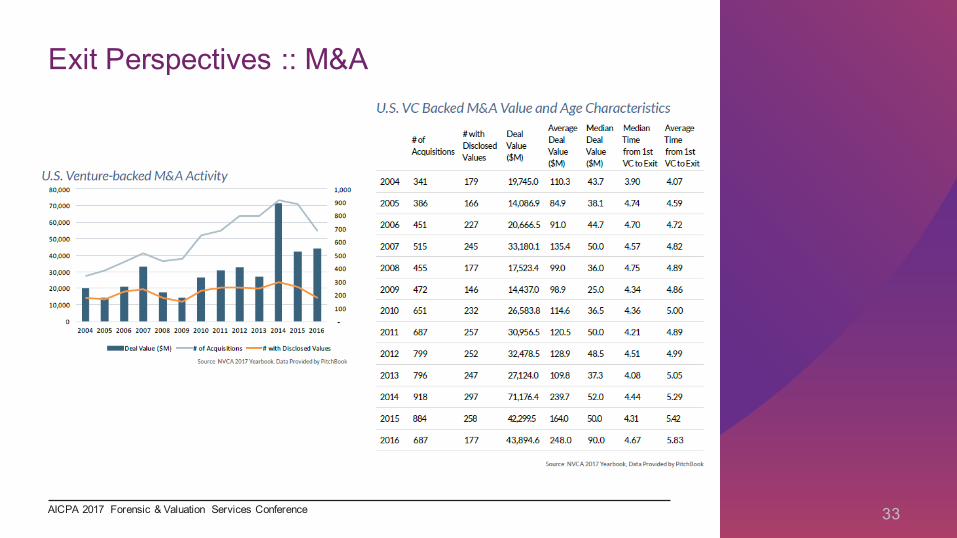
Exit Perspectives :: M&A
AICPA 2017 Forensic & Valuation Services Conference 33
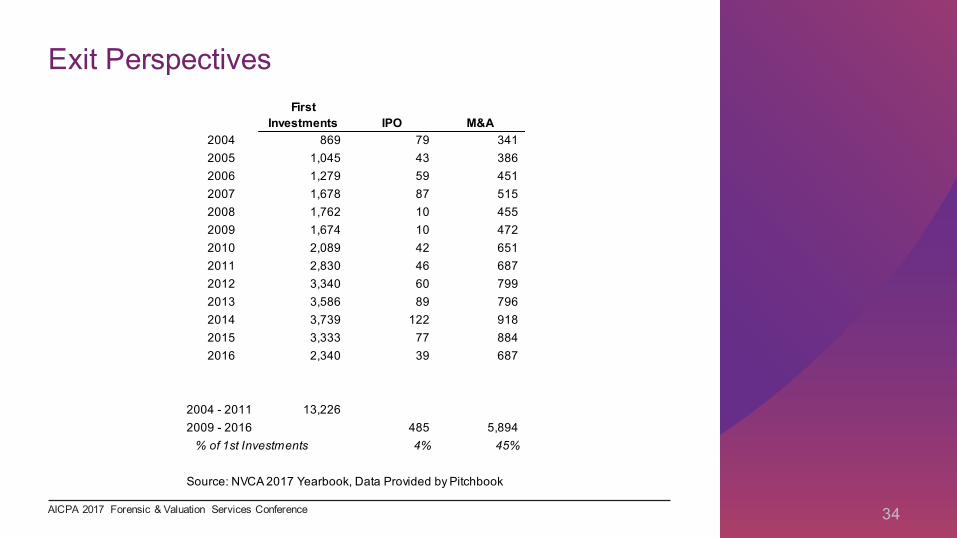
Exit PerspectivesFirst
Investments IPO M&A2004 869 79 3412005 1,045 43 3862006 1,279 59 4512007 1,678 87 5152008 1,762 10 4552009 1,674 10 4722010 2,089 42 6512011 2,830 46 6872012 3,340 60 7992013 3,586 89 7962014 3,739 122 9182015 3,333 77 8842016 2,340 39 687
2004 - 2011 13,2262009 - 2016 485 5,894
% of 1st Investments 4% 45%
Source: NVCA 2017 Yearbook, Data Provided by Pitchbook
AICPA 2017 Forensic & Valuation Services Conference 34

Dilution• Study of IPOs – implied retention
• First round investments 50%
• Second round investments 60%
• Third round investments 67%
• Fourth and later rounds 70%
Source: Venture Capital & the Finance of Innovation, Metrick et al
AICPA 2017 Forensic & Valuation Services Conference 35
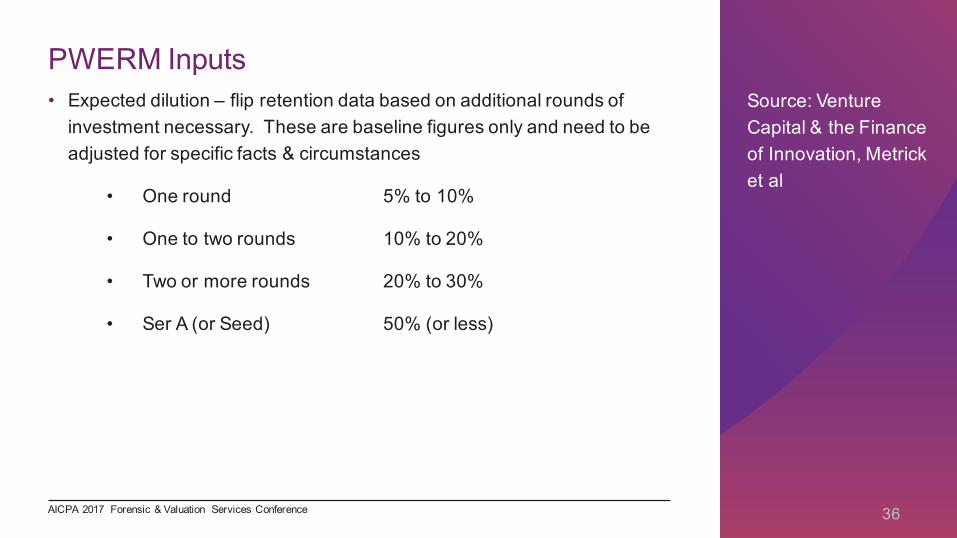
PWERM Inputs• Expected dilution – flip retention data based on additional rounds of
investment necessary. These are baseline figures only and need to be adjusted for specific facts & circumstances
• One round 5% to 10%
• One to two rounds 10% to 20%
• Two or more rounds 20% to 30%
• Ser A (or Seed) 50% (or less)
Source: Venture Capital & the Finance of Innovation, Metrick et al
AICPA 2017 Forensic & Valuation Services Conference 36

Pulling It All TogetherScenario weights and expected dilution estimated with reference to life cycle stage and business plan
Scen #1 Scen #2 Scen #3 Scen #4Scenario Description IPO Strategic Sale Downside Case Liquidation / Dissolution
Exit Enterprise Value € 693.1 € 945.1 € 472.5 € 36.3
Assumed Exit Date 12/31/2019 12/31/2019 12/31/2019 12/31/2017
Scenario Weights 25.0% 25.0% 25.0% 25.0%
Implied Enterprise Value AnalysisExpected Dilution 0.0% 0.0% 0.0% 0.0%Enterprise Value Attributable to Existing Capital Providers € 693.1 € 945.1 € 472.5 € 36.3Discount Periods 4.0 4.0 4.0 2.0Weighted Average Cost of Capital 17.4% 17.4% 17.4% 17.4%Present Value Factor 0.5262 0.5262 0.5262 0.7254Present Value of Exit Enterprise Value € 364.7 € 497.3 € 248.7 € 26.3
Indicated Enterprise Value € 284.3
Projected Enterprise Value € 693.1 € 945.1 € 472.5 € 36.3
AICPA 2017 Forensic & Valuation Services Conference 37

PWERM Inputs• Calibration and FV measurement
• Total equity value approximates calibrated value and PWERM indicated exit value
• Calibration
• Reconcile to share price from latest funding roundIndicated Values
Expected Units Value /Value Outstanding Share
Series A Preferred $17.3 3,666,666 $4.72Series B Preferred $44.9 9,400,764 $4.78Series C Preferred / Warrants $40.8 8,409,088 $4.85Series C-1 Preferred $6.1 1,198,019 $5.10Series D Preferred $62.4 12,256,960 $5.09Series E Preferred $33.8 4,971,641 $6.81 Offering Price = $7.1405 per shareOptions: 2007 Stock Plan / Warrants $66.1 14,680,052 $4.50Common Stock $106.0 22,911,316 $4.63
Total Present Value $377.4
Reconciliation and Sanity Check
AICPA 2017 Forensic & Valuation Services Conference 38

Option Pricing Model
AICPA 2017 Forensic & Valuation Services Conference 39

SimpleCo ExampleThe Basic Insight of the OPMExhibit 1
Payoff Table - SimpleCo
Enterprise Preferred CommonValue Shareholders Shareholders
$0 $0 $0$100 $100 $0$200 $200 $0$300 $300 $0$400 $400 $0$500 $500 $0$600 $500 $100$700 $500 $200$800 $500 $300$900 $500 $400
$1,000 $500 $500
AICPA 2017 Forensic & Valuation Services Conference 40

SimpleCo ExampleThe Basic Insight of the OPM
AICPA 2017 Forensic & Valuation Services Conference 41

What is a “Breakpoint”?Exhibit 3Capital Structure - ComplexCo
Conversion/ Fully-Liquidation Liquidation Exercise Diluted % ofPreference Priority Price Shares Total
Class A Preferred $1,000 Pari Passu $2.00 500 19.6%Class B Preferred 1,500 Pari Passu $5.00 300 11.8%Common Shares 0 Residual na 1,500 58.8%Warrants 0 Residual $10.00 250 9.8%
Total $2,500 2,550 100.0%
AICPA 2017 Forensic & Valuation Services Conference 42
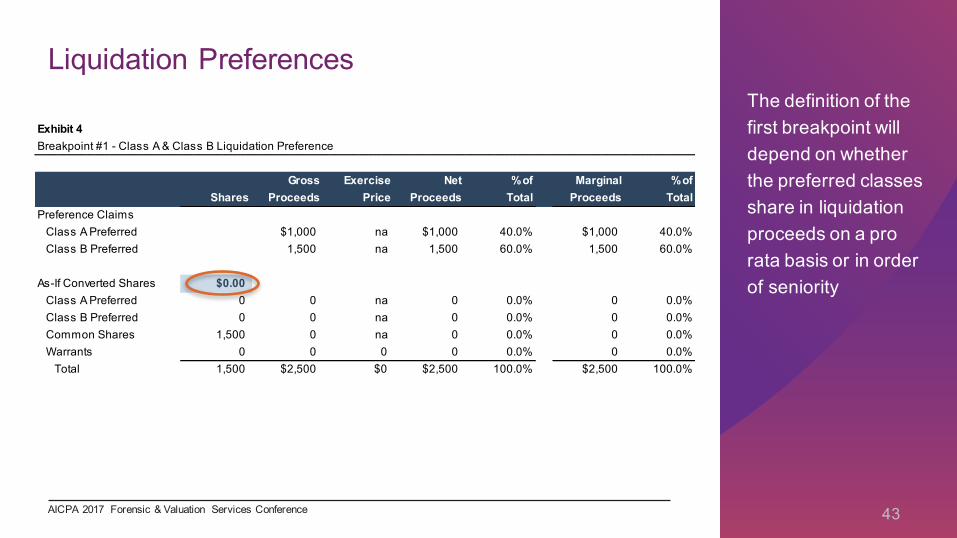
Liquidation PreferencesThe definition of the first breakpoint will depend on whether the preferred classes share in liquidation proceeds on a pro rata basis or in order of seniority
Exhibit 4Breakpoint #1 - Class A & Class B Liquidation Preference
Gross Exercise Net % of Marginal % ofShares Proceeds Price Proceeds Total Proceeds Total
Preference ClaimsClass A Preferred $1,000 na $1,000 40.0% $1,000 40.0%Class B Preferred 1,500 na 1,500 60.0% 1,500 60.0%
As-If Converted Shares $0.00Class A Preferred 0 0 na 0 0.0% 0 0.0%Class B Preferred 0 0 na 0 0.0% 0 0.0%Common Shares 1,500 0 na 0 0.0% 0 0.0%Warrants 0 0 0 0 0.0% 0 0.0%
Total 1,500 $2,500 $0 $2,500 100.0% $2,500 100.0%
AICPA 2017 Forensic & Valuation Services Conference 43

Conversion #1Once all liquidation preferences have been covered, the next step is to identify conversion / exercise by order of conversion price (not seniority), from lowest to highest
Exhibit 5Breakpoint #2 - Class A Converts to Common
Gross Exercise Net % of Marginal % ofShares Proceeds Price Proceeds Total Proceeds Total
Preference ClaimsClass A Preferred $0 na $0 0.0% ($1,000) -33.3%Class B Preferred 1,500 na 1,500 27.3% 0 0.0%
As-If Converted Shares $2.00Class A Preferred 500 1,000 na 1,000 18.2% 1,000 33.3%Class B Preferred 0 0 na 0 0.0% 0 0.0%Common Shares 1,500 3,000 na 3,000 54.5% 3,000 100.0%Warrants 0 0 0 0 0.0% 0 0.0%
Total 2,000 $5,500 $0 $5,500 100.0% $3,000 100.0%Exhibit 3Capital Structure - ComplexCo
Conversion/ Fully-Liquidation Liquidation Exercise Diluted % ofPreference Priority Price Shares Total
Class A Preferred $1,000 Pari Passu $2.00 500 19.6%Class B Preferred 1,500 Pari Passu $5.00 300 11.8%Common Shares 0 Residual na 1,500 58.8%Warrants 0 Residual $10.00 250 9.8%
Total $2,500 2,550 100.0%
AICPA 2017 Forensic & Valuation Services Conference 44

Conversion #2Once all liquidation preferences have been covered, the next step is to identify conversion / exercise by order of conversion price (not seniority), from lowest to highest
Exhibit 6Breakpoint #3 - Class B Converts to Common
Gross Exercise Net % of Marginal % ofShares Proceeds Price Proceeds Total Proceeds Total
Preference ClaimsClass A Preferred $0 na $0 0.0% $0 0.0%Class B Preferred 0 na 0 0.0% (1,500) -25.0%
As-If Converted Shares $5.00Class A Preferred 500 2,500 na 2,500 21.7% 1,500 25.0%Class B Preferred 300 1,500 na 1,500 13.0% 1,500 25.0%Common Shares 1,500 7,500 na 7,500 65.2% 4,500 75.0%Warrants 0 0 0 0 0.0% 0 0.0%
Total 2,300 $11,500 $0 $11,500 100.0% $6,000 100.0%
AICPA 2017 Forensic & Valuation Services Conference 45
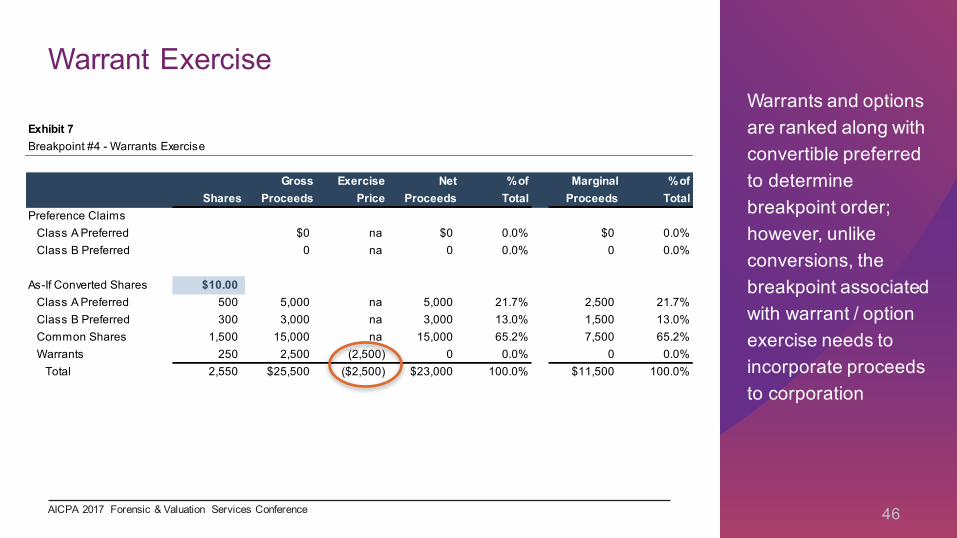
Warrant ExerciseWarrants and options are ranked along with convertible preferred to determine breakpoint order; however, unlike conversions, the breakpoint associated with warrant / option exercise needs to incorporate proceeds to corporation
Exhibit 7Breakpoint #4 - Warrants Exercise
Gross Exercise Net % of Marginal % ofShares Proceeds Price Proceeds Total Proceeds Total
Preference ClaimsClass A Preferred $0 na $0 0.0% $0 0.0%Class B Preferred 0 na 0 0.0% 0 0.0%
As-If Converted Shares $10.00Class A Preferred 500 5,000 na 5,000 21.7% 2,500 21.7%Class B Preferred 300 3,000 na 3,000 13.0% 1,500 13.0%Common Shares 1,500 15,000 na 15,000 65.2% 7,500 65.2%Warrants 250 2,500 (2,500) 0 0.0% 0 0.0%
Total 2,550 $25,500 ($2,500) $23,000 100.0% $11,500 100.0%
AICPA 2017 Forensic & Valuation Services Conference 46

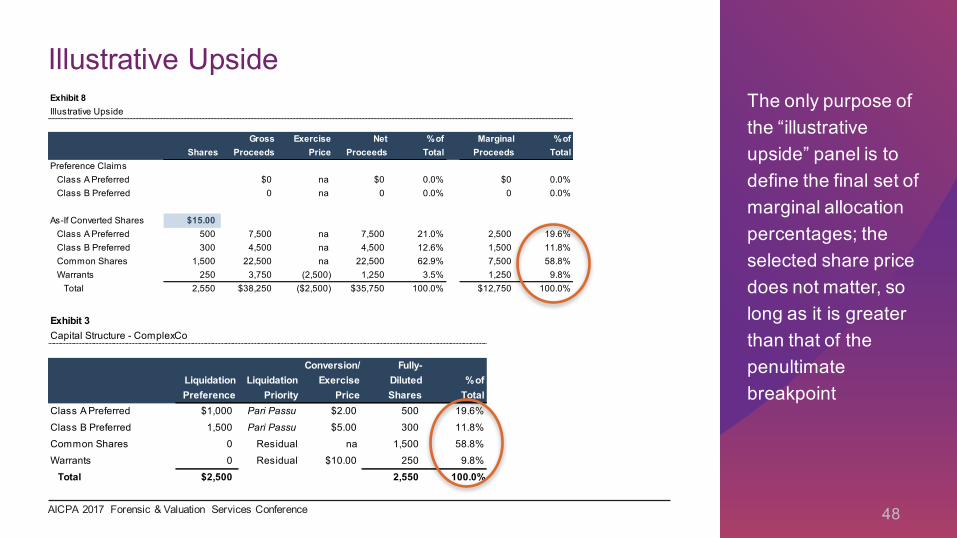
Illustrative UpsideThe only purpose of the “illustrative upside” panel is to define the final set of marginal allocation percentages; the selected share price does not matter, so long as it is greater than that of the penultimate breakpoint
Exhibit 8Illustrative Upside
Gross Exercise Net % of Marginal % ofShares Proceeds Price Proceeds Total Proceeds Total
Preference ClaimsClass A Preferred $0 na $0 0.0% $0 0.0%Class B Preferred 0 na 0 0.0% 0 0.0%
As-If Converted Shares $15.00Class A Preferred 500 7,500 na 7,500 21.0% 2,500 19.6%Class B Preferred 300 4,500 na 4,500 12.6% 1,500 11.8%Common Shares 1,500 22,500 na 22,500 62.9% 7,500 58.8%Warrants 250 3,750 (2,500) 1,250 3.5% 1,250 9.8%
Total 2,550 $38,250 ($2,500) $35,750 100.0% $12,750 100.0%
AICPA 2017 Forensic & Valuation Services Conference 47
Illustrative UpsideThe only purpose of the “illustrative upside” panel is to define the final set of marginal allocation percentages; the selected share price does not matter, so long as it is greater than that of the penultimate breakpoint
Exhibit 8Illustrative Upside
Gross Exercise Net % of Marginal % ofShares Proceeds Price Proceeds Total Proceeds Total
Preference ClaimsClass A Preferred $0 na $0 0.0% $0 0.0%Class B Preferred 0 na 0 0.0% 0 0.0%
As-If Converted Shares $15.00Class A Preferred 500 7,500 na 7,500 21.0% 2,500 19.6%Class B Preferred 300 4,500 na 4,500 12.6% 1,500 11.8%Common Shares 1,500 22,500 na 22,500 62.9% 7,500 58.8%Warrants 250 3,750 (2,500) 1,250 3.5% 1,250 9.8%
Total 2,550 $38,250 ($2,500) $35,750 100.0% $12,750 100.0%
Exhibit 3Capital Structure - ComplexCo
Conversion/ Fully-Liquidation Liquidation Exercise Diluted % ofPreference Priority Price Shares Total
Class A Preferred $1,000 Pari Passu $2.00 500 19.6%Class B Preferred 1,500 Pari Passu $5.00 300 11.8%Common Shares 0 Residual na 1,500 58.8%Warrants 0 Residual $10.00 250 9.8%
Total $2,500 2,550 100.0%
AICPA 2017 Forensic & Valuation Services Conference 48

What is a “Tranche”?Exhibit 9Marginal Tranche Allocation Matrix
Tranche A Tranche B Tranche C Tranche D Tranche EUpper Breakpoint $2,500 $5,500 $11,500 $23,000 $35,750Lower Breakpoint $0 $2,500 $5,500 $11,500 $23,000
Tranche Width $2,500 $3,000 $6,000 $11,500 $12,750
Marginal AllocationsClass A Preferred 40.0% 0.0% 25.0% 21.7% 19.6%Class B Preferred 60.0% 0.0% 0.0% 13.0% 11.8%Common Shares 0.0% 100.0% 75.0% 65.2% 58.8%Warrants 0.0% 0.0% 0.0% 0.0% 9.8%
% of Marginal Proceeds from Breakpoint payoff tables
AICPA 2017 Forensic & Valuation Services Conference 49
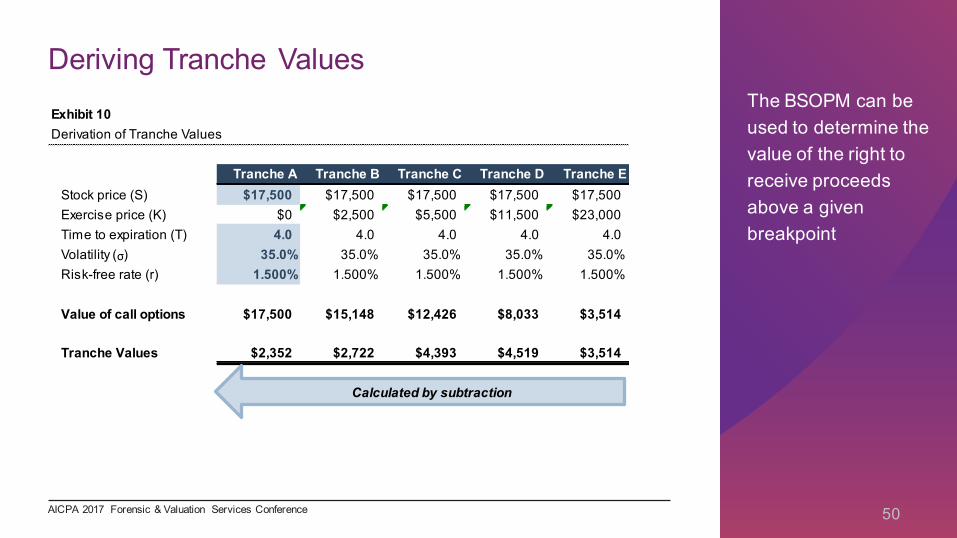
Deriving Tranche ValuesThe BSOPM can be used to determine the value of the right to receive proceeds above a given breakpoint
Exhibit 10Derivation of Tranche Values
Tranche A Tranche B Tranche C Tranche D Tranche EStock price (S) $17,500 $17,500 $17,500 $17,500 $17,500Exercise price (K) $0 $2,500 $5,500 $11,500 $23,000Time to expiration (T) 4.0 4.0 4.0 4.0 4.0Volatility (σ) 35.0% 35.0% 35.0% 35.0% 35.0%Risk-free rate (r) 1.500% 1.500% 1.500% 1.500% 1.500%
Value of call options $17,500 $15,148 $12,426 $8,033 $3,514
Tranche Values $2,352 $2,722 $4,393 $4,519 $3,514
Calculated by subtraction
AICPA 2017 Forensic & Valuation Services Conference 50
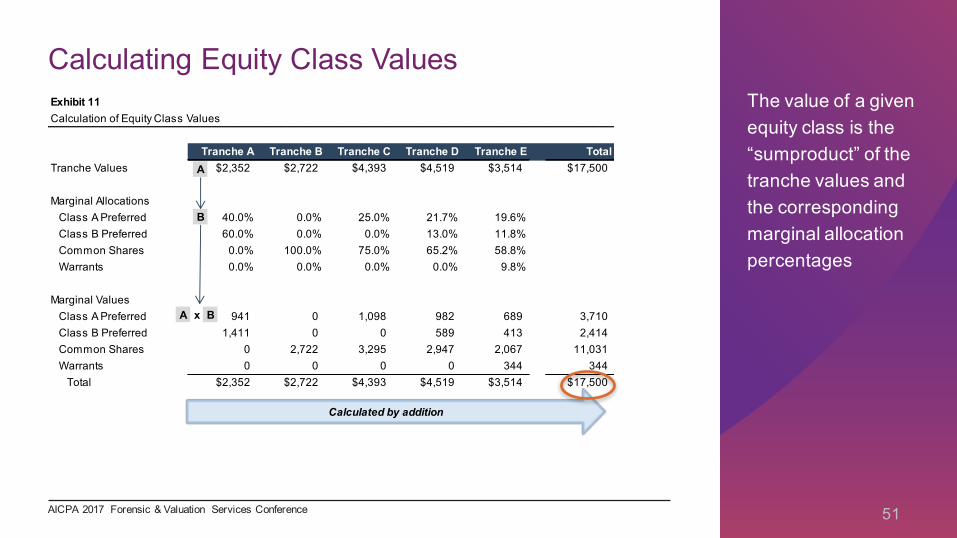
Calculating Equity Class ValuesThe value of a given equity class is the “sumproduct” of the tranche values and the corresponding marginal allocation percentages
Exhibit 11Calculation of Equity Class Values
Tranche A Tranche B Tranche C Tranche D Tranche E TotalTranche Values $2,352 $2,722 $4,393 $4,519 $3,514 $17,500
Marginal AllocationsClass A Preferred 40.0% 0.0% 25.0% 21.7% 19.6%Class B Preferred 60.0% 0.0% 0.0% 13.0% 11.8%Common Shares 0.0% 100.0% 75.0% 65.2% 58.8%Warrants 0.0% 0.0% 0.0% 0.0% 9.8%
Marginal ValuesClass A Preferred 941 0 1,098 982 689 3,710Class B Preferred 1,411 0 0 589 413 2,414Common Shares 0 2,722 3,295 2,947 2,067 11,031Warrants 0 0 0 0 344 344
Total $2,352 $2,722 $4,393 $4,519 $3,514 $17,500
A
B
BA x
Calculated by addition
AICPA 2017 Forensic & Valuation Services Conference 51

Calculating Per Share ValuesThe value per share is simply the quotient of the total value of the equity class and the number of shares outstanding
Exhibit 12Calculation of Per Share Values
Total Fully-Diluted Value perValue Shares Share
Class A Preferred $3,710 500 $7.42Class B Preferred $2,414 300 $8.05Common Shares $11,031 1,500 $7.35Warrants $344 250 $1.38
AICPA 2017 Forensic & Valuation Services Conference 52
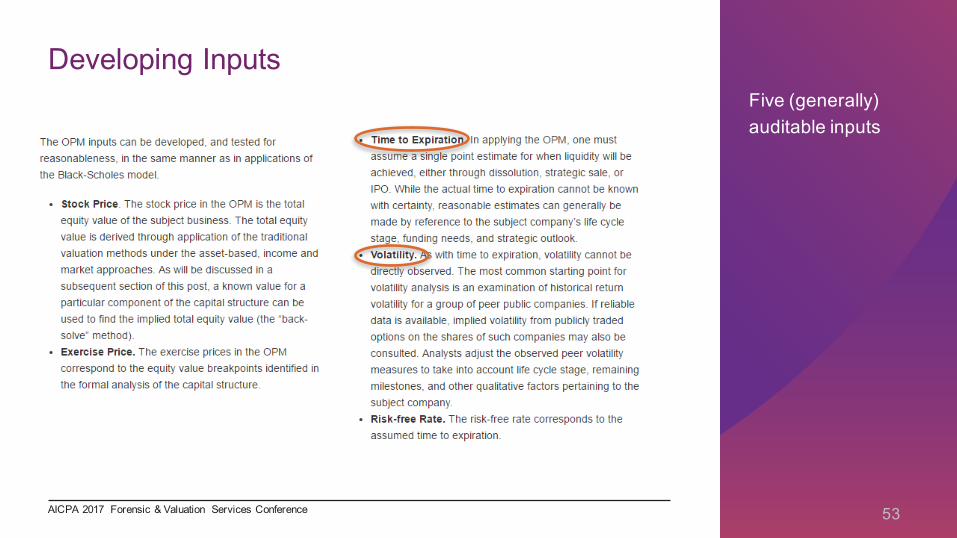
Developing InputsFive (generally) auditable inputs
AICPA 2017 Forensic & Valuation Services Conference 53
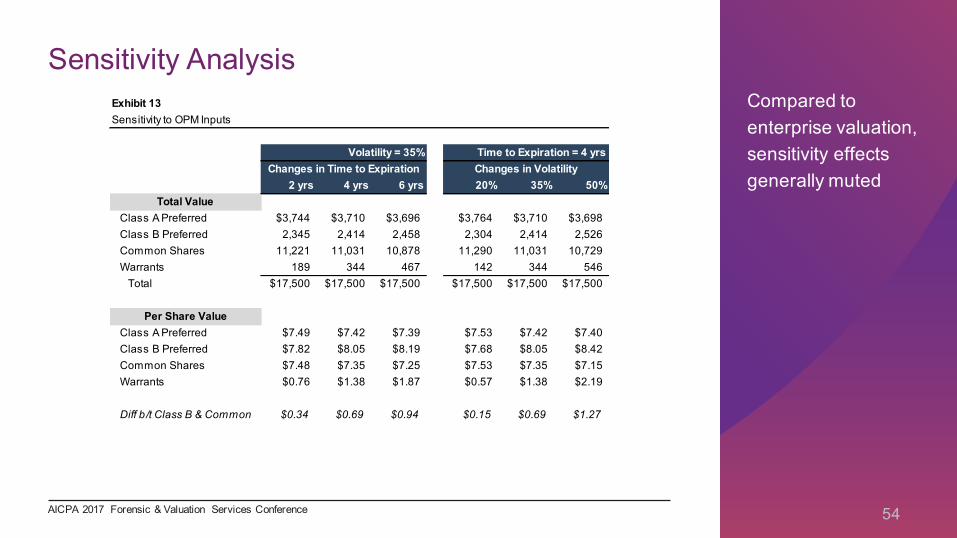
Sensitivity AnalysisCompared to enterprise valuation, sensitivity effects generally muted
Exhibit 13Sensitivity to OPM Inputs
Volatility = 35% Time to Expiration = 4 yrsChanges in Time to Expiration Changes in Volatility
2 yrs 4 yrs 6 yrs 20% 35% 50%Total Value
Class A Preferred $3,744 $3,710 $3,696 $3,764 $3,710 $3,698Class B Preferred 2,345 2,414 2,458 2,304 2,414 2,526Common Shares 11,221 11,031 10,878 11,290 11,031 10,729Warrants 189 344 467 142 344 546
Total $17,500 $17,500 $17,500 $17,500 $17,500 $17,500
Per Share ValueClass A Preferred $7.49 $7.42 $7.39 $7.53 $7.42 $7.40Class B Preferred $7.82 $8.05 $8.19 $7.68 $8.05 $8.42Common Shares $7.48 $7.35 $7.25 $7.53 $7.35 $7.15Warrants $0.76 $1.38 $1.87 $0.57 $1.38 $2.19
Diff b /t Class B & Common $0.34 $0.69 $0.94 $0.15 $0.69 $1.27
AICPA 2017 Forensic & Valuation Services Conference 54

Exhibit 15Comparison of OPM and PWERM
OPM PWERMRequired Assumptions In addition to the breakpoints and tranche
allocations dictated by the capital structure terms, requires only five inputs.
Requires more assumptions than the OPM. Analyst must specify amount, timing and probability of future liquidity events as well as dilution from future financing rounds and class-specific discount rates.
Sensitivity to Assumptions As shown in Exhibit 13, sensitivity for many classes is somewhat muted. Since the OPM is only an allocation method, the impact of changes in inputs on allocation is generally tame compared to that in typical valuation methods.
Since the PWERM is both a valuation and allocation method, sensitivity to changes in inputs is potentially greater than with OPM.
Flexibility / Adaptability Small number of required assumptions limits the flexibility and adaptability of the model. Cannot accomodate some common features of preferred shares such as mandatory conversion at IPO, IPO price guarantees and the like. The assumed lognormal distribution of outcomes may not be representative for many development-stage entities.
Can be readily adapted to unique features, such as price protection or ratchets. Offers the flexability to consider a range of potential future outcomes that more closely represent the market participant perspective than a lognormal distribution. Allows the analyst to consider outcomes at different times, and to model dilution from future funding rounds (even down rounds).
Transparency Host of intermediate calculations and lack of familiarity with breakpoint analysis on the part of many report users contribute to perception that method is a "black box".
Generally intuitive, allocation of proceeds for each discrete scenario is readily checked for conformity to governing documents.
Auditability While not necessarily intuitive for non-specialists, small number of assumptions and translation of governing documents to formal structure of model is highly auditable.
While the required inputs correlate to assumptions that market participants actually make, convincing and documentable support for these estimates may prove elusive.
AICPA 2017 Forensic & Valuation Services Conference 55
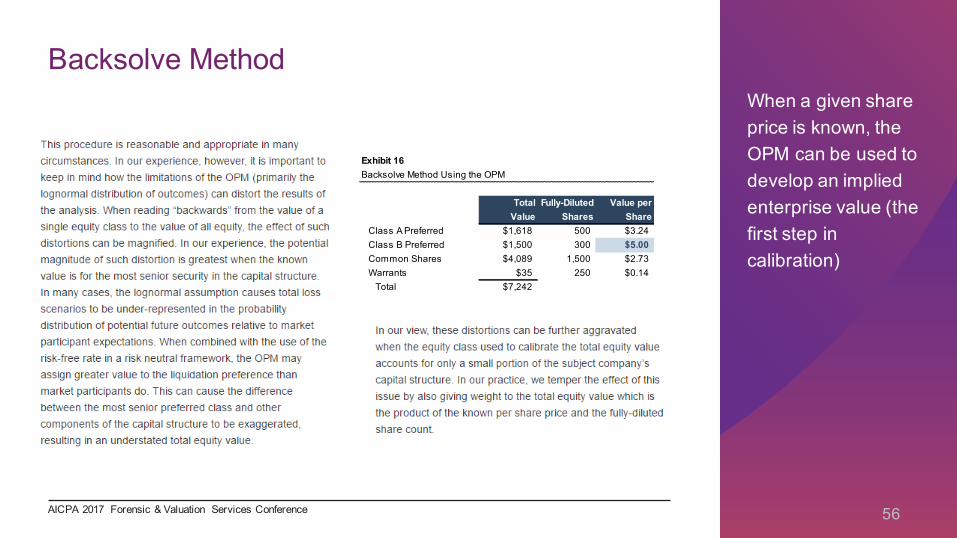
Backsolve MethodWhen a given share price is known, the OPM can be used to develop an implied enterprise value (the first step in calibration)
Exhibit 16Backsolve Method Using the OPM
Total Fully-Diluted Value perValue Shares Share
Class A Preferred $1,618 500 $3.24Class B Preferred $1,500 300 $5.00Common Shares $4,089 1,500 $2.73Warrants $35 250 $0.14
Total $7,242
AICPA 2017 Forensic & Valuation Services Conference 56

Questions?
AICPA 2017 Forensic & Valuation Services Conference 57

About the Speaker
Travis W. Harms, CFA, CPA/ABV, is Senior Vice President of Mercer Capital. He also leads the firm’s Financial Reporting Valuation Group and Private Equity industry team.
Travis’s practice focuses on providing public and private clients with fair value opinions and related assistance pertaining to goodwill and other intangible assets, stock-based compensation, and illiquid financial assets. Travis performs valuations used for tax compliance, ESOP compliance, and other purposes for clients in a wide range of industries.
Travis is also a frequent speaker on fair value accounting topics to audiences across the U.S. Travis is a member of The Appraisal Foundation’s working group to address best practices for control premiums. He co-authored the book Business Valuation: An Integrated Theory, Second Edition, and is a regular contributor to Mercer Capital’s Financial Reporting Blog.
Travis W. Harms, CFA, CPA/ABV Senior Vice President(901) [email protected]
AICPA 2017 Forensic & Valuation Services Conference 58


