Valuing Quarries & Mines
© 2013 Business Valuation Resources, LLC
© 2013 Business Valuation Resources, LLC
[email protected]
1
VALUING QUARRIES
& MINES
JUNE 2013
© 2013 Business Valuation Resources, LLC
[email protected]
• Today’s Presenters:
• Mike Nowobilski – President Mid-America Energy & Mining Services, Inc.
• Active in Mining Industry since 1976
• Mergers & Acquisitions and Valuations since 1990.
• BS Geology & MBA
• Dwight Davis - Principal Dwight Davis & Associates, PSC
• Active In Mining Industry Since 1977
• Mergers & Acquisitions, Market Analysis and Valuations since 1988
• BS Engineering
• Presentation’s Objectives:
Describe those factors which determine a Quarry’s or Mine’s profitability
(“Valuation Drivers”).
Discuss applicable valuation methodology employed by the mining industry.
2
OBJECTIVES
Valuing Quarries & Mines
© 2013 Business Valuation Resources, LLC
© 2013 Business Valuation Resources, LLC
[email protected]
DRIVERS OF VALUE
© 2013 Business Valuation Resources, LLC
[email protected]
4
OVERVIEW OF VALUE DRIVERS
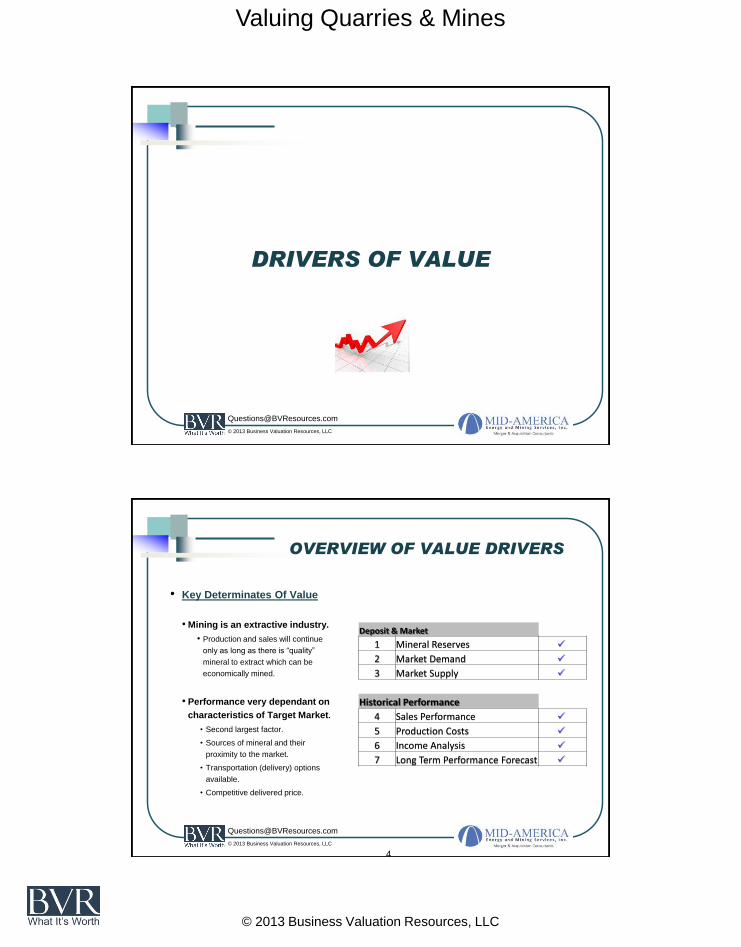
• Key Determinates Of Value
• Mining is an extractive industry.
• Production and sales will continue
only as long as there is “quality”
mineral to extract which can be
economically mined.
• Performance very dependant on
characteristics of Target Market.
• Second largest factor.
• Sources of mineral and their
proximity to the market.
• Transportation (delivery) options
available.
• Competitive delivered price.
Deposit & Market
1 Mineral Reserves
2 Market Demand
3 Market Supply
Historical Performance
4 Sales Performance
5 Production Costs
6 Income Analysis
7 Long Term Performance Forecast
Valuing Quarries & Mines
© 2013 Business Valuation Resources, LLC
© 2013 Business Valuation Resources, LLC
[email protected]
ILLUSTRATE
DRIVERS OF VALUE
VIA
CONSTRUCTION AGGREGATES
INDUSTRY
© 2013 Business Valuation Resources, LLC
[email protected]
6
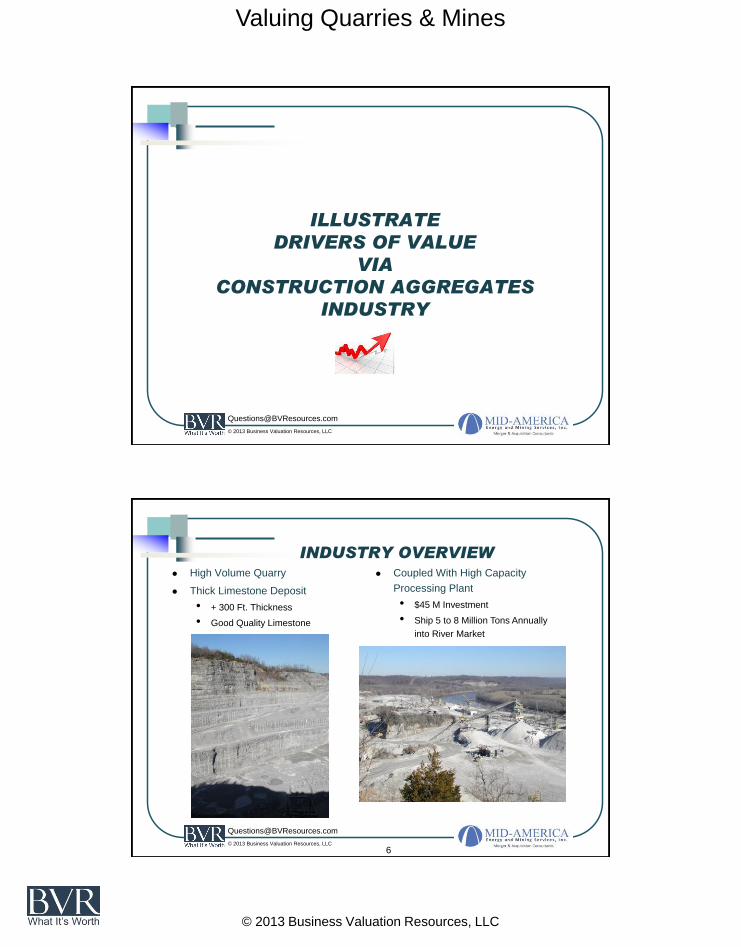
INDUSTRY OVERVIEW High Volume Quarry
Thick Limestone Deposit
• + 300 Ft. Thickness
• Good Quality Limestone
Coupled With High Capacity
Processing Plant
• $45 M Investment
• Ship 5 to 8 Million Tons Annually
into River Market
Valuing Quarries & Mines
© 2013 Business Valuation Resources, LLC
© 2013 Business Valuation Resources, LLC
[email protected]
7
INDUSTRY OVERVIEW
• Much Smaller Processing Plant
• Equipment value of $350,000
• Ships +/- 100,000 tons annually into the
local market
•The “NORM”
•Thinner Limestone Deposit
• +/- 100 Ft. Thick
• Good Quality Limestone
© 2013 Business Valuation Resources, LLC
[email protected]
8
INDUSTRY OVERVIEW
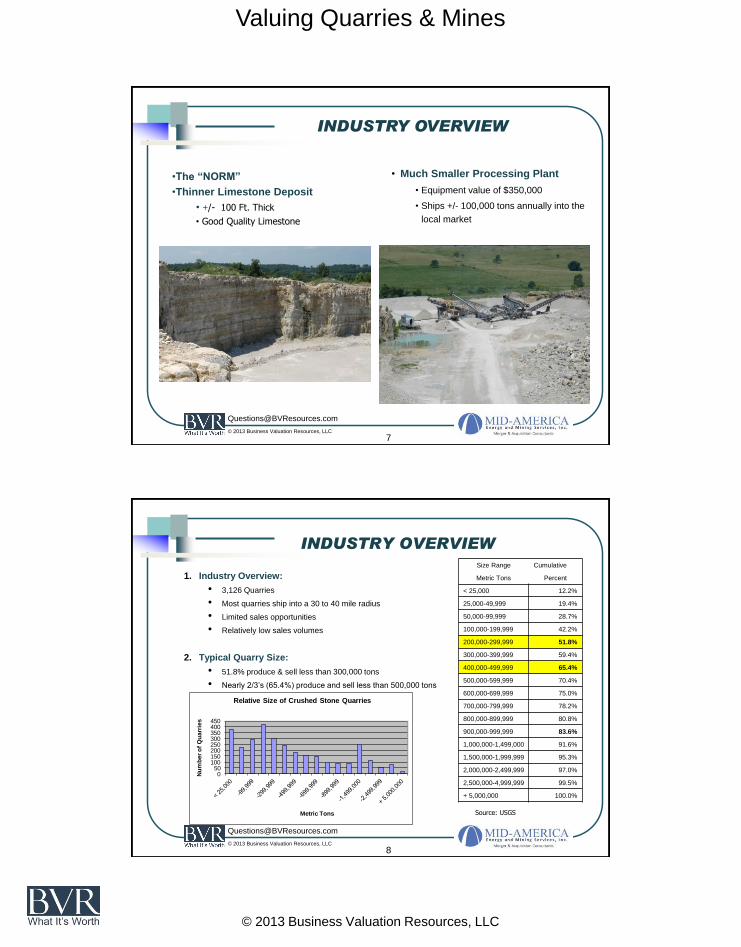
1. Industry Overview:
• 3,126 Quarries
• Most quarries ship into a 30 to 40 mile radius
• Limited sales opportunities
• Relatively low sales volumes
2. Typical Quarry Size:
• 51.8% produce & sell less than 300,000 tons
• Nearly 2/3’s (65.4%) produce and sell less than 500,000 tons
Size Range Cumulative
Metric Tons Percent
< 25,000 12.2%
25,000-49,999 19.4%
50,000-99,999 28.7%
100,000-199,999 42.2%
200,000-299,999 51.8%
300,000-399,999 59.4%
400,000-499,999 65.4%
500,000-599,999 70.4%
600,000-699,999 75.0%
700,000-799,999 78.2%
800,000-899,999 80.8%
900,000-999,999 83.6%
1,000,000-1,499,000 91.6%
1,500,000-1,999,999 95.3%
2,000,000-2,499,999 97.0%
2,500,000-4,999,999 99.5%
+ 5,000,000 100.0%
050
100150200250300350400450
Nu
mb
er
of
Qu
arr
ies
Metric Tons
Relative Size of Crushed Stone Quarries
Source: USGS
Valuing Quarries & Mines
© 2013 Business Valuation Resources, LLC
© 2013 Business Valuation Resources, LLC
[email protected]
#1. MINERAL RESERVES
Deposit & Market
1 Mineral Reserves
2 Market Demand
3 Market Supply
© 2013 Business Valuation Resources, LLC
[email protected]
10
#1. MINERAL RESERVES
• Definition: Economically mineable part of a Measured and/ or Indicated Mineral Resource;
Focus on Mineable with Current Technology and Merchantable at a Reasonable Profit.
• Control: Owned, Leased, Sublease; Zoned or Capable of Being Zoned; Permitted or Capable of
Being Permitted. Option can not be considered as control.
• Classification: Consist of: 1) Proven Reserves has been confirmed by adequate exploration
and testing to confirm geologic and grade continuity and 2) Probable Reserves can be estimated
with a reasonable level of confidence. Does not consist of Resource generally believed to occur
with reasonable prospects for eventual extraction
• Quantity (Mine Life): Size, thickness, shape, depth, mineral content well established and
determined to meet both mineable and merchantable criteria
• Quality: Reserves broken out by appropriate sales criteria; i.e. A Rock, B Rock, C Rock based
on state approval parameters and testing of each and every ledge.
• Cost Structure: Variability across property, overburden increase or decrease, changes of
mining conditions or costs.
• Sufficiency of Reserves: Usually 20 – 25 year minimum mine life
Valuing Quarries & Mines
© 2013 Business Valuation Resources, LLC
© 2013 Business Valuation Resources, LLC
[email protected]
11
#1. MINERAL RESERVES
Reserves Defined by Prior Drilling
• Area East of E, C, G has been previously mined (Active Pit)
• Areas West shows more overburden and thinner limestone thickness
© 2013 Business Valuation Resources, LLC
[email protected]
12
#1. MINERAL RESERVES
Reserve Classification
• Areas in Yellow are Owned Proven Reserves; separated by Prairie Ditch (non-mineable
and access issues)
• Area in Purple is Probable Reserves; no drilling info and late in mine plan
• Resource (general geologic knowledge but not measured)
Valuing Quarries & Mines
© 2013 Business Valuation Resources, LLC
© 2013 Business Valuation Resources, LLC
[email protected]
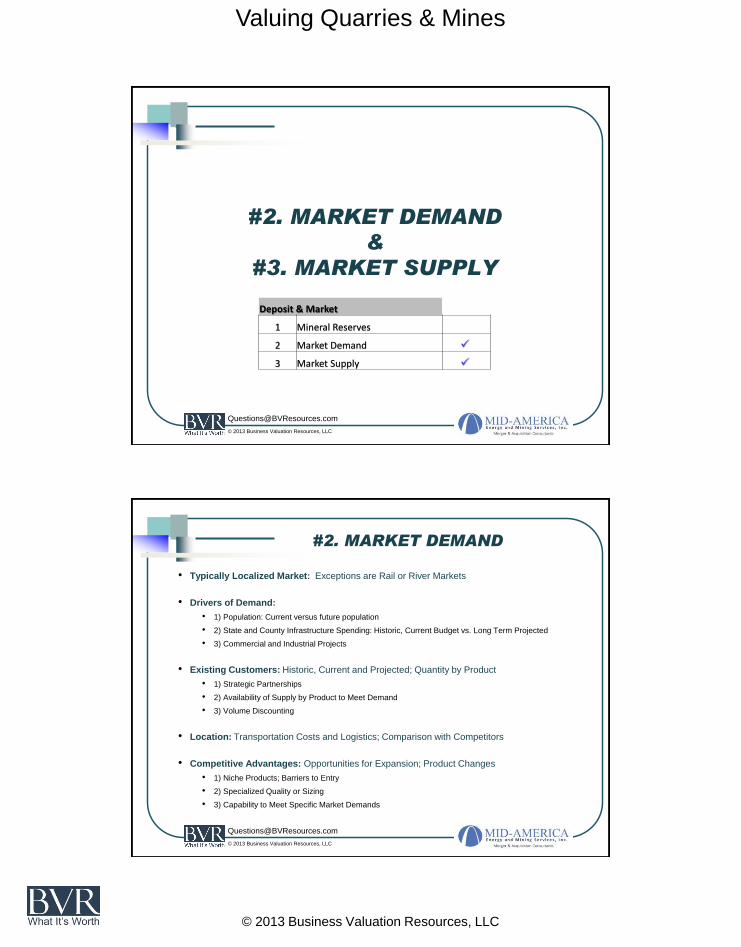
#2. MARKET DEMAND
&
#3. MARKET SUPPLY
Deposit & Market
1 Mineral Reserves
2 Market Demand
3 Market Supply
© 2013 Business Valuation Resources, LLC
[email protected]
#2. MARKET DEMAND
• Typically Localized Market: Exceptions are Rail or River Markets
• Drivers of Demand:
• 1) Population: Current versus future population
• 2) State and County Infrastructure Spending: Historic, Current Budget vs. Long Term Projected
• 3) Commercial and Industrial Projects
• Existing Customers: Historic, Current and Projected; Quantity by Product
• 1) Strategic Partnerships
• 2) Availability of Supply by Product to Meet Demand
• 3) Volume Discounting
• Location: Transportation Costs and Logistics; Comparison with Competitors
• Competitive Advantages: Opportunities for Expansion; Product Changes
• 1) Niche Products; Barriers to Entry
• 2) Specialized Quality or Sizing
• 3) Capability to Meet Specific Market Demands
Valuing Quarries & Mines
© 2013 Business Valuation Resources, LLC
© 2013 Business Valuation Resources, LLC
[email protected]
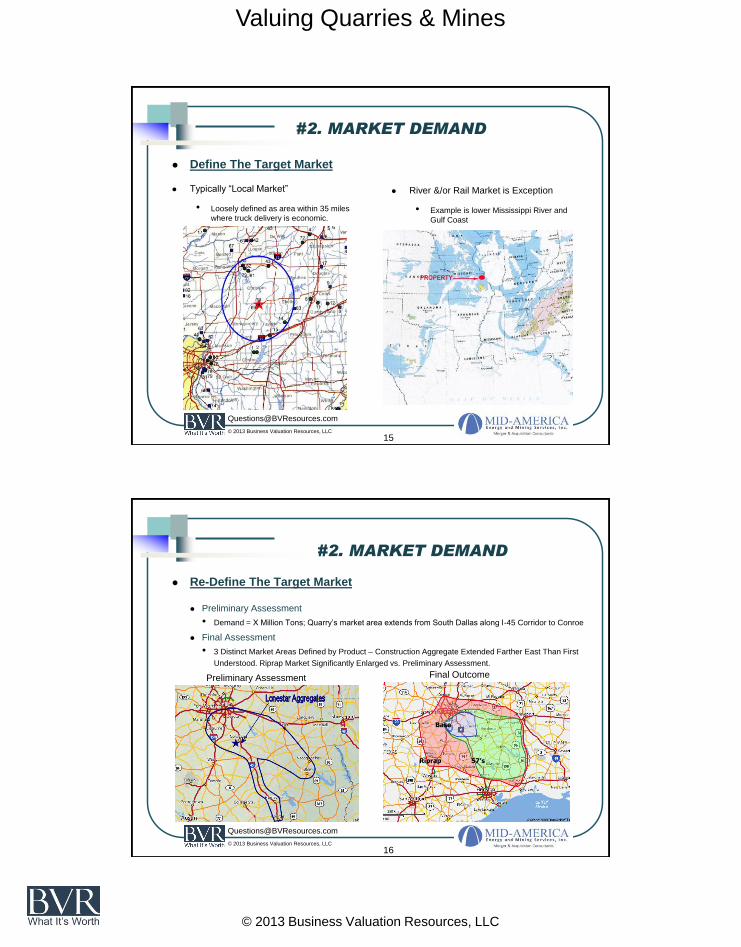
#2. MARKET DEMAND
Define The Target Market
Typically “Local Market”
• Loosely defined as area within 35 miles
where truck delivery is economic.
River &/or Rail Market is Exception
• Example is lower Mississippi River and
Gulf Coast
15
© 2013 Business Valuation Resources, LLC
[email protected]
16
#2. MARKET DEMAND
Re-Define The Target Market
Preliminary Assessment
• Demand = X Million Tons; Quarry’s market area extends from South Dallas along I-45 Corridor to Conroe
Final Assessment
• 3 Distinct Market Areas Defined by Product – Construction Aggregate Extended Farther East Than First
Understood. Riprap Market Significantly Enlarged vs. Preliminary Assessment.
Preliminary Assessment
Final Outcome
Riprap 57’s
Base
Valuing Quarries & Mines
© 2013 Business Valuation Resources, LLC
© 2013 Business Valuation Resources, LLC
[email protected]
17
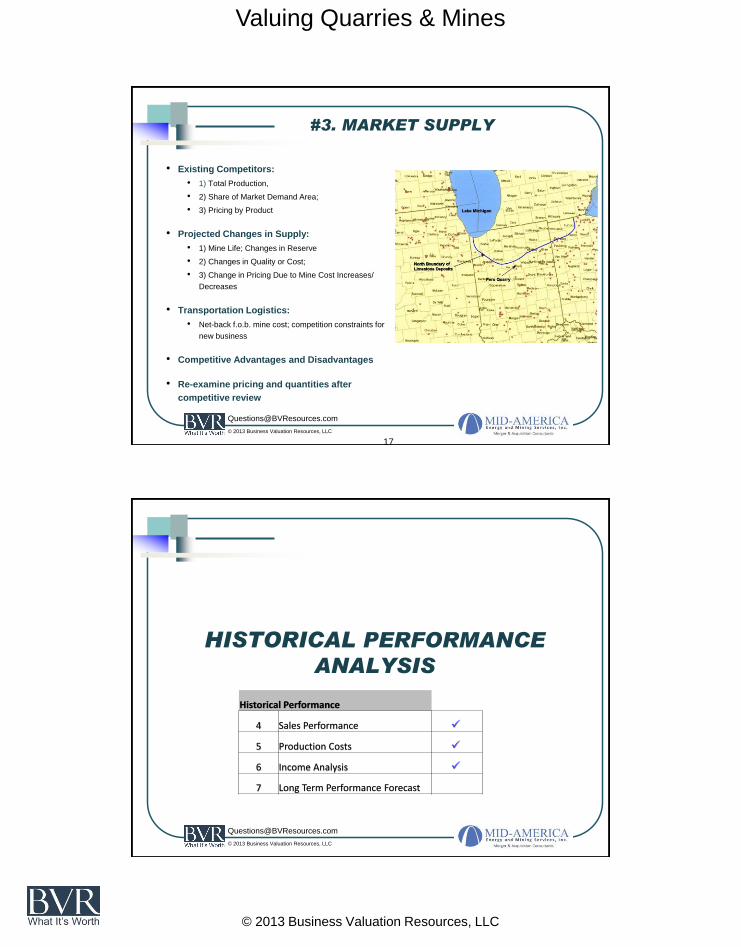
#3. MARKET SUPPLY
• Existing Competitors:
• 1) Total Production,
• 2) Share of Market Demand Area;
• 3) Pricing by Product
• Projected Changes in Supply:
• 1) Mine Life; Changes in Reserve
• 2) Changes in Quality or Cost;
• 3) Change in Pricing Due to Mine Cost Increases/
Decreases
• Transportation Logistics:
• Net-back f.o.b. mine cost; competition constraints for
new business
• Competitive Advantages and Disadvantages
• Re-examine pricing and quantities after
competitive review
© 2013 Business Valuation Resources, LLC
[email protected]
HISTORICAL PERFORMANCE
ANALYSIS
Historical Performance
4 Sales Performance
5 Production Costs
6 Income Analysis
7 Long Term Performance Forecast
Valuing Quarries & Mines
© 2013 Business Valuation Resources, LLC
© 2013 Business Valuation Resources, LLC
[email protected]
• General Rule of Thumb
• Four years of information:
• Balance Sheets, Income Statements & Cash Flow Statements
• Internal Statements
• Plus Audited Financials / Reviewed Financials / Compiled Financials
• Tax Returns
• Sales Information
• Equipment Lists
Objective: Defendable Historical Financials = Defendable Profits/ Cash Flows
• Key Point #1: Recast Sales Revenues & Expenses
• Key Point #2: Eliminate Financing Expenses.
• Assume business and/or assets are sold “Free & Clear of All Liens & Encumbrances”.
19
HISTORICAL PERFORMANCE
OVERVIEW
© 2013 Business Valuation Resources, LLC
[email protected]
20
#4. SALES PERFORMANCE
• General Rule of Thumb
• Four years of information:
• Annual Sales Volumes (Tons, Units)
• Annual Sales Revenues
• Average Annual Unit Sales Prices (any price increases?)
• Top 10 Customers’ Sales Detail By Year
• Objective
• Determine Sales Trends
• Growing, stagnant, or declining sales volumes
• Ability to increase sales prices.
• Basis (Justification) For Sales Forecast
Valuing Quarries & Mines
© 2013 Business Valuation Resources, LLC
© 2013 Business Valuation Resources, LLC
[email protected]
21
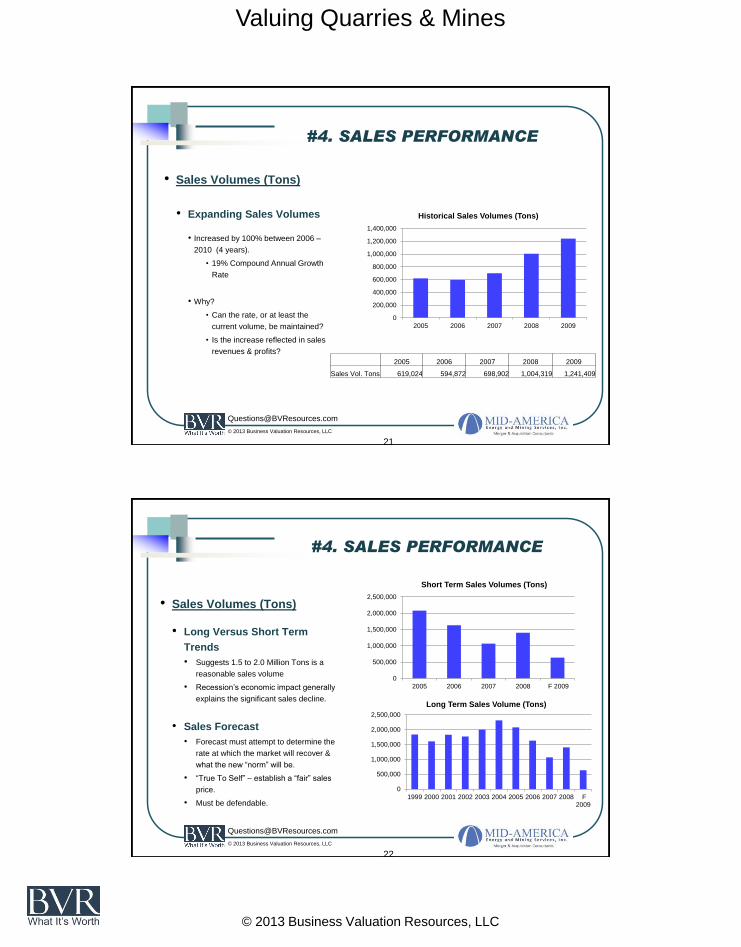
#4. SALES PERFORMANCE
• Sales Volumes (Tons)
• Expanding Sales Volumes
• Increased by 100% between 2006 –
2010 (4 years).
• 19% Compound Annual Growth
Rate
• Why?
• Can the rate, or at least the
current volume, be maintained?
• Is the increase reflected in sales
revenues & profits?
0
200,000
400,000
600,000
800,000
1,000,000
1,200,000
1,400,000
2005 2006 2007 2008 2009
Historical Sales Volumes (Tons)
2005 2006 2007 2008 2009
Sales Vol. Tons 619,024 594,872 698,902 1,004,319 1,241,409
© 2013 Business Valuation Resources, LLC
[email protected]
22
#4. SALES PERFORMANCE
• Sales Volumes (Tons)
• Long Versus Short Term
Trends
• Suggests 1.5 to 2.0 Million Tons is a
reasonable sales volume
• Recession’s economic impact generally
explains the significant sales decline.
• Sales Forecast
• Forecast must attempt to determine the
rate at which the market will recover &
what the new “norm” will be.
• “True To Self” – establish a “fair” sales
price.
• Must be defendable.
0
500,000
1,000,000
1,500,000
2,000,000
2,500,000
2005 2006 2007 2008 F 2009
Short Term Sales Volumes (Tons)
0
500,000
1,000,000
1,500,000
2,000,000
2,500,000
1999 2000 2001 2002 2003 2004 2005 2006 2007 2008 F2009
Long Term Sales Volume (Tons)
Valuing Quarries & Mines
© 2013 Business Valuation Resources, LLC
© 2013 Business Valuation Resources, LLC
[email protected]
23
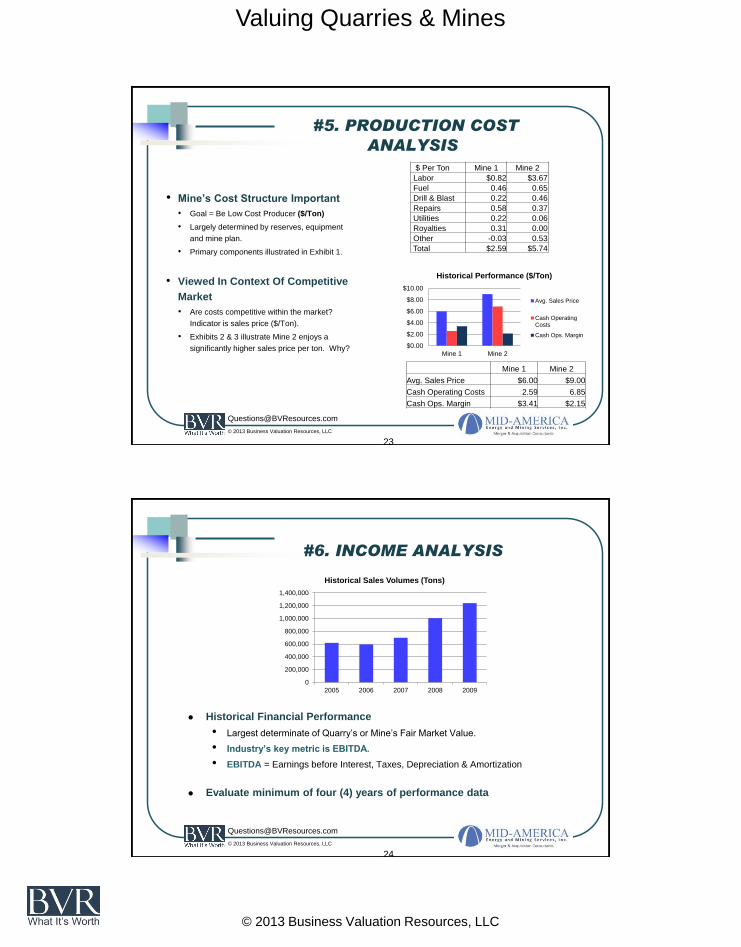
#5. PRODUCTION COST
ANALYSIS
• Mine’s Cost Structure Important
• Goal = Be Low Cost Producer ($/Ton)
• Largely determined by reserves, equipment
and mine plan.
• Primary components illustrated in Exhibit 1.
• Viewed In Context Of Competitive
Market
• Are costs competitive within the market?
Indicator is sales price ($/Ton).
• Exhibits 2 & 3 illustrate Mine 2 enjoys a
significantly higher sales price per ton. Why?
$ Per Ton Mine 1 Mine 2
Labor $0.82 $3.67
Fuel 0.46 0.65
Drill & Blast 0.22 0.46
Repairs 0.58 0.37
Utilities 0.22 0.06
Royalties 0.31 0.00
Other -0.03 0.53
Total $2.59 $5.74
$0.00
$2.00
$4.00
$6.00
$8.00
$10.00
Mine 1 Mine 2
Historical Performance ($/Ton)
Avg. Sales Price
Cash OperatingCosts
Cash Ops. Margin
Mine 1 Mine 2
Avg. Sales Price $6.00 $9.00
Cash Operating Costs 2.59 6.85
Cash Ops. Margin $3.41 $2.15
© 2013 Business Valuation Resources, LLC
[email protected]
24
#6. INCOME ANALYSIS
Historical Financial Performance
• Largest determinate of Quarry’s or Mine’s Fair Market Value.
• Industry’s key metric is EBITDA.
• EBITDA = Earnings before Interest, Taxes, Depreciation & Amortization
Evaluate minimum of four (4) years of performance data
0
200,000
400,000
600,000
800,000
1,000,000
1,200,000
1,400,000
2005 2006 2007 2008 2009
Historical Sales Volumes (Tons)
Valuing Quarries & Mines
© 2013 Business Valuation Resources, LLC
© 2013 Business Valuation Resources, LLC
[email protected]
25
#6. INCOME ANALYSIS
Recast Financial Performance
• Key Observations:
• Sales Revenues increase $3.4 million (+95%)
• Profits (EBITDA) increase $2.6 million (+254%).
• Question ability to maintain growth trajectory.
• Key Observations ($/Ton):
• Sales Revenues decline - $0.17 per ton.
• Cash Operating Costs decline - $1.08 per ton.
• Profits Increase:
• Cash Operating Margin + $0.91 per ton.
• EBITDA + $1.28 per ton.
• Question ability to maintain cost improvements.
$0
$1,000,000
$2,000,000
$3,000,000
$4,000,000
$5,000,000
$6,000,000
$7,000,000
$8,000,000
2005 2006 2007 2008 2009
Historical Financial Performance
Revenues
Cash Ops. Margin
EBITDA
EBIT
$0.00
$1.00
$2.00
$3.00
$4.00
$5.00
$6.00
$7.00
2005 2006 2007 2008 2009
Historical Financial Performance ($/Ton)
Revenues
Cash Ops. Margin
EBITDA
EBIT
© 2013 Business Valuation Resources, LLC
[email protected]
#6. INCOME ANALYSIS
26
2005 2006 2007 2008 2009
Sales Tons 619,024 594,872 698,902 1,004,319 1,241,409
Sales $3,596,670 $3,547,811 $4,207,470 $5,734,813 $7,001,827
Cash Ops. Costs 2,025,896 1,798,128 2,182,725 2,606,111 2,713,197
Cash Ops. Margin $1,570,774 $1,749,683 $2,024,745 $3,128,702 $4,288,630
SG&A 541,497 557,089 576,267 728,157 642,468
EBITDA $1,029,277 $1,192,594 $1,448,478 $2,400,545 $3,646,162
% Sales 28.6% 33.6% 34.4% 41.9% 52.1%
Non Cash 485,227 607,780 592,329 679,279 540,974
EBIT $544,050 $584,814 $856,149 $1,721,266 $3,105,188
% Sales 15.1% 16.5% 20.3% 30.0% 44.3%
• Recast Financial Summary
• EBITDA Trend: EBITDA increased $2.7 million, or 173 percent (173%) during five
year period.
• Recast Performance: Recast sales revenues, operations costs and SG&A expenses.
Valuing Quarries & Mines
© 2013 Business Valuation Resources, LLC
© 2013 Business Valuation Resources, LLC
[email protected]
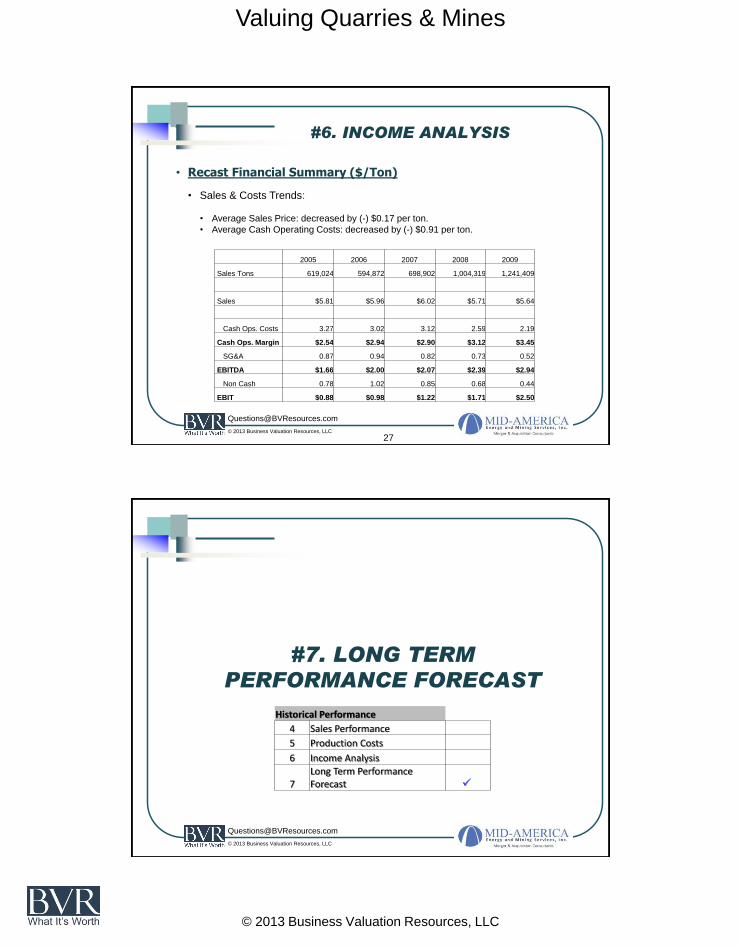
#6. INCOME ANALYSIS
27
2005 2006 2007 2008 2009
Sales Tons 619,024 594,872 698,902 1,004,319 1,241,409
Sales $5.81 $5.96 $6.02 $5.71 $5.64
Cash Ops. Costs 3.27 3.02 3.12 2.59 2.19
Cash Ops. Margin $2.54 $2.94 $2.90 $3.12 $3.45
SG&A 0.87 0.94 0.82 0.73 0.52
EBITDA $1.66 $2.00 $2.07 $2.39 $2.94
Non Cash 0.78 1.02 0.85 0.68 0.44
EBIT $0.88 $0.98 $1.22 $1.71 $2.50
• Recast Financial Summary ($/Ton)
• Sales & Costs Trends:
• Average Sales Price: decreased by (-) $0.17 per ton.
• Average Cash Operating Costs: decreased by (-) $0.91 per ton.
© 2013 Business Valuation Resources, LLC
[email protected]
#7. LONG TERM
PERFORMANCE FORECAST
Historical Performance
4 Sales Performance
5 Production Costs
6 Income Analysis
7 Long Term Performance Forecast
Valuing Quarries & Mines
© 2013 Business Valuation Resources, LLC
© 2013 Business Valuation Resources, LLC
[email protected]
29
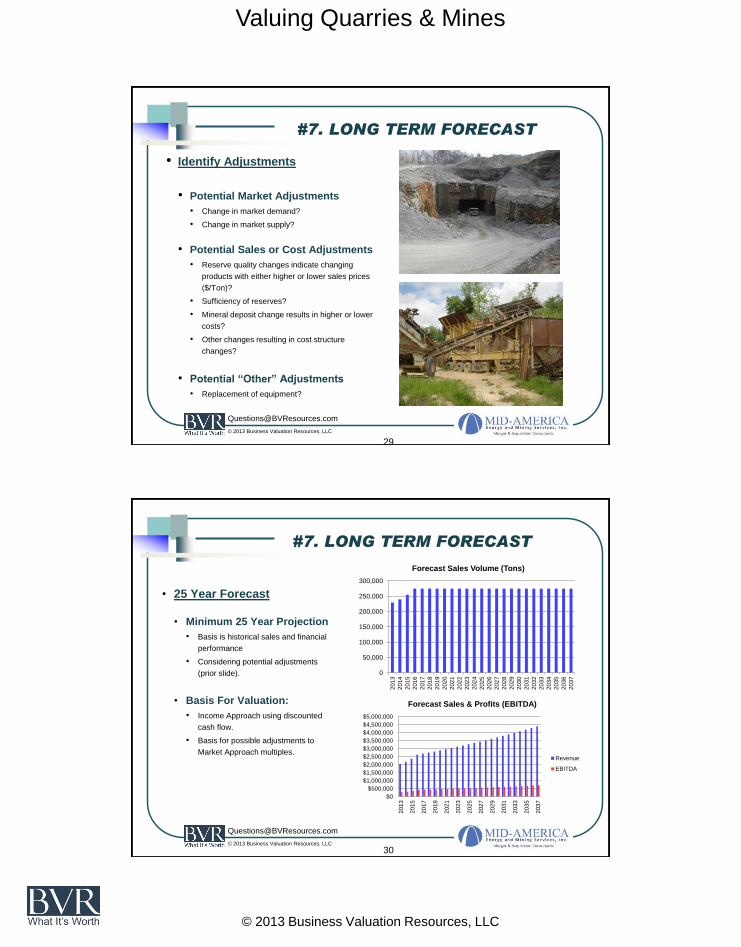
#7. LONG TERM FORECAST
• Identify Adjustments
• Potential Market Adjustments
• Change in market demand?
• Change in market supply?
• Potential Sales or Cost Adjustments
• Reserve quality changes indicate changing
products with either higher or lower sales prices
($/Ton)?
• Sufficiency of reserves?
• Mineral deposit change results in higher or lower
costs?
• Other changes resulting in cost structure
changes?
• Potential “Other” Adjustments
• Replacement of equipment?
© 2013 Business Valuation Resources, LLC
[email protected]
30
#7. LONG TERM FORECAST
• 25 Year Forecast
• Minimum 25 Year Projection
• Basis is historical sales and financial
performance
• Considering potential adjustments
(prior slide).
• Basis For Valuation:
• Income Approach using discounted
cash flow.
• Basis for possible adjustments to
Market Approach multiples.
0
50,000
100,000
150,000
200,000
250,000
300,000
201
3
201
4
201
5
201
6
201
7
201
8
201
9
202
0
202
1
202
2
202
3
202
4
202
5
202
6
202
7
202
8
202
9
203
0
203
1
203
2
203
3
203
4
203
5
203
6
203
7Forecast Sales Volume (Tons)
$0
$500,000
$1,000,000
$1,500,000
$2,000,000
$2,500,000
$3,000,000
$3,500,000
$4,000,000
$4,500,000
$5,000,000
201
3
201
5
201
7
201
9
202
1
202
3
202
5
202
7
202
9
203
1
203
3
203
5
203
7
Forecast Sales & Profits (EBITDA)
Revenue
EBITDA
Valuing Quarries & Mines
© 2013 Business Valuation Resources, LLC
© 2013 Business Valuation Resources, LLC
[email protected]
VALUING
THE QUARRY OR MINE
© 2013 Business Valuation Resources, LLC
[email protected]
• Textbook Definition of Business Value is:
American Society of Appraisers’ definition of fair market value is “the amount at which property
would change hands between a willing seller and a willing buyer when neither is acting under
compulsion and when both have reasonable knowledge of the relevant facts.”
• Three Primary Valuation Methods:
1. Income Approach
Valued As An On Going Concern
2. Market Approach
Valued As An On Going Concern
3. Asset Based Approach
Valued As Sum Of Asset Values
32
OVERVIEW
Valuing Quarries & Mines
© 2013 Business Valuation Resources, LLC
© 2013 Business Valuation Resources, LLC
[email protected]
33
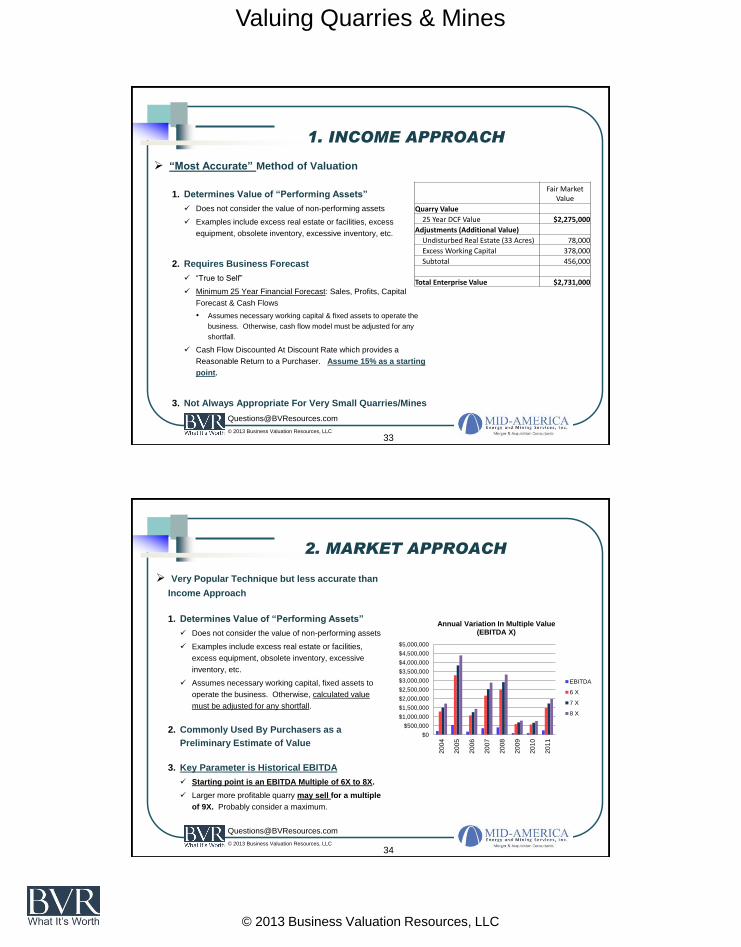
1. INCOME APPROACH
“Most Accurate” Method of Valuation
1. Determines Value of “Performing Assets”
Does not consider the value of non-performing assets
Examples include excess real estate or facilities, excess
equipment, obsolete inventory, excessive inventory, etc.
2. Requires Business Forecast
“True to Self”
Minimum 25 Year Financial Forecast: Sales, Profits, Capital
Forecast & Cash Flows
• Assumes necessary working capital & fixed assets to operate the
business. Otherwise, cash flow model must be adjusted for any
shortfall.
Cash Flow Discounted At Discount Rate which provides a
Reasonable Return to a Purchaser. Assume 15% as a starting
point.
3. Not Always Appropriate For Very Small Quarries/Mines
Fair Market
Value
Quarry Value
25 Year DCF Value $2,275,000
Adjustments (Additional Value)
Undisturbed Real Estate (33 Acres) 78,000
Excess Working Capital 378,000
Subtotal 456,000
Total Enterprise Value $2,731,000
© 2013 Business Valuation Resources, LLC
[email protected]
34
2. MARKET APPROACH
Very Popular Technique but less accurate than
Income Approach
1. Determines Value of “Performing Assets”
Does not consider the value of non-performing assets
Examples include excess real estate or facilities,
excess equipment, obsolete inventory, excessive
inventory, etc.
Assumes necessary working capital, fixed assets to
operate the business. Otherwise, calculated value
must be adjusted for any shortfall.
2. Commonly Used By Purchasers as a
Preliminary Estimate of Value
3. Key Parameter is Historical EBITDA
Starting point is an EBITDA Multiple of 6X to 8X.
Larger more profitable quarry may sell for a multiple
of 9X. Probably consider a maximum.
$0
$500,000
$1,000,000
$1,500,000
$2,000,000
$2,500,000
$3,000,000
$3,500,000
$4,000,000
$4,500,000
$5,000,000
20
04
20
05
20
06
20
07
20
08
20
09
20
10
20
11
Annual Variation In Multiple Value (EBITDA X)
EBITDA
6 X
7 X
8 X
Valuing Quarries & Mines
© 2013 Business Valuation Resources, LLC
© 2013 Business Valuation Resources, LLC
[email protected]
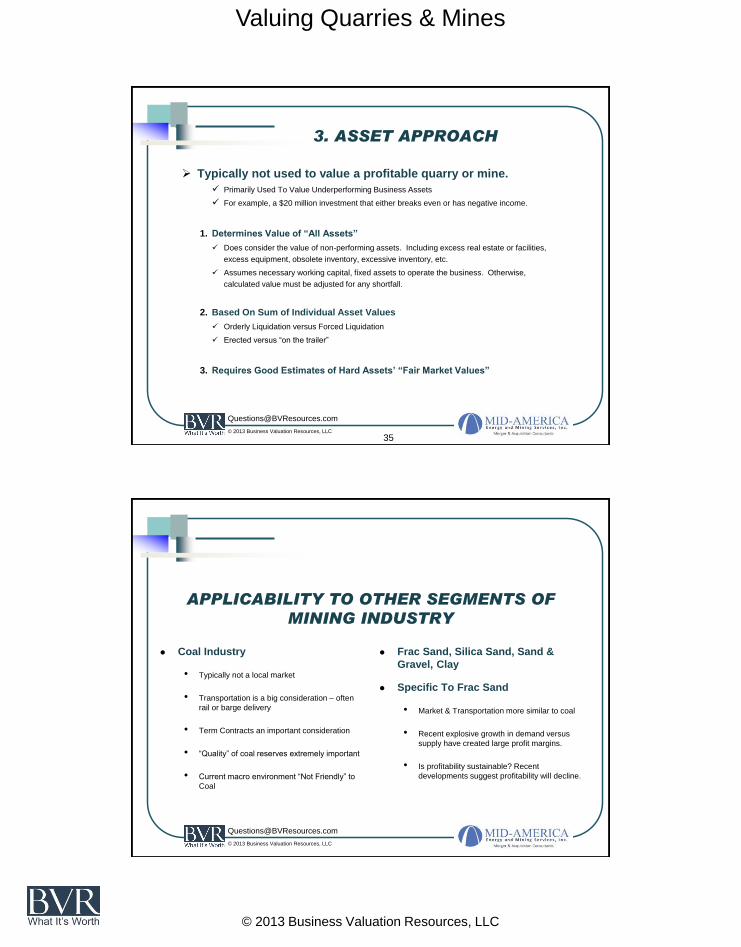
Typically not used to value a profitable quarry or mine.
Primarily Used To Value Underperforming Business Assets
For example, a $20 million investment that either breaks even or has negative income.
1. Determines Value of “All Assets”
Does consider the value of non-performing assets. Including excess real estate or facilities,
excess equipment, obsolete inventory, excessive inventory, etc.
Assumes necessary working capital, fixed assets to operate the business. Otherwise,
calculated value must be adjusted for any shortfall.
2. Based On Sum of Individual Asset Values
Orderly Liquidation versus Forced Liquidation
Erected versus “on the trailer”
3. Requires Good Estimates of Hard Assets’ “Fair Market Values”
35
3. ASSET APPROACH
© 2013 Business Valuation Resources, LLC
[email protected]
APPLICABILITY TO OTHER SEGMENTS OF
MINING INDUSTRY
Coal Industry
• Typically not a local market
• Transportation is a big consideration – often
rail or barge delivery
• Term Contracts an important consideration
• “Quality” of coal reserves extremely important
• Current macro environment “Not Friendly” to
Coal
Frac Sand, Silica Sand, Sand &
Gravel, Clay
Specific To Frac Sand
• Market & Transportation more similar to coal
• Recent explosive growth in demand versus
supply have created large profit margins.
• Is profitability sustainable? Recent
developments suggest profitability will decline.
Valuing Quarries & Mines
© 2013 Business Valuation Resources, LLC
© 2013 Business Valuation Resources, LLC
[email protected]
37
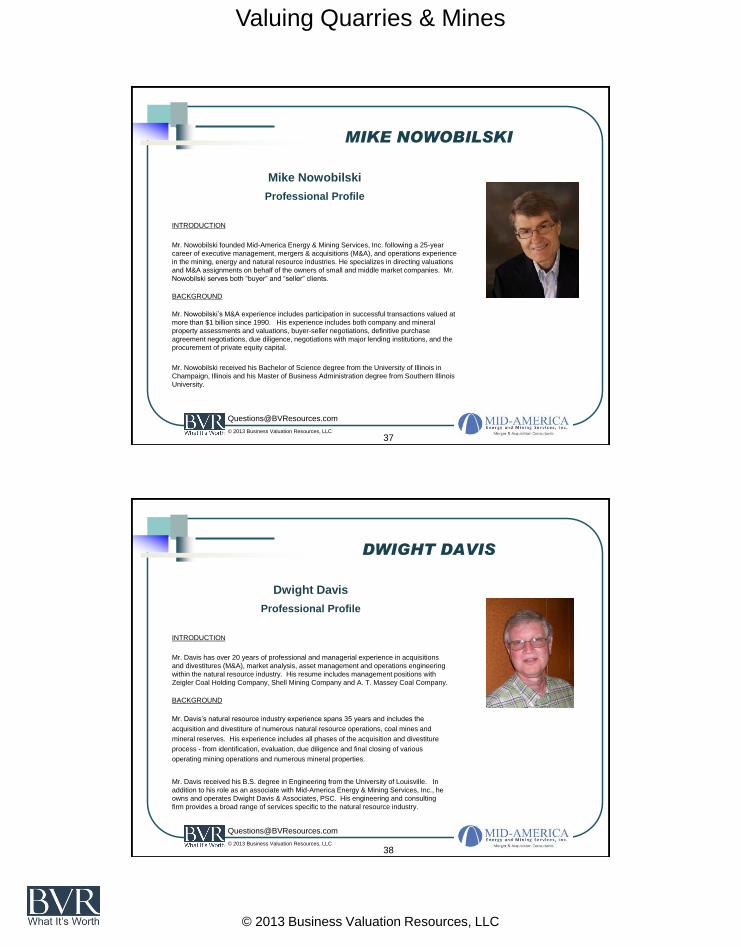
MIKE NOWOBILSKI
Mike Nowobilski
Professional Profile
INTRODUCTION
Mr. Nowobilski founded Mid-America Energy & Mining Services, Inc. following a 25-year
career of executive management, mergers & acquisitions (M&A), and operations experience
in the mining, energy and natural resource industries. He specializes in directing valuations
and M&A assignments on behalf of the owners of small and middle market companies. Mr.
Nowobilski serves both “buyer” and “seller” clients.
BACKGROUND
Mr. Nowobilski’s M&A experience includes participation in successful transactions valued at
more than $1 billion since 1990. His experience includes both company and mineral
property assessments and valuations, buyer-seller negotiations, definitive purchase
agreement negotiations, due diligence, negotiations with major lending institutions, and the
procurement of private equity capital.
Mr. Nowobilski received his Bachelor of Science degree from the University of Illinois in
Champaign, Illinois and his Master of Business Administration degree from Southern Illinois
University.
© 2013 Business Valuation Resources, LLC
[email protected]
38
DWIGHT DAVIS
Dwight Davis
Professional Profile
INTRODUCTION
Mr. Davis has over 20 years of professional and managerial experience in acquisitions
and divestitures (M&A), market analysis, asset management and operations engineering
within the natural resource industry. His resume includes management positions with
Zeigler Coal Holding Company, Shell Mining Company and A. T. Massey Coal Company.
BACKGROUND
Mr. Davis’s natural resource industry experience spans 35 years and includes the
acquisition and divestiture of numerous natural resource operations, coal mines and
mineral reserves. His experience includes all phases of the acquisition and divestiture
process - from identification, evaluation, due diligence and final closing of various
operating mining operations and numerous mineral properties.
Mr. Davis received his B.S. degree in Engineering from the University of Louisville. In
addition to his role as an associate with Mid-America Energy & Mining Services, Inc., he
owns and operates Dwight Davis & Associates, PSC. His engineering and consulting
firm provides a broad range of services specific to the natural resource industry.