10 :: 2005 Annual Technical Report 2005 VAMP SUMMARY Generally wet conditions in the San Joaquin River basin and tributary basins resulted in relatively high flow conditions entering the Spring of 2005. Due to these high flows DWR was unable to install the temporary Head of Old River Barrier (HORB). Additionally, the flow in the San Joaquin River at Vernalis exceeded the maximum VAMP target flow of 7,000 cfs during the VAMP pulse flow period, therefore no supplemental water was provided by the SJRGA agencies. The planning and implementation process for the VAMP operation remained nearly unchanged from those of prior VAMP years and that outlined in the SJRA. Daily operation plans were updated on a frequent basis to keep the SJRTC informed of changed conditions. Operation conference calls were not conducted during the 2005 VAMP but contact was maintained with the operating entities to track reservoir releases. The Technical Committee placed an added emphasis on analyzing the flow and fish movement into Old River absent the HORB. Monitoring of real-time flow data was maintained throughout the planning and implementation phases. 2 VAMP Hydrologic Planning & Implementation Chapter 2 his section documents the planning and implementation undertaken by the Hydrology Group of the San Joaquin River Technical Committee (SJRTC) for the 2005 VAMP investigations. Implementation of VAMP is guided by the framework provided in the San Joaquin River Agreement (SJRA) and anticipated hydrologic conditions within the watershed. The Hydrology Group was established for the purpose of forecasting hydrologic conditions and for planning, coordinating, scheduling and implementing the flows required to meet the test flow target in the San Joaquin River near Vernalis. The Hydrology Group is also charged with exchanging information relevant to the forecasted flows, and coordinating with others in the SJRTC, in particular the Biology Group, responsible for planning and implementing the salmon smolt survival study. Participation in the Hydrology Group is open to all interested parties, with the core membership consisting of the designees of the agencies responsible for the water project operations that would be contributing flow to meet the target flow. In 2005, the agencies belonging to the Hydrology Group included: Merced Irrigation District (Merced), Turlock Irrigation District (TID), Modesto Irrigation District (MID), Oakdale Irrigation District (OID), South San Joaquin Irrigation District (SSJID), San Joaquin River Exchange Contractors (SJRECWA), and the U.S. Bureau of Reclamation (USBR). Though not a water provider, the California Department of Water Resources (DWR) was closely involved with the coordination of operations relating to the installation of the HORB and the planning of Delta exports consistent with the VAMP. T
Transcript
10 :: 2005 Annual Technical Report
2005 vamP SummaryGenerally wet conditions in the San Joaquin River basin and
tributary basins resulted in relatively high flow conditions
entering the Spring of 2005. Due to these high flows DWR
was unable to install the temporary Head of Old River
Barrier (HORB). Additionally, the flow in the San Joaquin
River at Vernalis exceeded the maximum VAMP target flow of
7,000 cfs during the VAMP pulse flow period, therefore no
supplemental water was provided by the SJRGA agencies.
The planning and implementation process for the VAMP
operation remained nearly unchanged from those of prior
VAMP years and that outlined in the SJRA. Daily operation
plans were updated on a frequent basis to keep the SJRTC
informed of changed conditions. Operation conference
calls were not conducted during the 2005 VAMP but
contact was maintained with the operating entities to track
reservoir releases. The Technical Committee placed an
added emphasis on analyzing the flow and fish movement
into Old River absent the HORB. Monitoring of real-time
flow data was maintained throughout the planning and
implementation phases.
2vamP Hydrologic Planning & implementation
Ch
ap
ter
2
his section documents the planning and implementation undertaken by the Hydrology Group of the San Joaquin River
Technical Committee (SJRTC) for the 2005 VAMP investigations. Implementation of VAMP is guided by the framework
provided in the San Joaquin River Agreement (SJRA) and anticipated hydrologic conditions within the watershed.
The Hydrology Group was established for the purpose of forecasting hydrologic conditions and for planning, coordinating,
scheduling and implementing the flows required to meet the test flow target in the San Joaquin River near Vernalis. The
Hydrology Group is also charged with exchanging information relevant to the forecasted flows, and coordinating with others
in the SJRTC, in particular the Biology Group, responsible for planning and implementing the salmon smolt survival study.
Participation in the Hydrology Group is open to all interested parties, with the core membership consisting of the designees
of the agencies responsible for the water project operations that would be contributing flow to meet the target flow. In
2005, the agencies belonging to the Hydrology Group included: Merced Irrigation District (Merced), Turlock Irrigation District
(TID), Modesto Irrigation District (MID), Oakdale Irrigation District (OID), South San Joaquin Irrigation District (SSJID), San
Joaquin River Exchange Contractors (SJRECWA), and the U.S. Bureau of Reclamation (USBR). Though not a water provider,
the California Department of Water Resources (DWR) was closely involved with the coordination of operations relating to the
installation of the HORB and the planning of Delta exports consistent with the VAMP.
T
Ch
ap
ter
2
2005 Annual Technical Report :: 11
vamP BacKGrOuND aND DEScriPtiONThis section provides information on the background and
description of the water operations and factors to be
considered when planning for the VAMP each year. Even
with the high flow conditions during 2005 these factors
continued to be considered in the planning process and
implementation.
The VAMP provides for a 31-day pulse flow (target flow) at
the Vernalis gage on the San Joaquin River (see Figure 2-1,
inside front cover) during the months of April and
May, along with a corresponding reduction in State Water
Project (SWP) and Central Valley Project (CVP) Sacramento-
San Joaquin Delta exports. The VAMP target flow and
reduced Delta export are determined based on a forecast
of the San Joaquin River flow that would occur during the
pulse flow period absent the VAMP (Existing Flow) as shown
in Table 2-1. The Existing Flow is defined in the SJRA as
“the forecasted flows in the San Joaquin River at Vernalis
during the Pulse Flow Period that would exist absent
the VAMP or water acquisitions,” including such flows
as minimum in-stream flows, water quality or scheduled
fishery releases from New Melones Reservoir, flood control
releases, uncontrolled reservoir spills, and/or local runoff.
Achieving the target flow requires the coordinated operation
of the three major San Joaquin River tributaries upstream
of Vernalis: the Merced River, the Tuolumne River and the
Stanislaus River.
As part of the development of the VAMP experimental
design, the VAMP Hydrology and Biology Groups jointly
identified a level of variation in San Joaquin River flow and
SWP/CVP export rate thought to be within an acceptable
range for specific VAMP test conditions. In developing the
criteria, the VAMP Hydrology and Biology Groups examined
both the ability to effectively monitor and manage flows and
exports within various ranges (e.g., the ability to accurately
Table 2-1 VAMP Vernalis Flow and Delta Export Targets
Greater than 7,000 Provide stable flow to extent possible
manage and regulate export rates is substantially greater
than the ability to manage San Joaquin River flows) and
the flow and export differences among VAMP targets (Table
2-1). Through these discussions, the technical committees
agreed that SWP/CVP export rates would be managed to
a level of plus or minus 2.5% of a given export rate target.
Furthermore, the technical committees agreed that, to
the extent possible, it would be desirable that exports
be allocated approximately evenly between SWP and CVP
diversion facilities.
The ability to manage and regulate the San Joaquin
River flow near Vernalis is difficult due to uncertainty and
variation in unregulated flows, inaccuracy in real-time flows
due to changing channel conditions, lags and delays in
transit time, and a variety of other factors. Concern was
expressed that variation in San Joaquin River flow on the
order of plus or minus 10% would potentially result in
overlapping flow conditions between two VAMP targets.
To minimize the probability of overlapping flow conditions
among VAMP targets, the technical committees explored
an operational guideline of plus or minus 5% flow variation
at the Vernalis gage; however, system operators expressed
concern about the ability to maintain flows within this
range. As a result of these discussions and analysis, the
Hydrology and Biology Groups agreed to a target range
variation of plus or minus 7% of the Vernalis flow target. It
was recognized by the Hydrology and Biology Groups that
these guidelines are not absolute conditions, but are to
be used by the VAMP Hydrology and Biology workgroups
to evaluate experimental test conditions and the potential
effect of flow and export variation on our ability to detect
and assess variation in juvenile Chinook salmon survival
rates among VAMP test conditions.
Under the SJRA, the following San Joaquin River Group
Authority (SJRGA) agencies have agreed to provide the
supplemental water needed to achieve the VAMP target
flows, limited to a maximum of 110,000 acre-feet:
Merced, OID, SSJID, SJRECWA, MID and TID. The Merced
supplemental water would be provided on the Merced River
from storage in lake McClure and would be measured at
the Cressey gage on the Merced River. The OID and SSJID
supplemental water would be provided on the Stanislaus
River through diversion reductions and would be measured
below Goodwin Dam. The SJRECWA supplemental water
would be provided via Salt Slough, West Delta Drain,
Boundary Drain and/or Orestimba Creek. The MID and TID
supplemental water would be provided on the Tuolumne
River from storage in New Don Pedro Reservoir and would be
measured at the Tuolumne River below laGrange Dam gage.
The target flow of 2,000 cubic feet per second (cfs) shown
in Table 2-1 does not represent a VAMP experiment target
flow data point, but, rather, is used to define the SJRGA
supplemental water obligation limit when Existing Flow
is less than 2,000 cfs. In preparation of the conceptual
framework for the VAMP it was recognized that in extremely
dry conditions the San Joaquin River flow and associated
exports would be determined in accordance with the
existing biological opinions under the Endangered Species
Act and the 1994 Bay-Delta Accord. In consideration of
these factors, when the Existing Flow is less than 2000
cfs, the target flow will be 2,000 cfs and the USBR, in
accordance with the SJRA, shall act to purchase additional
water from willing sellers to fulfill the requirements of
existing biological opinions.
When the Existing Flow exceeds 7,000 cfs, as was the
case in 2005, the Parties will exert their best efforts to
maintain a stable flow during the VAMP pulse flow period
to the extent reasonably permitted. Under such conditions
the SJRTC shall attempt to develop a plan to carryout the
studies pursuant to the SJRA.
Based upon hydrologic conditions, the target flow in a
given year could either be increased to the next higher
value (double-step) or the supplemental water requirement
could be eliminated entirely (off-ramp). These potential
adjustments to the target flow are dependent on the
hydrologic year type as defined by the SWRCB San Joaquin
Valley Water Year Hydrologic Classification (60-20-20
classification), which is given a numerical indicator as
shown in Table 2-2 to make this determination. A double-
step flow year occurs when the sum of the numerical
indicators for the previous year’s year type and current
year’s forecasted 90 percent exceedence year type is seven
(7) or greater, a general recognition of either abundant
reservoir storage levels or a high probability of abundant
runoff. An off-ramp year occurs when the sum of the
numerical indicators for the two previous years’ year types
and the current year’s forecasted 90 percent exceedence
year type is four (4) or less, an indication of extended
drought conditions.
Ch
ap
ter
2
12 :: 2005 Annual Technical Report
Under the SJRA, the maximum amount of supplemental
water to be provided to meet VAMP target flows in any
given year is 110,000 acre-feet. In a double-step year, the
quantity of supplemental water required may be as high as
157,000 acre-feet. In any year in which more than 110,000
acre-feet of supplemental water is needed, the USBR will
attempt to acquire the needed additional water on a willing
seller basis. In accordance with the SJRA, the SJRGA has
agreed to extend a “favored purchaser” offer to the USBR
through each current year’s VAMP period.
HyDrOLOGic PLaNNiNG FOr 2005 vamP
Hydrology Group Meetings
Beginning in February 2005, and continuing until early April,
the Hydrology Group held three planning and coordination
meetings (February 16, March 23 and April 11). The
March 23 and April 11 meetings were joint meetings of the
Hydrology and Biology Groups. At these meetings, forecasts
of hydrologic and operational conditions on the San Joaquin
River and its tributaries were discussed and refined.
Monthly Operation Forecast
As part of the initial planning efforts in February, a monthly
operation forecast was developed by the Hydrology Group
to provide an initial estimate of the Existing Flow and VAMP
Target Flow. Inflows to the tributary reservoirs used in
these forecasts were based on DWR Bulletin 120 runoff
forecasts. The monthly operation forecasts used the 90
percent and 50 percent probability of exceedence runoff
forecasts to provide a range of estimates. The initial
monthly operation forecast was presented at the February
16 Hydrology Group meeting. The 90 percent exceedence
forecast was indicating a VAMP target flow of 4,450 cfs and
the 50 percent exceedence forecast was indicating a VAMP
target flow of 5,700 cfs.
Daily Operation Plan Development
Starting in mid-March, the Hydrology Group began
development of a daily operation plan, updating it as
hydrologic conditions and operational requirements
changed. The purpose of the daily operation plan is to
provide a forecast of the Existing Flow which sets the
VAMP target flow and to coordinate the tributary operations
needed to meet that target. It also provides a forecast
of the daily flows expected during the HORB installation
period. In years like 2005 where the Existing Flow exceeds
the maximum VAMP target flow, the daily operation plan
is used to determine to what extent a stable flow can
be provided during the VAMP pulse flow period. The daily
operation plan calculates an estimated mean daily flow at
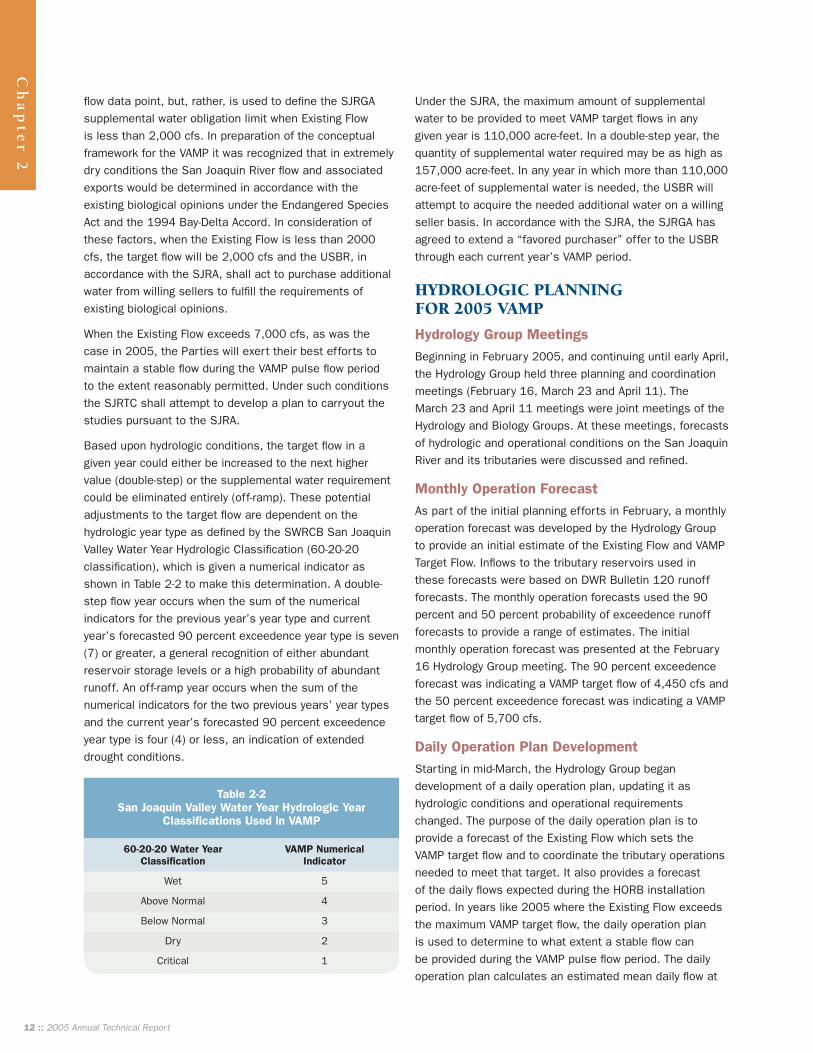
Table 2-2 San Joaquin Valley Water Year Hydrologic Year
Classifications Used in VAMP
60-20-20 Water Year VAMP Numerical Classification Indicator
Wet 5
Above Normal 4
Below Normal 3
Dry 2
Critical 1
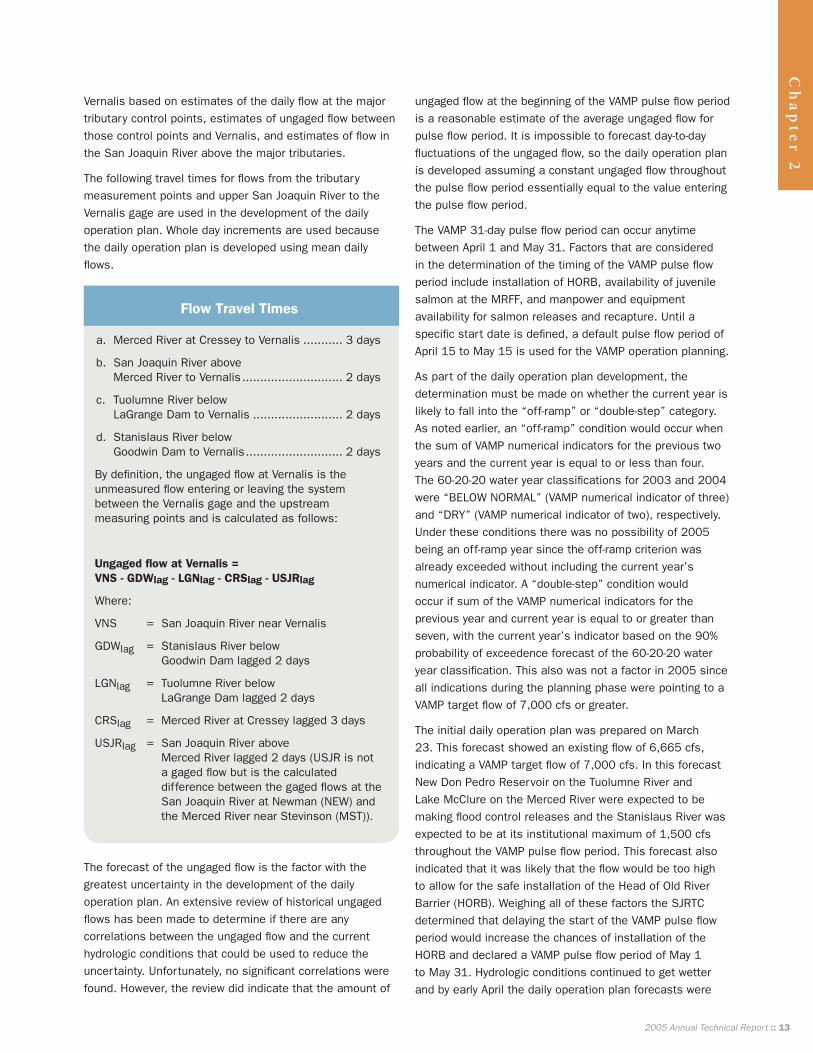
Flow Travel Times
a. Merced River at Cressey to Vernalis ........... 3 days
b. San Joaquin River above Merced River to Vernalis ............................ 2 days
c. Tuolumne River below laGrange Dam to Vernalis ......................... 2 days
d. Stanislaus River below Goodwin Dam to Vernalis ........................... 2 days
By definition, the ungaged flow at Vernalis is the unmeasured flow entering or leaving the system between the Vernalis gage and the upstream measuring points and is calculated as follows:
GDWlag = Stanislaus River below Goodwin Dam lagged 2 days
lGNlag = Tuolumne River below laGrange Dam lagged 2 days
CRSlag = Merced River at Cressey lagged 3 days
USJRlag = San Joaquin River above Merced River lagged 2 days (USJR is not
a gaged flow but is the calculated difference between the gaged flows at the San Joaquin River at Newman (NEW) and the Merced River near Stevinson (MST)).
Ch
ap
ter
2
2005 Annual Technical Report :: 13
Vernalis based on estimates of the daily flow at the major
tributary control points, estimates of ungaged flow between
those control points and Vernalis, and estimates of flow in
the San Joaquin River above the major tributaries.
The following travel times for flows from the tributary
measurement points and upper San Joaquin River to the
Vernalis gage are used in the development of the daily
operation plan. Whole day increments are used because
the daily operation plan is developed using mean daily
flows.
The forecast of the ungaged flow is the factor with the
greatest uncertainty in the development of the daily
operation plan. An extensive review of historical ungaged
flows has been made to determine if there are any
correlations between the ungaged flow and the current
hydrologic conditions that could be used to reduce the
uncertainty. Unfortunately, no significant correlations were
found. However, the review did indicate that the amount of
ungaged flow at the beginning of the VAMP pulse flow period
is a reasonable estimate of the average ungaged flow for
pulse flow period. It is impossible to forecast day-to-day
fluctuations of the ungaged flow, so the daily operation plan
is developed assuming a constant ungaged flow throughout
the pulse flow period essentially equal to the value entering
the pulse flow period.
The VAMP 31-day pulse flow period can occur anytime
between April 1 and May 31. Factors that are considered
in the determination of the timing of the VAMP pulse flow
period include installation of HORB, availability of juvenile
salmon at the MRFF, and manpower and equipment
availability for salmon releases and recapture. Until a
specific start date is defined, a default pulse flow period of
April 15 to May 15 is used for the VAMP operation planning.
As part of the daily operation plan development, the
determination must be made on whether the current year is
likely to fall into the “off-ramp” or “double-step” category.
As noted earlier, an “off-ramp” condition would occur when
the sum of VAMP numerical indicators for the previous two
years and the current year is equal to or less than four.
The 60-20-20 water year classifications for 2003 and 2004
were “BElOW NORMAl” (VAMP numerical indicator of three)
and “DRY” (VAMP numerical indicator of two), respectively.
Under these conditions there was no possibility of 2005
being an off-ramp year since the off-ramp criterion was
already exceeded without including the current year’s
numerical indicator. A “double-step” condition would
occur if sum of the VAMP numerical indicators for the
previous year and current year is equal to or greater than
seven, with the current year’s indicator based on the 90%
probability of exceedence forecast of the 60-20-20 water
year classification. This also was not a factor in 2005 since
all indications during the planning phase were pointing to a
VAMP target flow of 7,000 cfs or greater.
The initial daily operation plan was prepared on March
23. This forecast showed an existing flow of 6,665 cfs,
indicating a VAMP target flow of 7,000 cfs. In this forecast
New Don Pedro Reservoir on the Tuolumne River and
lake McClure on the Merced River were expected to be
making flood control releases and the Stanislaus River was
expected to be at its institutional maximum of 1,500 cfs
throughout the VAMP pulse flow period. This forecast also
indicated that it was likely that the flow would be too high
to allow for the safe installation of the Head of Old River
Barrier (HORB). Weighing all of these factors the SJRTC
determined that delaying the start of the VAMP pulse flow
period would increase the chances of installation of the
HORB and declared a VAMP pulse flow period of May 1
to May 31. Hydrologic conditions continued to get wetter
and by early April the daily operation plan forecasts were
Ch
ap
ter
2
14 :: 2005 Annual Technical Report
Table 2-4 Real-time Mean Daily Flow Data Sources
Measurement Location Data Source
San Joaquin River USGS, station 11303500 near Vernalis (http://waterdata.usgs.gov/ca/nwis/dv?format=pre&period=31&site_no=11303500)
Stanislaus River USBR, Goodwin Dam Daily Operation Report below Goodwin Dam (http://www.usbr.gov/mp/cvo/vungvari/gdwdop.pdf)
Tuolumne River USGS, station 11289650 below laGrange Dam (http://waterdata.usgs.gov/ca/nwis/dv?format=pre&period=31&site_no=11289650)
Merced River CDEC, station CRS at Cressey (http://cdec.water.ca.gov/cgi-progs/queryDgroups?s=fw2)
Merced River CDEC, station MST near Stevinson (http://cdec.water.ca.gov/cgi-progs/queryDgroups?s=fw2)
San Joaquin River USGS, station 11274000 at Newman (http://waterdata.usgs.gov/ca/nwis/dv?format=pre&period=31&site_no=11274000)
Pha
seP
lann
ing
Table 2-3 Summary of Daily Operation Plans
VAMP VAMP Assumed Existing VAMP Supplemental Water Forecast Target Flow Ungaged Flow at Flow Target Flow needed to meet Date Period Vernalis (cfs) (cfs) (cfs) Target Flow (acre-feet)
March 23, 2005 April 15 - May 15 800 6,665 7,000 20,600
1,200 7,465 na 0
March 25, 2005 May 1 - May 31 800 6,811 7,000 11,610
1,200 7,211 na 0
April 5, 2005 May 1 - May 31 600 8,839 na 0
1,200 9,439 na 0
April 13, 2005 May 1 - May 31 600 6,764 7,000 14,520
1,200 8,139 na 0
April 21, 2005 May 1 - May 31 1,000 7,938 na 0
April 28, 2005 May 1 - May 31 400 7,943 na 0
Table 2-5 Summary of USGS Flow Measurements at the San Joaquin River near Vernalis Gage
Date Gage Measured Current Rating Percent Rating Shift Height (ft) Flow (cfs) Shift Flow (cfs) Difference Change
4/20/05 (11:30) 15.98 8,410 8,710 -3.4% no
4/20/05 (12:19) 15.97 8,490 8,700 -2.4% no
4/27/05 (10:57) 14.65 6,450 6,950 -7.2% yes
5/3/05 (11:12) 15.71 8,360 7,780 7.5% yes
5/10/05 (09:02) 16.24 9,000 8,740 3.0% no
5/17/05 (10:08) 16.18 9,150 8,660 5.7% yes
SEE USEFUl WEB PAGES
Ch
ap
ter
2
2005 Annual Technical Report :: 15
Vernalis Flow Suggested Export Rate
Up to 10,000 cfs 1,500 cfs or 3,000 cfs
Up to 15,000 cfs 2,250 cfs
Over 15,000 cfs 3,000 cfs
indicating that the possibility of HORB installation had
essentially been eliminated. It was also looking more likely
that the existing flow would exceed the maximum VAMP
target flow of 7,000 cfs. Continually increasing runoff
forecasts resulted in continually increasing forecasts of
flood control releases on the Tuolumne and Merced Rivers
such that by April 28 the daily operation forecast was
looking at an existing flow of approximately 8,000 cfs.
Table 2-3 summarizes the various iterations of the daily
operation plan during the VAMP planning phase, and
demonstrates the evolutionary nature, of its development.
The daily operation plans prepared during the VAMP planning
phase are provided in Appendix A-1, Tables 1 through 10.
Tributary Flow Coordination
As previously noted, by late April the forecast existing flow
was greater than the maximum VAMP target flow of 7,000
cfs. Under these conditions the tributary operations were
coordinated to the degree possible to provide as stable a
flow as possible during the VAMP pulse flow period. With
this in mind the tributary operations prior to the VAMP
were adjusted to the degree possible to maximize the very
limited potential operational flexibility during the VAMP
pulse flow period.
Delta Exports
The VAMP experimental design does not mandate specific
magnitudes of reduced export rates when the existing
flow at Vernalis is expected to exceed the maximum VAMP
target flow rate of 7,000 cfs, but does provide the following
suggested export rates.
On March 30, April 15 and April 27 the projected
VAMP operation plan was discussed with the CalFed
Operations Group. On April 28, the CalFed Water Operation
Management Team (WOMT), which is made up of
representatives from the DWR, USBR, USFWS, CDFG and
NMFS, settled on a combined State and Federal export
rate of 1,500 cfs for the first half of May and 3,000 cfs
for the second half of May. On May 4 the WOMT revised
the combined export rate to 2,250 cfs for the VAMP period
provided the Vernalis flow stayed in the vicinity of 8,000
cfs, and noted that the export rate reduction would be
reassessed if the Vernalis flow increased significantly above
8,000 cfs.
imPLEmENtatiON
Operation Conference Calls
Due to the excess flow conditions and the fact that
the operation was being controlled by flood control
considerations and not by the VAMP target flow, the
operation conference calls that had been conducted in
previous years were not conducted in 2005.
Operation Monitoring
The planning and implementation of the VAMP spring pulse
flow operation was accomplished using the best available
real-time data from the sources listed in Table 2-4. The
real-time flow data used during the implementation of the
VAMP flow have varying degrees of quality. The CDEC real-
time data has not been reviewed for accuracy or adjusted
for rating shifts, whereas the USGS real-time data has
had some preliminary review and adjustment. During the
VAMP flow period, the real-time flows at Vernalis and in the
San Joaquin River tributaries are continuously monitored.
Similarly, the computed ungaged flow at Vernalis and the
flow in the San Joaquin River upstream of the Merced River
are continuously updated.
Normally, the USGS makes monthly measurements of
the flow at Vernalis to check the current rating shift.
The real-time flows reported by the USGS and CDEC are
dependent on the most current rating shift, therefore a
new measurement and shift can result in a sudden and
significant change in the reported real-time flow. In order
to minimize the potential for these sudden and significant
changes, arrangements were made with the USGS to
measure the flow at Vernalis on a weekly basis between
April 20 and May 17. The results of these measurements
are summarized in Table 2-5. There were no significant
rating shifts during the 2005 VAMP operation period.
rESuLtS OF OPEratiONSThe final accounting for the VAMP operation was
accomplished using provisional mean daily flow data
available from USGS and DWR as of August 1, 2005.
Provisional data is data that has been reviewed and
adjusted for rating shifts but is still considered preliminary
and subject to change. Plots of the real-time and provisional
flows at the primary measuring points are provided
in Appendix A-2, Figures 1 through 8, to illustrate the
differences between the real-time and the provisional data.
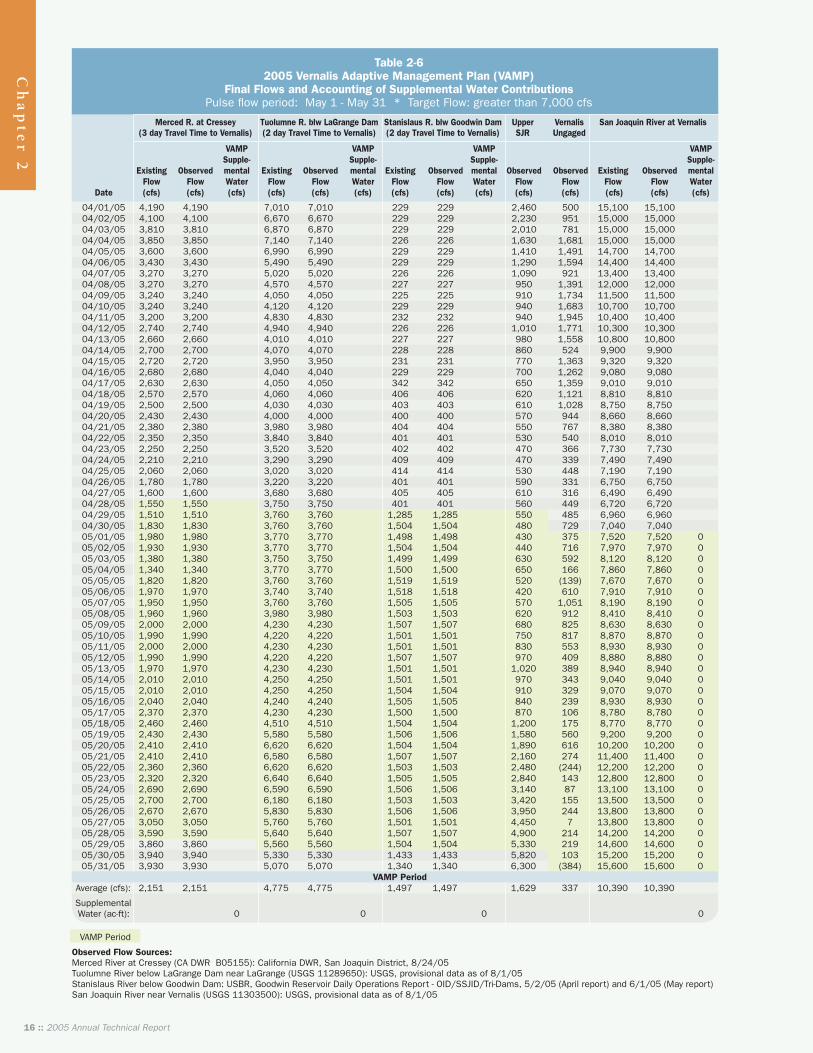
The mean daily flow at the Vernalis gage averaged 10,390
cfs during the May 1 – May 31 VAMP pulse flow period. The
flow was relatively steady for the first 19 days of the pulse
flow period, ranging from 7,500 cfs to 9,200 cfs. For the
latter portion of the pulse flow period the flow at Vernalis
16 :: 2005 Annual Technical Report
Observed Flow Sources:Merced River at Cressey (CA DWR B05155): California DWR, San Joaquin District, 8/24/05Tuolumne River below laGrange Dam near laGrange (USGS 11289650): USGS, provisional data as of 8/1/05Stanislaus River below Goodwin Dam: USBR, Goodwin Reservoir Daily Operations Report - OID/SSJID/Tri-Dams, 5/2/05 (April report) and 6/1/05 (May report)San Joaquin River near Vernalis (USGS 11303500): USGS, provisional data as of 8/1/05
VAMP Period
Ch
ap
ter
2
Merced R. at Cressey Tuolumne R. blw LaGrange Dam Stanislaus R. blw Goodwin Dam Upper Vernalis San Joaquin River at Vernalis (3 day Travel Time to Vernalis) (2 day Travel Time to Vernalis) (2 day Travel Time to Vernalis) SJR Ungaged
Table 2-62005 Vernalis Adaptive Management Plan (VAMP)
Final Flows and Accounting of Supplemental Water ContributionsPulse flow period: May 1 - May 31 * Target Flow: greater than 7,000 cfs
was impacted by flood releases from Friant Dam (Millerton
lake), reaching a VAMP period maximum of 15,600 cfs
on May 31 as shown in Figure 2-2. Plots of the flow at
the Merced River, Tuolumne River and Stanislaus River
measurement points are provided in Figure 2-3. A tabulation
of the observed mean daily flows during and around the
VAMP period is provided in Table 2-6.
Near the end of April, just prior to the pulse flow period,
the computed ungaged flow had dropped into the range of
400 to 600 cfs, so that a value of 400 cfs was used in the
April 28 daily operation plan. The final accounting shows
that the average ungaged flow during the VAMP pulse
flow period was 284 cfs, with a minimum of -544 cfs and
maximum of 741 cfs. A plot of the ungaged flow is provided
in Figure 2-4.
Another unknown in the forecast equation similar to the
ungaged flow is the flow in the San Joaquin River upstream
of the Merced River. This unknown tends not to be as
variable as the ungaged flow, but like the ungaged flow, it
may be adjusted if the observed flow warrants it. During the
2005 VAMP the greatest uncertainty in regards to the San
Joaquin River above Merced River flow was the potential for
Friant Dam flood releases which could significantly affect
this flow. As can be seen in Figure 2-5, the observed flow
was slightly greater than the forecast for the first half of the
pulse flow period due to the wet conditions in the basin.
In mid-May it became necessary for Friant Dam to make
significant flood control releases which resulted in the
observed flow in the San Joaquin River above the Merced
River significantly exceeding the forecasted flow as shown
in Figure 2-5.
Table 2-7 Storage Impact History, Lake McClure (Merced River)
VAMP Supplemental Fall Supplemental SJRA Storage Impact End of Year Cumulative Calendar Year Water (acre-feet) a Water (acre-feet) Replenishment (acre-feet) Storage Impact (acre-feet)
2000 46,750 12,500 46,750 (May 2000) -12,500
2001 43,146 12,496 0 -68,142
2002 27,120 12,470 0 -107,732
2003 39,586 12,500 0 -159,818
2004 42,879 12,500 0 -215,197
2005 0 12,500 215,197 (Jan.-Mar. 2005) 0 b
a Includes ramping flows. b Fall Supplemental Water from re-opened flood-control release, therefore storage was not impacted.
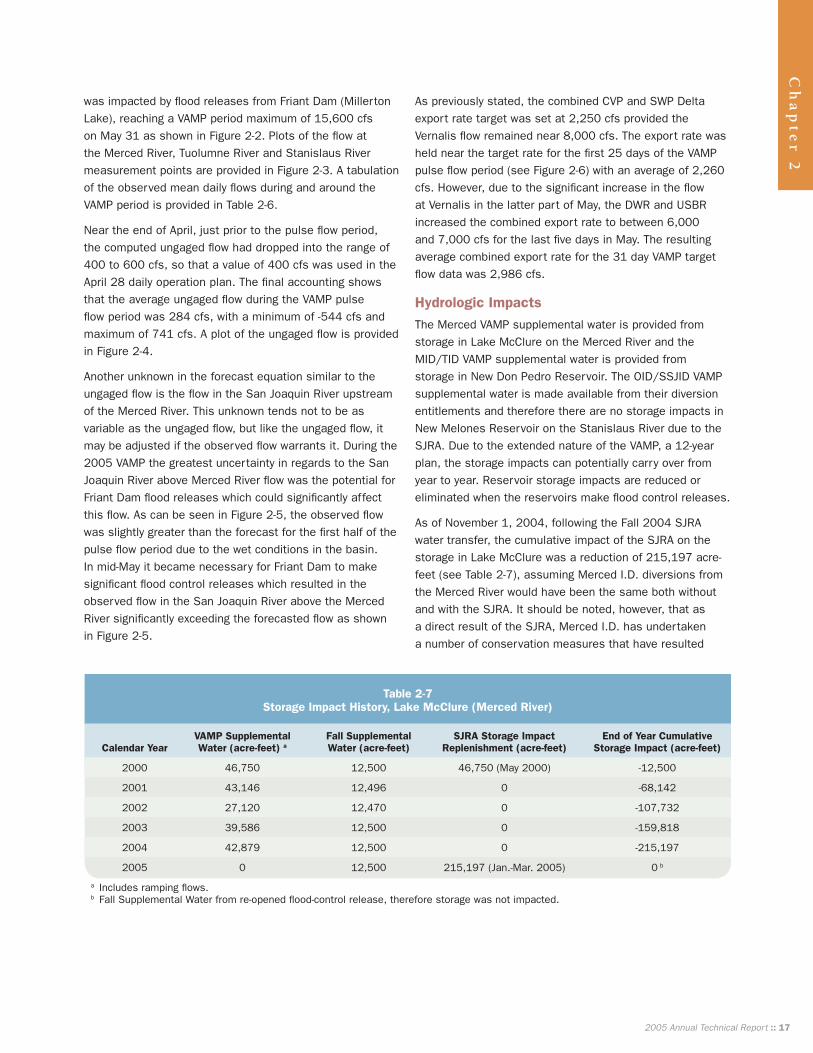
As previously stated, the combined CVP and SWP Delta
export rate target was set at 2,250 cfs provided the
Vernalis flow remained near 8,000 cfs. The export rate was
held near the target rate for the first 25 days of the VAMP
pulse flow period (see Figure 2-6) with an average of 2,260
cfs. However, due to the significant increase in the flow
at Vernalis in the latter part of May, the DWR and USBR
increased the combined export rate to between 6,000
and 7,000 cfs for the last five days in May. The resulting
average combined export rate for the 31 day VAMP target
flow data was 2,986 cfs.
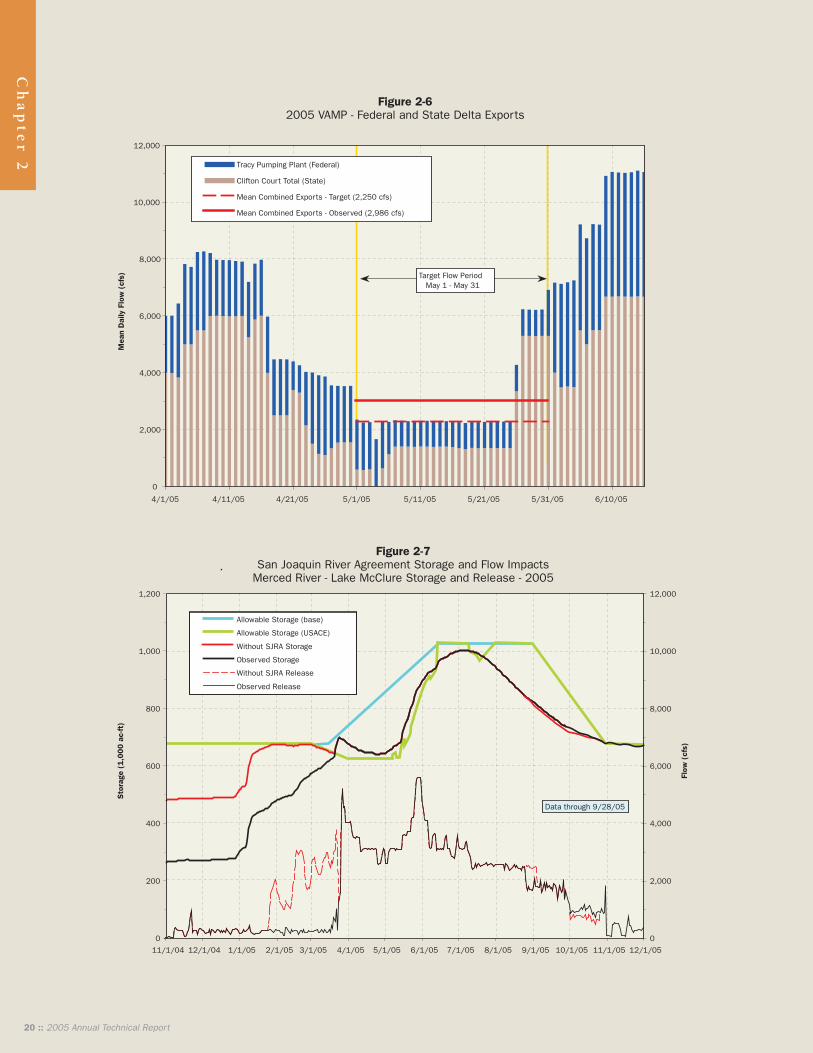
Hydrologic Impacts
The Merced VAMP supplemental water is provided from
storage in lake McClure on the Merced River and the
MID/TID VAMP supplemental water is provided from
storage in New Don Pedro Reservoir. The OID/SSJID VAMP
supplemental water is made available from their diversion
entitlements and therefore there are no storage impacts in
New Melones Reservoir on the Stanislaus River due to the
SJRA. Due to the extended nature of the VAMP, a 12-year
plan, the storage impacts can potentially carry over from
year to year. Reservoir storage impacts are reduced or
eliminated when the reservoirs make flood control releases.
As of November 1, 2004, following the Fall 2004 SJRA
water transfer, the cumulative impact of the SJRA on the
storage in lake McClure was a reduction of 215,197 acre-
feet (see Table 2-7), assuming Merced I.D. diversions from
the Merced River would have been the same both without
and with the SJRA. It should be noted, however, that as
a direct result of the SJRA, Merced I.D. has undertaken
a number of conservation measures that have resulted
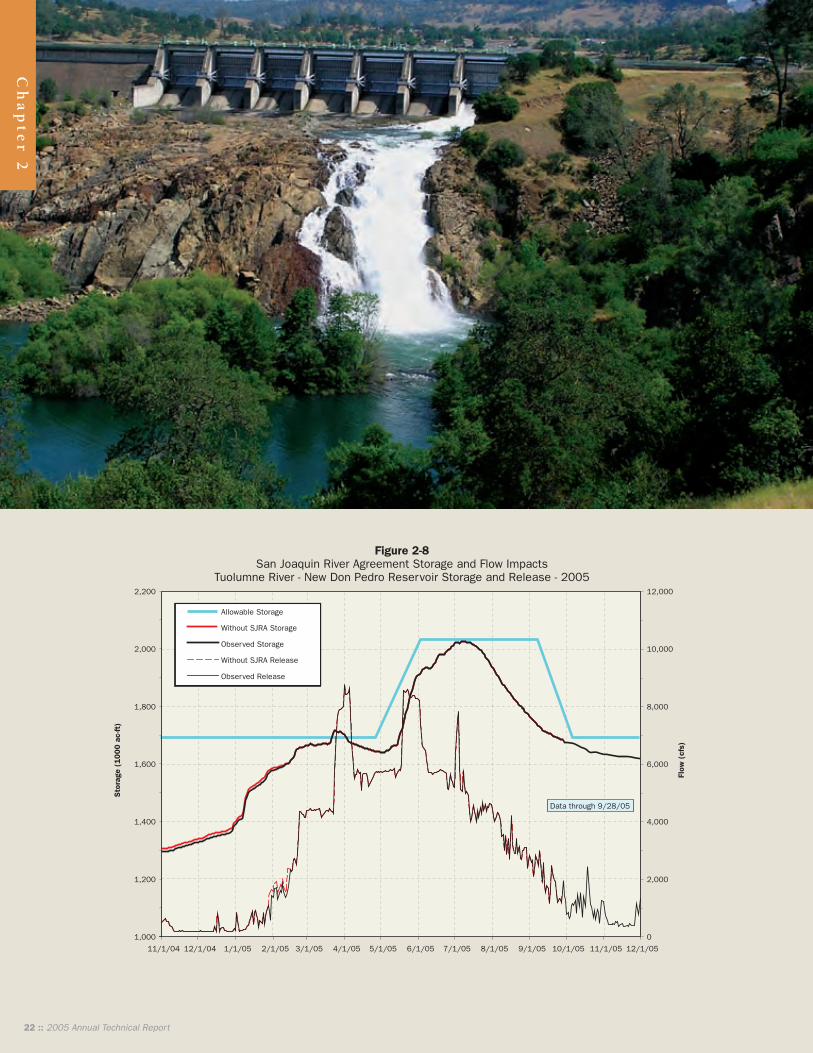
Figure 2-8San Joaquin River Agreement Storage and Flow Impacts
Tuolumne River - New Don Pedro Reservoir Storage and Release - 2005
22 :: 2005 Annual Technical Report
Ch
ap
ter
2
2005 Annual Technical Report :: 23
Ch
ap
ter
2
Table 2-9 Summary of VAMP Flows, 2000-2005
60-20-20 Water VAMP VAMP Observed Existing VAMP Delta Observed Year Hydrologic Numerical Target Flow VAMP Flow Flow Supplemental Export Target Delta Exports Year Classification Indicator (cfs) (cfs) (cfs) Water (acre-feet) (cfs) (cfs)
2000 Above Normal 4 5,700 5,869 4,800 77,680 2,250 2,155
2001 Dry 2 4,450 4,224 2,909 78,650 1,500 1,420
2002 Dry 2 3,200 3,301 2,757 33,430 1,500 1,430
2003 Below Normal 3 3,200 3,235 2,290 58,065 1,500 1,446
2004 Dry 2 3,200 3,155 2,088 65,591 1,500 1,331
2005 Wet 5 >7,000 10,390 10,390 0 2,250 2,986 [a]
[a] May 1 through 25 average was 2,260 cfs; exports were increased starting May 26 inconjunction with increasing existing flow; May 26 through 31 average was 6,012 cfs.
Table 2-10 Summary of VAMP Supplemental Water Contributions, 2000-2004
VAMP Supplemental Year Water (acre-feet) Merced ID OID SSJID SJRECWA MID TID