Page 1
1
van der Waals forces control the internal chemical
structure of monolayers within ABP2X6 lamellar materials
Sherif Abdulkader Tawfik,1,2 Jeffrey R. Reimers,1,3 Catherine Stampfl,4 and Michael
J. Ford1
1School of Mathematical and Physical Sciences, University of Technology Sydney, Ultimo, New South Wales 2007, Australia 2Institute for Biomedical Materials and Devices (IBMD), Faculty of Science, University of Technology Sydney, Sydney, NSW, Australia 3International Centre for Quantum and Molecular Structures and School of Physics, Shanghai University, Shanghai 200444, China 4School of Physics, The University of Sydney, New South Wales, 2006, Australia.
* [email protected] , [email protected] , [email protected]
Abstract: Following the recent demonstration that van der Waals forces control the
ferroelectric ordering of layers within nanoflakes and bulk samples of CuBiP2Se6 and
CuInP2S6, it is demonstrated that they also control the internal geometrical structure of
isolated monolayers of these materials. This internal structure involves large displacements
of the copper atoms, either normal to the layer plane or else within the plane, that change its
ligation environment. In both cases, the van der Waals dispersion force out-competes
traditional bonding effects to control structure. However, we find that the aspects of the
dispersion force giving rise to each effect are uncorrelated: long range effects control inter-
layer ferroelectric ordering whereas short-range effects control internal layer structure. These
conclusions are drawn considering predicted properties of monolayers, bilayers, and bulk
materials obtained using 14 density-functional-theory based methods. While the different
methods used often predict starkly different quantitative results, they concur as to the basic
nature of ABP2X6 materials. Of the methods used, only the PBE-D3 and optPBEvdW
methods were found to predict a wide range of observed properties without serious disparity.
Finding optimal computational methods remains a significant challenge for which the
unusual multi-scale nature of the van der Waals interactions in ABP2X6 materials provides
demanding criteria.
PACS Numbers
31.13.E dft or 31.15.eg functionals
68.65.ac multilayers
Page 2
2
77.80.-e ferroelectric - antiferroelectric
I. INTRODUCTION
The competition between traditional chemical forces involving covalent and ionic bonding
with the van der Waals (vdW) force is being recognized as a widespread phenomenon [1].
Many different computational procedures are now available for modeling this competition,
and we utilize these to consider the structure and properties of some 2D layered materials.
These compounds are selected as the properties of the “van der Waals gap” is of critical
current concern as a controlling influence on the properties of many conceived devices [2],
but we here show that equally important in layered materials is also the effect the force has
on the internal properties of each layer.
Some metal seleno- and thio-phosphate materials ABP2X6 (A, B = metals with
valences either A(I)B(III) or A(II)B(II); X = S or Se) form lamellar structures in which thin
molecular layers (see Fig. 1) self-assemble under the influence of the van der Waals force [3].
Each molecular layer involves (X3P-PX3)4- anions of near D3d symmetry, assembled with
their P-P bonds normal to the layer. In this way, two parallel “sheets” of S or Se atoms, that
are of order 3.5 Å apart, form in a hexagonal lattice, with the metal atoms locating in
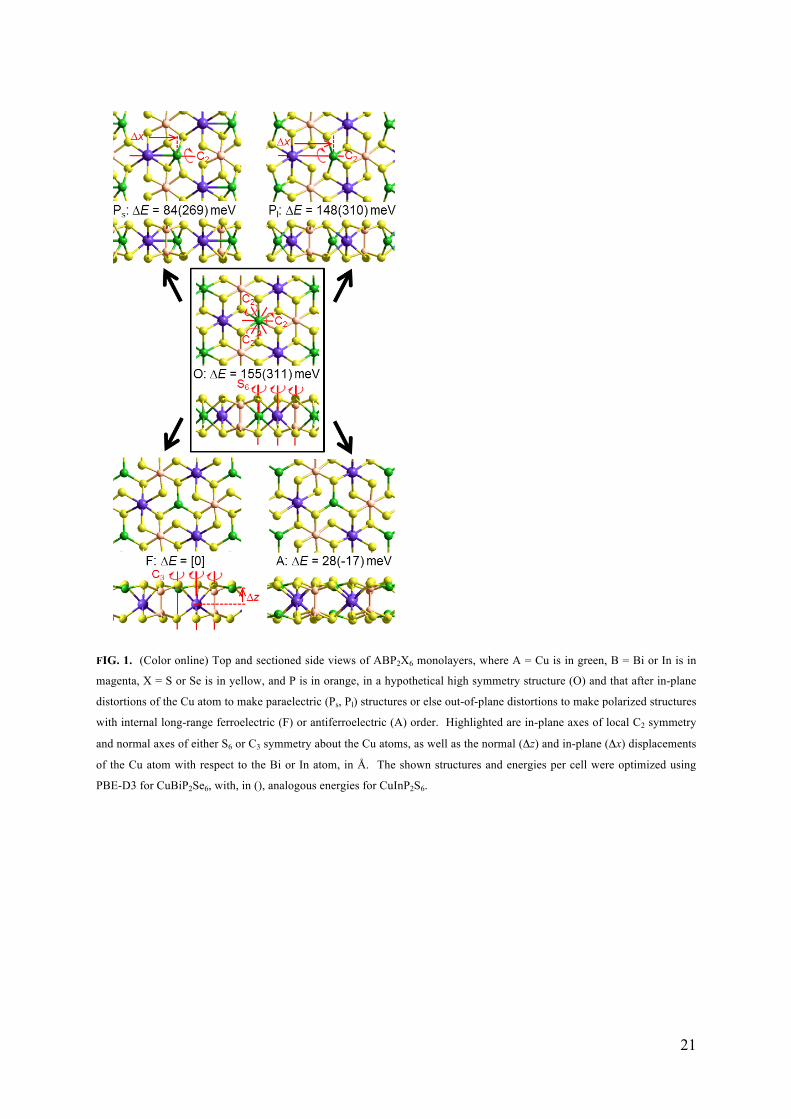
octahedral holes between the sheets. Figure 1 depicts such a high-local-symmetry structure,
named “O”. It manifests S6 improper rotation axes normal to the layer that pass through the A
atom, the B atom, and the P-P bond, as well as three C2 axes bisecting them. The C2 axes are
important as, within a monolayer, they make the top sheet of S or Se atoms symmetrically
equivalent to the bottom sheet.
If A and B are different atoms, then the O structure cannot have the full symmetry of
the lattice. Indeed, it represents a high-energy unstable structure on the potential-energy
surface, leading to 8 polymorphic forms associated with displacements of, in particular, the
small Cu(I) atom. It can either move vertically (z direction) towards one of the two layer
sheets or horizontally in either direction along one of the three C2 axes. Vertical
displacements cause the loss of all C2 operators and reduce S6 to C3. Horizontal
displacements loose the S6 operator altogether but preserve one of the C2 operators, here
taken to be the one in the x direction.
Of considerable interest is the dipole polarization associated with internal
displacements within each cell. The (hypothetical) O structure has inversion symmetry and
Page 3
3
hence manifests no dipolar polarization, but the magnitude of internal displacements can be
quite large, of order 1.7 Å normal and 0.5 Å horizontal, so inducing significant electric
polarization within a cell. These effects are sketched in Fig. 2a.
A monolayer is made up of a 2D grid of cells; its macroscopic properties will
therefore be controlled by the nature of any short-range or long-range ordering of individual
cell dipoles. Monolayers of cells displaying vertical displacements that align either
ferroelectrically or else randomly have been observed [4]. However, monolayers of cells
with horizontal displacements are yet to be observed. As a result, discussion of
ferroelectricity has historically focused on polarization normal to the monolayer, and indeed
we follow this lead. Hence in Figs. 1 and 2b we name the vertically displaced fully-ordered
monolayer as ferroelectric (F). Shown also in these figures is an ordered antiferroelectric
(A) structure based on vertical displacements, and variants with random (R) polarization are
known. In contrast, horizontally displaced structures preserve one C2 operator and hence
there is no z-dipole component by symmetry, so we name these structures as paraelectric;
two such paraelectric forms are possible, one named Ps in which the A and B atoms move
together to a short distance, ca. 3 Å apart, that can be considered as a (somewhat long)
chemical bond, and one named Pl in which they move apart to display a long unique
interaction distance, see Figs. 1 and 2b. We show interest in such structures as one day they
may be observed in some system, possibly with an exploitable metal-metal bond. More
pertinently, however, their properties could shed considerable light on the interaction
between ionic and van der Waals forces in controlling monolayer structure. To encompass
such possibilities, our notation here is more general than that found elsewhere in which
vertically displaced randomly aligned cells are sometimes referred to as being “paraelectric”
[4].
Nanoflakes and bulk samples of ABP2X6 materials also display inter-layer ordering. For
example, monolayers that are internally ferroelectrically ordered may be stacked together
either ferroelectrically or antiferroelectrically. Materials that have been previously
investigated for their net ferroelectric properties include: CuInP2S6 [3, 5-9] CuBiP2Se6 [4],
AgBiP2Se6 [4], AgBiP2S6 [4], CuCrP2S6 [10], and CuVP2S6 [11]. CuBiPS2Se6 is observed at
97 K to form into an antiferroelectric polymorph comprised of vertically-displaced internally
ferroelectrically-ordered monolayers stacked with alternating polarization, with dipole
ordering being lost as the temperature rises to 173 K and then to 298 K [4]. It has been
suggested that random loss of dipole ordering within a monolayer is responsible for this
effect [4], but alternate possibilities include the formation of antiferroelectric monolayers as
Page 4
4
well as the formation of paraelectric monolayers (see Figs. 1 and 2). In contrast, CuInP2S6
was found to be ferroelectric with a Curie temperature of 315 K, thus sustaining a
ferroelectric state up to room temperature [3, 5-7, 9, 12, 13]. Understanding the processes
driving and opposing ferroelectricity in these materials therefore presents a significant
modern challenge. In general, the origin of antiferroelectricity in materials remains poorly
understood [14].
Recently, we demonstrated that, in CuBiP2Se6 and CuInP2S6, the van der Waals force
controls ferroelectric ordering rather than traditional chemical forces [15]. This effect arises
from strong dispersion interactions involving the copper ions of one internally ferroelectric
monolayer interacting with the copper atoms in its neighbouring layers. Figure 2c depicts
two fundamentally different types of antiferroelectrically arranged bilayers of such a
monolayer. Most significantly, antiferroelectric nanoflakes and bulk materials by necessity
must comprise alternating arrangements of each type. They involve different copper-copper
inter-layer interactions: in one case, named Aii, the vertically displaced Cu atoms both appear
on the inside of the two layers, while in the other case, named Aoo, the two copper atoms
appear on the outside. Alternatively, bilayers made from ferroelectrically aligned
monolayers, named F, (see Fig. 2c), present a single type of inter-layer interaction in which
the copper atoms have intermediary separation to those in Aoo and Aii. Shorter copper to
copper distances result in stronger van der Waals attraction, meaning that the dispersion force
scales non-linearly in order Aii > F > Aoo. Comparison of the average interlayer interaction in
antiferroelectric structures with that in the ferroelectric one then controls ferroelectric
ordering in the crystals. These net contributions to the total energy remain much larger than
the electrostatic energy differences associated with both short-range and long-range dipole
ordering. Hence the inter-layer van der Waals force controls the ferroelectric ordering of
monolayers within bilayers, nanoflakes, and bulk solids of these materials.
To understand this result more, we require independent means of assessing the nature of
the van der Waals forces, plus ways of assessing the nature of the intrinsic chemical and
electrostatic forces. This includes both qualitative methods for the interpretation of observed
results as well as quantitative schemes for the a priori prediction of the effects of the forces
involved.
The chemical bonding forces that singularly control ferroelectricity in traditional three-
dimensional materials are mostly well described using density-functional theory (DFT),
employing simplistic functionals based on the generalized-gradient approximation (GGA)
Page 5
5
such as the Perdew, Burke, and Ernzerhof (PBE) [16] functional. Indeed, this method has
been used to predict the ferroelectric order in lamellar materials related to our systems of
interest [4, 9, 17], including the prediction of spontaneous dipole ordering in CuInP2S6 [9].
Often semiconductors with trigonal, tetrahedral and octahedral symmetry experience off-
center atomic displacements owing to the presence of partially occupied orbitals [18].
Related off-center structural instabilities have also been investigated in various perovskite
ABO3 ferroelectric compounds such as iron defect sites in KTaO3 [19], Ba0.5Sr0.5TiO3 [20],
and BaTiO3 [21]. In such bulk ferroelectric compounds, ferroelectric instability results from
a competition between long-range Coulomb interactions favoring the ferroelectric polymorph
and short-range forces supporting the undistorted paraelectric structure. Properties are then
determined by the lattice dynamics [22] in competition with the electron screening of the
Coulomb interactions [21]. Most relevant, however, is the analysis of CuBiP2Se6 by Gave et
al. [4] which explains the off-centre displacement of the Cu(I) ion in terms of a second-order
Jahn-Teller distortion.
Naively, one would expect the PBE density functional to provide a reasonable description
of all of these chemical effects. However, improved computational methods are available,
including the extension of PBE to make the HSE06 hybrid density functional [23]. This
allows for a much more realistic description of the electron exchange effects that often
control chemical reactions and ferromagnetism.
In contrast, neither GGA nor hybrid functionals provide a realistic description of the
dispersion force, the force responsible for the attractive part of the van der Waals interaction.
The last decade has seen the development of many methods that take into account this basic
deficiency in DFT methodology [24]. Indeed, in the area of materials research, density-
functionals with van der Waals corrections have been applied to critical questions such as the
prediction of interlayer binding in various two-dimensional heterostructures including
graphene, hexagonal boron nitride, phosphorene, and transition metal dichalcogenides [25].
Our previous demonstration [15] that van der Waals forces control ferroelectric ordering in
ABP2X6 materials builds on this research.
Looking beyond this widely accepted understanding of the significance of van der Waals
forces, today, many examples of systems traditionally believed to be treated well using DFT
without van der Waals correction are now being found to be systems in which this effect is
actually critical [1]. Noteworthy is that the dispersion can be large for interactions involving
soft atoms like S, Se, In, and Bi, with the implication that it could also control atomic
Page 6
6
structure within a single monolayer. ABP2X6 materials therefore present a unique situation in
which the role of the van der Waals force in controlling intermolecular interactions can be
studied in parallel with its role in competing with chemical forces to control local bonding.
This in turn provides a unique opportunity to assess modern computational approaches for
modelling the van der Waals force.
Just as many different density functionals have been developed, so also have many van der
Waals approaches. To date, the self-assembly of ABP2X6 layers has been considered using
only one such approach, correcting the PBE density functional using the “D2” empirical
dispersion correction of Grimme et al. [26] (PBE-D2), to investigate ferroelectric ordering in
CuIn2P3S9 and CuInS2P6 [7]. For these systems, PBE-D2 was shown to give similar ordering
to that obtained using PBE [9]. Here, we consider pure PBE as well as 11 different
combinations of van der Waals corrections with PBE-based GGA density functionals. We
also consider the HSE06 functional, and in addition, that combined with the “D3” empirical
dispersion correction of Grimme et al. [27, 28].
While GGA and hybrid functions are naively thought to provide a good description of
electron correlation at short distance and van der Waals corrections thought to provide a good
description at long distance, no clear-cut separation really exists, with both contributions
applicable to a broad intermediary region. For example, the crude local-density
approximation (LDA) to DFT provides an exact description of the dispersion force at all
length scales in a free-electron gas. Changing the density functional modifies how a van der
Waals correction describes long-range interactions, while changing a long-range correction
also modifies chemical bonding forces. Hence each density functional and applied correction
present a combination that should be considered as a unique methodology. Fourteen
computational methods were used, as summarized in Table I. It is the long-range aspect of
each combination that dominates traditional areas of van der Waals force research, such as
those demonstrated to control self-assembly in general and also specifically ferroelectric
ordering in ABP2X6 materials [15], while the short to medium range part controls the
competition between van der Waals and covalent bonding [1].
These 14 computational methods are applied to study first monolayers, then bilayers, then
bulk solids of CuBiP2Se6 and CuInP2S6. Looking only at monolayers allows not only their
basic properties (Fig. 1) to be investigated at a fundamental level, but also how these
phenomena are perceived using the different computational methods that embody the van der
Waals force. Progressing to bilayers then allows the traditional inter-layer aspect of the van
Page 7
7
der Waals force to be depicted. Moving to solids then allows assessment of the
computational methods, and the visions they portray concerning the interplay of van der
Waals and chemical forces, to be examined in the light of a range of observed phenomena.
II. COMPUTATIONAL METHODS
All calculations were performed using VASP 5.4.1 [29], where the valence electrons were
separated from the core by use of projector-augmented wave pseudopotentials (PAW) [30].
The energy cut-off for the plane-wave basis functions was set at 500 eV. The energy
tolerance for the electronic structure determinations was set at 10-7 eV to ensure accuracy.
We used k-space grids of 8×8×1 for the GGA functionals and 4×4×1 for HSE06, with test
calculations indicating that the reduced sampling introduces relative errors in calculated
energies of order 3 meV. VASP performs periodic imaging in all three dimensions and so to
model monolayers and bilayers we introduced a vacuum region of ca. 15 Å between the
periodic images in the direction normal to the layer(s). To minimize interactions between
these periodic images, we applied the dipolar correction implemented in VASP (by setting
the “IDIPOL” to “TRUE”). However, for a selection of structures, we tested the influence of
this correction, finding that it does not influence the qualitative or quantitative nature of the
results.
Geometry optimizations were made for all internal structures, terminating when the forces
on all atoms fell below 0.01 eV/Å. In monolayer and bilayer calculations, the in-plane unit-
cell dimension a was kept fixed at the value observed for the related bulk materials of 6.6524
Å for CuBiP2Se6 [4] and a=6.0955 Å, b = 10.5645 Å and β = 107.101° for CuInP2S6 [12],
with the CuInP2S6 calculations done enforcing hexagonal symmetry. The starting structures
for geometry optimizations were based on the properties of adjacent layers observed in these
materials, with test calculations done for alternate structures using the PBE-D3 method not
realizing lower-energy alternatives. For bulk structures, all lattice vectors were fully
optimized.
The 14 computational methods considered, (see Table I), include the raw PBE density
functional, plus this combined with various dispersion corrections: Grimme’s D2 empirical
correction [26] (PBE-D2), Grimme’s D3 empirical correction [27] in its original form
without Becke-Johnson damping with PBE (PBE-D3) and revPBE [31] (revPBE-D3), the
exchange-hole based correction of Steinmann and Corminboeuf [32] (PBE-dDsC), the
Tkatchenko-Scheffler method [33] (PBE-TS), that with self-consistent screening (SCS) [34]
(PBE-SCSTS), and that extended to make Tkatchenko’s many-body dispersion method [35,
Page 8
8
36] (MBD@rsSCS) (VASP flag “IVDW= 202”). The other computational methods were all
based around the pioneering van der Waals density-functional approach devised initially by
Lundqvist et al. [24, 37]. This correction was applied to the revPBE density functional [38]
(revPBEvdW), the optPBE density functional [38] (optPBEvdW) or the optB88 density
functional [38] (optB88-vdW). Also, in a form modified by Lee et al., it was combined [39]
with the BP86 density functional [40] (vdW-DF2). Finally, we also considered the raw
HSE06 hybrid density functional [23] as well as that combined with D3 [28].
III. RESULTS AND DISCUSSION
Optimized Cartesian coordinates for monolayers, bilayers, and bulk solids calculated
using the different computational methods are reported in full in Supporting Data. Extensive
summaries of system properties are also provided therein, with particularly important
properties also reported in the main text figures and tables. All computational methods
considered predict that CuBiP2Se6 and CuInP2S6 materials are narrow band-gap
semiconductors, with for example the PBE bandgaps being of the order of 1 eV.
A. vanderWaalforcescontroltheinternalstructureofisolatedABP2X6
monolayers
Figures 1 and 2b sketch the basic chemical processes available to ABP2X6 monolayers as
their cells distort from their (hypothetical) octahedral structure O. We do not consider
explicitly random structures R of any form, focusing instead on ferroelectric monolayers F,
antiferroelectric monolayers A, and the two possible types of paraelectric monolayers Ps and
Pl. For the 14 computational methods used, Table II compares key values for the Cu to In or
Bi displacements in the z and x directions, Δz and Δx, respectively, the vertical displacement
between the Cu atoms in the antiferroelectric monolayers ΔzCuCu, and the relative energy
difference per cell of the A, Ps, and Pl structures compared to F, ΔEF; additional related
properties are listed in Supporting Data Table S1.
The vertical displacement data is highlighted in Fig. 3. First, Δz is compared for
ferroelectric monolayers of CuBiP2Se6 and CuInP2S6 in Fig. 3a. In this and later figures,
results for each computational method are presented using the hexadecimal code “0” to “D”,
as defined in Table I. Different computational methods predict variations in Δz of up to 0.8
Å, indicating that the internal structure of monolayers in isolation is highly sensitive to the
treatment used for the van der Waals force and its associated GGA or hybrid density
functional. CuInP2S6 is found to be only 73% as sensitive to these effects as is CuBiP2Se6, a
Page 9
9
reasonable result given that the van der Waals force is naively expected to be stronger in
CuBiP2Se6 as Bi is softer than In and Se is softer than S. Figures 3b and 3c compare Δz in the
ferroelectric monolayer to ΔzCuCu in the antiferroelectric one, demonstrating a linear
correlation for CuInP2S6 but a bifurcated pattern for CuBiP2Se6, suggesting that the van der
Waals force is more perturbative for CuInP2S6 and more dominant for CuBiP2Se6.
Returning directly to Table II, we consider the displacements Δx occurring in the
paraelectric monolayers Ps and Pl. For CuInP2S6, the structures Ps present a short apparent
bond between the Cu and In atoms of length ~ 2.9 Å. This length is contracted from the
value of 3.52 Å found in the ferroelectric monolayer by 0.53 to 0.72 Å, depending on the
computational method. For CuBiP2Se6, the situation is similar: the apparent Cu to Bi bond
length is ~ 3.1 Å, contracted from the value of 3.78 Å found in the ferroelectric monolayer by
0.62 to 0.76 Å. Greater variation is found in the alternate paraelectric structures Pl that
manifest one unique long inter-metallic interaction, the increase in interaction distance being
0.07 to 0.28 Å for CuInP2S6 and 0.13 to 0.55 Å for CuBiP2Se6. From the energy differences
ΔEF reported in the table, we see that most computational methods predict Ps to be more
stable than Pl. For CuBiP2Se6, all methods predict this result with a preference of 27 to 73
meV, but for CuInP2S6, PBE-D2 and HSE06-D3 predict Pl to be the most stable, with a much
wider range in predicted energy differences. In summary, we see that different combinations
of van der Waals corrections with density functionals have smaller effects on geometrical
structures for displacements in the x direction than they do for displacements in z, but
nevertheless key energetic properties remain determined by these factors.
Focusing more on the energy differences, the paraelectric structures are all predicted to be
much less stable than the ferroelectric and/or antiferroelectric ones, consistent with the lack
of observation of paraelectric species. This energy preference is by 170 to 315 meV for Ps of
CuInP2S6, but by values as low as 60 meV for CuBiP2Se6. Increasing the van der Waals
interactions therefore favours paraelectric forms with short A-B distances and so it is
conceivable that some ABP2X6 species could one day be made. Exploitation of A-B spin or
other interactions may make such species of practical interest.
For CuInP2S6, all methods predict that the antiferroelectric monolayer is more stable than
the ferroelectric one by 6 to 46 meV. This is inconsistent with the observation of only
ferroelectric structures for this compound. However, monolayers themselves are yet to be
observed. The observed ferroelectric bulk and nanoflake structures [3, 5-9] may result as a
consequence of inter-layer interactions, given that many methods predict only small energy
Page 10
10
differences less than 20 meV. For CuBiP2Se6 with its stronger van der Waals interactions,
the computational methods predict energy differences between the antiferroelectric internal
monolayer structure and the ferroelectric one ranging from -70 to 31 meV. Both types of
structures are observed in CuBiP2Se6 crystals [4], indicating small energy differences. These
issues are pursued in subsequent subsections.
B. vanderWaalsforcesandthepropertiesofABP2X6bilayers
Table III lists the calculated energies of the antiferroelectric bilayers Aii and Aoo made
from ferroelectric monolayers, and well as energies for bilayers MA made from
antiferroelectric monolayers, relative to the energies of the ferroelectric bilayers F. In
addition, the calculated vertical displacements between the Cu and In or Bi atoms, Δz, are
listed in Supporting Data Table S1, with also the inter-layer spacings between the monolayers
of the bilayer, d, listed in Supporting Data Table S2. Further, the data from Tables II and III
is represented in a different way in Supporting Data Table S3 as the energy of binding ΔE of
the two monolayers to make the bilayer. This information, along with results from Table II,
is correlated in Figs. 5 and 6: Fig. 5 compares average energies of binding ΔE for CuInP2S6
versus those for CuBiP2Se6, whereas Fig. 6 compares average ΔE, Δz, and d values for each
individual compound. These averages are evaluated considering properties of the Aii, Aoo ,
MA, and F bilayers, with expanded results depicting each individual bilayer type shown in
Supporting Data Figs. S1-S5. While the expanded data reveal significant systematic
differences between results obtained for the various bilayer types, the features of greatest
relevance herein are independent of these perceived variations, being generic properties of
inter-layer interactions rather than specific structure-related effects.
First, we consider the average energies of binding, ΔE, of the monolayers. These are
indicative of the strength of the classic van der Waals attractive force that holds together
lamellar materials, biological structures, polymers, etc.. Figures 5 and S1, also Table S3,
show that most methods predict similar results for CuInP2S6 as for CuBiP2Se6. The binding
for CuBiP2Se6 is typically predicted to be 50 to 100 meV stronger than that for CuInP2S6,
consistent with the general expectation that the van der Waals forces are stronger within
CuBiP2Se6. There are some exceptions, however, with results ranging from -50 to 250 meV;
PBE-D2 predicts the greatest enhancement in binding while PBE-SCSTS depicts the reversed
effect. In absolute magnitude, the binding energies range from -400 to -800 meV per cell, all
indicative of strong binding yet the total magnitude shows considerable variation. PBE-
SCSTS binds the strongest, whereas PBE-TS binds the weakest.
Page 11
11
Next, Fig. 6a-b shows that the vertical displacements Δz between the Cu and In or Bi
atoms calculated for the bilayers strongly correlate with the values predicted for the
ferroelectric monolayer. This indicates that internal layer polarization is controlled by the
van der Waals forces acting within each layer and is not sensitive to van der Waals forces
acting between layers. Further, Figs. 6c-h show that there is no correlation between the
bilayer interaction energy ΔE or the bilayer inter-layer spacing d with Δz, indicating again
that the computational methods perceive the van der Waals forces acting between layers very
differently to how they perceive them acting within layers. These layered ABP2X6 materials
hence present a scenario in which the critical component is electron correlation at length
scales intermediary between the short-range part, which is normally well treated with GGA-
type density functionals, and the long-range part, which is normally well treated by DFT
dispersion correction approaches.
Of interest also is the magnitude of the optimized inter-layer spacings d. The different
van-der-Waals corrected methods used predict values over a substantial range, from 3.1 to 3.5
Å. As expected, the computational methods used that do not include van der Waals
corrections, PBE and HSE06, predict much larger values than those that do include them
(Table S2). PBE does not predict stable bilayers for the antiferroelectric bilayers of CuInP2S6
(Table S3) and hence the reported spacings d merely reflect the convergence criterion set for
the force minimization during the geometry optimization. Thus these methods fail severely
for the evaluation of the interlayer interactions, as expected. Of note, however, are the values
predicted by these methods for the short-range property Δz, which fall mid-way within the
range predicted by the van-der-Waals corrected methods. The van der Waals corrections,
with their associated modifications to the GGA density functionals, therefore seemingly
perturb the short-range correlation in a random way, sometimes enhancing it and sometimes
reducing it.
C. Assessmentofthecomputationalmethodsthroughexaminationofpredictedbulkproperties
Table IV lists calculated enthalpies ΔH for various polymorphs of bulk CuInP2S6 and
CuBiP2Se6, while Table V compares related calculated geometric properties with
observed values; results are provided for only the 12 computational methods not
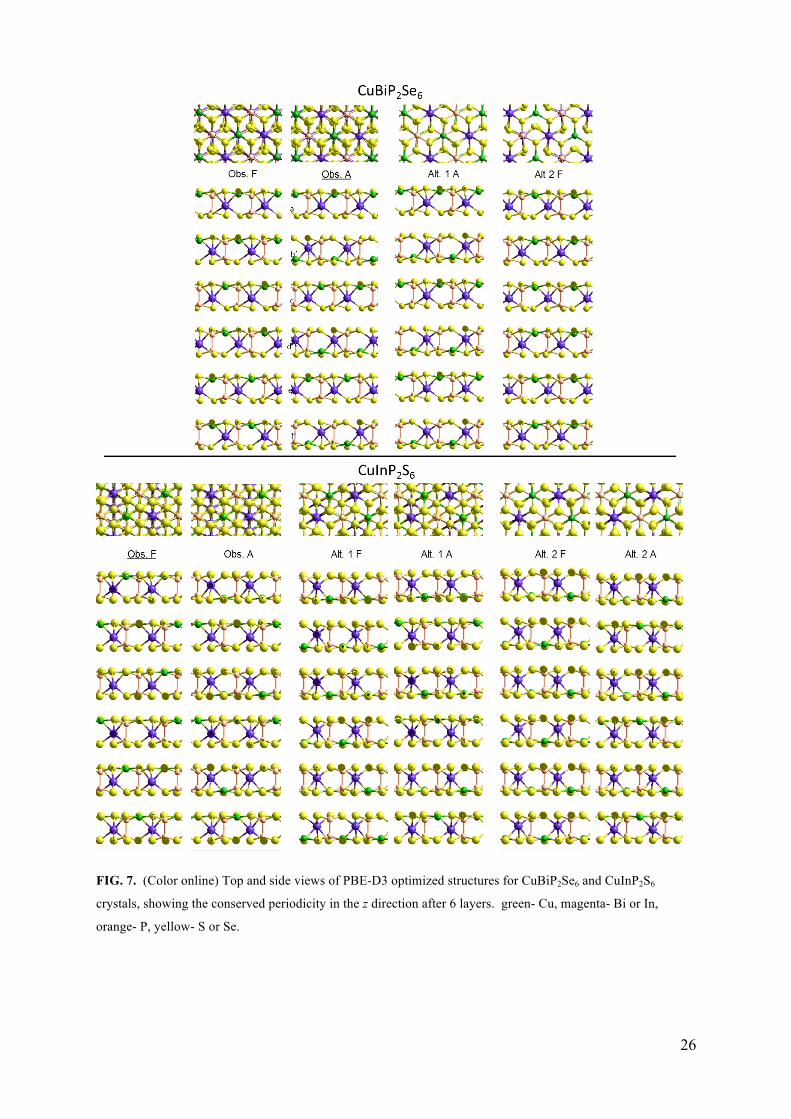
involving hybrid functionals. The structures considered are shown in Fig. 7. These are
all periodic after 6 layers in the direction normal to the plane, but some have only two
unique layers per cell. They include the observed low-temperature structure for each
Page 12
12
compound, as well as that modified by pushing the Cu atoms in every second layer to the
other side of their octahedral cavity (interchanging ferroelectric and antiferroelectric
arrangements) [15]. Other variants are also considered, inspired by scanning the bilayer
configuration space using the PBE-D3 method in search of alternative low-energy
arrangements. Two primary issues are considered: the ability of the different
computational methods to predict the actual observed polymorphs, and their ability to
predict accurately the structural details of those polymorph.
In Table IV, the calculated enthalpies at atmospheric pressure are listed with respect
to those for the observed low-temperature polymorphs; the associated relative interaction
energies ΔE are listed in Supporting Data Table S4 and are very similar. If the reported
enthalpy difference is negative, then the calculation predicts a result that is contrary to
low-temperature experimental observation. Only two methods correctly predict the
observed structure of both materials: revPBEvdW and vdwDF2. The data is summarized
in the column in the table that lists the total number of negative ΔH values predicted by
each method, i.e., the number of structures considered that are predicted to be more stable
than the observed structure. However, many enthalpy differences are quite small,
indicating in general that many polymorphs are likely to have similar enthalpies, making
the observed structure intrinsically difficult to predict. To allow for this, the last column
in the table lists the total number of predictions with a significant enthalpy error of
magnitude > 10 meV. Only three methods fail this less-demanding criterion: revPBE-D3,
PBE-SCSTS, and PBE-MBD@rsSCS.
Similarly, Table V shows deviations from experiment for the observed polymorph
pertaining to: the a axis vector length, the periodicity dimension normal to the layers, cz,
the interlayer distances across antiferroelectric boundaries (dii or doo) and ferroelectric
boundaries (dio), as well as the vertical separation between Cu and In or Bi atoms, Δz.
Summarizing the results, for each method, the number of properties for which there are
only small deviations and the number for which there are large deviations are counted in
the right-hand columns of the table. This reveals that PBE-D2 and optB88vdW perform
the best for quantitative geometrical predictions. However, a method that performs
poorly in Table IV for enthalpies, revPBE-D3, performs very well in this regard, whereas
conversely the methods that perform best for enthalpies, revPBEvdW and vdwDF2,
perform the worst of all van der Waals corrected approaches for geometrical properties.
This result is consistent with our recent comparison of van der Waals functionals in
broader contexts [41].
Page 13
13
D. Overallassessmentofthecomputationalmethods
Tables IV and V depict how the 12 computational methods not involving hybrid
functionals fare in terms of predicting observed properties of CuInP2S6 and CuBiP2Se6
crystals. However, not included therein are related properties of crystals containing
monolayers with internal random or antiferroelectric order, owing to feasibility issues
associated with the very large size of pertinent samples. Nevertheless, Tables II and III
indicate that such neglected considerations are important in assessing the performance of
different methods. Hence in Table VI we combine the summary information from Tables
III-IV, taking computed bilayer properties as being indicative of nanoflakes and bulk
solids that embody them. Table VI indicates, for each computational method, whether or
not a serious failure was identified in Tables IV-V or else implied in Table III. No such
serious failures are found for only PBE-D3 and optPBEvdW. Of particular note is that
PBE-MBDrsSCS, a method widely noted [24] as performing well for van der Waals
interactions over a very wide range of properties, including situations in which the van
der Waals forces cannot be described in terms of (fundamentally) pairwise-additive
contributions, is the only approach considered that shows significant failures in all
categories considered herein.
IV. CONCLUSIONS
The results presented allow two different types of conclusions to be drawn:
conclusions pertaining to the fundamental nature of ABP2X6 materials, and those
pertaining to assessment of the most appropriate computational method for making
quantitative property predictions. In the first case, conclusions flow from considering
both (i), the properties predicted robustly by all van der Waals computational approaches,
and (ii), the substantial differences that can occur in predicted properties and how these
differences correlate one to another. We consider these three aspects separately.
Recognized earlier [15] is that the van der Waals forces control interlayer ferroelectric
ordering in nanoflakes and solids of CuInP2S6 and CuBiP2Se6. This occurs as the inter-
layer van der Waals forces, which are significantly influenced by the embodied Cu-Cu
interactions, scale non-linearly in magnitude for bilayer junction types in order Aii > F >
Aoo. Hence as antiferroelectric crystals involve junctions of both Aoo and Aii types, partial
cancellation of the van der Waals contributions gives a net bonding effect that can favour
either the ferroelectric or the antiferroelectric forms, with the magnitude of this effect
being typically much greater than the electrostatic interactions that favour ferroelectric
Page 14
14
structures. The calculated enthalpies for all the variant structures and computational
methods listed in Table IV embody this qualitative effect, the details of which are
reflected in the bilayer energy differences listed in Table III. Hence we see that, while
different computational methods present significantly different results in terms of relative
polymorph energies and geometrical properties, the basic qualitative scenario describing
how ferroelectricity in ABP2X6 monolayers is controlled remains robustly described.
Substantial differences predicted for the internal structures of isolated ABP2X6
monolayers indicate that the van der Waal force, and in particular how it merges into
traditional short-range descriptions of electron correlation forces, as manifested using
various density functionals, controls internal monolayer structure. These contributions
overpower those from the traditional forces associated with covalent and/or ionic
bonding. This provides another example of the modern realization that van der Waals
forces can out-compete traditional ones to control chemical bonding [42, 43].
Hence two major effects of van der Waals forces in controlling the structure of
ABP2X6 monolayers, nanoflakes, and materials are identified: one acting within layers,
the other acting between layers. The calculations show no correlation between how
different van der Waals computational methods perceive these two types of effects.
Traditionally, van der Waals corrections have been optimized for the description of long-
range intermolecular forces, but here we see that how they merge with traditional
covalent forces at short range can be equally as important.
Only two computational approaches, PBE-D3 and optPBEvdW, showed no major
problems identified through quantitative comparison of calculated and observed
properties. However, the research strategy used in this work is significantly biased
against PBE-D3, as this method was used to seek out possibly competitive polymorphs;
the other methods are therefore only assessed in regard to issues for which PBE-D3 is
already identified as potentially failing. Repeating the calculations, searching for specific
possible weaknesses in the other computational approaches, could therefore reveal
additional undetected serious problems.
Mostly, the hybrid density functional methods HSE06 and HSE06-D3 performed
similarly to their GGA counterparts PBE and PBE-D3. However, the differences were
sometimes of the same order as those associated with variations in the van der Waals
corrections. Hence it is not clear that GGA methods are in general sufficient for the
robust treatment of ABP2X6 systems.
Page 15
15
Considering all of the methods associated with Grimme-type empirical dispersion
corrections (PBE-D2, PBE-D3, revPBE-D3, and HSE06-D3), for the examined properties
of each method, at most one serious failure per method is reported in Table VI. This is in
contrast to the results found for the Lundqvist family of methods: revPBEvdW,
optB88vdW, optPBEvdW, and vdWDF2. As with PBD-D3, Table VI reports no serious
failure for optPBEvdW, but revPBEvdW shows two out of three instances. In greater
detail, the results presented for the Grimme methods have smaller ranges in Figs. 3 and 6
than those from the Lundqvist set. Results for the Tkatchenko-Scheffler series of
methods PBE-TS, PBE-SCSTS, and PBE-MBD@rsSCS show mostly the least variations
in these figures (except for inter-layer binding energies), but they also show the most
significant failures as summarized in Table VI.
The Tkatchenko-Scheffler series present the most successful efforts so far to include
all commonly recognized important aspects of the dispersion interaction [44]. In terms of
the fundamental physics included, variations within this set are greater than those within
the Lundqvist and Grimme sets. Despite the shortcomings revealed herein, these
approaches depict a significant direction forward for research into accurate modelling of
the van der Waals force. In contrast, the Lundqvist family embody considerable effort in
properly representing many of the long-range aspects of dispersion but fail to deal with
the issue concerning how this long range part relates to the intrinsic GGA, relying on
empirical combinations with available GGA variants to deliver useful results. Grimme’s
methods are the most empirical but rely on the use of typically realistic expressions for
the long range part coupled with generally applicable merging strategies with the GGA
part.
During the study of ABP2X6 materials, both the long-range and short-range aspects of
van der Waals corrected density functions become important. Our results thus imply that
of the Lundqvist-type methods, optPBEvdW appears the most reasonable empirical
combination of the dispersion density functional with a GGA functional. Such a
conclusion is hazardous, however, as in general this family delivers widely varying and
unpredictable results when broadly applied [24]. From amongst the Grimme family and
many other empirical schemes, revPBE-D3 has been identified as one of the best general
approaches [45], yet for ABP2X6, PBE-D3 appears to be more reliable. Also, the most
advanced Tkatchenko-Scheffler-type method considered, PBE-MBD@rsSCS, predicts
the poorest results. In any required application, careful choice of van der Waals
correction remains a critical ongoing issue [24, 46].
Page 16
16
ACKNOWLEDGMENTS
This work was supported by resources provided by the National Computational Infrastructure
(NCI), and Pawsey Supercomputing Centre with funding from the Australian Government
and the Government of Western Australia, as well as Chinese NSF Grant #1167040630. This
work is also supported by the Australian Research Council, ARC DP160101301.
REFERENCES
1. J.R.Reimers,M.J.Ford,S.M.Marcuccio,J.Ulstrup,andN.S.Hush,NatureRev.Chem.,1,0017(2017).
2. A.Allain,J.Kang,K.Banerjee,andA.Kis,Nat.Mater.,14,1195(2015).3. V.Maisonneuve,V.B.Cajipe,A.Simon,R.VonDerMuhll,andJ.Ravez,Phys.Rev.B,56,
10860(1997).4. M.A.Gave,D.Bilc,S.D.Mahanti,J.D.Breshears,andM.G.Kanatzidis,Inorg.Chem.,44,
5293(2005).5. A.Simon,J.Ravez,V.Maisonneuve,C.Payen,andV.B.Cajipe,Chem.Mater.,6,1575(1994).6. A.Belianinov,Q.He,A.Dziaugys,P.Maksymovych,E.Eliseev,A.Borisevich,A.Morozovska,
J.Banys,Y.Vysochanskii,andS.V.Kalinin,NanoLetters,15,3808(2015).7. M.A.Susner,A.Belianinov,A.Borisevich,Q.He,M.Chyasnavichyus,H.Demir,D.S.Sholl,P.
Ganesh,D.L.Abernathy,M.A.McGuire,andP.Maksymovych,ACSNano,9,12365(2015).8. M.Chyasnavichyus,M.A.Susner,A.V.Ievlev,E.A.Eliseev,S.V.Kalinin,N.Balke,A.N.
Morozovska,M.A.McGuire,andP.Maksymovych,Appl.Phys.Lett.,109,172901(2016).9. F.Liu,L.You,K.L.Seyler,X.Li,P.Yu,J.Lin,X.Wang,J.Zhou,H.Wang,H.He,S.T.Pantelides,
W.Zhou,P.Sharma,X.Xu,P.M.Ajayan,J.Wang,andZ.Liu,NatureCommunications,7,12357(2016).
10. V.Maisonneuve,V.B.Cajipe,andC.Payen,Chem.Mater.,5,758(1993).11. E.Durand,G.Ouvrard,M.Evain,andR.Brec,Inorg.Chem.,29,4916(1990).12. V.Maisonneuve,M.Evain,C.Payen,V.B.Cajipe,andP.Molinié,J.AlloysComp.,218,157
(1995).13. D.M.Bercha,S.A.Bercha,K.E.Glukhov,andM.Sznajder,ActaPhysicaPolonicaA,126,
1143(2014).14. A.K.Tagantsev,K.Vaideeswaran,S.B.Vakhrushev,A.V.Filimonov,R.G.Burkovsky,A.
Shaganov,D.Andronikova,A.I.Rudskoy,A.Q.R.Baron,H.Uchiyama,D.Chernyshov,A.Bosak,Z.Ujma,K.Roleder,A.Majchrowski,J.H.Ko,andN.Setter,NatureCommunications,4,2229(2013).
15. J.R.Reimers,S.A.Tawfik,andM.J.Ford,ChemicalScience,submitted(2018).16. J.P.Perdew,K.Burke,andM.Ernzerhof,Phys.Rev.Lett.,77,3865(1996).17. M.A.Susner,A.Belianinov,A.Borisevich,Q.He,M.Chyasnavichyus,H.Demir,D.S.Sholl,P.
Ganesh,D.L.Abernathy,M.A.McGuire,andP.Maksymovych,ACSNano,9,12365(2015).18. S.-H.Wei,S.B.Zhang,andA.Zunger,Phys.Rev.Lett.,70,1639(1993).19. A.Trueba,P.García-Fernández,M.T.Barriuso,M.Moreno,andJ.A.Aramburu,Phys.Rev.B,
80,035131(2009).20. Y.X.Wang,SolidStateCommun.,135,290(2005).21. Y.Wang,X.Liu,J.D.Burton,S.S.Jaswal,andE.Y.Tsymbal,Phys.Rev.Lett.,109,247601
(2012).22. W.Cochran,AdvancesinPhysics,9,387(1960).23. A.V.Krukau,O.A.Vydrov,A.F.Izmaylov,andG.E.Scuseria,J.Chem.Phys.,125,224106
(2006).
Page 17
17
24. J.R.Reimers,M.Li,D.Wan,T.Gould,andM.J.Ford,inNoncovalentinteractionsinquantumchemistryandphysics:Theoryandapplications,editedbyA.OterodelaRoza,andG.DiLabio(Elsevier,Amsterdam,2017),pp.Ch.13.
25. H.Rydberg,M.Dion,N.Jacobson,E.Schroder,P.Hyldgaard,S.I.Simak,D.C.Langreth,andB.I.Lundqvist,Phys.Rev.Lett.,91,126402(2003).
26. S.Grimme,J.Comput.Chem.,27,1787(2006).27. S.Grimme,J.Antony,S.Ehrlich,andH.Krieg,J.Chem.Phys.,132,154104(2010).28. J.Moellmann,andS.Grimme,TheJournalofPhysicalChemistryC,118,7615(2014).29. G.Kresse,andJ.Hafner,Phys.Rev.B,47,558(1993).30. G.Kresse,andD.Joubert,Phys.Rev.B,59,1758(1999).31. B.Hammer,L.B.Hansen,andJ.K.Nørskov,PhysicalReviewB-CondensedMatterand
MaterialsPhysics,59,7413(1999).32. S.N.Steinmann,andC.Corminboeuf,J.Chem.Phys.,134,044117(2011).33. A.Tkatchenko,andM.Scheffler,Phys.Rev.Lett.,102,073005(2009).34. A.Tkatchenko,R.A.DiStasio,R.Car,andM.Scheffler,Phys.Rev.Lett.,108,236402(2012).35. A.Ambrosetti,A.M.Reilly,R.A.DistasioJr,andA.Tkatchenko,J.Chem.Phys.,140,18A508
(2014).36. B.Tomáš,L.Sébastien,G.Tim,andG.Á.János,J.Phys.:Condens.Matter,28,045201(2016).37. M.Dion,H.Rydberg,E.Schröder,D.C.Langreth,andB.I.Lundqvist,Phys.Rev.Lett.,92,
246401(2004).38. J.Klimeš,D.R.Bowler,andA.Michaelides,Phys.Rev.B,83,195131(2011).39. K.Lee,A.K.Kelkkanen,K.Berland,S.Andersson,D.C.Langreth,E.Schröder,B.I.Lundqvist,
andP.Hyldgaard,J.Phys.:Condens.Matter,84,193408(2011).40. J.P.Perdew,andY.Wang,Phys.Rev.B,33,8800(1986).41. J.Claudot,W.J.Kim,A.Dixit,H.Kim,T.Gould,D.Rocca,andS.Lebègue,TheJournalof
ChemicalPhysics,148,064112(2018).42. J.R.Reimers,M.J.Ford,S.M.Marcuccio,J.Ulstrup,andN.S.Hush,NatureRev.Chem.,1,
0034(2017).43. J.R.Reimers,M.J.Ford,A.Halder,J.Ulstrup,andN.S.Hush,Proc.Natl.Acad.Sci.U.S.A.,
113,E1424(2016).44. J.F.Dobson,Int.J.QuantumChem.,114,1157(2014).45. L.Goerigk,A.Hansen,C.Bauer,S.Ehrlich,A.Najibi,andS.Grimme,Phys.Chem.Chem.
Phys.,19,32184(2017).46. L.Goerigk,inNoncovalentinteractionsinquantumchemistryandphysics:Theoryand
applications,editedbyA.OterodelaRoza,andG.DiLabio(Elsevier,Amsterdam,2017),pp.submitted.
Page 18
18
TABLE I: The numbered computational methods used in this study, indicating the density functional used and its vdW
correction.
# Method functional vdW
0 PBE PBE -
1 HSE06 HSE06 -
2 revPBE-D3 revPBE D3
3 PBE-D2 PBE D2
4 PBE-D3 PBE D3
5 HSE06-D3 HSE06 D3
6 PBE-dDsC PBE dDsC
7 PBE-TS PBE TS
8 PBE-SCSTS PBE PBE-SCSTS
9 PBE-MBD@rsSCS PBE MBD@rsSCS
A revPBEvdW revPBE Dion
B optB88vdW optB88 Dion
C optPBEvdW optPBE Dion
D vdWDF2 PW86 Dion-Lee
TABLE II: Calculated properties of CuBiP2Se6 and CuInP2S6 monolayers, including the z coordinate change
between Cu and In/Bi atoms (Δz, in Å), the z coordinate change between the two Cu atoms in the
antiferroelectric structure (ΔzCuCu, in Å), the in-plane displacement between Cu and In/Bu (Δx, in Å), and the
relative energies of other polymorphs with respect to the F polymorph (ΔEF, in meV per cell).
Method CuBiP2Se6 CuInP2S6
Δza ΔzCuCu Δxb ΔEF Δza ΔzCuCu Δxb ΔEF
F A Ps Pl Ps Pl A
F A Ps Pl Ps Pl A
PBE 1.71 1.84 3.03 4.18 60 121 -42 1.70 3.09 2.82 3.73 250 291 -32 HSE06 1.60 2.57 3.16 4.19 56 129 23 1.65 2.96 2.91 3.71 232 233 -34
revPBE-D3 1.27 1.44 3.14 4.21 24 56 -49 1.41 2.55 2.93 3.70 188 212 -6 PBE-D2 1.40 1.58 3.07 4.19 54 80 -70 1.44 2.59 2.98 3.62 225 209 -25 PBE-D3 1.57 2.67 3.04 4.09 84 148 27 1.64 2.93 2.83 3.64 269 311 -17
HSE06-D3 1.62 2.64 3.16 4.07 78 111 30 1.65 2.96 2.85 3.79 257 253 -33 PBE-dDsC 1.59 1.72 3.03 4.11 19 74 -53 1.63 2.92 2.84 3.69 214 245 -19
PBE-TS 1.59 1.68 3.04 4.14 10 65 -59 1.63 2.91 2.84 3.70 183 212 -19 PBE-SCSTS 1.72 2.98 3.02 4.21 71 136 15 1.75 3.15 2.80 3.73 237 310 -46
PBE-MBD@rsSCS 1.72 2.96 3.05 3.91 113 166 31 1.75 3.13 2.84 3.80 315 351 -20 revPBEvdW 1.83 2.97 3.08 4.17 113 162 15 1.78 3.22 2.91 3.66 264 283 -22 optB88vdW 1.58 1.69 3.02 4.33 -4 51 -62 1.63 2.90 2.84 3.62 171 194 -15 optPBEvdW 1.71 1.81 3.05 4.17 60 112 -35 1.69 3.10 2.88 3.66 225 246 -17
vdWDF2 1.97 3.39 3.11 4.15 219 270 22 1.89 3.43 2.99 3.59 371 377 -10 a: zero as a result of C2 symmetry in paraelectric structures b: values resulting from the hexagonal symmetry of F structures: 3.783 Å for CuBiP2Se6, 3.515 Å for CuInP2S6.
Page 19
19
TABLE III. Energy of alternate structures with respect to the ferroelectric one, in meV, for bilayers of CuBiP2Se6 and CuInP2S6.
method
CuBiP2Se6 CuInP2S6 Nber.a < -30
ΔEAii ΔEAoo ΔEMA ΔEMA -
(ΔEAii+ΔEAoo)/2
ΔEAii ΔEAoo ΔEMA
PBE -1 2 -80 -81 5 7 -78 2
HSE06 -5 6 48 48 -11 0 -73 1
revPBE-D3 -63 56 -18 -15 -81 73 8 0
PBE-D2 -42 35 -69 -66 -42 41 -38 2
PBE-D3 -86 61 30 43 -92 88 -22 0
HSE06-D3 -64 32 69 85 -59 65 -57 1
PBE-dDsC -36 6 -74 -59 -33 44 -36 2
PBE-TS -45 29 -75 -67 -43 46 -22 0
PBE-SCSTS -76 43 52 69 -100 101 -79 1
PBE-MBD@rsSCS -87 51 77 95 -83 73 -26 1
revPBEvdW -26 5 54 65 -22 29 -33 1
optB88vdW -40 17 -65 -54 -40 42 -13 1
optPBEvdW -31 12 -22 -13 -30 38 -22 0
vdWDF2 -23 -7 64 79 -26 36 -4 0 a: number of entries in the CuBiP2Se6 ΔEMA - (ΔEAii+ΔEAoo)/2 and CuInP2S6 ΔEMA columns < - 30 meV,
suggesting that antiferroelectric monolayers should dominate structures instead of the observed structures.
TABLE IV. Calculated polymorph enthalpies H, in meV per cell, relative to those for the observed crystal structures of CuBiP2Se6 and CuInP2S6 for various considered alternative layer alignments and ferroelectric orderings.
Sample: CuBiP2Se6 CuInP2S6 Nber. resultsa
Alignment: Obs.b Alt. 1 Alt. 2 Obs. Alt. 1 Alt. 2 < 0 < -10 Structure: A F A F A F A F A F
Symmetry: C3, i C3 C3, i C3 i - i - C3, i C3 PBE [0] -3 0 0 10 [0] 13 2 12 4 1 0
revPBE-D3 [0] 5 25 0 5 [0] -15 -11 -14 -23 4 4PBE-D2 [0] 2 35 -7 11 [0] 5 -3 6 -9 3 0PBE-D3 [0] 7 28 2 11 [0] 5 -2 5 -6 2 0
PBE-dDsC [0] 8 27 4 18 [0] 19 -1 12 -1 2 0PBE-TS [0] 5 31 11 13 [0] 11 -1 12 -2 2 0
PBE-SCSTS [0] 5 16 9 14 [0] 1 -8 -3 -17 3 1PBE-MBD@rsSCS [0] 6 15 10 9 [0] -8 -12 -13 -24 4 3
revPBEvdW [0] 4 7 8 14 [0] 15 0 12 0 0 0optB88vdW [0] 5 37 -5 17 [0] 12 -3 10 -6 2 0optPBEvdW [0] 6 20 5 16 [0] 15 -1 11 -2 2 0
vdWDF2 [0] 9 17 12 15 [0] 23 3 16 6 0 0a: To adequately describe the experimental data, all reported numbers should be positive; the number of negative results, and also significant results < -10 meV are noted. b: these structures are periodic after 6 layers in the c direction, otherwise they are periodic after 2 layers.
Page 20
20
TABLE V. Differences in calculated properties from the (listed) observed crystal data for CuBiP2Se6 and CuInP2S6, in Å.
CuBiP2Se6 CuInP2S6 Nber. resultsa
a cz dii doo Δzb a b cz dio Δz OK large err.
obs 6.55 13.25 3.07 3.13 1.48 6.09 6.09 12.97 3.17 1.75 PBE 0.09 1.70 0.82 0.70 0.21 0.08 0.08 1.59 0.70 -0.05 4 5
revPBE-D3 0.06 0.12 -0.01 0.06 -0.11 0.04 0.04 0.17 0.03 -0.22 8 0 PBE-D2 0.01 0.03 -0.04 0.01 -0.03 0.01 0.01 0.20 0.04 -0.22 9 0 PBE-D3 0.04 0.18 0.02 0.05 0.16 0.02 0.02 0.24 0.05 -0.01 8 0
PBE-DFTdDsC 0.01 0.25 0.08 0.10 0.12 0.01 0.01 0.25 0.06 -0.01 7 0 PBE-TS 0.07 0.49 0.20 0.12 0.30 0.05 0.05 0.43 0.14 0.10 4 2
PBE-SCSTS 0.08 0.57 0.24 0.15 0.29 0.06 0.06 0.26 0.05 0.08 5 0 PBE-MBDrsSCS 0.03 0.34 0.10 0.13 0.17 0.01 0.01 0.32 0.09 0.01 6 1
revPBEvdW 0.23 1.15 0.44 0.36 0.29 0.18 0.18 0.89 0.30 0.06 1 4 optB88vdW 0.04 0.10 -0.01 0.00 0.12 0.03 0.03 0.11 -0.02 0.03 9 0 optPBEvdW 0.13 0.56 0.19 0.14 0.22 0.10 0.10 0.48 0.13 0.04 3 0
vdWDF2 0.29 0.98 0.32 0.21 0.38 0.22 0.22 0.74 0.19 0.17 0 4 a: OK results are taken to be those within ± 0.2 Å for cz and ± 0.1 Å otherwise, whereas those with large errors are taken to be those without 0.6 Å for cz and ± 0.3 Å, respectively. b: The observed crystal structures are for mixtures of polymorphs and so the observed value is likely to be underestimated; this data is not included in the results summary. TABLE VI. Summary of significant errors identified in calculation predictions (from Tables III-V).
obs MA suggested Crystal geometries Crystal energetics PBE x x
HSE06 x - -
revPBE-D3 x
PBE-D2 x
PBE-D3
HSE06-D3 x - -
PBE-dDsC x
PBE-TS x
PBE-SCSTS x x
PBE-MBD@rsSCS x x x
revPBEvdW x x
optB88vdW x
optPBEvdW
vdWDF2 x
Page 21
21
FIG. 1. (Color online) Top and sectioned side views of ABP2X6 monolayers, where A = Cu is in green, B = Bi or In is in
magenta, X = S or Se is in yellow, and P is in orange, in a hypothetical high symmetry structure (O) and that after in-plane
distortions of the Cu atom to make paraelectric (Ps, Pl) structures or else out-of-plane distortions to make polarized structures
with internal long-range ferroelectric (F) or antiferroelectric (A) order. Highlighted are in-plane axes of local C2 symmetry
and normal axes of either S6 or C3 symmetry about the Cu atoms, as well as the normal (Δz) and in-plane (Δx) displacements
of the Cu atom with respect to the Bi or In atom, in Å. The shown structures and energies per cell were optimized using
PBE-D3 for CuBiP2Se6, with, in (), analogous energies for CuInP2S6.
Page 22
22
FIG. 2. Schematic representation of the possible ferroelectric (F), antiferroelectric (A), random (R), and
paraelectric (P) dipole polarizations in single cells, monolayers, and bilayers of ABP2X6 compounds; structure MA
is a bilayer with inversion symmetry made from antiferroelectric monolayers. The arrows indicate the displacement
direction of the Cu atoms from the octahedral site (O), see Fig. 1 for atomic-scale details.
FIG. 3. Comparison of the calculated Cu to Bi or In distances Δz for ferroelectric monolayers for CuInP2S6 and
CuBiP2Se6, (a), and these quantities compared to the Cu-Cu vertical distance ΔzCuCu for antiferroelectric
monolayers, (b)-(c), for the various computational methods 0-D defined in Table I.
Page 23
23
FIG. 4. (Color online) Top and side views of possible structures considered for bilayers of CuBiP2Se6 and
CuInP2S6, (PBE-D3 optimized structures shown); green- Cu, magenta- Bi or In, orange- P, yellow- S or Se.
Page 24
24
FIG. 5. (Color online) Comparison of calculated average bilayer interaction energies ΔE per cell for CuInP2S6
versus CuBiP2Se6, for the computational methods 0-D defined in Table I.
Page 25
25
FIG. 6. (Color online) Correlations between monolayer and/or bilayer properties of CuBiP2Se6 and CuInP2S6,
for the computational methods 0-D defined in Table I: Δz- difference in out-of-plane displacement of Cu and
In/Bi atoms; ΔzCuCu- difference in out-of-plane displacement of the two Cu atoms in monolayer antiferroelectric
1×√3 double cells; d- bilayer interlayer spacing; and ΔE- bilayer interaction energy between cells.
Page 26
26
FIG. 7. (Color online) Top and side views of PBE-D3 optimized structures for CuBiP2Se6 and CuInP2S6
crystals, showing the conserved periodicity in the z direction after 6 layers. green- Cu, magenta- Bi or In,
orange- P, yellow- S or Se.