Page 1
The University of AkronIdeaExchange@UAkron
Honors Research Projects The Dr. Gary B. and Pamela S. Williams HonorsCollege
Spring 2018
Vanadium redox flow batteries: design andexperimentationMatthew [email protected]
Please take a moment to share how this work helps you through this survey. Your feedback will beimportant as we plan further development of our repository.Follow this and additional works at: http://ideaexchange.uakron.edu/honors_research_projects
Part of the Other Chemical Engineering Commons
This Honors Research Project is brought to you for free and open access by The Dr. Gary B. and Pamela S. WilliamsHonors College at IdeaExchange@UAkron, the institutional repository of The University of Akron in Akron, Ohio,USA. It has been accepted for inclusion in Honors Research Projects by an authorized administrator ofIdeaExchange@UAkron. For more information, please contact [email protected] , [email protected] .
Recommended CitationGeorge, Matthew, "Vanadium redox flow batteries: design and experimentation" (2018). Honors Research Projects.666.http://ideaexchange.uakron.edu/honors_research_projects/666
Page 2
Vanadium redox flow batteries: design and experimentation
Matthew George
Department of Chemical Engineering
Honors Research Project
Submitted to
The Honors College
Approved: Accepted:
______________________ Date ________ __________________ Date _________
Honors Project Sponsor (signed) Department Head (signed)
______________________________ _______________________
Honors Project Sponsor (printed) Department Head (printed)
______________________ Date _______ __________________ Date ________
Reader (signed) Honors Faculty Advisor (signed)
_________________________ _____________________________
Reader (printed) Honors Faculty Advisor (printed)
______________________ Date _______ __________________ Date _________
Reader (signed) Dean, Honors College
_________________________________
Reader (printed)
Page 3
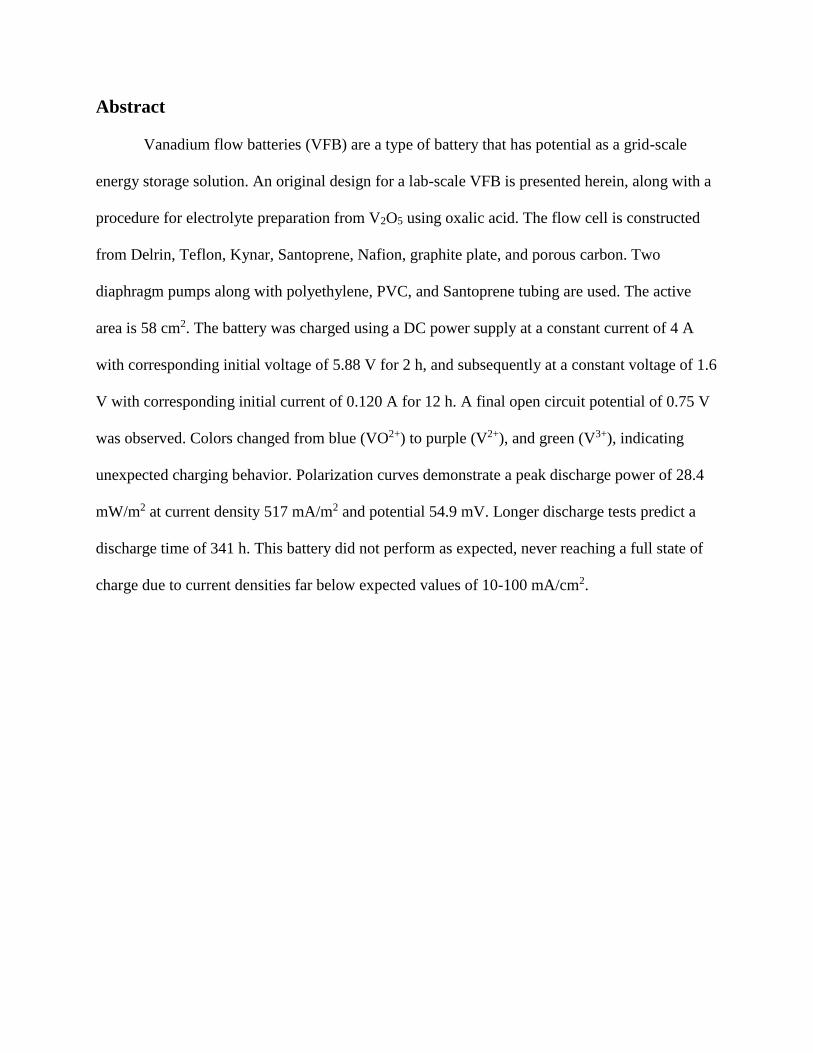
Abstract
Vanadium flow batteries (VFB) are a type of battery that has potential as a grid-scale
energy storage solution. An original design for a lab-scale VFB is presented herein, along with a
procedure for electrolyte preparation from V2O5 using oxalic acid. The flow cell is constructed
from Delrin, Teflon, Kynar, Santoprene, Nafion, graphite plate, and porous carbon. Two
diaphragm pumps along with polyethylene, PVC, and Santoprene tubing are used. The active
area is 58 cm2. The battery was charged using a DC power supply at a constant current of 4 A
with corresponding initial voltage of 5.88 V for 2 h, and subsequently at a constant voltage of 1.6
V with corresponding initial current of 0.120 A for 12 h. A final open circuit potential of 0.75 V
was observed. Colors changed from blue (VO2+) to purple (V2+), and green (V3+), indicating
unexpected charging behavior. Polarization curves demonstrate a peak discharge power of 28.4
mW/m2 at current density 517 mA/m2 and potential 54.9 mV. Longer discharge tests predict a
discharge time of 341 h. This battery did not perform as expected, never reaching a full state of
charge due to current densities far below expected values of 10-100 mA/cm2.
Page 4
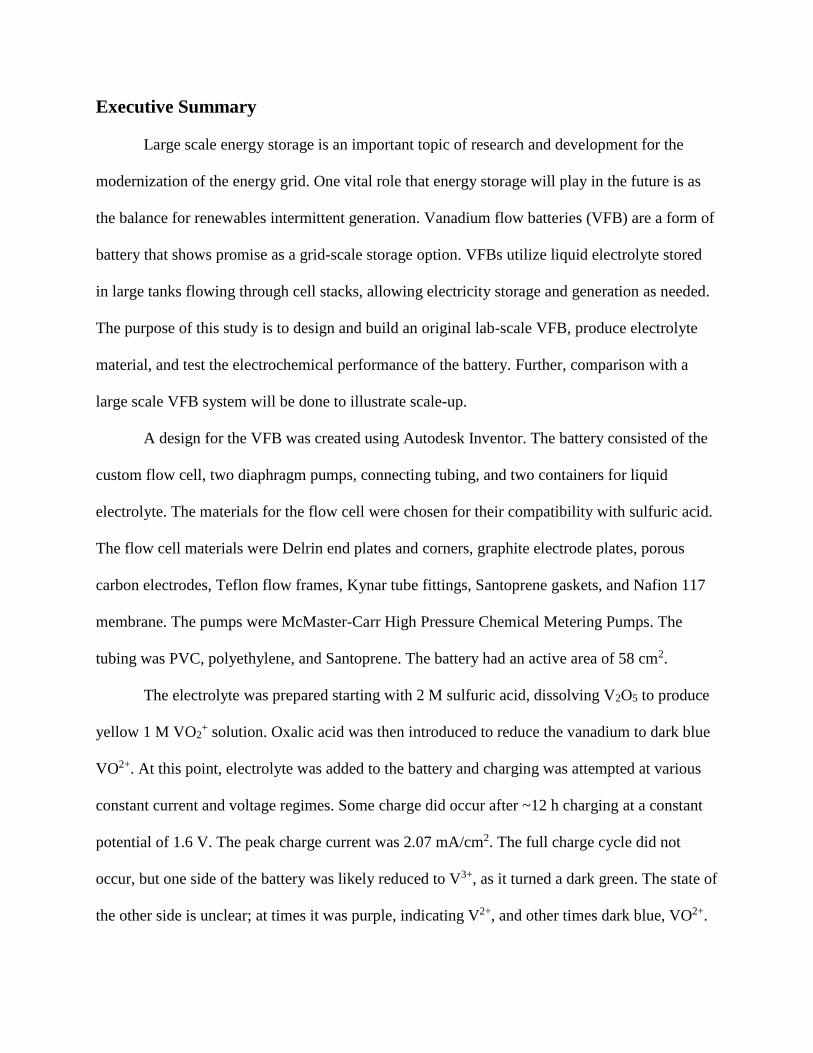
Executive Summary
Large scale energy storage is an important topic of research and development for the
modernization of the energy grid. One vital role that energy storage will play in the future is as
the balance for renewables intermittent generation. Vanadium flow batteries (VFB) are a form of
battery that shows promise as a grid-scale storage option. VFBs utilize liquid electrolyte stored
in large tanks flowing through cell stacks, allowing electricity storage and generation as needed.
The purpose of this study is to design and build an original lab-scale VFB, produce electrolyte
material, and test the electrochemical performance of the battery. Further, comparison with a
large scale VFB system will be done to illustrate scale-up.
A design for the VFB was created using Autodesk Inventor. The battery consisted of the
custom flow cell, two diaphragm pumps, connecting tubing, and two containers for liquid
electrolyte. The materials for the flow cell were chosen for their compatibility with sulfuric acid.
The flow cell materials were Delrin end plates and corners, graphite electrode plates, porous
carbon electrodes, Teflon flow frames, Kynar tube fittings, Santoprene gaskets, and Nafion 117
membrane. The pumps were McMaster-Carr High Pressure Chemical Metering Pumps. The
tubing was PVC, polyethylene, and Santoprene. The battery had an active area of 58 cm2.
The electrolyte was prepared starting with 2 M sulfuric acid, dissolving V2O5 to produce
yellow 1 M VO2+ solution. Oxalic acid was then introduced to reduce the vanadium to dark blue
VO2+. At this point, electrolyte was added to the battery and charging was attempted at various
constant current and voltage regimes. Some charge did occur after ~12 h charging at a constant
potential of 1.6 V. The peak charge current was 2.07 mA/cm2. The full charge cycle did not
occur, but one side of the battery was likely reduced to V3+, as it turned a dark green. The state of
the other side is unclear; at times it was purple, indicating V2+, and other times dark blue, VO2+.
Page 5
The max open circuit potential observed was 0.75 V. Polarization curves obtained from the
charged battery show a peak discharge power of 28.4 mW/m2 at a current density of 517 mA/m2
and a potential of 54.9 mV. Due to the very low current density, the full discharge time is
estimated to be 341 h. To achieve a power output that would be useful in grid scale storage, e.g.
2 kW, a battery with the observed power density would need an active area of 1720 m2.
This battery did not operate as expected based on literature about VFBs. A typical range
for current density is 10-100 mA/cm2, which is much larger than observed in this study. This
makes comparison between the battery created and real examples nearly impossible. It is
apparent that the battery did not ever fully charge; this is a direct result of the very low current
density observed.
As a result of work on this project, I improved or learned skills in the following areas:
Design and safe operation of systems handling fluid flow
Principles governing redox flow batteries
Electrochemical tests
Material of construction as it relates to design and safety
This project could be of benefit to society by inspiring further work in research and development
of redox flow batteries. The transition to low-carbon energy is not optional if the negative effects
of climate change are to be mitigated, and VFBs are a promising way to expand the viability of
intermittent power sources such as wind and solar. Additionally, this study demonstrates a design
for a lab-scale VFB that can be constructed without buying commercially available kits. With
some optimization, it could be useful to other labs investigating redox flow batteries.
Because of the failed results of this study, it raises more questions for future work than it
answers. The design of the lab-scale battery needs to be scaled down further to reduce the
Page 6
volume of electrolyte required for recirculation. The porous carbon electrode material needs to
be tested to see what impact is has on current density, or if some other material can improve on
it. The electrolyte preparation needs to be tested to see if oxalic acid is interfering with the
charge cycle. The electrolyte should be tested with different concentrations of sulfuric acid and
VO2+. The charge should be performed over a wider range of voltages and currents to assess if
side reactions are occurring. Once the charge cycle is figured out, a whole battery of tests could
be performed to better optimize the operation of the VFB.
Page 7
Introduction
The renewable energy revolution is taking place across the globe. With many
governments and companies investing in wind, solar, and other green technologies, there is
worldwide consensus on the need to reduce carbon footprint in power generation. One major
hindrance to the adoption of widespread solar and wind energy is intermittent generation. The
availability of large scale, cheap, reliable energy storage will be necessary as the generating
capacity of wind and solar grows as a portion of total capacity. While there are many different
types of energy storage, one promising form of technology that has great potential for increased
adoption is flow batteries. Flow batteries utilize liquid phase redox reactions in a flowing
electrolyte to store and release electrical energy.
Flow batteries have an important advantage over other kinds of batteries in that the power
and energy capacity of a given system are independent. The surface area at the electrodes
determines power capacity, while the volume of electrolyte determines energy capacity. This
allows for flexible energy storage. Vanadium flow batteries (VFB) are one of the most common
types of flow battery. Of the various chemistries that are used in flow batteries, vanadium has a
few advantages. Having accessible oxidation states from 2+ to 5+ means that it can be used on
the anode and cathode side of the battery. This means that the usual risk of electrolyte crossover
across the ion exchange membrane is greatly reduced, as both sides use vanadium ions as the
active material. VFBs can be stable over long lifetimes compared to other types of chemical
batteries because they avoid solid-liquid phase change reactions. All of the vanadium ion
reactions can occur without any precipitation or ion diffusion through a solid electrode material.
The lack of expensive solid materials also means that VFBs can be cheaper than other
conventional battery designs at large scale.
Page 8
The purpose of this project is first to gain experience in battery design, and second to
learn about operating a VFB. The final goal is to learn about battery design, safety, and operation
on a larger scale, based on the lab battery. The scope of this project is to custom design and build
the flow cell for a VFB, choose components and assemble the flow system, prepare the
electrolyte according to a no-waste procedure, perform electrochemical tests to assess the
charge-discharge performance of the battery, and do calculations to see how this battery would
perform in a grid-scale storage application.
Background
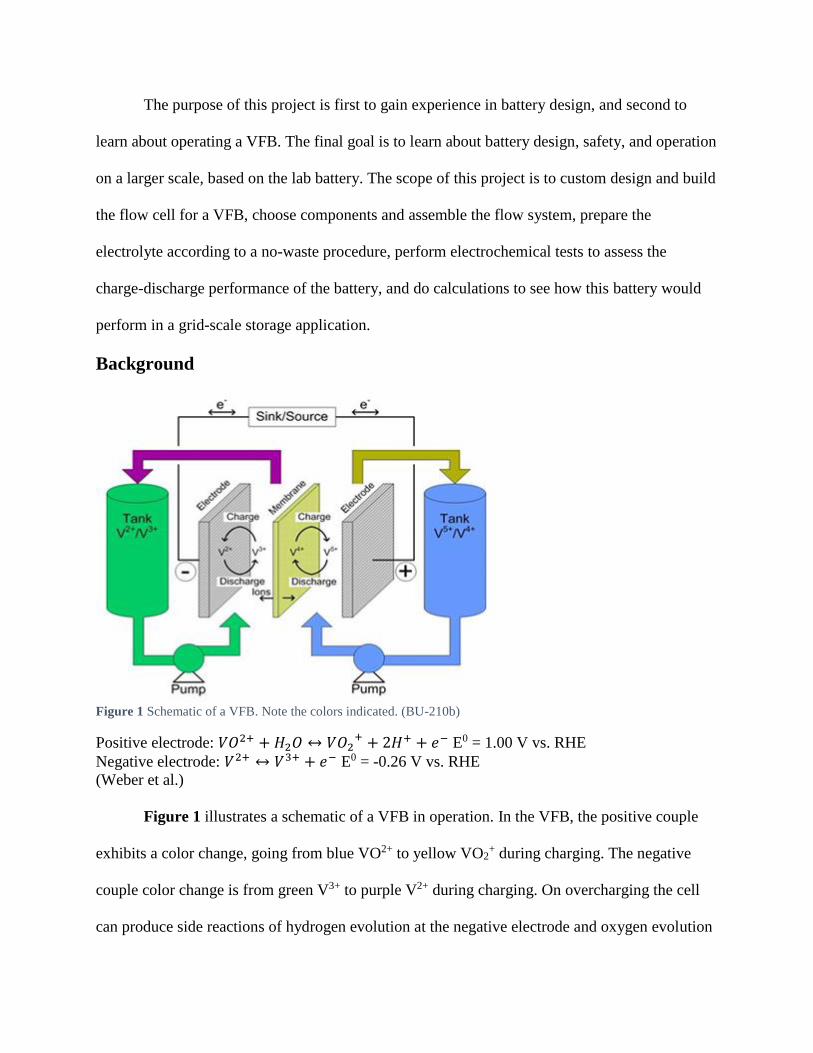
Figure 1 Schematic of a VFB. Note the colors indicated. (BU-210b)
Positive electrode: 𝑉𝑂2+ + 𝐻2𝑂 ↔ 𝑉𝑂2+ + 2𝐻+ + 𝑒− E0 = 1.00 V vs. RHE
Negative electrode: 𝑉2+ ↔ 𝑉3+ + 𝑒− E0 = -0.26 V vs. RHE
(Weber et al.)
Figure 1 illustrates a schematic of a VFB in operation. In the VFB, the positive couple
exhibits a color change, going from blue VO2+ to yellow VO2+ during charging. The negative
couple color change is from green V3+ to purple V2+ during charging. On overcharging the cell
can produce side reactions of hydrogen evolution at the negative electrode and oxygen evolution
Page 9
at the positive electrode (Kear et al.). Typical concentrations of vanadium are around 2 M, but
research is being done on increased concentrations, up to 3.0-3.5 M in order to improve energy
density. Concentration is a limitation because V (V) solutions have a tendency to precipitate out
at temperatures above 40 °C (Rahman & Skyllas-Kazacos). There are many challenges and
complications within the design of VFBs. Principle concerns are membrane design, electrolyte
stability and concentration, and electrode material and design (Ding et al.).
There are a few documented methods of producing the VFB electrode. They all center on
sulfuric acid and typically either V2O5 (vanadium oxide) or VOSO4 (vanadyl sulfate). These
processes require some excess positive electrolyte in order to convert VO2+ to V2+ over two
charge cycles. This can be avoided by using oxalic acid to reduce the VO2+ obtained after the
first charge back to VO2+. After another charge cycle, V2+ and VO2+ are obtained without any
waste (Li et al.).
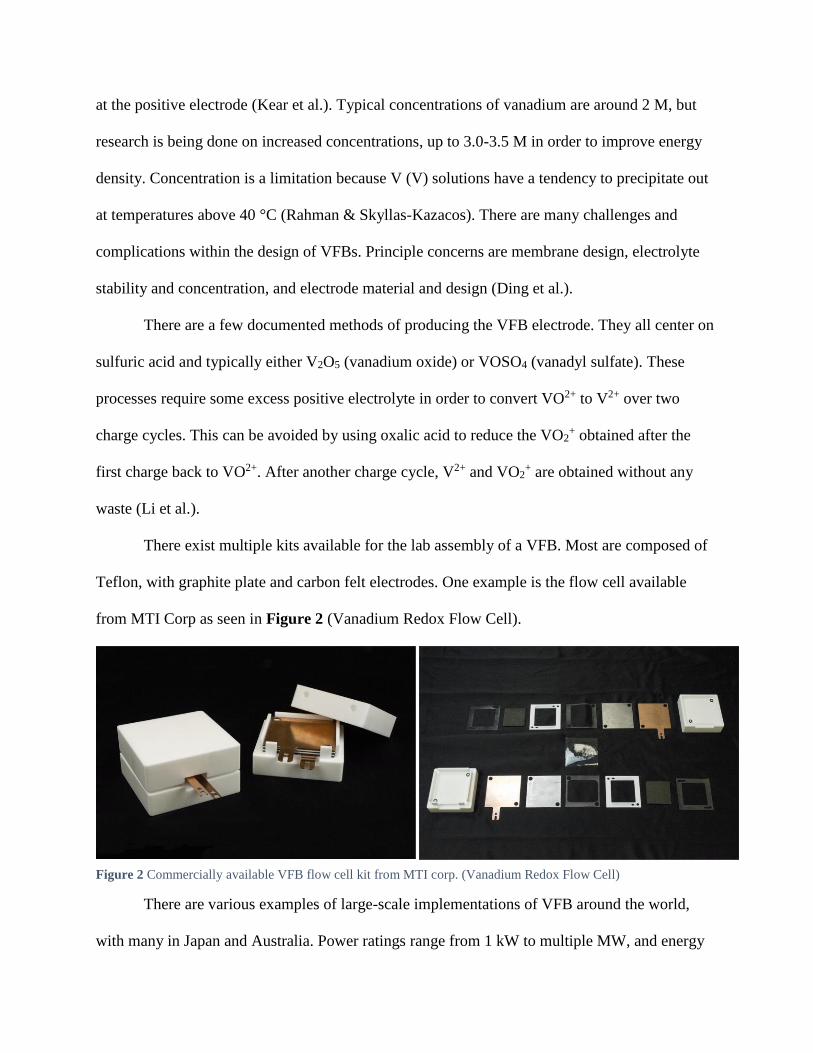
There exist multiple kits available for the lab assembly of a VFB. Most are composed of
Teflon, with graphite plate and carbon felt electrodes. One example is the flow cell available
from MTI Corp as seen in Figure 2 (Vanadium Redox Flow Cell).
There are various examples of large-scale implementations of VFB around the world,
with many in Japan and Australia. Power ratings range from 1 kW to multiple MW, and energy
Figure 2 Commercially available VFB flow cell kit from MTI corp. (Vanadium Redox Flow Cell)
Page 10
capacities from 1 kWh to 10 MWh. These are used in various applications such as load-leveling,
power quality maintenance, and renewables support. Energy efficiencies are in the range of 70-
90%, with similar total system power efficiencies. For an example 2kW/30kWh system, the total
flow cell cost was $1620/kW and total storage cost was $109/kWh (Kear et al.).
Experimental Methods
A full battery design was produced, including original drawings and parts for the flow
cell, along with selection of parts for pumping and flow. The flow cell was constructed from
Teflon flow frames, Delrin end plates and corners, Santoprene gaskets, Kynar tube fittings,
Nafion 117 membrane, Graphite plates, porous carbon, and copper strips. It was held under
compression using 316 stainless steel threaded rods, washers, and nuts. The remaining
components were the diaphragm pumps (McMaster-Carr High Pressure Chemical Metering
Pumps), tubing (PVC, polyethylene, and Santoprene), and electrolyte storage containers (500 mL
Erlenmeyer flasks). Reduced forms of vanadium have a tendency to oxidize in air, so containers
were sealed with Parafilm; holes were poked through the film for tubing insertion.
The electrolyte was composed of V2O5, sulfuric acid, and oxalic acid. The electrolyte was
prepared by first producing 2 M sulfuric acid. V2O5 was added to produce 1 M VO2+ solution.
Heat and stirring was applied to dissolve the vanadium faster. Once the majority of the vanadium
was dissolved, oxalic acid was added at a 1:1 molar ratio with VO2+ ions to reduce the vanadium
to VO2+. Heat (40-60 °C) and stirring was applied for around 2 h.
400 mL of the electrolyte solution was supplied to each half of the battery. The battery
was charged using a DC power supply Tekpower TP3005T in both constant current and constant
voltage modes. Electrochemical tests were performed using the CH Instruments Electrochemical
Page 11
Workstation. Tests performed were cyclic voltammetry, linear sweep voltammetry, open circuit
potential, multicurrent steps, and current vs. time discharge.
Data and Results
The design, building, and initial testing process took a considerable amount of time, so
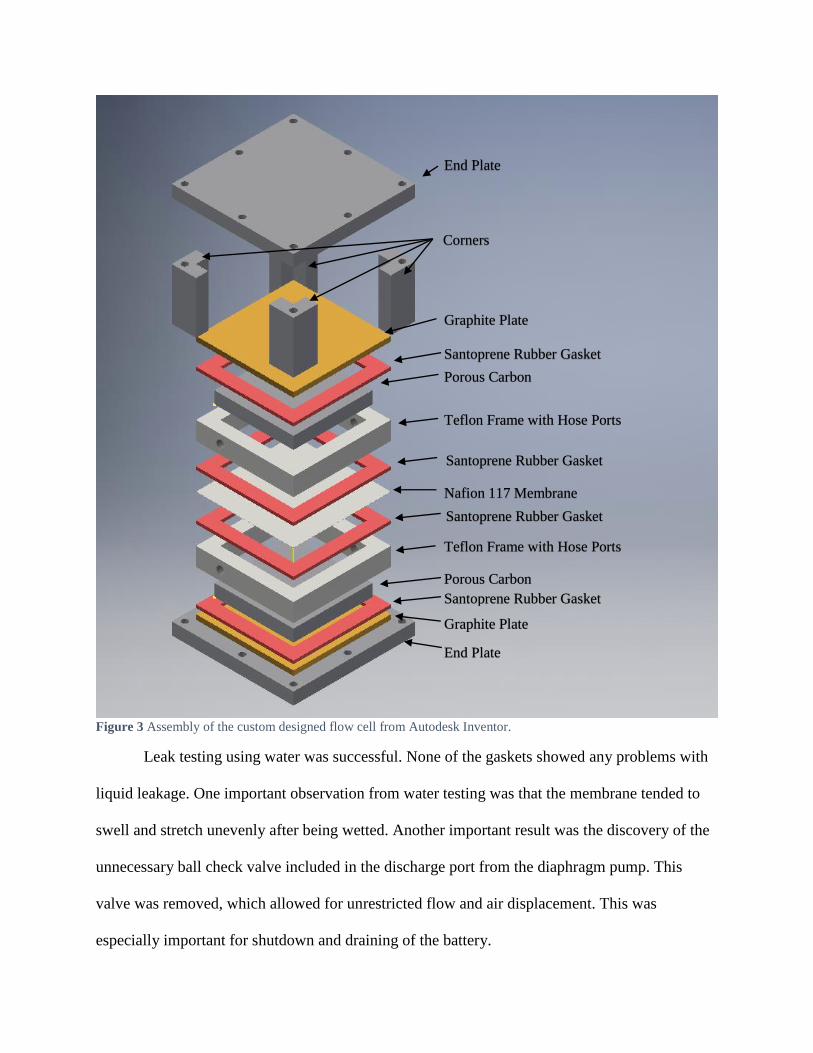
much so that the electrochemical testing of the battery was limited. The completed schematic of
the flow cell is shown in Figure 3. An important feature of the design is flow into and out of the
sides of the Teflon frame. This allows for easier sealing and alignment of flow ports. The
graphite plates are the main electrode material, with porous carbon contacting the surface of the
plates in an attempt to increase surface area for reaction of the electrolyte. Delrin used for the
end plates and corners allowed for rigid support of the battery. This meant the necessary amount
of sealing pressure could be used to compress the rubber gaskets and prevent leaks.
Page 12
Figure 3 Assembly of the custom designed flow cell from Autodesk Inventor.
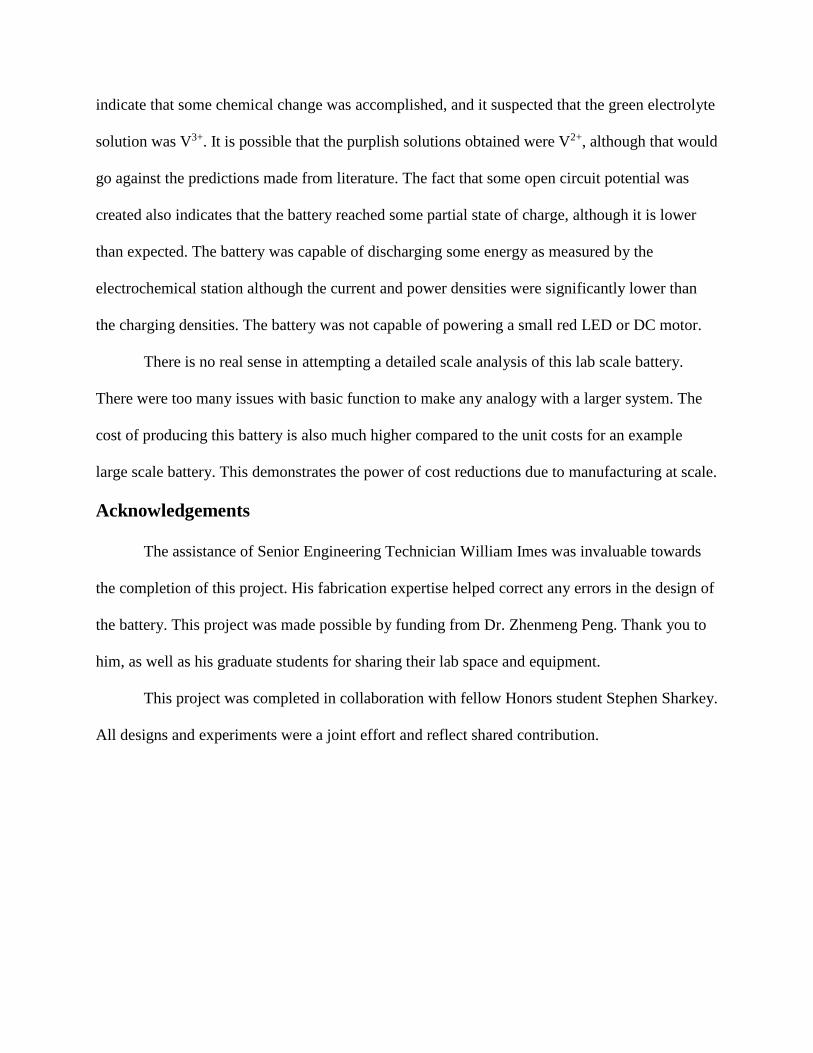
Leak testing using water was successful. None of the gaskets showed any problems with
liquid leakage. One important observation from water testing was that the membrane tended to
swell and stretch unevenly after being wetted. Another important result was the discovery of the
unnecessary ball check valve included in the discharge port from the diaphragm pump. This
valve was removed, which allowed for unrestricted flow and air displacement. This was
especially important for shutdown and draining of the battery.
Corners
End Plate
Graphite Plate
Santoprene Rubber Gasket
Santoprene Rubber Gasket
Santoprene Rubber Gasket
Graphite Plate
Porous Carbon
Porous Carbon
End Plate
Teflon Frame with Hose Ports
Teflon Frame with Hose Ports
Nafion 117 Membrane
Santoprene Rubber Gasket
Page 13
The electrolyte preparation was successful in producing a total of 800 mL of 1 M VO2+ in
2 M sulfuric acid. This solution was a deep, dark blue color, indicating that VO2+ was made.
When the V2O5 was first added to the sulfuric acid, it did not readily dissolve. After some time
spent stirring, the solution took on a yellow color, but much of the V2O5 powder was still
suspended in the solution. When the oxalic acid was added, nothing happened initially. Heat was
applied at around 60 °C, and the solution started to turn a dark yellow, transitioning to a greenish
brown before approaching a blue color. On subsequent batches, oxalic acid was added after heat
was applied. For larger volumes, foaming occurred as oxalic acid was added, so the addition was
done slowly batch-wise. As this reaction progressed, it could be observed that more of the yellow
V2O5 powder was dissolving. After approximately 2 h of stirring, the solution appeared mostly
clear and dark blue, with little to no remaining V2O5 powder left at the bottom of the flask. Left
covered to sit, the color did transition to a slightly lighter blue over the course of a few days.
After flow testing was performed with electrolyte to test startup, running, and shutdown,
electrical testing was started with the goal of charging the battery. Table 1 shows the data from
charging. The expected behavior was to perform the two-step charge, with an oxalic acid
reduction of the positive electrolyte in between charge steps. Initial charging was done at
constant current of 0.25 and 0.125 A. Voltages were observed in the range of 2.2-2.8 V. Further
charging was done at a constant current of 4 A, with potential initially at 5.88 V. As this charge
progressed for some hours, colors transitioned to dark green on one side and dark purple on the
other. Bubbles were observed, primarily in the purple side. It was theorized that charging at such
a high potential allowed for other reactions to occur, and ultimately V3+ (green) and V2+ (purple)
were obtained. The purple solution was left to sit uncovered in a ventilated fume hood. It
transitioned back to a blue color, indicating a return to VO2+. Charging was attempted again, this
Page 14
time with the blue and green solutions at constant voltage of 1.6 V. Peak charging current was
127 mA, which dropped over the total charging time of around 12 h. During this charge, little
change was observed in the color of solutions. The green was totally unchanged, while the blue
showed some darkening that may be due to a partial conversion to purple.
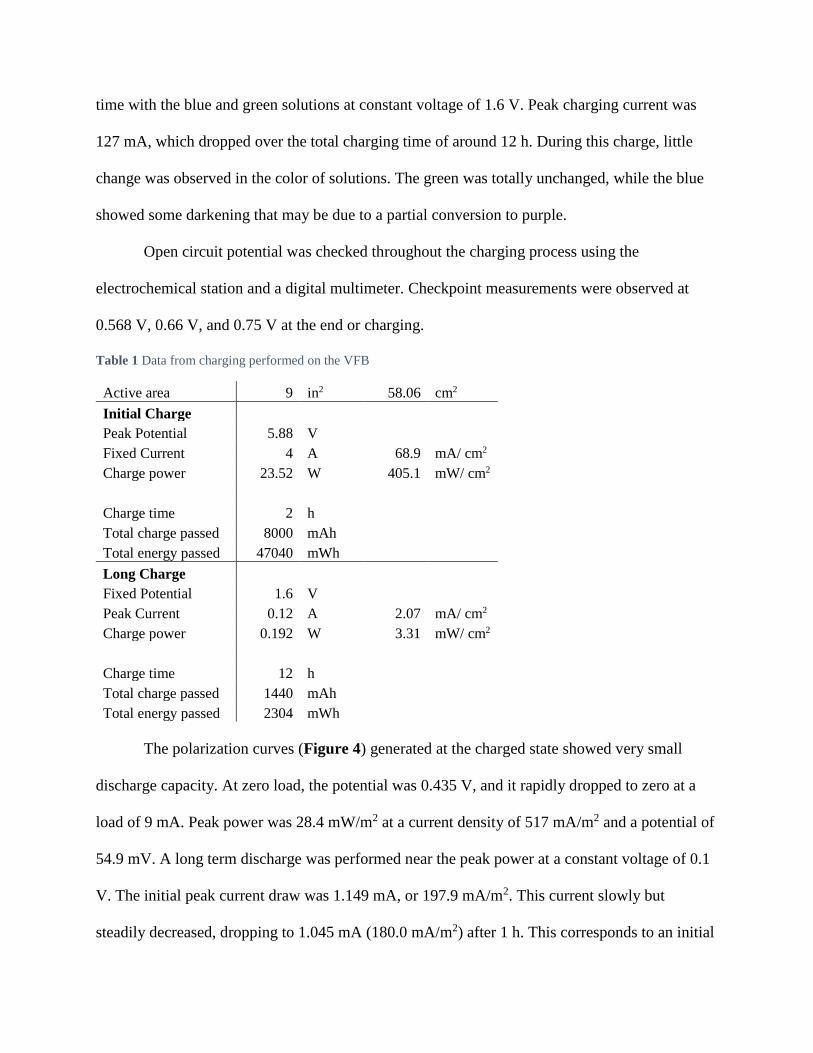
Open circuit potential was checked throughout the charging process using the
electrochemical station and a digital multimeter. Checkpoint measurements were observed at
0.568 V, 0.66 V, and 0.75 V at the end or charging.
Table 1 Data from charging performed on the VFB
Active area 9 in2 58.06 cm2
Initial Charge
Peak Potential 5.88 V
Fixed Current 4 A 68.9 mA/ cm2
Charge power 23.52 W 405.1 mW/ cm2
Charge time 2 h
Total charge passed 8000 mAh
Total energy passed 47040 mWh
Long Charge
Fixed Potential 1.6 V
Peak Current 0.12 A 2.07 mA/ cm2
Charge power 0.192 W 3.31 mW/ cm2
Charge time 12 h
Total charge passed 1440 mAh
Total energy passed 2304 mWh
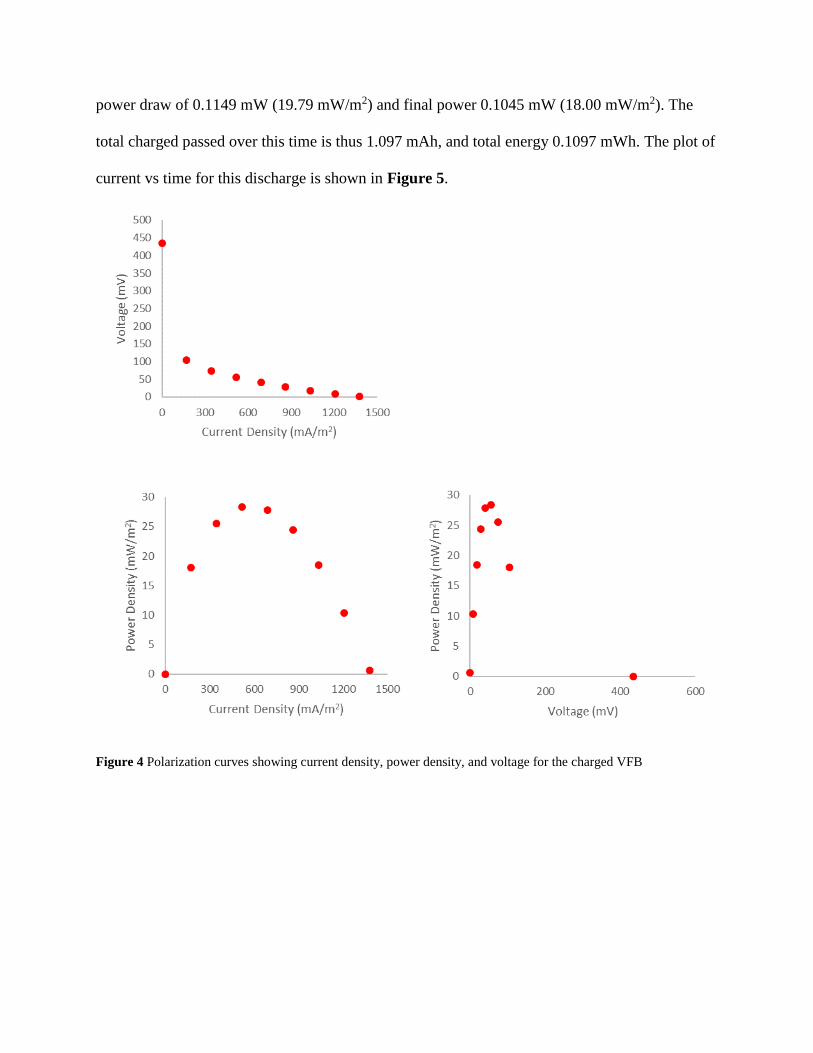
The polarization curves (Figure 4) generated at the charged state showed very small
discharge capacity. At zero load, the potential was 0.435 V, and it rapidly dropped to zero at a
load of 9 mA. Peak power was 28.4 mW/m2 at a current density of 517 mA/m2 and a potential of
54.9 mV. A long term discharge was performed near the peak power at a constant voltage of 0.1
V. The initial peak current draw was 1.149 mA, or 197.9 mA/m2. This current slowly but
steadily decreased, dropping to 1.045 mA (180.0 mA/m2) after 1 h. This corresponds to an initial
Page 15
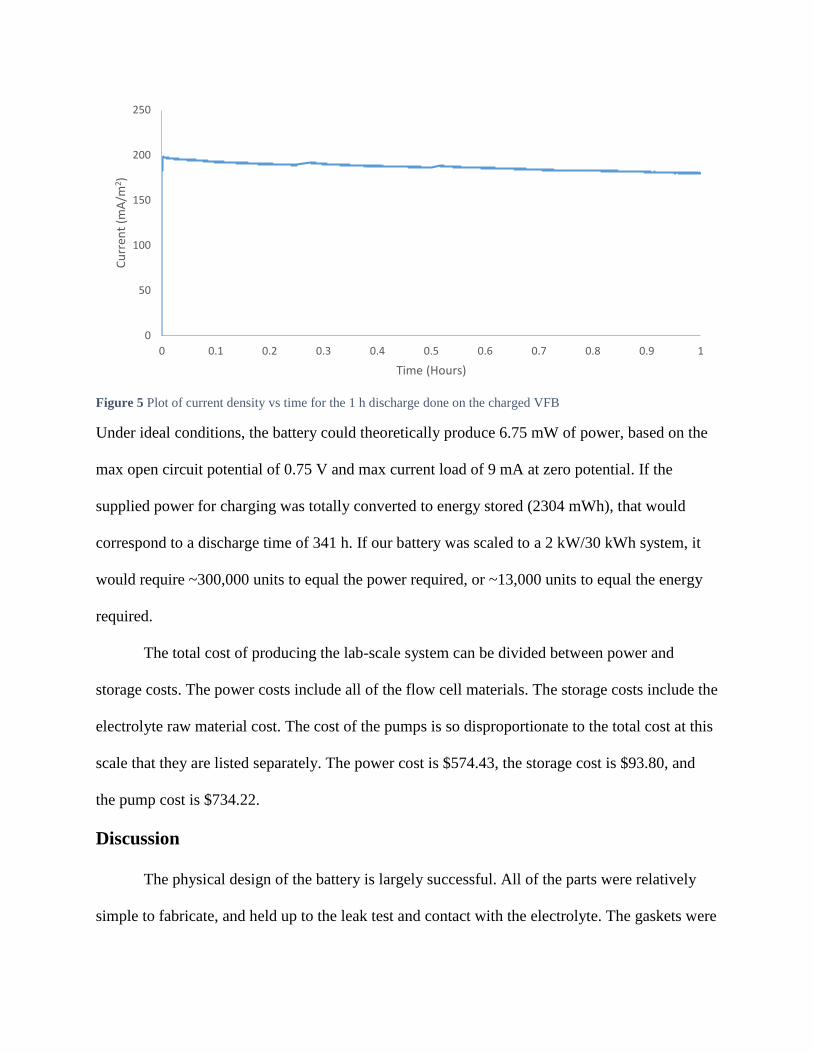
power draw of 0.1149 mW (19.79 mW/m2) and final power 0.1045 mW (18.00 mW/m2). The
total charged passed over this time is thus 1.097 mAh, and total energy 0.1097 mWh. The plot of
current vs time for this discharge is shown in Figure 5.
Figure 4 Polarization curves showing current density, power density, and voltage for the charged VFB
Page 16
Figure 5 Plot of current density vs time for the 1 h discharge done on the charged VFB
Under ideal conditions, the battery could theoretically produce 6.75 mW of power, based on the
max open circuit potential of 0.75 V and max current load of 9 mA at zero potential. If the
supplied power for charging was totally converted to energy stored (2304 mWh), that would
correspond to a discharge time of 341 h. If our battery was scaled to a 2 kW/30 kWh system, it
would require ~300,000 units to equal the power required, or ~13,000 units to equal the energy
required.
The total cost of producing the lab-scale system can be divided between power and
storage costs. The power costs include all of the flow cell materials. The storage costs include the
electrolyte raw material cost. The cost of the pumps is so disproportionate to the total cost at this
scale that they are listed separately. The power cost is $574.43, the storage cost is $93.80, and
the pump cost is $734.22.
Discussion
The physical design of the battery is largely successful. All of the parts were relatively
simple to fabricate, and held up to the leak test and contact with the electrolyte. The gaskets were
0
50
100
150
200
250
0 0.1 0.2 0.3 0.4 0.5 0.6 0.7 0.8 0.9 1
Cu
rren
t (m
A/m
2)
Time (Hours)
Page 17
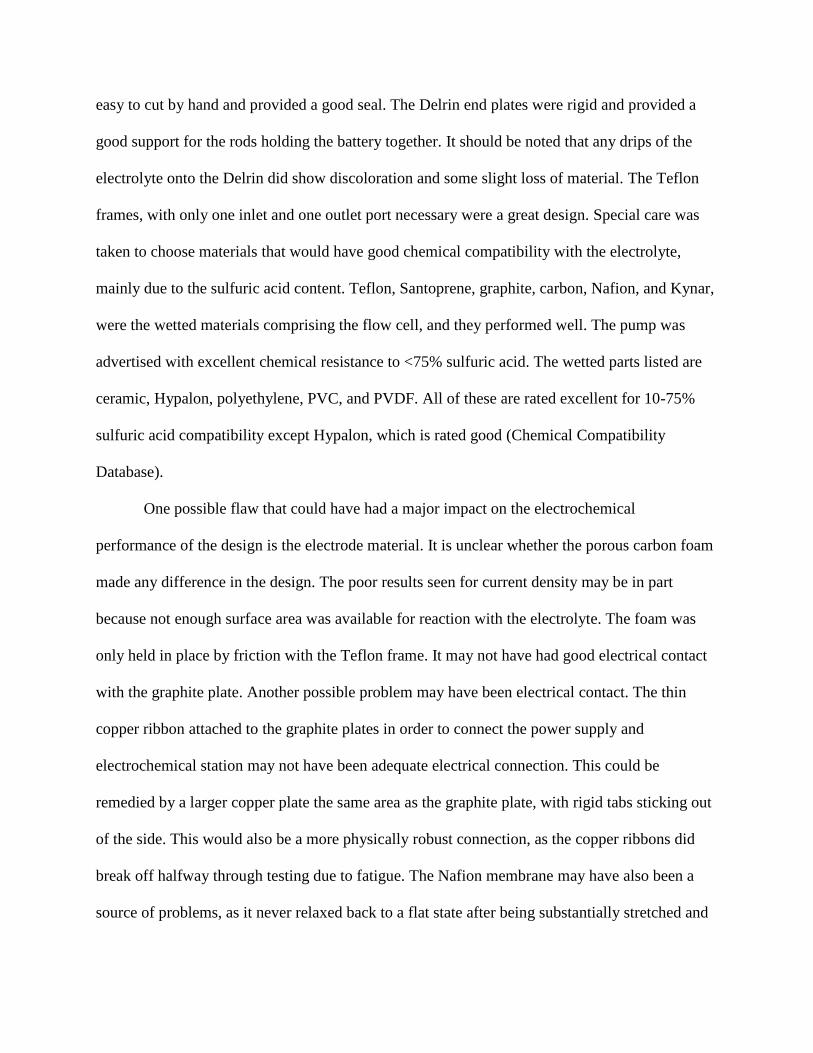
easy to cut by hand and provided a good seal. The Delrin end plates were rigid and provided a
good support for the rods holding the battery together. It should be noted that any drips of the
electrolyte onto the Delrin did show discoloration and some slight loss of material. The Teflon
frames, with only one inlet and one outlet port necessary were a great design. Special care was
taken to choose materials that would have good chemical compatibility with the electrolyte,
mainly due to the sulfuric acid content. Teflon, Santoprene, graphite, carbon, Nafion, and Kynar,
were the wetted materials comprising the flow cell, and they performed well. The pump was
advertised with excellent chemical resistance to <75% sulfuric acid. The wetted parts listed are
ceramic, Hypalon, polyethylene, PVC, and PVDF. All of these are rated excellent for 10-75%
sulfuric acid compatibility except Hypalon, which is rated good (Chemical Compatibility
Database).
One possible flaw that could have had a major impact on the electrochemical
performance of the design is the electrode material. It is unclear whether the porous carbon foam
made any difference in the design. The poor results seen for current density may be in part
because not enough surface area was available for reaction with the electrolyte. The foam was
only held in place by friction with the Teflon frame. It may not have had good electrical contact
with the graphite plate. Another possible problem may have been electrical contact. The thin
copper ribbon attached to the graphite plates in order to connect the power supply and
electrochemical station may not have been adequate electrical connection. This could be
remedied by a larger copper plate the same area as the graphite plate, with rigid tabs sticking out
of the side. This would also be a more physically robust connection, as the copper ribbons did
break off halfway through testing due to fatigue. The Nafion membrane may have also been a
source of problems, as it never relaxed back to a flat state after being substantially stretched and
Page 18
deformed during testing. The impact of this deformation is unknown, but it could have
contributed to poor ion conduction and uneven half-cell volumes. Finally, the overall size of the
battery was not conducive to easy testing. The lengths of tubing required meant a larger than
ideal volume of electrolyte was required in order to have continuous circulation within the
system. Furthermore, the volume of the flow cell compartment may have been too high as a
result of the thickness of the Teflon frame. This could have caused poor current densities because
of the mismatch in volume of liquid passing through the chamber vs. surface area available for
reaction. This issue could be compounded by the previously discussed problem with the porous
carbon foam.
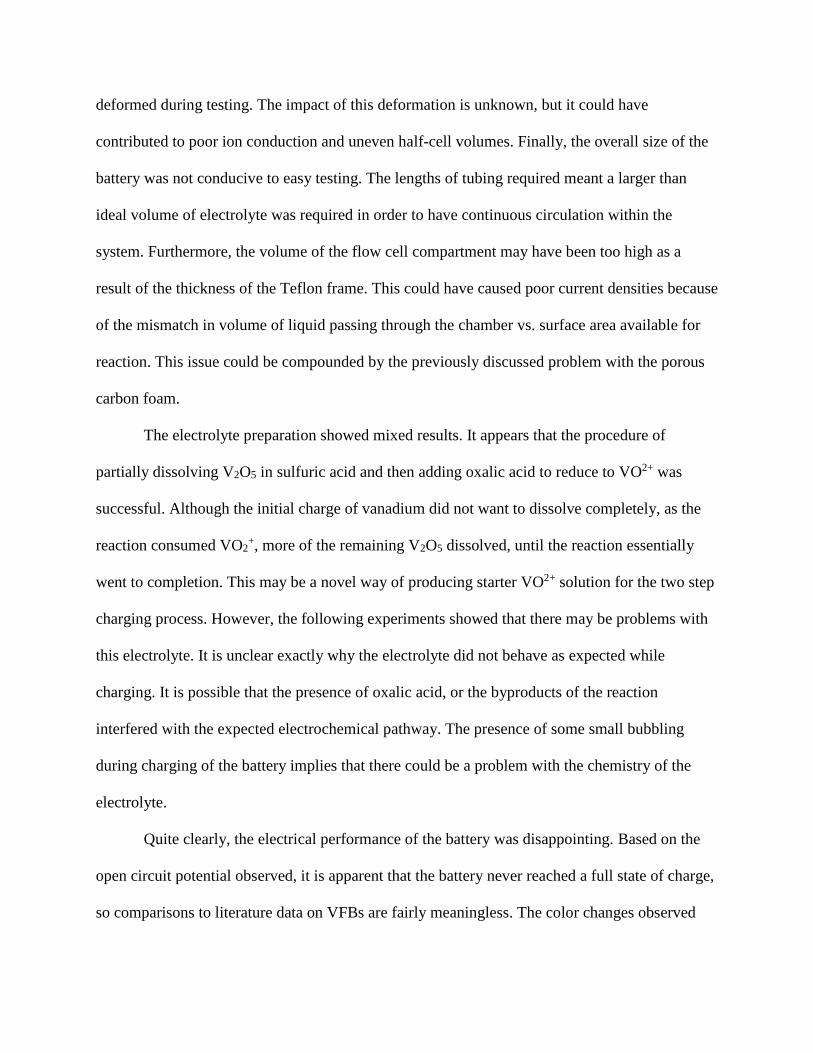
The electrolyte preparation showed mixed results. It appears that the procedure of
partially dissolving V2O5 in sulfuric acid and then adding oxalic acid to reduce to VO2+ was
successful. Although the initial charge of vanadium did not want to dissolve completely, as the
reaction consumed VO2+, more of the remaining V2O5 dissolved, until the reaction essentially
went to completion. This may be a novel way of producing starter VO2+ solution for the two step
charging process. However, the following experiments showed that there may be problems with
this electrolyte. It is unclear exactly why the electrolyte did not behave as expected while
charging. It is possible that the presence of oxalic acid, or the byproducts of the reaction
interfered with the expected electrochemical pathway. The presence of some small bubbling
during charging of the battery implies that there could be a problem with the chemistry of the
electrolyte.
Quite clearly, the electrical performance of the battery was disappointing. Based on the
open circuit potential observed, it is apparent that the battery never reached a full state of charge,
so comparisons to literature data on VFBs are fairly meaningless. The color changes observed
Page 19
indicate that some chemical change was accomplished, and it suspected that the green electrolyte
solution was V3+. It is possible that the purplish solutions obtained were V2+, although that would
go against the predictions made from literature. The fact that some open circuit potential was
created also indicates that the battery reached some partial state of charge, although it is lower
than expected. The battery was capable of discharging some energy as measured by the
electrochemical station although the current and power densities were significantly lower than
the charging densities. The battery was not capable of powering a small red LED or DC motor.
There is no real sense in attempting a detailed scale analysis of this lab scale battery.
There were too many issues with basic function to make any analogy with a larger system. The
cost of producing this battery is also much higher compared to the unit costs for an example
large scale battery. This demonstrates the power of cost reductions due to manufacturing at scale.
Acknowledgements
The assistance of Senior Engineering Technician William Imes was invaluable towards
the completion of this project. His fabrication expertise helped correct any errors in the design of
the battery. This project was made possible by funding from Dr. Zhenmeng Peng. Thank you to
him, as well as his graduate students for sharing their lab space and equipment.
This project was completed in collaboration with fellow Honors student Stephen Sharkey.
All designs and experiments were a joint effort and reflect shared contribution.
Page 20
Appendix
Figure A.1 Color change before (yellow) and after (blue) oxalic acid reduction from VO2
+ to VO2+
Figure A.2 Completed flow cell during water leak testing
Page 21
Literature Cited
BU-210b: How does the Flow Battery Work? – Battery University. (n.d.). Retrieved April 24,
2018, from http://batteryuniversity.com/learn/article/bu_210b_flow_battery
Chemical Compatibility Database from Cole-Parmer. (n.d.). Retrieved April 24, 2018, from
https://www.coleparmer.com/chemical-resistance
Ding, C., Zhang, H., Li, X., Liu, T., & Xing, F. (2013). Vanadium Flow Battery for Energy
Storage: Prospects and Challenges. The Journal of Physical Chemistry Letters, 4(8), 1281–
1294. https://doi.org/10.1021/jz4001032
Kear, G., Shah, A. A., & Walsh, F. C. (2012). Development of the all-vanadium redox flow
battery for energy storage: a review of technological, financial and policy aspects: All-
vanadium redox flow battery for energy storage. International Journal of Energy Research,
36(11), 1105–1120. https://doi.org/10.1002/er.1863
Li, W., Zaffou, R., Sholvin, C. C., Perry, M. L., & She, Y. (2013). Vanadium Redox-Flow-
Battery Electrolyte Preparation with Reducing Agents. ECS Transactions, 53(7), 93–99.
https://doi.org/10.1149/05307.0093ecst
Rahman, F., & Skyllas-Kazacos, M. (2009). Vanadium redox battery: Positive half-cell
electrolyte studies. Journal of Power Sources, 189(2), 1212–1219.
https://doi.org/10.1016/j.jpowsour.2008.12.113
Vanadium Redox Flow Cell (Single Split Unit) for Battery R&D - EQ-VRB-C-LD. (n.d.).
Retrieved April 24, 2018, from
http://www.mtixtl.com/vanadiumredoxflowcellsinglesplitunitforbatteryrandd-eq-vrb-c-
ld.aspx
Page 22
Weber, A. Z., Mench, M. M., Meyers, J. P., Ross, P. N., Gostick, J. T., & Liu, Q. (2011). Redox
flow batteries: a review. Journal of Applied Electrochemistry, 41(10), 1137–1164.
https://doi.org/10.1007/s10800-011-0348-2