MMM Group Limited Suite 700 – 1045 Howe Street Vancouver, BC V6Z 2A9 t: 604-685-9381 | f: 604-683-8655 www.mmm.ca COMMUNITIES TRANSPORTATION BUILDINGS INFRASTRUCTURE Page 1 of 15 June 11, 2013 File: 5012234-001 St. George’s School 4175 West 29 th Avenue Vancouver, BC, V6S 1V1 Attention: Mr. Neil Piller, Director of Operations Dear Mr. Piller, Reference: Transportation Study (DRAFT) St. George’s Senior School Master Plan Update – Vancouver As part of its Master Plan Update, St. George’s School retained MMM Group to study traffic and parking at its Senior Campus and the surrounding road network as the school seeks to develop facilities that support its future programs and educational vision. This Technical Memorandum documents existing conditions at the Senior Campus. In January and May 2013, MMM conducted peak hour traffic and parking counts at the Senior Campus of St. George’s School. The data collection effort included vehicle and pedestrian counts at intersections and driveways, parking counts, student travel mode observations and auto-occupancy measurements. Additionally, an in-class questionnaire of student/staff travel mode and parking information was conducted for the first time this year to validate site observations.
Transcript
MMM Group Limited
Suite 700 – 1045 Howe Street
Vancouver, BC V6Z 2A9
t: 604-685-9381 | f: 604-683-8655
www.mmm.ca
COMMUNITIES
TRANSPORTATION
BUILDINGS
INFRASTRUCTURE Page 1 of 15
June 11, 2013 File: 5012234-001 St. George’s School 4175 West 29th Avenue Vancouver, BC, V6S 1V1 Attention: Mr. Neil Piller, Director of Operations Dear Mr. Piller, Reference: Transportation Study (DRAFT)
St. George’s Senior School Master Plan Update – Vancouver
As part of its Master Plan Update, St. George’s School retained MMM Group to study traffic and
parking at its Senior Campus and the surrounding road network as the school seeks to develop
facilities that support its future programs and educational vision. This Technical Memorandum
documents existing conditions at the Senior Campus.
In January and May 2013, MMM conducted peak hour traffic and parking counts at the Senior
Campus of St. George’s School. The data collection effort included vehicle and pedestrian counts at
intersections and driveways, parking counts, student travel mode observations and auto-occupancy
measurements. Additionally, an in-class questionnaire of student/staff travel mode and parking
information was conducted for the first time this year to validate site observations.
June 11, 2013 St. George’s School Mr. Neil Piller
COMMUNITIES
TRANSPORTATION
BUILDINGS
INFRASTRUCTURE Page 2 of 15
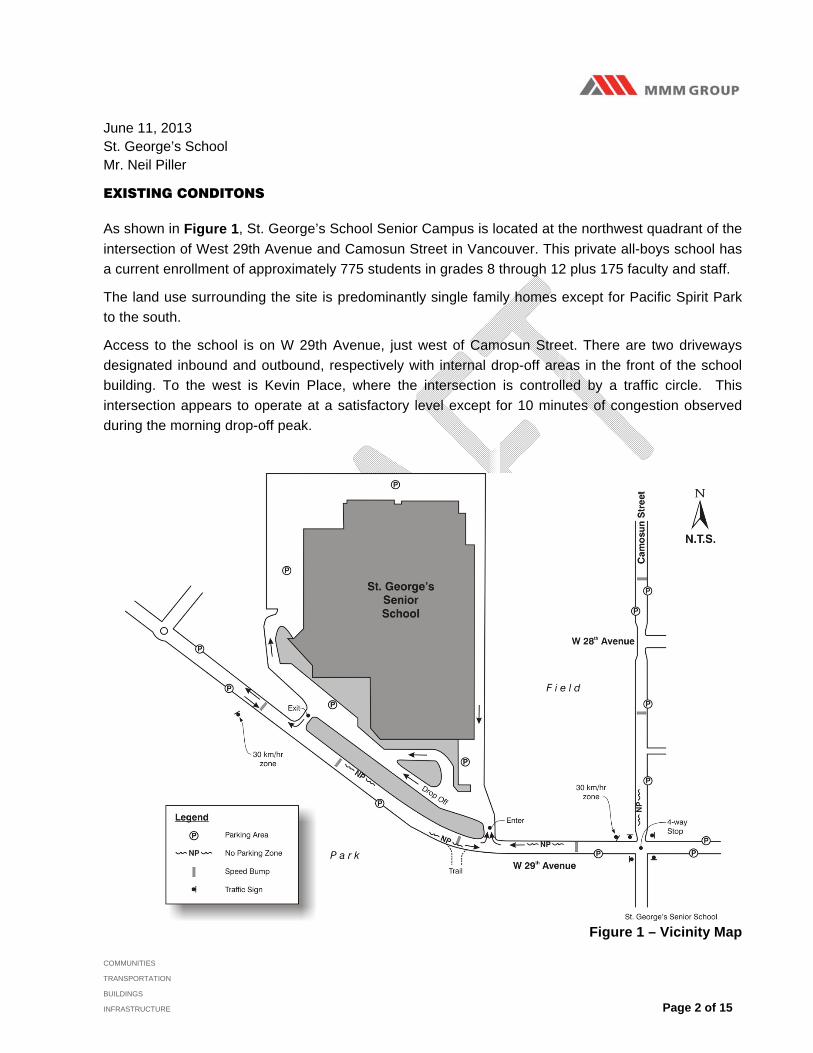
EXISTING CONDITONS As shown in Figure 1, St. George’s School Senior Campus is located at the northwest quadrant of the
intersection of West 29th Avenue and Camosun Street in Vancouver. This private all-boys school has
a current enrollment of approximately 775 students in grades 8 through 12 plus 175 faculty and staff.
The land use surrounding the site is predominantly single family homes except for Pacific Spirit Park
to the south.
Access to the school is on W 29th Avenue, just west of Camosun Street. There are two driveways
designated inbound and outbound, respectively with internal drop-off areas in the front of the school
building. To the west is Kevin Place, where the intersection is controlled by a traffic circle. This
intersection appears to operate at a satisfactory level except for 10 minutes of congestion observed
during the morning drop-off peak.
Figure 1 – Vicinity Map
June 11, 2013 St. George’s School Mr. Neil Piller
COMMUNITIES
TRANSPORTATION
BUILDINGS
INFRASTRUCTURE Page 3 of 15
METHODOLOGY In order to undertake the analysis, MMM Group completed the following work plan.
Visited the site and surroundings on Thursday January 24, 2013 to clearly understand the
campus in terms of parking regulations, drop-off and pick-up areas, pedestrian and cyclist
facilities, transit, and traffic control measures.
Obtained current information on traffic and parking management measures including:
o Drop-off, Pick-up and parking regulations/restrictions
o Number of school shuttle buses and routes
Conducted data collection program between 7:30-9:30 a.m. and between 2:30-5:30 p.m. on
Thursday, January 31, 2013 and Wednesday, May 8, 2013, which included:
o Peak period turning movement counts to collect vehicle, pedestrian and cyclist volume
data at the following intersections:
W 29th Avenue / Camosun Street
W 29th Avenue / Kevin Place
o Auto-occupancy counts at campus driveways and adjacent streets.
Prepared a brief in-class questionnaire of student/staff travel modes (primary and alternative)
and parking information that was administered by the school.
Analyzed field data and questionnaire responses to quantify current traffic and parking
TDM Measures implemented at and near the campus to encourage the use of alternative modes and
reduce driving include:
Pedestrian Improvements
Sidewalks on the northern side of W 29th Avenue are fully built out providing improved
access to the Senior Campus.
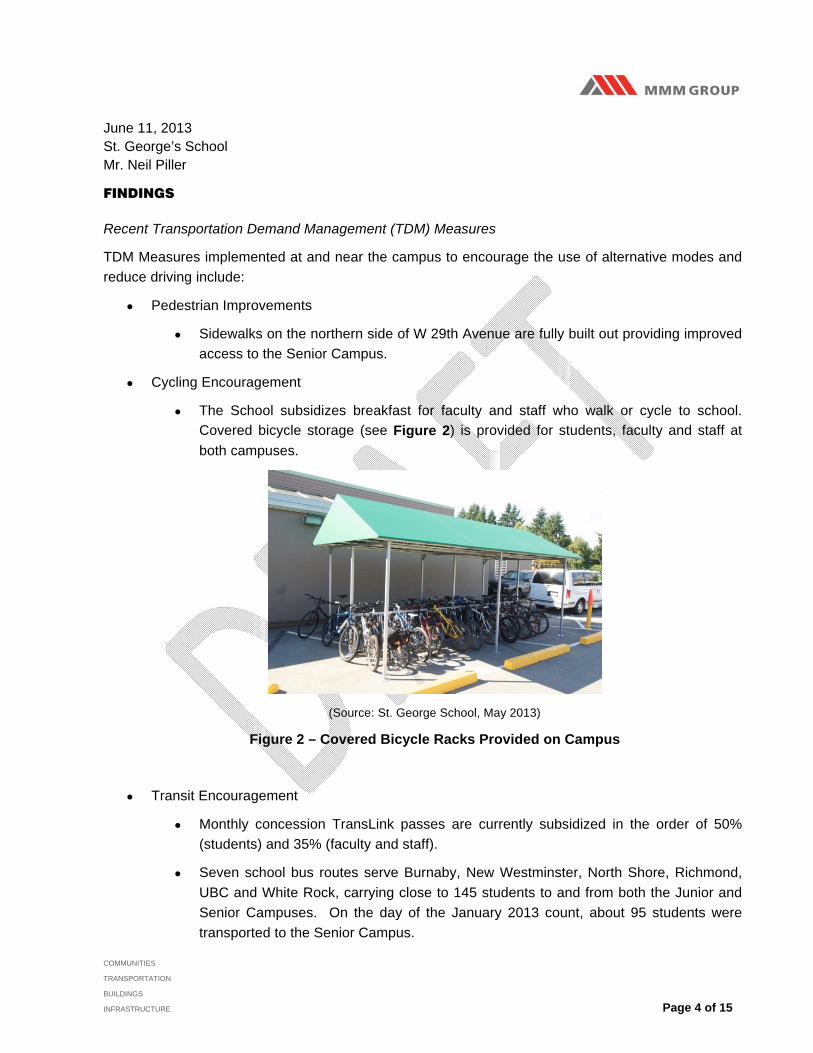
Cycling Encouragement
The School subsidizes breakfast for faculty and staff who walk or cycle to school.
Covered bicycle storage (see Figure 2) is provided for students, faculty and staff at
both campuses.
(Source: St. George School, May 2013)
Figure 2 – Covered Bicycle Racks Provided on Campus
Transit Encouragement
Monthly concession TransLink passes are currently subsidized in the order of 50%
(students) and 35% (faculty and staff).
Seven school bus routes serve Burnaby, New Westminster, North Shore, Richmond,
UBC and White Rock, carrying close to 145 students to and from both the Junior and
Senior Campuses. On the day of the January 2013 count, about 95 students were
transported to the Senior Campus.
June 11, 2013 St. George’s School Mr. Neil Piller
COMMUNITIES
TRANSPORTATION
BUILDINGS
INFRASTRUCTURE Page 5 of 15
Alternative School Schedules
Staggered grade 12 start times have been implemented with a view to dispersing the
peak.
Access Management
Revisions to site circulation have been implemented to improve traffic flow within the
site.
Access to campus driveway is limited to carpools dropping of students (2 or more
students per car) and staff parking their vehicles. The drop-off occupancy rate
observed at this driveway during the count was approximately 1.31 students per
vehicle.
Parking Management
“No Parking” zones are in effect during school days along the west side of Camosun
Street between W 28th and W 29th and along the north side of W 29th Avenue
between Camosun and neighbouring residences. In addition, “No Stopping” zones are
located near several driveways.
Only faculty and staff are permitted to park on campus; students wishing to drive must
register vehicle with the school but park off-campus, e.g. along W 29th Avenue.
Since the introduction of the Graduated Licensing Program in 2003, these regulations
have made it more difficult for senior students to drive and park near the senior
campus.
Traffic Calming
A traffic circle is in place at the intersection of W 29th Avenue and Kevin Place (see
Figure 3). In conjunction with the right-out only at the school driveway, the traffic
circle has facilitated smoother flows and U-turns for the neighbourhood traffic during
peak hours.
June 11, 2013 St. George’s School Mr. Neil Piller
COMMUNITIES
TRANSPORTATION
BUILDINGS
INFRASTRUCTURE Page 6 of 15
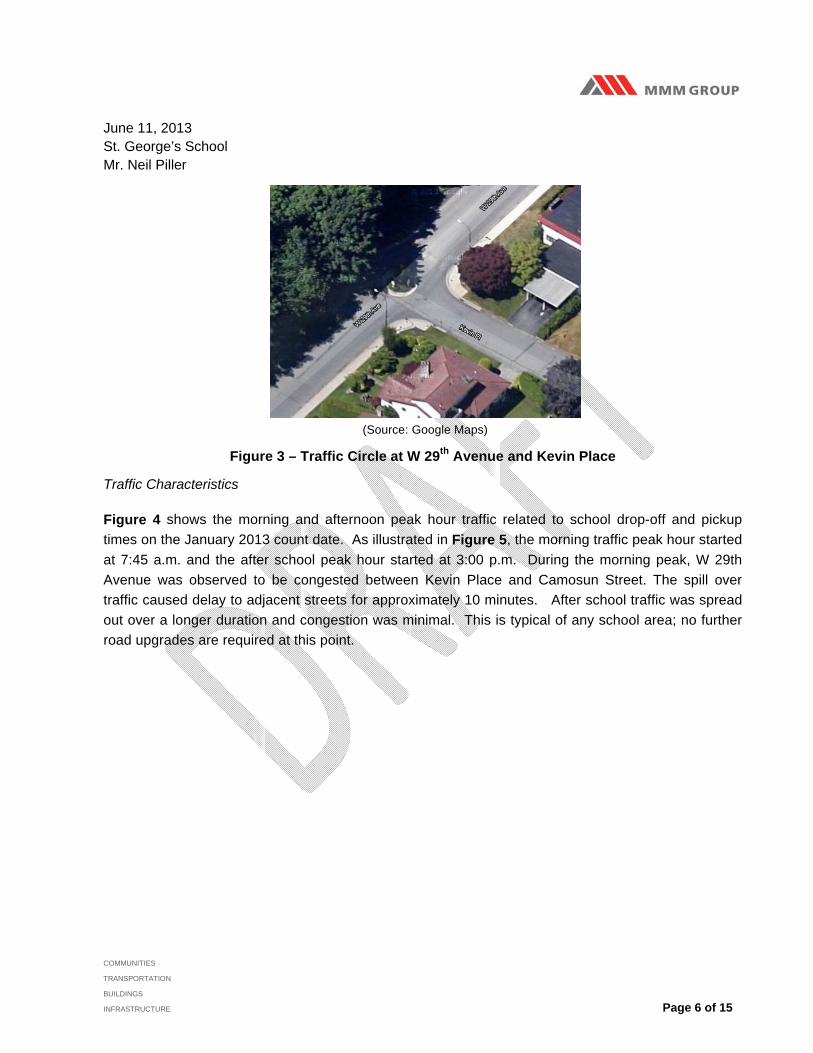
(Source: Google Maps)
Figure 3 – Traffic Circle at W 29th Avenue and Kevin Place
Traffic Characteristics Figure 4 shows the morning and afternoon peak hour traffic related to school drop-off and pickup
times on the January 2013 count date. As illustrated in Figure 5, the morning traffic peak hour started
at 7:45 a.m. and the after school peak hour started at 3:00 p.m. During the morning peak, W 29th
Avenue was observed to be congested between Kevin Place and Camosun Street. The spill over
traffic caused delay to adjacent streets for approximately 10 minutes. After school traffic was spread
out over a longer duration and congestion was minimal. This is typical of any school area; no further
road upgrades are required at this point.
June 11, 2013 St. George’s School Mr. Neil Piller
COMMUNITIES
TRANSPORTATION
BUILDINGS
INFRASTRUCTURE Page 7 of 15
Figure 4 – Existing (2013) AM & PM Volumes
June 11, 2013 St. George’s School Mr. Neil Piller
COMMUNITIES
TRANSPORTATION
BUILDINGS
INFRASTRUCTURE Page 8 of 15
Figure 5 – Total Traffic Volume at W 29 Ave. and Camosun St.
June 11, 2013 St. George’s School Mr. Neil Piller
COMMUNITIES
TRANSPORTATION
BUILDINGS
INFRASTRUCTURE Page 9 of 15
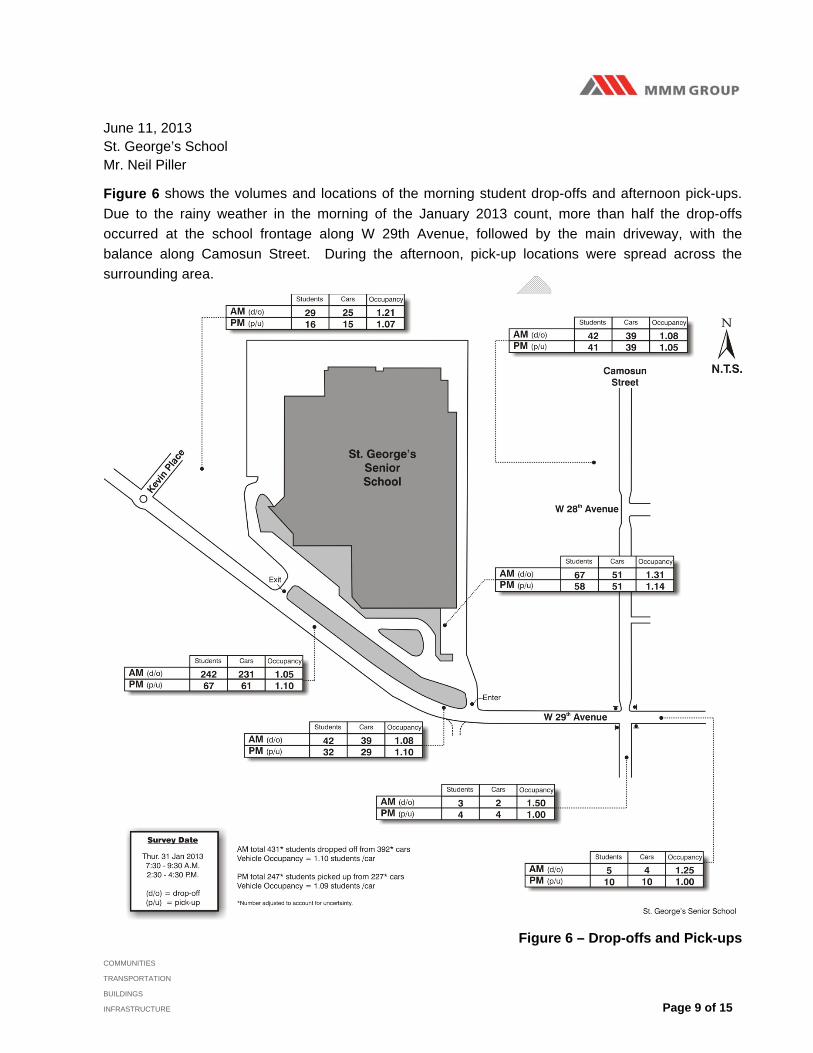
Figure 6 shows the volumes and locations of the morning student drop-offs and afternoon pick-ups.
Due to the rainy weather in the morning of the January 2013 count, more than half the drop-offs
occurred at the school frontage along W 29th Avenue, followed by the main driveway, with the
balance along Camosun Street. During the afternoon, pick-up locations were spread across the
surrounding area.
Figure 6 – Drop-offs and Pick-ups
June 11, 2013 St. George’s School Mr. Neil Piller
COMMUNITIES
TRANSPORTATION
BUILDINGS
INFRASTRUCTURE Page 10 of 15
Table 1 compares the observed student travel modes.
Table 1 – Student Travel Modes to Senior School (Observed)
Mode of Travel January 2013 May 2013
Dropped-off by Car 59% 58%
Drive-and-Park 4% 9%
Walk or Transit 23% 21%
School Bus 13% 9%
Bicycle 1% 3%
Total 100% 100%
Characteristics
Student Enrollment 775 775
Day of Week Thursday Wednesday
Weather Rain / Cloudy Sunny / Clear
Table 2 compares the results of the questionnaire responses with the observed data while Table 3 shows the response from the staff questionnaire. The similarity of the percentages indicates that the observed data is reliable. Note that the questionnaire included a section on alternative travel modes, e.g. twice a week, during good weather. The responses suggest that non-vehicle forms of transportation such as walk, bus or bike, would increase during periods of good weather. Key findings about traffic include:
Since St. George’s implemented TDM measures, there has been marked use of non-auto
modes (see Figure 7) given that between 33% and 37% of students have been observed to
walk, bus or bike to and from school.
Between 31% and 36% of students currently walk or take a bus to school. This includes
student boarders staying at the junior campus, transit riders who walk in from the bus stop at
Dunbar and W 29th, and students arriving on one of the seven school buses.
Between 1% and 3% of students currently bike to school, depending on the weather. The
survey indicates that up to 16% of students may bike to school during periods of better
weather.
June 11, 2013 St. George’s School Mr. Neil Piller
COMMUNITIES
TRANSPORTATION
BUILDINGS
INFRASTRUCTURE Page 11 of 15
Table 2 – Student Travel Modes to Senior School (Questionnaire)
Mode of Travel
Primary Travel Mode
Alternative Travel Mode
January 2013 (Observed)
March 2013 (Questionnaire)
March 2013 (Questionnaire)
Dropped-off by Car 59% 53% 33%
Drive-and-Park 4% 9% 5%
Walk or Transit 23% 23% 28%
School Bus 13% 14% 18%
Bicycle 1% 1% 16%
Total 100% 100% 100%
Response Rate n/a 596 238*
Notes: The results have a margin of error of +/- 2 percent at a 95% confidence level. * - 238 of the 596 questionnaire responses identified an alternative travel mode.
Table 3 – Staff Travel Modes to Senior School (Questionnaire)
Mode of Travel Primary Travel Mode Alternative
Travel Mode
Dropped-off by Car 3% 14%
Drive-and-Park 68% 31%
Walk or Transit 15% 24%
School Bus 3% 3%
Bicycle 11% 29%
Total 100% 100%
Response Rate 104 59*
Notes: Staff members indicated an increase in scooter and motorcycle users.
The survey results have a margin of error of +/- 6 percent at a 95% confidence level.
* - 59 of the 104 questionnaire responses identified an alternative travel mode
June 11, 2013 St. George’s School Mr. Neil Piller
COMMUNITIES
TRANSPORTATION
BUILDINGS
INFRASTRUCTURE Page 12 of 15
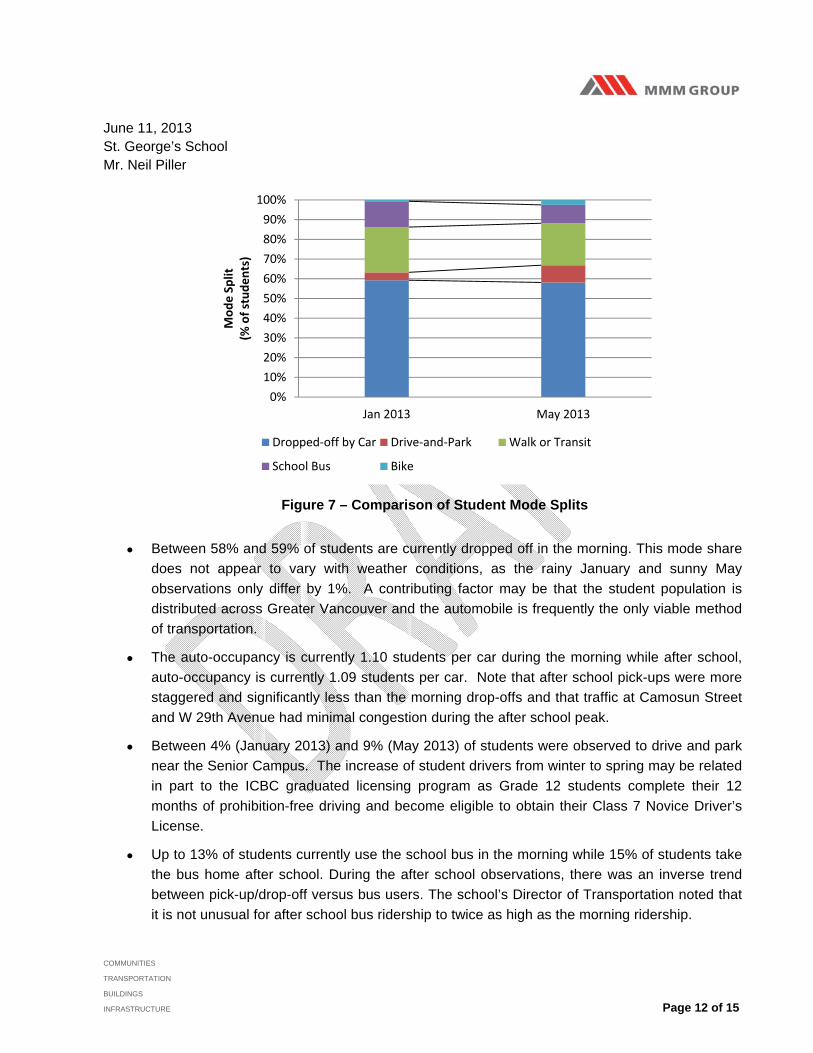
Figure 7 – Comparison of Student Mode Splits
Between 58% and 59% of students are currently dropped off in the morning. This mode share
does not appear to vary with weather conditions, as the rainy January and sunny May
observations only differ by 1%. A contributing factor may be that the student population is
distributed across Greater Vancouver and the automobile is frequently the only viable method
of transportation.
The auto-occupancy is currently 1.10 students per car during the morning while after school,
auto-occupancy is currently 1.09 students per car. Note that after school pick-ups were more
staggered and significantly less than the morning drop-offs and that traffic at Camosun Street
and W 29th Avenue had minimal congestion during the after school peak.
Between 4% (January 2013) and 9% (May 2013) of students were observed to drive and park
near the Senior Campus. The increase of student drivers from winter to spring may be related
in part to the ICBC graduated licensing program as Grade 12 students complete their 12
months of prohibition-free driving and become eligible to obtain their Class 7 Novice Driver’s
License.
Up to 13% of students currently use the school bus in the morning while 15% of students take
the bus home after school. During the after school observations, there was an inverse trend
between pick-up/drop-off versus bus users. The school’s Director of Transportation noted that
it is not unusual for after school bus ridership to twice as high as the morning ridership.
0%
10%
20%
30%
40%
50%
60%
70%
80%
90%
100%
Jan 2013 May 2013
Mode Split
(% of students)
Dropped‐off by Car Drive‐and‐Park Walk or Transit
School Bus Bike
June 11, 2013 St. George’s School Mr. Neil Piller
COMMUNITIES
TRANSPORTATION
BUILDINGS
INFRASTRUCTURE Page 13 of 15
Parking Characteristics The total number of parked cars on campus and on adjacent streets was counted at 9:30 a.m. Figure
8 shows the distribution of parked cars while Table 4 summarizes the totals. During site observations,
site parking was near capacity while there was an abundance of on-street parking on W 29th Avenue.
Survey indicated that afternoon staff members were unable to find parking on site and as a result
parked on nearby streets.
Figure 8 – Morning Parking
Table 4 – Parking Demand
Parking Location January 2013
On-Campus 82
On-Street 35
Total 117
Note: The parking counts in the table do not include resident’s cars parked on the street.
June 11, 2013 St. George’s School Mr. Neil Piller
COMMUNITIES
TRANSPORTATION
BUILDINGS
INFRASTRUCTURE Page 14 of 15
RECOMMENDATIONS In light of the findings, the following recommendations are put forward for consideration:
1. Further encourage early arrival to avoid and spread the traffic congestion, i.e. provide activities
for students who arrive before 7:45 a.m.
2. Limit waiting time between front driveways for better flow of traffic.
3. Further promote school bus usage and carpooling.
4. Further investigate if converting a few vehicle stalls into scooter / motorcycle stalls is a viable
option.
5. Request by-law enforcement to discourage dangerous maneuvers.
6. Remind parents of City of Vancouver parking and stopping regulations in School Zones.
7. Implement the five-year targets for St. George’s School Senior Campus students, faculty and
staff suggested in Table 5. The targets are not meant to be overly aggressive – but are driven
by a 10% cycling mode share target for students, a 20% school bus mode share target for
students and a 20% cycling mode share for staff. The 10% cycling mode share for students is
realistic given that 16% of students reported that they would switch to cycling. The 20% school
bus mode share is realistic given that 23% of students have used the school buses in the past.
The 20% cycling mode share is realistic given that 20% of staff reported that they would switch
to cycling.
Table 5 – Five-Year TDM Targets
Mode of Travel Students Faculty and Staff
Current (2013)
Target (2018)
Current (2013)
Target (2018)
Dropped-off by Car 60% 41% 3% 10%
Drive-and-Park 4% 4% 68% 45%
Walk or Transit 23% 25% 15% 20%
School Bus 13% 20% 3% 5%
Bicycle 1% 10% 11% 20%
Total 100% 100% 100% 100%
June 11, 2013 St. George’s School Mr. Neil Piller
COMMUNITIES
TRANSPORTATION
BUILDINGS
INFRASTRUCTURE Page 15 of 15
SUMMARY AND CONCLUSIONS The following statements summarize the traffic and parking characteristics of St. George’s School
Senior Campus observed in 2013:
Site parking was near capacity (82 parked vehicles); while there was an abundance of on-
street parking on W 29th Avenue (35 parked vehicles including Camosun Street). Survey did
indicate afternoon staff members were unable to find parking on site, and parked on-street.
Parking is generally not a concern at this location.
A total of 7 school bus routes now serve 145 students, 95 from the senior campus. Currently,
13% of students use the school bus in the morning and 15% use the school bus after school.
There is one school bus service in the morning and two services available at 3:45 p.m. and
5:30 p.m. in the afternoon to facilitate student participation in after school activities.
Auto-occupancy of the morning arrivals is 1.10 students per car while there are 1.09 students
per car during afternoon pick-up. The percentage of students being dropped off at school is
generally about 59% and does not appear to be weather dependent.
After school pick-ups were more staggered and significantly less than the morning drop-offs.
Traffic at Camosun Street and W 29th Avenue was observed to experience minimal
congestion during the after school peak.
Since St. George’s implemented TDM measures, there has been marked use of non-auto
modes given that between 33% and 37% of students have been observed to walk, bus or bike
to and from school.
* * * * *
Should you have any questions about our methodology, findings, recommendations or conclusions; please contact me at (604) 685-9381 or [email protected]. Yours truly, MMM Group Limited <original signed by> Floris van Weelderen, P.Eng., PTOE Manager, Transportation Planning Associate Partner 5012234001-REP-02-Rev0 (Trans Study).docx