VANCOUVER SEPARATED BIKE LANE BUSINESS IMPACT STUDY JULY 20, 2011 Vancouver Separated Bike Lane Business Impact Study Prepared for: Vancouver Economic Development Commission City of VancouverDowntown Vancouver Association Downtown Vancouver Business Improvement Association The Vancouver Board of Trade Prepared By: Stantec Consulting Ltd. with Site Economics and Mustel Group Market Research
VANCOUVER SEPARATED BIKE LANE BUSINESS IMPACT STUDYJULY 20, 2011
i
Executive Summary
Introduction
To support the goals of the City of Vancouver‟s present long-term transportation plan (adopted in 1997) to
increase cycling mode share, two separated two-way bike lanes trials were constructed in Vancouver‟s
downtown core in 2010. The first, completed in June 2010, was built along the north side of Dunsmuir St.
from the Dunsmuir Viaduct to Hornby St. The second was completed in December 2010 and was built
along the length of the east side of Hornby St., as well as on short sections of Drake, Burrard, and West
Hastings Streets. To implement the separated bike lanes, road space was reallocated, parking spaces
were moved or eliminated, the illegal use of some loading zones was eliminated, and turning restrictions
were introduced.
Upon completion of the separated bike lanes, some downtown businesses expressed concerns that the
lanes and the changes in the use of road space had resulted in negative business impacts. In October 2010, prior to the installation of the bike lanes on Hornby, the City of Vancouver committed to conducting
a business impact study. In response, the City of Vancouver, the Vancouver Economic Development
Commission, The Vancouver Board of Trade, the Downtown Vancouver Business Improvement
Association, and the Downtown Vancouver Association came together to hire Stantec Consulting, Ltd. to
measure the business impacts of the separated bike lanes and to develop mitigation strategies to address
potential negative business impacts in identified „hot spot‟ blocks. This is the first-ever such study in
North America, and perhaps the world, that has focused on identifying the local business impacts
of separated bike lanes. Not only has the study provided an estimate of the business impact, it
has developed recommendations to mitigate the negative impacts to the business community and
detailed the lessons learned in order to guide future studies of this nature.
Economic Context
The study focused on collecting basic business economic data on rents, sales, vacancy and lease rates
that would indicate the impact of the separated bike lanes, as well as data on the frequency of shopping
visits by downtown or Metro Vancouver customers after the implementation of the separated bike lanes.
This data was collected in the second quarter of 2011. Other policy changes at all levels of government
that have impacted the downtown retail environment include:
The 2008-2009 national economic downturn;
Increased parking rates due to the introduction of the harmonized sales tax (HST) in July 2010
and the 14% tax increase for off-street paid parking implemented by TransLink;
Road closures and access changes due to the 2010 Winter Olympics;
The opening of the Canada Line rapid transit system in August 2009;The fuel tax increase of January 2010;
Downtown construction that has altered traffic patterns;
Filming activity in the downtown core;
The re-introduction of buses on Granville St.; and
VANCOUVER SEPARATED BIKE LANE BUSINESS IMPACT STUDYJULY 20, 2011
ii
Methodology
The original intention was to collect as much detailed, authoritative financial data as possible. With the
notable exception of four businesses, this proved impossible despite the best efforts of an experiencedconsulting team. Accordingly, business impacts were determined based on a systematic approach using
six separate stakeholder surveys of business owners and managers, customers, and employees on the
bike lane corridors and on adjacent comparator corridors (Howe St. for Hornby St. and West Georgia St.
for Dunsmuir St.) in order to isolate the impacts caused solely by the separated bike lanes.
The survey was sufficiently detailed geographically to enable the most impacted blocks to be identified,
as well as to address specific problems with regard to the removal of parking, loss of illegal loading
zones, reduced pedestrian access and visibility, potential cyclist/vehicle conflict/safety issues, and
restricted turns at intersections. Detailed studies were completed of the impacted blocks and specific
mitigations strategies were recommended to alleviate these conditions. In addition, broader
recommendations related to the planning, consultation, implementation and monitoring of the lanes were
developed from best practices in other jurisdictions and from the combined expertise brought by theproject team members. Finally, based on all of the above, a summary list of lessons learned was created.
Limitations
There are a number of limitations in this study, which include the following:
i) To respond promptly to the business concerns about the impact of the separated bike lanes, this
study was completed over two months. Therefore, the results should be viewed as the preliminary
and short-term business impacts. As with any major infrastructure change in a city there is normally
an adjustment period, so it may take years for the business impacts to become clear and definitive.
Impacts may continue to be felt in the coming months but will likely decline as the City takes steps to
mitigate the blocks where the impacts are greatest. This process has already been started, with Cityrepresentatives meeting these businesses to address impact issues, and the City has indicated that it
is committed to monitoring and working to mitigate the impacts. The study identified that the Hornby
St. bike lanes, in place for six months at the time of the survey, had greater business impacts than
those on Dunsmuir St., in place about a year at the time of the survey. This may be due to the fact
that the business make-up of the two streets is quite different, with a much larger amount of retail
space on Hornby St.
ii) The analysis of the business impacts of the separated bike lanes had to rely on individual responses
of businesses to the surveys and their best estimates of the impacts of the separated bike lanes in
the surveys. This information may have some response bias, as there is a greater tendency for those
who were more affected by the separated bike lanes to respond to a self-administered survey.
Despite efforts to increase response with follow-up telephone calls, there is some degree of
uncertainty about the randomness of the results obtained. As well, very little detailed sales data frombusinesses was received. Although the data that was collected indicated that the estimated loss in
sales was not as high as reported in the surveys, the responses by businesses have been taken at
their word. Perception in the business market does impact the attractiveness of an area to retailers.
iii) Detailed data for stores and blocks could not be put into the final report in order to ensure survey
respondent confidentiality.
iv) The study is limited to quantifying the business impacts of the separated bike lanes and does not
measure the macroeconomic or other related impacts of the separated bike lanes (e.g. the
VANCOUVER SEPARATED BIKE LANE BUSINESS IMPACT STUDYJULY 20, 2011
iii
implications on the health of residents and employees). Transportation metrics will be addressed in a
City staff report to Council in July 2011.
Estimates of Economic Impacts on Businesses
Grade-level Businesses Survey: The main source of useful business data for this study was this
survey. An analysis of responses received from 32% of the survey area businesses revealed the
following:
In 2011, the total percentage change in annual sales from the previous year as indicated by survey
respondents was:
A: Hornby St. -11%
B: Howe St. (comparator to Hornby St.) -1%
C: Dunsmuir St. -2%
D: West Georgia St. (comparator to Dunsmuir St.) 2%
E: Other locations impacted by bike lanes 2%Average of all locations -5%
In 2011, the net impact on sales that was attributed to the bike lanes (calculated as the bike lane
streets‟ annual sales change minus the annual sales change along the comparator streets) among
those who responded was:
Hornby St.: -10% (Difference between A and B above)
Dunsmuir St.: -4% (Difference between C and D above)
These numbers represent the high end of the range of business impacts and have been used to
estimate the overall business impacts. Despite the use of comparator lanes to eliminate the impact of
the numerous policy changes identified in the Economic Context section above, there may still be
some residual impact from these factors in the data.
The business impacts on the bike lane side of both streets were greater than the impacts on the sidewithout the lanes.
The largest sales declines reported by respondents on Hornby St. between 2010 and 2011 were
experienced along the 500, 600, 900 and 1000 blocks, while on Dunsmuir St. the 600 block noted the
greatest decline.
The financial impact of the bike lanes has been a loss of sales and a loss of profit. The total loss in
sales is estimated at $2.4 million over a year. Assuming profit is approximately 20% of sales, the
estimated annual loss in profit over a year would be about $480,000. This is relatively moderate
based on industry standards and, in general, insufficient to create persistent vacancies. The
downtown is and will remain vibrant and the moderate negative impact of the lanes will diminish over
time as long as mitigation strategies take effect.
Commercial Property Owners and Property Managers Survey: The responses from 30% of propertyowners and managers in the survey area indicated little difference in reported impacts between streets
with separated bike lanes and comparator streets:
Separated bike lanes were associated with an estimated loss of sales in the range 6-9% on both
streets with separated bike lanes and comparator streets
Parking tax changes and the HST were associated with an estimated loss of sales of between 9%
and 11% on both streets with separated bike lanes and comparator streets
VANCOUVER SEPARATED BIKE LANE BUSINESS IMPACT STUDYJULY 20, 2011
iv
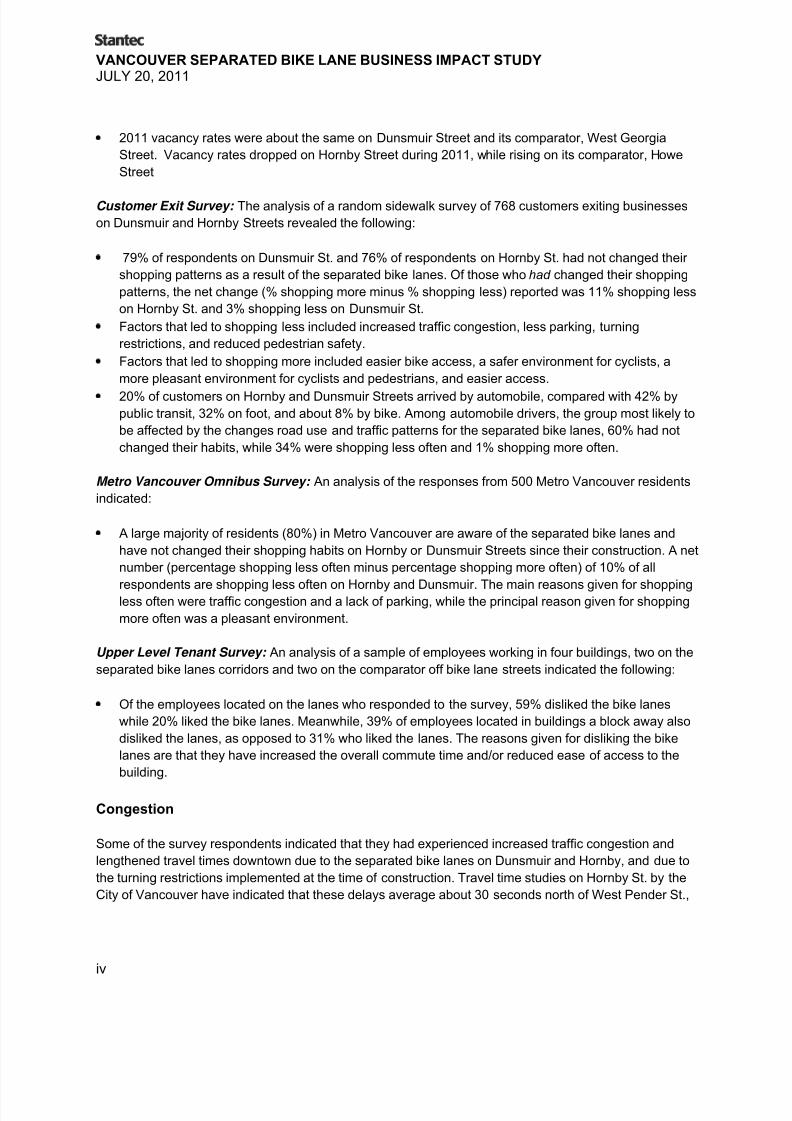
2011 vacancy rates were about the same on Dunsmuir Street and its comparator, West Georgia
Street. Vacancy rates dropped on Hornby Street during 2011, while rising on its comparator, Howe
Street
Customer Exit Survey: The analysis of a random sidewalk survey of 768 customers exiting businesses
on Dunsmuir and Hornby Streets revealed the following:
79% of respondents on Dunsmuir St. and 76% of respondents on Hornby St. had not changed their
shopping patterns as a result of the separated bike lanes. Of those who had changed their shopping
patterns, the net change (% shopping more minus % shopping less) reported was 11% shopping less
on Hornby St. and 3% shopping less on Dunsmuir St.
Factors that led to shopping less included increased traffic congestion, less parking, turning
restrictions, and reduced pedestrian safety.
Factors that led to shopping more included easier bike access, a safer environment for cyclists, a
more pleasant environment for cyclists and pedestrians, and easier access.
20% of customers on Hornby and Dunsmuir Streets arrived by automobile, compared with 42% bypublic transit, 32% on foot, and about 8% by bike. Among automobile drivers, the group most likely to
be affected by the changes road use and traffic patterns for the separated bike lanes, 60% had not
changed their habits, while 34% were shopping less often and 1% shopping more often.
Metro Vancouver Omnibus Survey: An analysis of the responses from 500 Metro Vancouver residents
indicated:
A large majority of residents (80%) in Metro Vancouver are aware of the separated bike lanes and
have not changed their shopping habits on Hornby or Dunsmuir Streets since their construction. A net
number (percentage shopping less often minus percentage shopping more often) of 10% of all
respondents are shopping less often on Hornby and Dunsmuir. The main reasons given for shoppingless often were traffic congestion and a lack of parking, while the principal reason given for shopping
more often was a pleasant environment.
Upper Level Tenant Survey: An analysis of a sample of employees working in four buildings, two on the
separated bike lanes corridors and two on the comparator off bike lane streets indicated the following:
Of the employees located on the lanes who responded to the survey, 59% disliked the bike lanes
while 20% liked the bike lanes. Meanwhile, 39% of employees located in buildings a block away also
disliked the lanes, as opposed to 31% who liked the lanes. The reasons given for disliking the bike
lanes are that they have increased the overall commute time and/or reduced ease of access to the
building.
Congestion
Some of the survey respondents indicated that they had experienced increased traffic congestion and
lengthened travel times downtown due to the separated bike lanes on Dunsmuir and Hornby, and due to
the turning restrictions implemented at the time of construction. Travel time studies on Hornby St. by the
City of Vancouver have indicated that these delays average about 30 seconds north of West Pender St.,
VANCOUVER SEPARATED BIKE LANE BUSINESS IMPACT STUDYJULY 20, 2011
v
and the City will continue to monitor and make adjustments to resolve delays. The City will also report on
congestion in the broader analysis that will be presented to Council in July 2011.
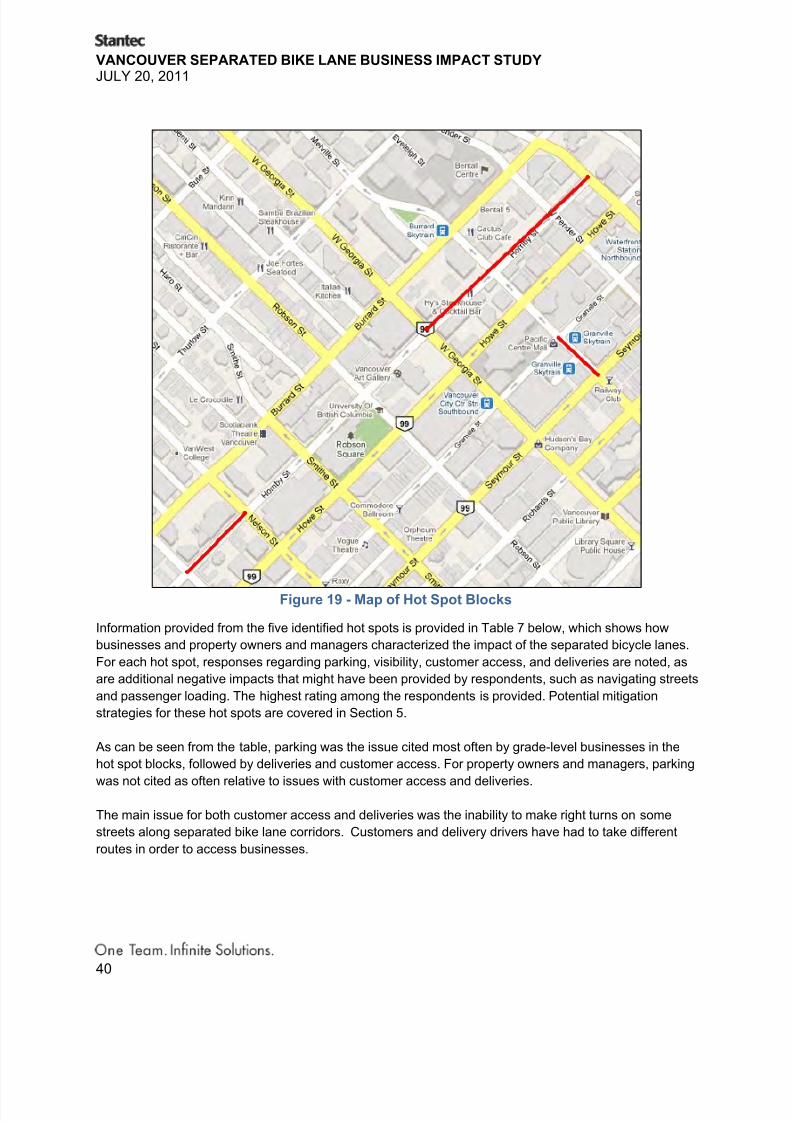
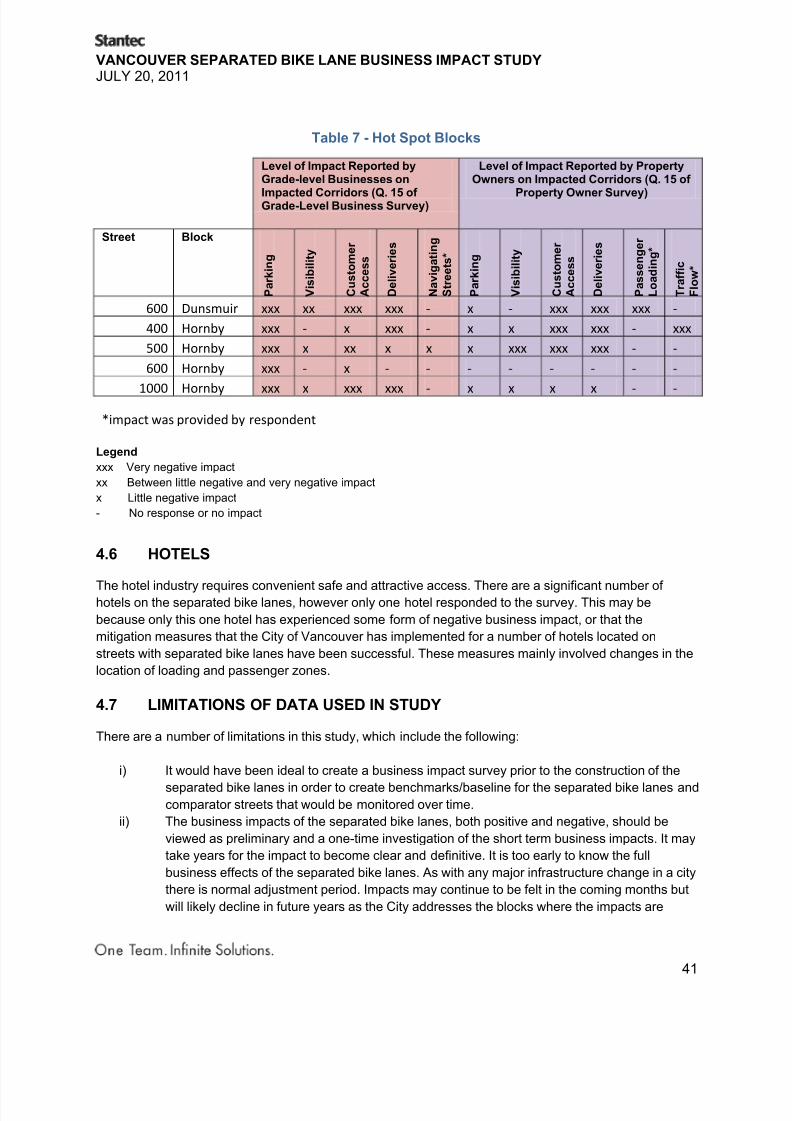
Analysis of Hot Spots
The study identified „hot spots‟, or those blocks along the on-lane corridors where the business impacts of
the separated bike lanes were negative due to one or more effects from the following factors: loss of
parking; reduced visibility; restrictions in turning at specific intersections; reduced access to loading
zones; and more difficult pedestrian access. The hot spot blocks, the specific issues identified and the
recommended mitigation strategies are listed below:
400 Block of Hornby: The issues are lost parking spaces, reduced access due to new turning
restrictions and potential conflicts of cyclists with motorists exiting laneways. The recommended
mitigation strategies involved creating directional signage to the closest parking structures, allowing
right turns on red when turning from Hornby St. northbound east onto West Pender St., and installing
caution signs for cyclists to warn of vehicles exiting laneways. The block might be a candidate for adesign that allows for seasonal variation by installing flexible reflective poles to delineate the lane marker
separating the curb lane from the centre lane. Another option would be to use automatic bollards that can
be raised and lowered to establish a separated bike lane when necessary.
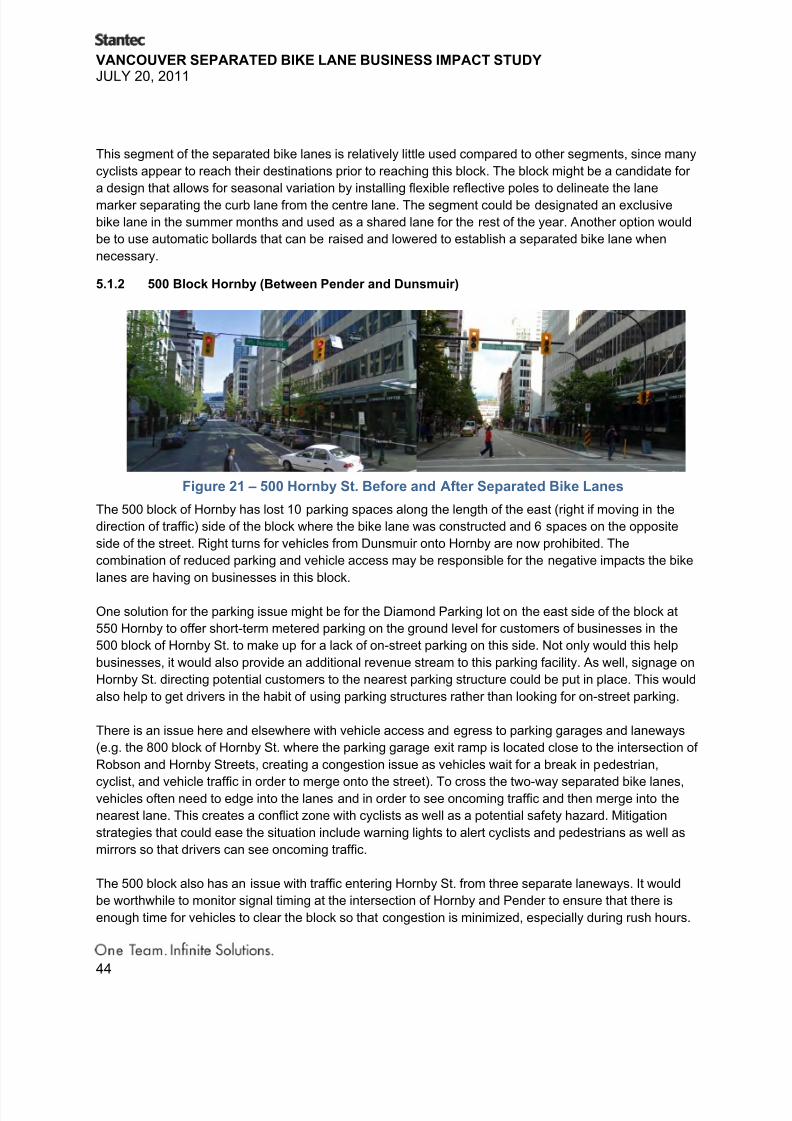
500 Block of Hornby: The issues are loss of parking as well as vehicle safety in crossing bike lanes to
access and exit from parking garages and laneways. The mitigation strategies recommended are to
allocate parking in the ground level of the nearest parking structure to local businesses and to install
warning lights and mirrors to prevent accidents when vehicles cross bike lanes to enter traffic. As well, the
ability to make right turns off Dunsmuir St. onto Hornby St. should be restored, which would also allow
drivers to more easily access the large parking garages on this block. This also applies to Seymour St.,
where right turns off Dunsmuir St. should also be restored.
600 Block of Hornby: The main issues are a loss of parking along with turning restrictions at
intersections. The mitigation strategy recommended is to provide additional signage on Hornby St. that
will direct customers to the nearest parking structure, combined with a parking space counting system
that informs them of the remaining number of spaces available.
1000 Block of Hornby: The main issues are a loss of parking and changing vehicle access, as no right
turns are permitted for vehicles from Helmcken St. onto Hornby St. The recommended mitigation
strategy is to provide additional signage to direct customers to the nearest parking structure.
600 Block of Dunsmuir: The issues are a lack of nearby on-street parking (a situation which existed
before the bike lanes were implemented) and an inability for vehicles to make right turns from Dunsmuir
St. onto Seymour St. The mitigation strategies recommended are to allocate businesses designated
parking spots in the nearest parking structure, to more clearly identify the loading zone on the south side
of the street by introducing painted markings on the asphalt, and to allow right turns onto Seymour St.
Lessons Learned and Recommendations
Based on comments from interviews, workshops and other business interviews, the following lessons
learned are provided:
With increased demands for the use of limited road and sidewalk space by many parties, it is
recommended that the City aggressively and creatively pursue opportunities to be flexible in the use
VANCOUVER SEPARATED BIKE LANE BUSINESS IMPACT STUDYJULY 20, 2011
vi
of the public realm, allocating scare space to different uses according to the demand at different times
of the day (i.e., peak and non-peak hours), different days of the week (weekdays and weekends) and
different times of the year. For example, the City could examine the use of automatic bollards that can
be raised and lowered to establish a separated bike lane when necessary. Other cities have installed
these bollards to allow road space to be used flexibly for parking, loading zones and vehicle
movement, and they could be an important mechanism to deploy in the context of bike lanes.
More extensive consultation should be conducted in groups and on a one-to-one basis with potential
impacted parties before and after implementation of traffic changes, including an explanation of the
reasons for these measures. When the overarching goals of changes to transportation infrastructure
are better understood, it forms the basis for a better discussion on issues that directly impact
businesses. Sufficient time should be permitted between phases of the consultation for stakeholders
to digest the information provided by the City, to provide their responses and to flag issues for
potential mitigation.
A regular monitoring program should be established by the City for future cycling lanes or other
similar significant changes that reallocate road space (e.g. transit priority lanes for buses, creation of
new pedestrian malls, wider sidewalks, streetcar tracks, or light rail transit). The program would haveassigned responsibility, budget and reporting mechanisms to monitor traffic, business and other
impacts in the immediately impacted corridors and nearby streets. These potential impacts would
include changes in sales, vacancy rates, lease rates, and rents. The City should work with the private
sector to establish appropriate capitalization rates to gauge the long-term impacts of separated bike
lanes and other changes.
Where specific business impacts from transportation changes are identified, the City should move
quickly to meet with the businesses that have been particularly impacted, or that are located in hot
spot blocks, in order to mitigate sales losses, lower revenue from rents, and increased vacancies.
A Downtown Business Transportation Advisory Committee should be formed to keep the downtown
business community informed on local transportation issues and to address any current
transportation-related problems. Participants would represent their respective business organizations,which could include The Vancouver Board of Trade, Downtown Vancouver Business Improvement
Association, the Downtown Vancouver Association, the Gastown Business Improvement Association,
the West End Business Improvement Association, the Robson Street Business Association, and the
Canadian Federation of Independent Businesses (on major downtown transportation issues).
Greater time and budget for future studies of this type should be provided to enable a greater
refinement of the business databases to ensure greater coverage, to obtain more complete contact
information, and to have an enhanced ability to accommodate alternative languages.
In the future, demand for road space will only increase, not only for vehicles but for pedestrians,
transit, cyclists and for the creation of new pedestrian spaces. These are important issues which
should be addressed in the City‟s development of its new Transportation Plan.
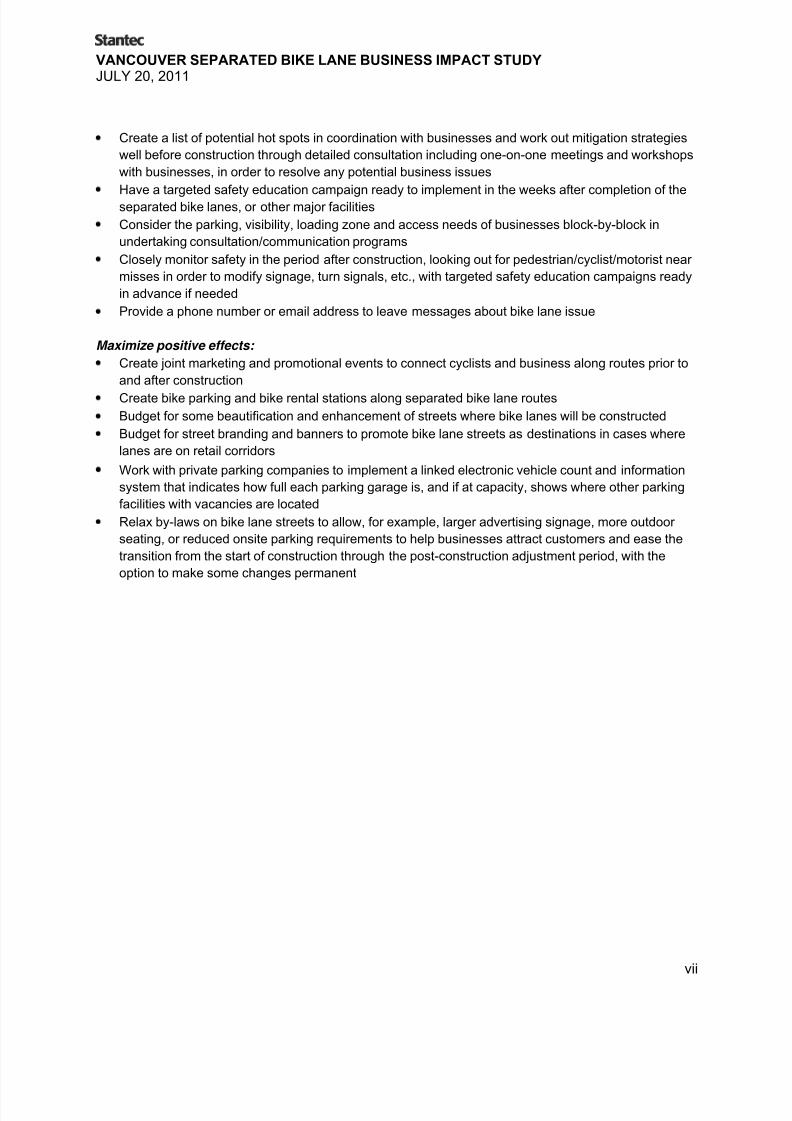
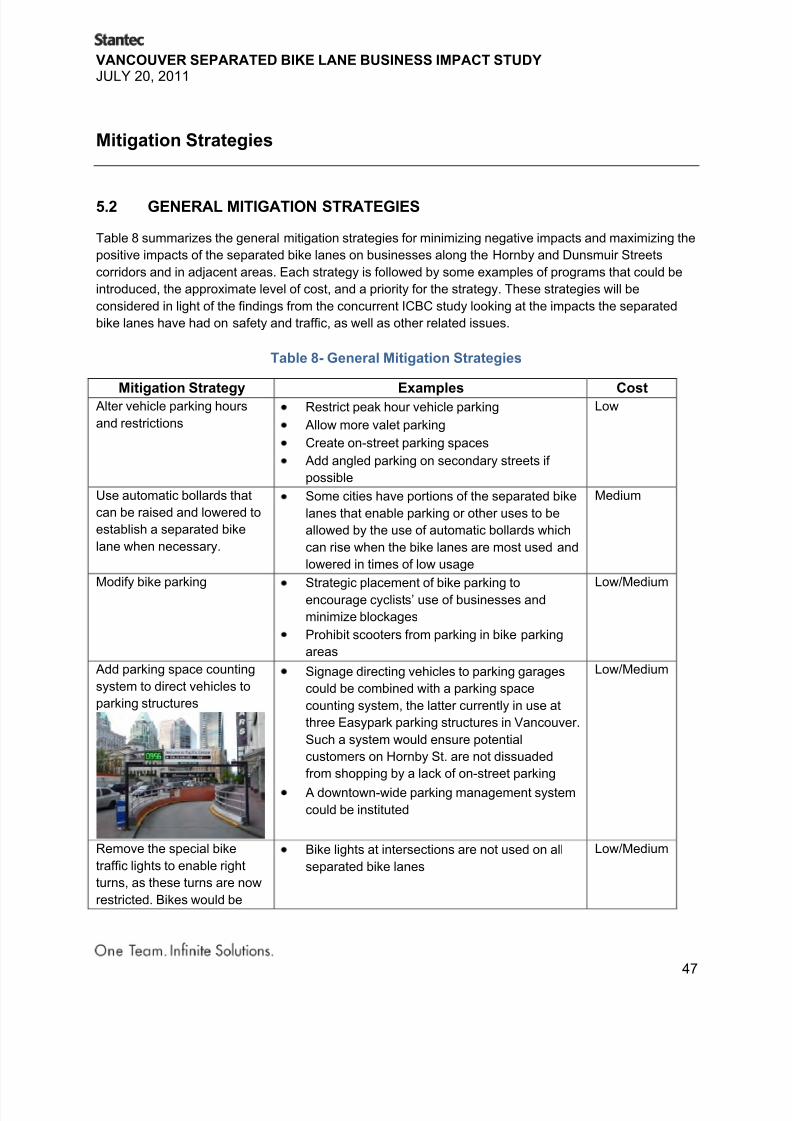
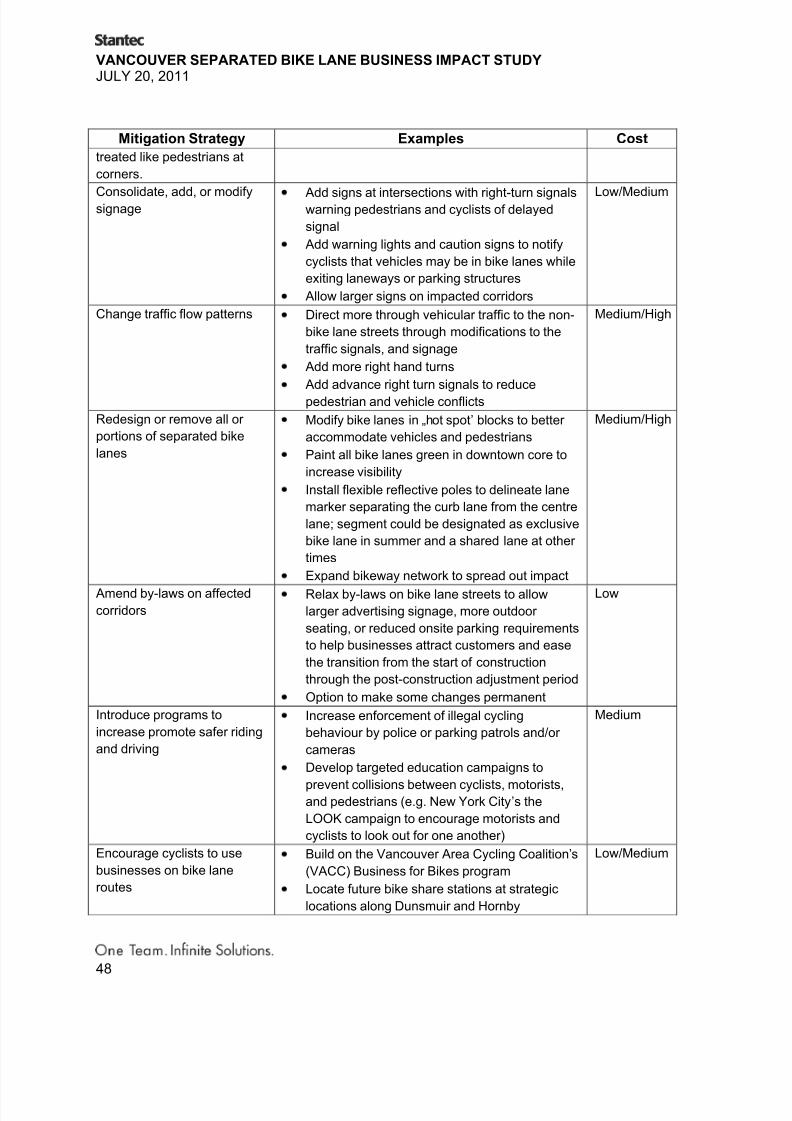
The approaches below are recommended to help minimize negative impacts and maximize the positiveeffects of future changes in the use of road space by the City of Vancouver. Some of these approaches
are already used by the City, but they deserve increased attention.
Minimize negative impacts:
Monitor changes in traffic flow and make changes based on any issues that arise
VANCOUVER SEPARATED BIKE LANE BUSINESS IMPACT STUDYJULY 20, 2011
1
1.0 Introduction
In 2010, to support the goals of its transportation plan to increase cycling mode share, the City of
Vancouver implemented two separated two-way bike lanes – one on Dunsmuir St. in June 2010 and a
second route along Hornby St. in December 2010 (Fig. 1) (see Appendix M for additional details). To
construct the separated bike lanes, road space was reallocated and a total of 172 parking spaces were
removed (156 from Hornby St. and 16 from Dunsmuir St.). Some loading zones were moved and turn
restrictions were introduced in five locations to reduce the risk of bicycle collisions, some parking was
removed, the illegal use of some loading areas was eliminated, and pedestrians at some locations now
must cross bike lanes.
Figure 1: Map of Downtown Street and Bridge Separated Bike Lanes
With the installation of the separated bike lanes, a permeable barrier has been created between vehicles
and grade-level businesses. Thus, some businesses have expressed concern that the separated bike
lanes are leading to reduced visits from customers both who walk to their businesses or drive and park. In
response, the City of Vancouver, Vancouver Economic Development Commission, The Vancouver Board
of Trade, Downtown Vancouver Business Improvement Association, and Downtown Vancouver
Association have come together and initiated a study that examines the business impact of the separatedbike lanes. The consulting team of Stantec Consulting, Site Economics Ltd and Mustel Research
completed the study between May and June of 2011.
1.1 STUDY PURPOSE
This study measures and quantifies the business impacts of the separated bike lanes on a variety of
business types situated along the separated bike lanes, as well as on intersecting streets where new
VANCOUVER SEPARATED BIKE LANE BUSINESS IMPACT STUDYJULY 20, 2011
2
turning restrictions have been introduced (e.g. hotels, restaurants, services, etc.). As well, the changes in
commercial/retail occupancy levels, sales and lease rates that have resulted from the establishment of
the separated bike lanes and the business impacts of implementing turn restrictions to accommodate the
bike lanes are quantified.
In addition, mitigation strategies have been assessed to determine how they might be applied to “hot
spot” blocks that have seen the greatest estimated business impacts. The purpose of the mitigation
strategies is to address the negative impacts as well as maximize business opportunities related to
reallocating road space (e.g. traffic lanes, parking, and loading areas) to alternative transportation modes
such as cycling, walking, and public transit. These strategies have been further supplemented by
suggestions made by the study‟s stakeholders in telephone interviews with the consultant (i.e., impacted
businesses and property owners).
While previous studies have looked at the overall potential impact of separated bike lanes on business or
estimated the general economic benefits that enhanced cycling, pedestrian, or transit infrastructure can
have, this study is unique in that it focuses on estimating the actual business impact of separated bikelanes. This research will form part of a broader analysis of the separated bike lanes and related issues
that the City of Vancouver is examining and will be reporting to City Council in July 2011. The results of
this study will be taken into consideration alongside other related studies. For example, the Insurance
Corporation of British Columbia (ICBC) is undertaking an independent study on the impact of the
separated bike lanes on traffic collisions, and the City of Vancouver will examine the potential trade-offs
involved in the strategies recommended by this study and by its broader analysis. This is the first-ever
study in North America, and perhaps the world, that has focused on identifying the direct
business impacts of introducing separated bike lanes.
It should be noted that this study is limited to quantifying the business impacts of the separated bike
lanes. It does not measure the macroeconomic or other related impacts of the separated bike lanes,
which include the implications on the health of residents and employees, the health of the environment,
and the City‟s image and international reputation. Some of these issues have been raised by
stakeholders in their survey and e-mail comments, which are summarized in the Appendices, and will be
considered in the City of Vancouver broader assessment of the separated bike lanes report at council in
July 2011.
The results of this study survey only the preliminary impacts of and attitudes toward the separated bike
lanes among respondents within a few months of their introduction and only provide an estimate of the
longer-term benefits and costs at one point in time. There has been insufficient time for the leasing and
tenant market to react and even store sales records do not represent a full year. If the separated bike
lanes remain in place, without adjustments, it is important to state that the longer-term business impacts
(negative and positive) will require further longer-term monitoring and further consultation with impactedstakeholders.
1.2 BACKGROUND ON SEPARATED BIKE LANES
There has been a trend in cities throughout the world in recent years to increase investment in public
transit, pedestrian, and cycling networks for a variety of reasons: to encourage higher levels of physical
activity; to reduce environmental pollution; to reduce traffic congestion; to lower spending on roads; to
VANCOUVER SEPARATED BIKE LANE BUSINESS IMPACT STUDYJULY 20, 2011
3
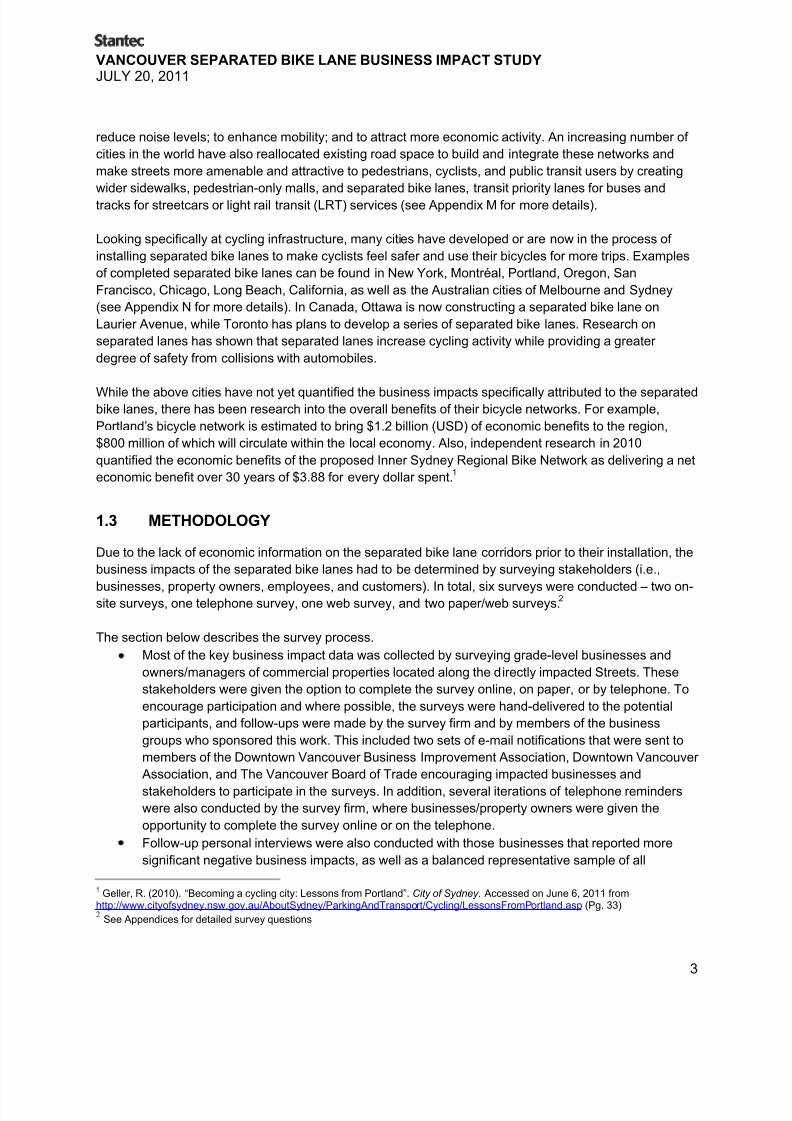
reduce noise levels; to enhance mobility; and to attract more economic activity. An increasing number of
cities in the world have also reallocated existing road space to build and integrate these networks and
make streets more amenable and attractive to pedestrians, cyclists, and public transit users by creating
wider sidewalks, pedestrian-only malls, and separated bike lanes, transit priority lanes for buses and
tracks for streetcars or light rail transit (LRT) services (see Appendix M for more details).
Looking specifically at cycling infrastructure, many cities have developed or are now in the process of
installing separated bike lanes to make cyclists feel safer and use their bicycles for more trips. Examples
of completed separated bike lanes can be found in New York, Montréal, Portland, Oregon, San
Francisco, Chicago, Long Beach, California, as well as the Australian cities of Melbourne and Sydney
(see Appendix N for more details). In Canada, Ottawa is now constructing a separated bike lane on
Laurier Avenue, while Toronto has plans to develop a series of separated bike lanes. Research on
separated lanes has shown that separated lanes increase cycling activity while providing a greater
degree of safety from collisions with automobiles.
While the above cities have not yet quantified the business impacts specifically attributed to the separatedbike lanes, there has been research into the overall benefits of their bicycle networks. For example,
Portland‟s bicycle network is estimated to bring $1.2 billion (USD) of economic benefits to the region,
$800 million of which will circulate within the local economy. Also, independent research in 2010
quantified the economic benefits of the proposed Inner Sydney Regional Bike Network as delivering a net
economic benefit over 30 years of $3.88 for every dollar spent.1
1.3 METHODOLOGY
Due to the lack of economic information on the separated bike lane corridors prior to their installation, the
business impacts of the separated bike lanes had to be determined by surveying stakeholders (i.e.,
businesses, property owners, employees, and customers). In total, six surveys were conducted – two on-site surveys, one telephone survey, one web survey, and two paper/web surveys.2
The section below describes the survey process.
Most of the key business impact data was collected by surveying grade-level businesses and
owners/managers of commercial properties located along the directly impacted Streets. These
stakeholders were given the option to complete the survey online, on paper, or by telephone. To
encourage participation and where possible, the surveys were hand-delivered to the potential
participants, and follow-ups were made by the survey firm and by members of the business
groups who sponsored this work. This included two sets of e-mail notifications that were sent to
members of the Downtown Vancouver Business Improvement Association, Downtown Vancouver
Association, and The Vancouver Board of Trade encouraging impacted businesses and
stakeholders to participate in the surveys. In addition, several iterations of telephone reminders
were also conducted by the survey firm, where businesses/property owners were given the
opportunity to complete the survey online or on the telephone.
Follow-up personal interviews were also conducted with those businesses that reported more
significant negative business impacts, as well as a balanced representative sample of all
1 Geller, R. (2010). “Becoming a cycling city: Lessons from Portland”. City of Sydney. Accessed on June 6, 2011 fromhttp://www.cityofsydney.nsw.gov.au/AboutSydney/ParkingAndTransport/Cycling/LessonsFromPortland.asp (Pg. 33) 2 See Appendices for detailed survey questions
VANCOUVER SEPARATED BIKE LANE BUSINESS IMPACT STUDYJULY 20, 2011
4
categories of businesses. To help verify the survey responses, these businesses were also
encouraged to provide more detailed financial information (e.g. monthly sales).
The above data was further supplemented by a customer intercept survey that randomly selected
customers who were in or near the businesses along the study corridors. These surveys provided
more insights into customers‟ travel habits and perceptions within the affected areas and helped
validate the information provided by the businesses.3
As well, the study included several questions about the separated bike lanes within the Metro
Vancouver OMNIBUS telephone survey as a way to access people who no longer shop within the
affected areas. This survey randomly selected residents who live anywhere within Metro
Vancouver.
In addition, the employees of upper floor tenants on the subject corridors were surveyed in a
sample of buildings that represented smaller (10 stories and below) and larger (above 10 stories)
buildings. This was done to assess any impact of office workers in the central business district.
Lastly, an online survey was developed to collect additional feedback from other customers and
employees of the affected corridors. To encourage participation in this survey, the Vancouver
Economic Development Commission and the City of Vancouver promoted the survey through thesocial media tool Twitter. Anyone who lived in Metro Vancouver could respond to this survey, but
only a single time.
After collecting and analyzing business data within the directly impacted areas, a grade-level business
survey, upper floor tenants employee survey, and property owner/manager survey were also conducted
for comparator corridors: Howe St. was used as a comparator for Hornby St. and West Georgia St. as a
comparator for Dunsmuir St. The goal was to isolate the impact that other factors may have had on
business activity before and after the implementation of the separated bike lanes. These factors included:
The 2008-2009 economic downturn in Canada;
Increased parking rates due to the introduction of the harmonized sales tax (HST) in July 2010and the 14% tax increase for off-street paid parking implemented by TransLink;
Road closures and access changes due to the 2010 Winter Olympics;
The opening of the Canada Line rapid transit system in August 2009;
The fuel tax increase of January 20104;
Downtown construction that has affected traffic patterns;
Filming activity in the downtown core;
The re-introduction of buses on Granville St.; and
Stricter impaired driving rules.
By using a methodology that included comparator streets, an attempt was made to eliminate the impact of
these other key factors impacting businesses. However, despite this attempt, there may still be someresidual impact included in the responses provided by businesses and property owners along the
Dunsmuir and Hornby corridors. The Metro Vancouver area experienced a significant economic downturn
3 Previous studies in Graz, Austria and Bristol, United Kingdom, that surveyed retailers and customers have found that retailerssignificantly overestimated the importance of the car and availability of parking, and the percentage of customers traveling by car. 4
In January, 2010 the fuel tax levied by TransLink increased from 12 cents to 15 cents per litre, resulting in an increase of the totalprovincial motor fuel tax from 23.5 cents to 24 cents per litre. Source:http://www.sbr.gov.bc.ca/documents_library/notices/Notice_of_Fuel_Tax_Changes_and_Inventory_Requirements.pdf
VANCOUVER SEPARATED BIKE LANE BUSINESS IMPACT STUDYJULY 20, 2011
5
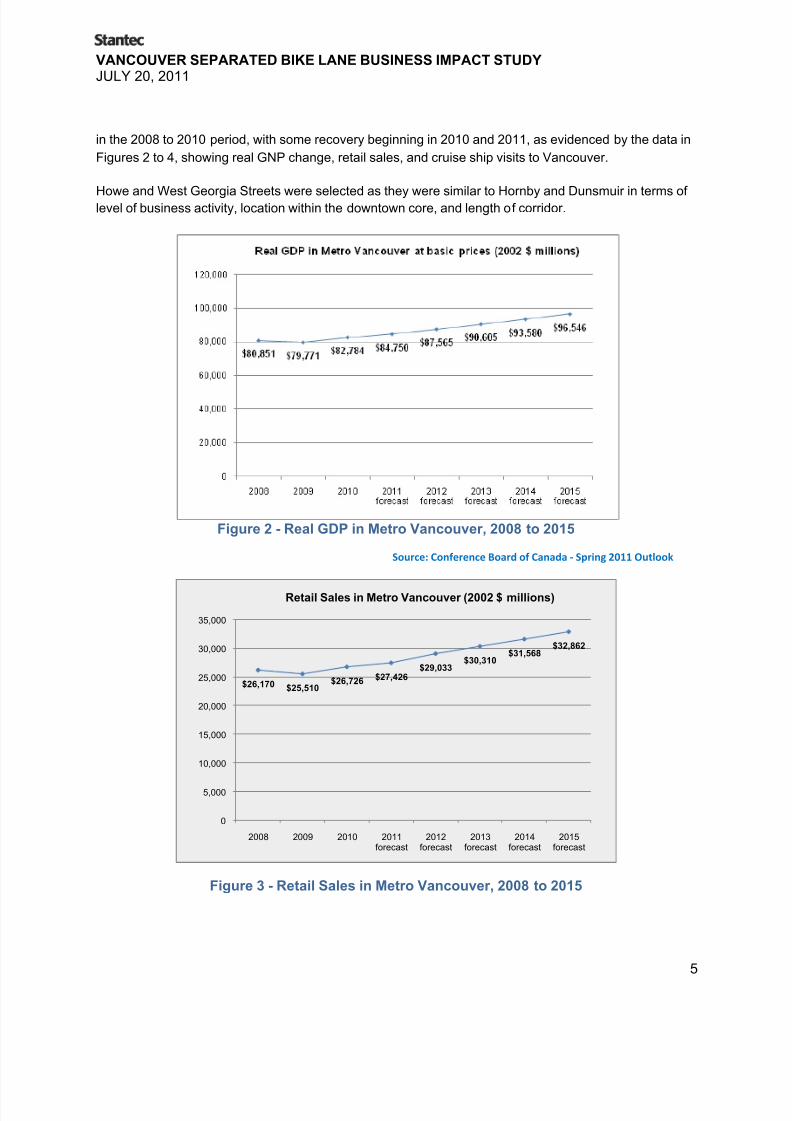
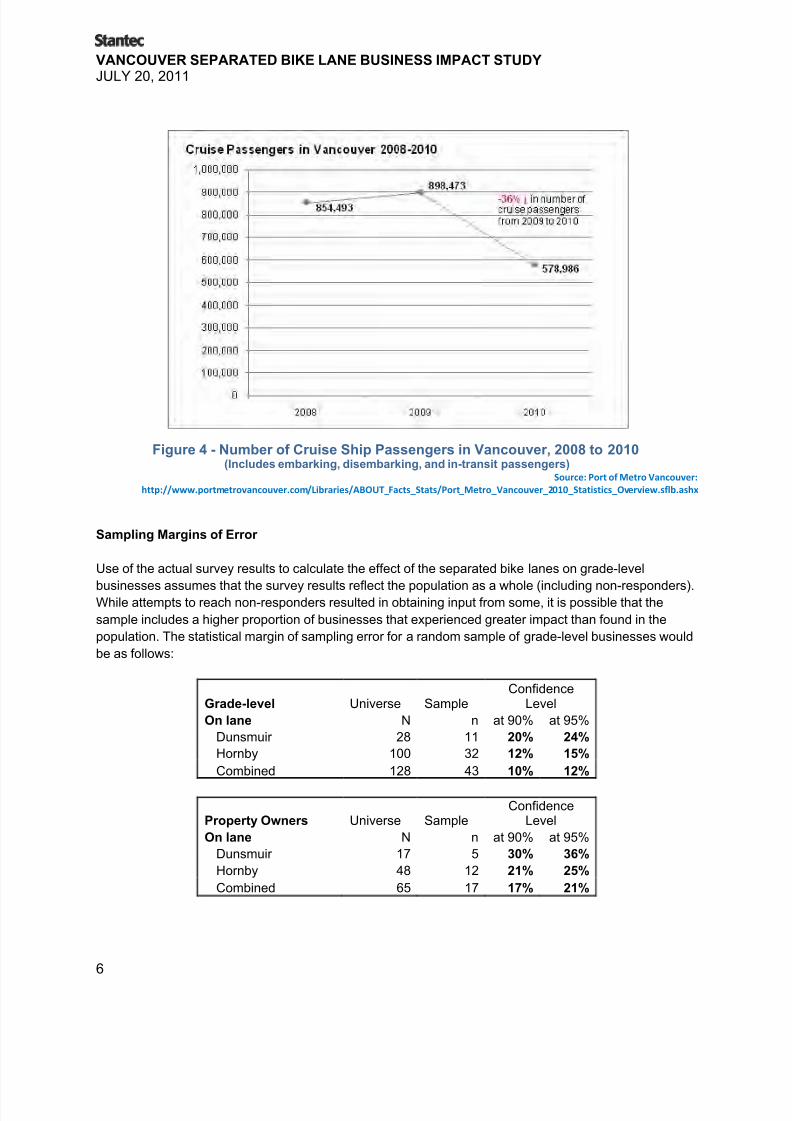
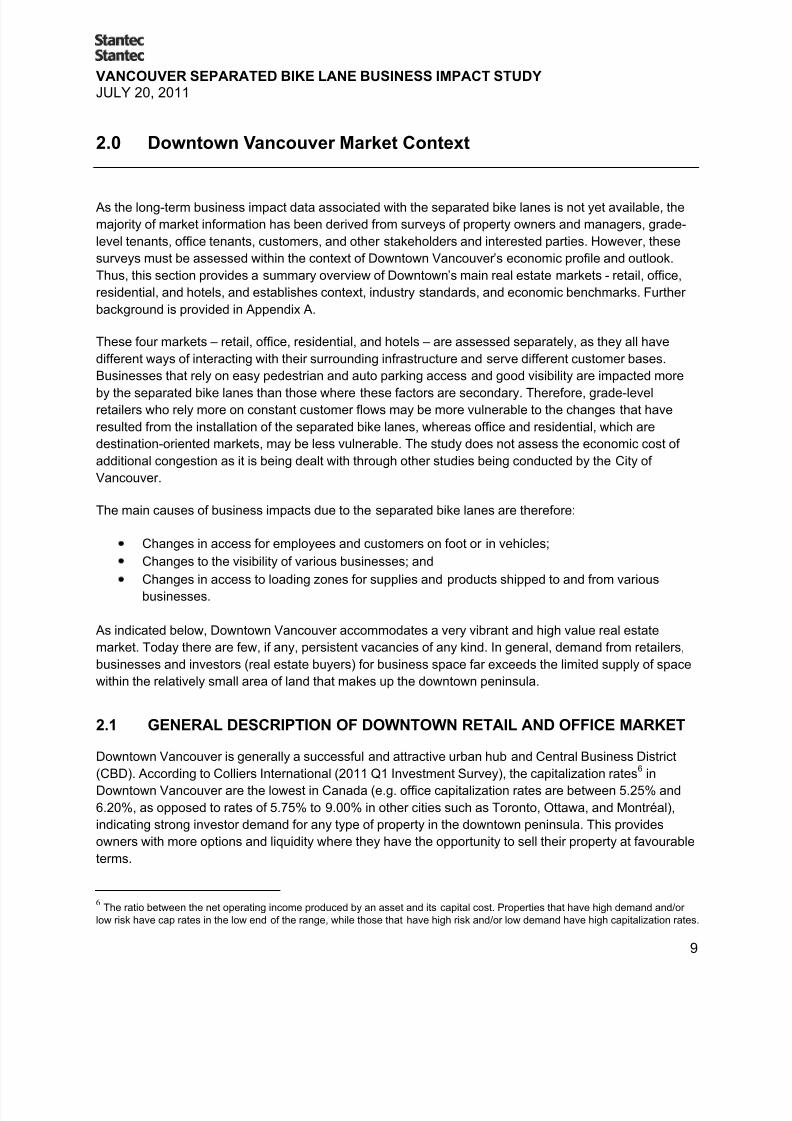
in the 2008 to 2010 period, with some recovery beginning in 2010 and 2011, as evidenced by the data in
Figures 2 to 4, showing real GNP change, retail sales, and cruise ship visits to Vancouver.
Howe and West Georgia Streets were selected as they were similar to Hornby and Dunsmuir in terms of level of business activity, location within the downtown core, and length of corridor.
Figure 2 - Real GDP in Metro Vancouver, 2008 to 2015
Source: Conference Board of Canada - Spring 2011 Outlook
Figure 3 - Retail Sales in Metro Vancouver, 2008 to 2015
VANCOUVER SEPARATED BIKE LANE BUSINESS IMPACT STUDYJULY 20, 2011
7
The following map (Fig. 5) shows areas where the grade-level business survey, the customer exit survey,
the upper floor tenants employee survey, and the property owner/manager survey were conducted. The
OMNIBUS survey and open online survey were not location-specific.
Figure 5: Study Survey Areas Bike Lanes and Comparator Streets
The economic survey data was also cross-referenced with transportation data (e.g., vehicle travelspeeds, vehicle volumes) for each block of the affected and comparator corridors to identify possible
correlations between these two elements (see Appendix K for more details about transportation trends
within Downtown Vancouver and the study corridors).
1.4 EVALUATION CRITERIA
To determine whether or not the separated bike lanes have had a negative or positive business impact on
individual businesses, the following key evaluation indicators have been developed for this study:
Estimated percentage change in sales in study area;
Estimated percentage change in profit in study area;
Perceived change in ease of access for employees and customers;
Estimated percentage change in net rents5
and vacancy rates in study area; and
Expressions by businesses of the impact on access for deliveries.
5 Net rent is the portion of the rent which goes to the landlord while the other two components of rent, Property Taxes and CommonArea Maintenance (CAM) typically flow from the tenant, through the landlord to a third party.
VANCOUVER SEPARATED BIKE LANE BUSINESS IMPACT STUDYJULY 20, 2011
10
Below is a brief description of the retail, office, and residential markets, based on information provided by
Colliers International, a commercial real estate brokerage, and CB Richard Ellis (CBRE), a commercial
real estate company that provides financing and management services.7 These points are further
expanded in the subsequent sections that follow.
The downtown retail market in Vancouver includes premises that generate some of the highestrents in Canada. The regional retail infrastructure provides a large and sophisticated selection of
stores, which has made the CBD the premiere shopping destination in the region. Increased
transit services such as the Canada Line rapid transit service have only reinforced Downtown‟s
dominance of the regional retail market. This has placed Downtown in the unique role of offering
a one-of-a-kind shopping experience with both price and selection advantages over suburban
malls.
The downtown peninsula has a daytime employee base of 145,000, mainly in sales and service,
business, finance and administration, and management.8 The office market has been relatively
stable and has enjoyed a relatively low vacancy rate of between 4% and 6% over the past four
years and it is trending downward. However, the decentralization of office employment into the
suburbs has been pronounced over the last 10 years and the CBD has a declining share of the
overall regional office market. CBD office space is far more expensive to build and occupy thansuburban office space.
The residential market is strong and the downtown core of Vancouver has one of the highest
population densities of any urban area in North America, which at about 15,000 residents per
square kilometre, is triple the City of Vancouver‟s average.8 These residential land uses have
generated property values that are among the highest in Canada, with many condominiums
selling for close to $1,000 per sq. ft. In addition, such a large local residential customer base
within such a small area has helped downtown retail thrive.
The hotel market is relatively stable and demand has not grown significantly for the past ten
years.
2.2 THE RETAIL MARKET
This sub-section describes the retail market in Downtown Vancouver. Although the issues associated with
pedestrian and car volumes are not discussed here, the location of the commercial districts and
pedestrian traffic are directly correlated. Areas with low pedestrian traffic counts typically have little or no
retail and the areas with the highest pedestrian traffic counts have the premier retail tenants and
development.
Overall, the combination of a large downtown population and employment base, an extensive transit and
transportation network that allows easy access for regional customers, a large tourist market, and other
factors all combine to generate strong demand within a market with a constrained supply of space. This
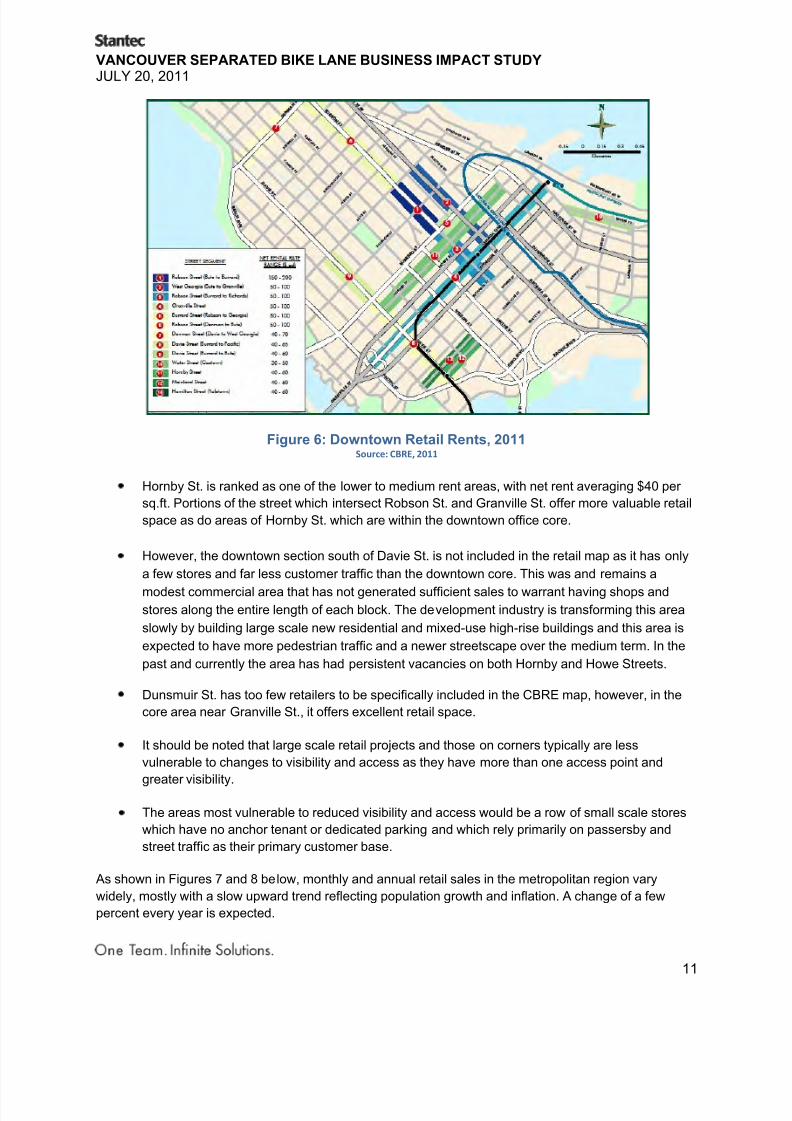
high demand is illustrated by the following map by CBRE (Fig. 6), which shows that net retail rates are
relatively high in downtown Vancouver and reach $200 net (income received by property owner) per sq.
ft. on parts of Robson St. Other commercial streets that have higher than average rental rates include
West Georgia, Granville St., and Burrard St. The rent estimates would to some degree apply to the
surrounding streets, with a decline in rates as ones moves from a strong commercial area to a weaker
commercial area.
7City of Vancouver Core Employment Study (ongoing, Rhonda Howard)
8 Downtown Vancouver Business Improvement Association. (2009). Downtown Vancouver: Neighbourhood Profile. Accessed June6, 2011 from http://www.bizmapbc.com/neighbourhood-profiles/downtown-neighbourhood.pdf
Hornby St. is ranked as one of the lower to medium rent areas, with net rent averaging $40 per
sq.ft. Portions of the street which intersect Robson St. and Granville St. offer more valuable retail
space as do areas of Hornby St. which are within the downtown office core.
However, the downtown section south of Davie St. is not included in the retail map as it has only
a few stores and far less customer traffic than the downtown core. This was and remains a
modest commercial area that has not generated sufficient sales to warrant having shops andstores along the entire length of each block. The development industry is transforming this area
slowly by building large scale new residential and mixed-use high-rise buildings and this area is
expected to have more pedestrian traffic and a newer streetscape over the medium term. In the
past and currently the area has had persistent vacancies on both Hornby and Howe Streets.
Dunsmuir St. has too few retailers to be specifically included in the CBRE map, however, in the
core area near Granville St., it offers excellent retail space.
It should be noted that large scale retail projects and those on corners typically are less
vulnerable to changes to visibility and access as they have more than one access point and
greater visibility.
The areas most vulnerable to reduced visibility and access would be a row of small scale stores
which have no anchor tenant or dedicated parking and which rely primarily on passersby and
street traffic as their primary customer base.
As shown in Figures 7 and 8 below, monthly and annual retail sales in the metropolitan region vary
widely, mostly with a slow upward trend reflecting population growth and inflation. A change of a few
VANCOUVER SEPARATED BIKE LANE BUSINESS IMPACT STUDYJULY 20, 2011
13
2.3 THE OFFICE MARKET
This sub-section describes the office market in Downtown Vancouver, where the historical peak for
vacancy rates was in 2000, after which the office market has generally gained strength. Vacancy rates
have been in a consistent downward trend, to less than 5% currently (Fig. 9). Demand now consistently
exceeds supply, with over 1 million sq. ft. of supply absorbed over the past decade. The only significantnew addition of Class A office space to the CBD was the completion of the second phase of the Bentall 5
building in late 2007.
According to Colliers International, the downtown office market represents approximately 24.2 million sq.
ft. of existing office space. This is slightly less than half of the Metro Vancouver regional market as there
are approximately 27.3 million sq. ft. of office space in the suburbs. Like virtually all North American cities
the suburban office market is expected to grow at a much faster rate than the downtown office market,
despite several proposed new office buildings. Suburban office space typically consists of smaller scale,
more cost-efficient and lower rent buildings located on numerous readily available development sites,
many of which have attractive locational features such as proximity to rapid transit stations, the airport,
and highways.
Downtown Vancouver is located at the extreme western edge of the region, rather than being in the
centre, which limits development potential. In addition, the land base in the CBD is very expensive and
largely built out with relatively few potential new office development sites. The various suburbs offer
hundreds of potential new office development sites with a large selection of building sizes and at a far
lower base costs.
The average net office space rent has been steadily increasing and the vacancy rate has remained
relatively low in Downtown Vancouver. It is expected that rents are going to climb significantly over the
next few years and that the vacancy rate will drop even lower, increasing office building values. The only
potential for vacancy rates to increase is pending new supply in the form of new office tower
VANCOUVER SEPARATED BIKE LANE BUSINESS IMPACT STUDYJULY 20, 2011
14
2.4 RESIDENTIAL MARKET
Residential development is destination-oriented (as opposed to convenience-oriented) and it is not
measurably or significantly impacted by access and visibility in the same way as retail, office, or hotel
uses.
Downtown Vancouver has some of the most valuable residential lands in Canada, with many
condominiums selling for over $1,000 per sq. ft. As a result, rezoning to permit high-density residential
development creates additional value for properties. This potential to create value is an important feature
of Downtown, as it allows for development flexibility and alternative mixed-use zoning to be considered in
the mitigation strategies.
For example, if in the long term, it is deemed that a particular office or hotel site is no longer viable
despite infrastructural or technical enhancements or new marketing or businesses, then rezoning to
permit high-rise residential development could be an alternative. A residential development site is more
than twice as valuable as a commercial development site (the value per buildable sq. ft., as defined by
FSR, or floor space ratio, multiplied by site area, of future condominium sites downtown reaches over
$200 whereas commercial sites for future office towers are closer to $80 per buildable sq. ft.).
The City of Vancouver can increase value simply by changing land use, offering a possible mitigation
solution that could be considered for negatively affected properties.
2.5 HOTEL MARKET
The hotel market, as mentioned before, is site specific; therefore context and historical trends are not as
salient as with retail and office space. It is sufficient to mention that this is a less profitable form of real
estate than retail, office residential or even industrial. The market is competitive and subject to wide
swings in business volumes. The recent recession coupled with the Olympics and other factors make
these trends mute. The discussion of impact should rest with the individual hotels, five of which are
located adjacent to the separated bike lanes. It should be noted that it is highly likely that any potentialimpact on access, as with other types of businesses, is more significant if the bike lanes are outside their
front door as opposed to across the street.
The CBD accounts for approximately half of all hotel rooms in the Metro Vancouver region. As with office
and retail space, this is a declining share of the market as the CBD becomes built out and new hotel
development increasingly moves to other parts of the city and the suburbs.
VANCOUVER SEPARATED BIKE LANE BUSINESS IMPACT STUDYJULY 20, 2011
17
3.0 Surveys of Tenants, Owners, Customers and Stakeholders
As the separated bike lanes were installed only within the past year, not enough time has passed toidentify any long term economic or financial trends. As such, this study has been conducted as a survey-
based business impact analysis. Six surveys were completed to assess the opinions and experience of all
affected stakeholders and businesses. The smaller-scale surveys were conducted to provide
supplementary data on office users, customers, residents of the region, and various interested parties.
The full questionnaires, a chart of all responses, and a summary interpretation are provided in the
Appendices of this report.
Overview of Grade-Level Business Tenant and Commercial Property Owners & Property ManagersSurveys
The two surveys were conducted with the businesses and
property owners and managers located on the separated bike
lanes: a grade-level business tenant survey and a commercial
property owners & property managers survey. The analysis
strategy was to determine recent sales trends within this most
affected group and then compare them with a full-scale and
directly comparable survey of a comparator street.
The streets with either separated bike lanes or those impacted
directly by them are:
Hornby St. between Beach Avenue and West Hastings St
Dunsmuir St. between Beatty St and Burrard StTwo sections of Burrard St – between Drake St and Pacific St, as well as between West Hastings
St and West Cordova St
Seymour St between Dunsmuir St and West Pender St
The comparable streets and same blocks located nearby, which are used as the comparators are:
Howe St between Pacific St and West Hastings St
West Georgia St between Beatty St and Burrard St
The grade-level business tenant and property owners and property managers surveys relied upon
voluntary completion and return of detailed questionnaires. There is some variance in the response rate
for the grade-level business survey as some surveys were only partially filled out and the analysis had to
statistically account for this.
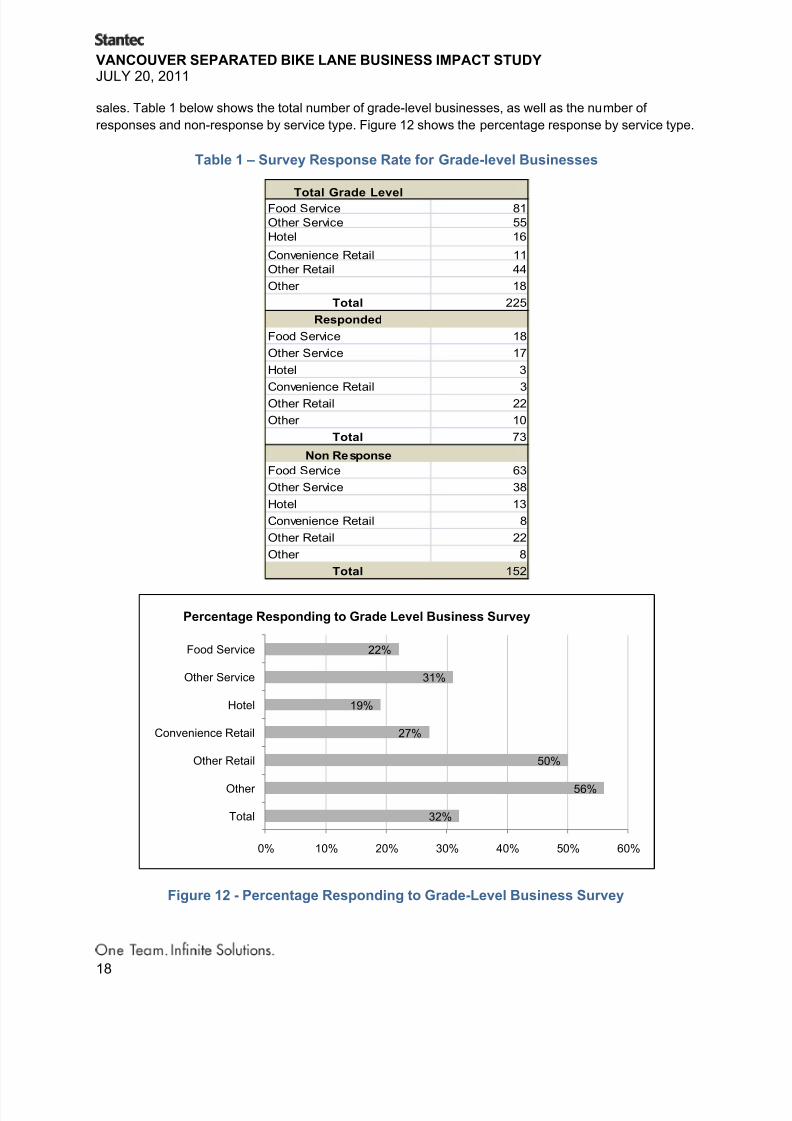
A total of 73 grade-level business tenants responded out of 225 businesses that received the surveys, for
a response rate of 32%, which is reasonable for this type of survey in which the business could decide
whether they wanted to respond. This response rate differs slightly from the formal Mustel consultant
report which had 77 responses, as they included partial responses that did not address the question of
VANCOUVER SEPARATED BIKE LANE BUSINESS IMPACT STUDYJULY 20, 2011
20
In 2009, the percentage change in sales from the previous year among respondents was: Hornby -
0.7%, Howe -2.8%, Dunsmuir 6.2%, West Georgia -6%, and Seymour 0.1%. The average change in
sales was minimal.
In 2010, the percentage change in sales from the previous year among respondents was: Hornby0.2%, Howe 1.8%, Dunsmuir 6.8%, West Georgia 3.3%, and other 2.7%, giving an average increase
of 2.5%.
In 2011, the percentage change in sales from the previous year among respondents was: Hornby -
11%, Howe -1%, Dunsmuir -2%, West Georgia 2%, and Seymour -2%. The overall average was -
5.2%.
In 2011, the net impact (the affected street minus the comparator street) among respondents was:
Hornby -10% and Dunsmuir -4%. The remaining streets have no comparators.
The largest sales declines among respondents on Hornby St. between 2010 and 2011 were the 500,
600, 900 and 1000 blocks.
On Dunsmuir St., respondents of the 600 block noted the greatest decline.
There are other, less affected areas on the separated bike lane streets, as well as blocks such as 500
Seymour St., which has lost some points of access, and 1300 Burrard St., which has reported
reduced on-street parking.
The following table summarizes the reported sales change for each street and by each tenant category.
This same analysis was conducted for each city block, however this level of detail cannot be revealed in
this report to ensure respondent confidentiality.
Table 2 - 2011 Sales Change for Grade-level Businesses by Type (Respondents only)
In 2011, the estimated net impact of having the separated bike lane adjacent to a business as opposed to
across the street was reported to be a further change in sales of -8.8% on Hornby St. and -9.4% on
VANCOUVER SEPARATED BIKE LANE BUSINESS IMPACT STUDYJULY 20, 2011
21
Dunsmuir St. Thus, it is clear that grade-level businesses responding to the survey noted that having the
bike lane adjacent to their business was worse for sales than it is for stores across the street.
On Hornby St., food service businesses responded that their sales had declined by -12.5% between 2010
and 2011, while other service businesses reported an 18% drop. In general, food services reported the
lowest level of impact, while other service and convenience retail reported the highest impact. Thisindicates that shops that rely on convenient access with proximate parking have reported the largest
impact from the construction of the separated bike lanes. On Dunsmuir St., food service businesses
reported a sale decline of 10%.
Based on the question 12, which asked about total sales change from 2010 to 2011, it would appear to be
reasonable to attribute a sales decline on the order of -7.5 to -10% to the separated bike lanes with a
greater impact on the bike lane adjacent side of the street. This figure corresponds to the customer
surveys which also show a -7.5 to -10% decline in patronage.
OTHER QUESTIONS AND REPLIES ABOUT SALES
The most significant impact of any event or change in downtown over the past few years was reported by businesses to be the
implementation of the separated bike lanes, with a modest negative
effect. Respondents noted that the separated bike lanes caused a
decline in sales of 11.9% overall, with a decrease of 13.9% on Hornby
St., 7.9% on Howe St., 9% on Dunsmuir St., 3.8% on W. Georgia St.
On both Hornby and Dunsmuir, the separated bike lanes were rated as
having a greater negative impact than any other factor.
However, the negative impacts from recent tax changes (e.g. HST,
parking taxes) and the general economy also appeared to have
comparable impacts. Recent tax changes were reported to have
caused a 9.3% decline in sales overall, with a 9.8% decline on both
Hornby St. and Howe St., while Dunsmuir St. reported a decline of 8.6%
and West Georgia St. 3.8%. As well, overall economic conditions were
reported to have caused a 7.8% decline in sales overall, with a 9.2% decline on both Hornby St. and a
7.1% decline on Howe St., while Dunsmuir St. reported a decline of 2.8% and West Georgia St. 10%.
Positive impacts included the Canada Line, which had a positive impact on sales of 2.4%, as well as the
Olympics, which had a positive impact of 1.5%.
In question 14 of the survey, which specifically asks about the impact of the separated bike lanes on
sales, Hornby St. tenants reported a mean decline in sales of 11.8%, Howe St. tenants 7.7%, Dunsmuir
St. tenants 8.1%, and West Georgia St tenants 5.0%, giving an overall mean decline of 10.3%. The same
question was asked about profits and the responses were nearly identical, with mean declines in profit of 11.3% on Hornby St., 8.8% on Howe St., 7.6% on Dunsmuir St., and 5.0% on W. Georgia St., for an
overall mean decline of 10.6%.
In question 15 of the survey, which asks about the specific reasons for the decline, respondents reported:
A loss of parking;
Visibility reduced on the 500, 700 and 900 blocks of Hornby St.;
VANCOUVER SEPARATED BIKE LANE BUSINESS IMPACT STUDYJULY 20, 2011
24
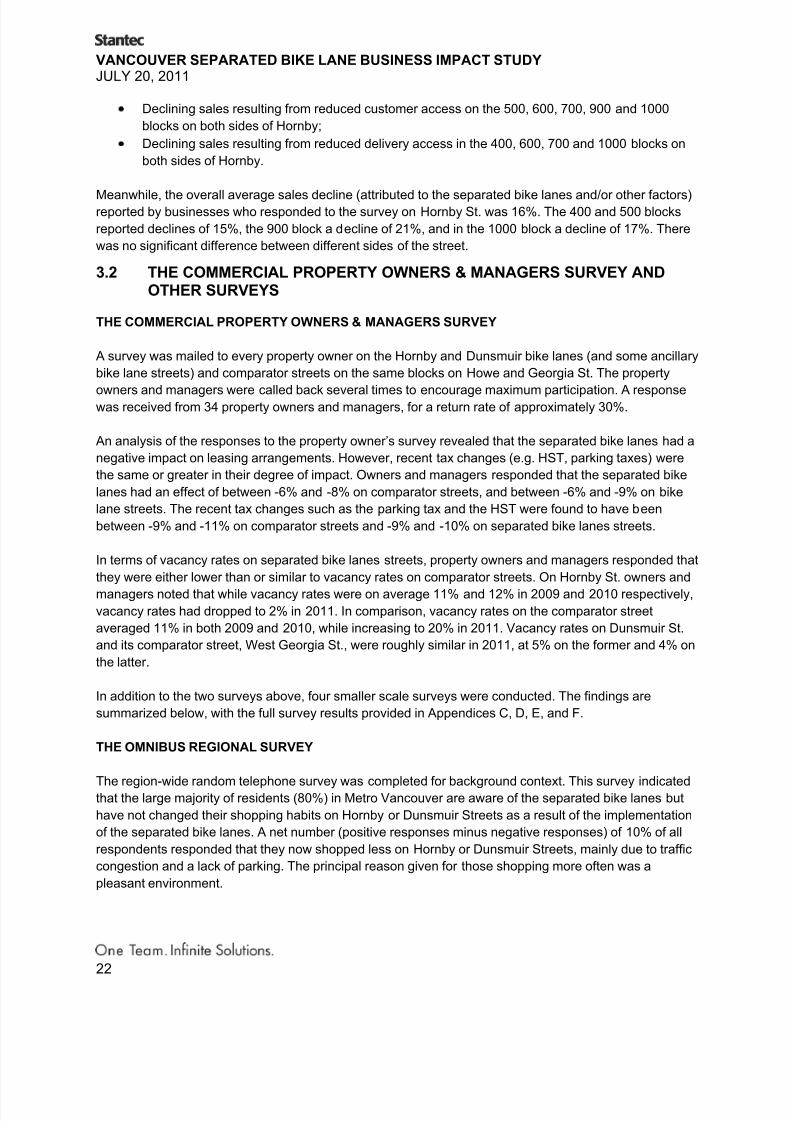
Figure 13 - All Customers - Frequency of Shopping and Business Patronization FollowingImplementation of Separated Bike Lanes
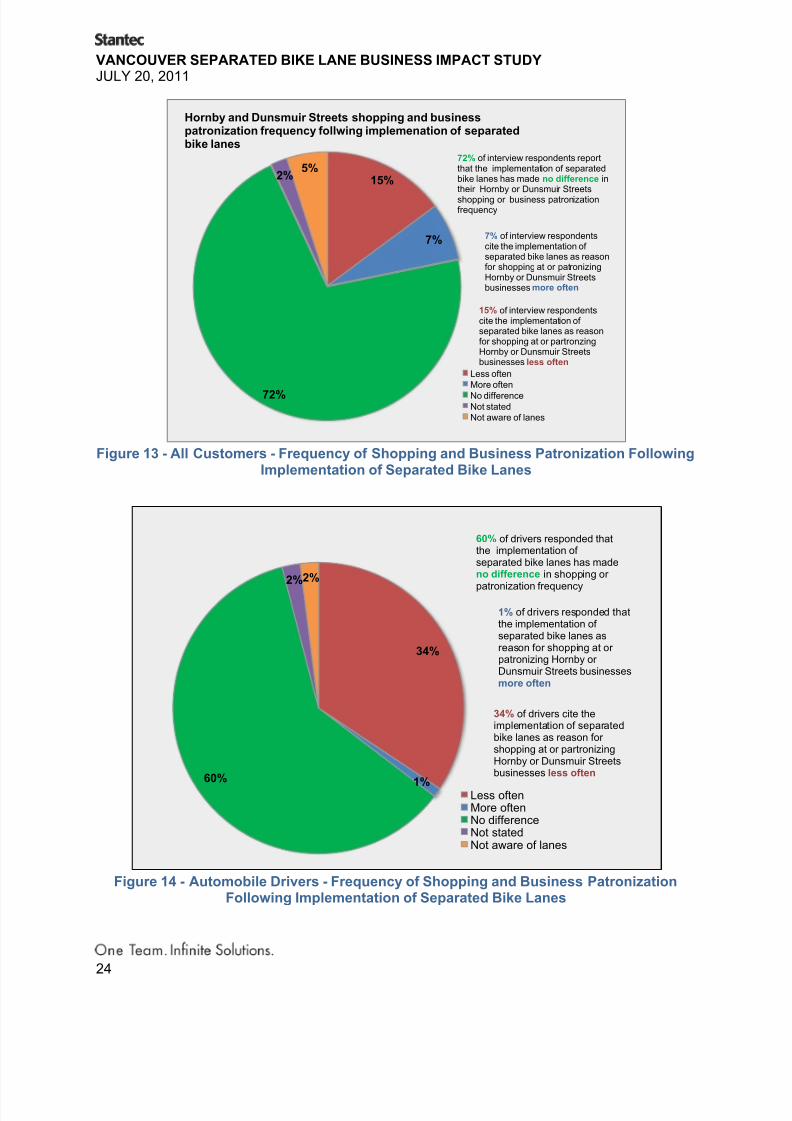
Figure 14 - Automobile Drivers - Frequency of Shopping and Business PatronizationFollowing Implementation of Separated Bike Lanes
15%
7%
72%
2%5%
Hornby and Dunsmuir Streets shopping and businesspatronization frequency follwing implemenation of separatedbike lanes
Less oftenMore often
No differenceNot statedNot aware of lanes
72% of interview respondents reportthat the implementation of separatedbike lanes has made no difference intheir Hornby or Dunsmuir Streets
shopping or business patronizationfrequency
7% of interview respondentscite the implementation of separated bike lanes as reasonfor shopping at or patronizingHornby or Dunsmuir Streetsbusinesses more often
15% of interview respondentscite the implementation of separated bike lanes as reasonfor shopping at or partronzingHornby or Dunsmuir Streetsbusinesses less often
34%
1%60%
2%2%
Less oftenMore oftenNo differenceNot statedNot aware of lanes
34% of drivers cite theimplementation of separatedbike lanes as reason for shopping at or partronizingHornby or Dunsmuir Streetsbusinesses less often
60% of drivers responded thatthe implementation of separated bike lanes has madeno difference in shopping or
patronization frequency
1% of drivers responded thatthe implementation of separated bike lanes asreason for shopping at or patronizing Hornby or Dunsmuir Streets businessesmore often
VANCOUVER SEPARATED BIKE LANE BUSINESS IMPACT STUDYJULY 20, 2011
25
Figure 15 – Usual Mode of Customer Transportation to Downtown: At-Grade BusinessResponses versus Customer Responses
Interestingly, the percentage of customers travelling downtown by automobile was estimated by at-grade
businesses to be roughly double the percentage determined by the customer surveys (Fig. 15). While
20% of customers reported that they drove downtown to shop or patronize businesses, at-grade
businesses estimated the percentage at 40%. As well, 42% of customers travelled downtown by public
transit, while businesses estimated the percentage to be only 25%. Finally, customers cycling downtownrepresented 8% of respondents, roughly double what was estimated by at-grade businesses. Thus, there
is a potential that issues such as the availability of parking and vehicle access to businesses may not
necessarily be as critical as other issues such as visibility, pedestrian access and environment, and
goods delivery.
OVERALL FINDINGS FROM SURVEYS
Some overall findings from the survey indicated the following:
Businesses on a street with a separated bike lane reported greater declines in sales than
businesses on parallel streets.
Businesses on Hornby St. reported greater negative impacts than Dunsmuir St.Convenience retail businesses reported greater negative impacts than other businesses
Businesses on the same side of the street as a bike lane reported greater negative impacts than
positive impacts.
3.3 COMMENTS FROM THE SURVEYS
There were a number of comments made about the separated bike lanes from a business perspective, a
non-business perspective, and from other perspectives (e.g. health benefits of increased cycling). As
VANCOUVER SEPARATED BIKE LANE BUSINESS IMPACT STUDYJULY 20, 2011
26
much of the report discusses the negative micro-economic impacts of the separated business lanes
based on survey responses from businesses, samples of verbatim comments from the surveys which
were supportive of the bike lanes are indicated below:
“These lanes are making it easier for me to convince my friends and family to ride downtown as well.
They make me feel like I can stop and use the shops and services without having to navigate car traffic to pull over, and I don't have to worry about being doored by parked car doors opening, so I get to look
around, enjoy my ride, and see what shops and activities are happening.”
“My partner and I both use the bike lanes to ride to and from our business each day and for deliveries and
pick ups. We value the protected bike lanes and use them in all weather, including rain, and at night. The
bike lanes were part of the reason we opened a retail store where we did, because we are cyclists and
wanted to be somewhere where we could ride safely to work each day. I really value the bike lanes and
appreciate them when I am carrying large packages on my bike.”
“Separated bike lanes have opened up a section of downtown that I used to avoid. Do more shopping
there now and use other services more frequently than I used to.”
“I have changed my commute and am now aware of businesses that I didn't know about before, but am
now likely to shop at.”
“The separated lanes encourage me to do more shopping downtown, rather than in my own
neighbourhood, as it is convenient to my workplace (I can go on my lunch break). I feel safer cycling
downtown and naturally shop at stores along the bike path as that is most convenient”.
“Since the separated lanes went in, my wife and I tend to use Hornby and Dunsmuir more regularly than
other streets. I also use businesses on or near these streets more frequently.”
“When I bike, I spend more time noticing the people and businesses around me. And, I am MORE likely to spend time and $$$ after work in downtown bars, shops and restaurants now that I bike on the bike
lanes, since parking is so expensive and the liquor laws so harsh...”
“I noted that I never stop and shop at places while I'm commuting in the separated bike lane -- that's b/c
I'm commuting. I've noticed businesses that I hadn't before (including signage and window ads) that have
made me return during non-commutes to shop there. I wonder how many drivers stop mid-commute to
shop.”
“The restrictions on Right turns onto Hornby make access for customers very difficult and deliveriesalmost impossible. The bike lanes have had a negative impact on leasing”
VANCOUVER SEPARATED BIKE LANE BUSINESS IMPACT STUDYJULY 20, 2011
28
As a general principle of retail business, the impact of a decline in sales is amplified and more of a
problem for weaker stores who can normally pay only their fixed costs, versus successful stores that can
easily meet their fixed costs and are focused only on increasing already strong profits. In general, based
upon market indications and their general rent levels, Hornby Street and Dunsmuir Street accommodate
stores that have average sales. The exceptions are a few blocks in the downtown core areas near
Robson Street and Granville Street. Thus, any negative economic impact resulting from the separatedbike lanes or other factors would be expected to be less in the stronger areas.
According to retail-leasing agents from CBRE, the separated bike lanes may have caused a decrease in
retail rental rates in the affected areas. They indicate that there is not yet evidence of a -5% or -10%
decline but the market has indicated that tenants feel that the separated bike lanes have generally
reduced the number of on-street parking stalls and negatively impacted the ease of access to store fronts
(e.g. created a physical barrier, perception of reduced safety, reduced visibility, and/or loss of prestige).
Having said that, as mentioned before, the rate of change in rental revenue cannot be confirmed at this
time and is therefore not used as a measure of impact in this analysis.
BLOCK FACES WITH RETAIL SPACE
The following table outlines those block faces which have a many grade-level
retail stores. In total there are 48 block faces, with 30 on sections of Hornby
Street with bike lanes and 18 on sections of Dunsmuir Street with bike lanes.
The 500 block of Seymour Street and 1300 block of Burrard are included in
the latter figure. Of these block faces, less than half (21 block faces) have
retail space.
It is reasonable to assume that the average retail space for each store is on
the order of 1,000 sq.ft. This is based on store depths of 66 feet with 15 feet of business store frontage.
Such an estimate would also correspond to a general and reasonable estimated average of 10,000 sq.ft.
of net retail – service space per city block face. Certainly most of the bike lane block face streets are not
continuous store fronts.
Table 3 - Block Faces with Significant Number of Grade-level Retail Stores
VANCOUVER SEPARATED BIKE LANE BUSINESS IMPACT STUDYJULY 20, 2011
29
1100 x 2 Hornby Street 600 x 2 Dunsmuir Street
1200 x 1 Hornby Street 700 x 0 Dunsmuir Street
1300 x 1 Hornby Street 800 x 2 Dunsmuir Street
THE GRADE-LEVEL BUSINESS ECONOMIC IMPACT MODEL
The business impact model applies industry standard sizes, rents and sales to those businesses that
responded to the survey. A reduction or increase in sales levels (in $) are calculated for these businesses
based on how they responded to the survey questions (e.g. a 10% increase or decrease in sales reported
by grade-level respondents was calculated in dollar amounts per year).
In order to establish average tenant sales, real estate consultants use the traditional „net rent to sales
ratio of 10%.‟ The average net rent per sq. ft. on the study corridors is on the order of $45 per sq. ft. This
means average sales of these types of merchants are approximately $450 per sq. ft. The average level of sales cannot be much higher than this or rents would be higher. This industry standard is used by The
International Council of Shopping Centres and by real estate valuation firms.12
The average net rent per sq. ft. along the study corridors is on the order of $45 per sq. ft. In addition, the
average size of each store has been assumed to be 1,000 sq. ft., which is a reasonable and conservative
assumption for downtown given the shortage of space and high land values.
The following model (Table 4) provides business impact data only for those businesses that responded to
the surveys (i.e. it does not include impacts for the two thirds of all tenants who did not respond) .This is a
low business impact scenario. The store counts and change in sales is derived from the survey and other
elements are based on industry standards and the market.
12 A typical source of this industry standard would be Moody‟s Rating Agency VP Andrea Daniels in her real estate article “A Guideto Occupancy Costs”
VANCOUVER SEPARATED BIKE LANE BUSINESS IMPACT STUDYJULY 20, 2011
32
responders. This survey group is not uniform, thus making the whole group the same as the responders
would overemphasize any possible impact.
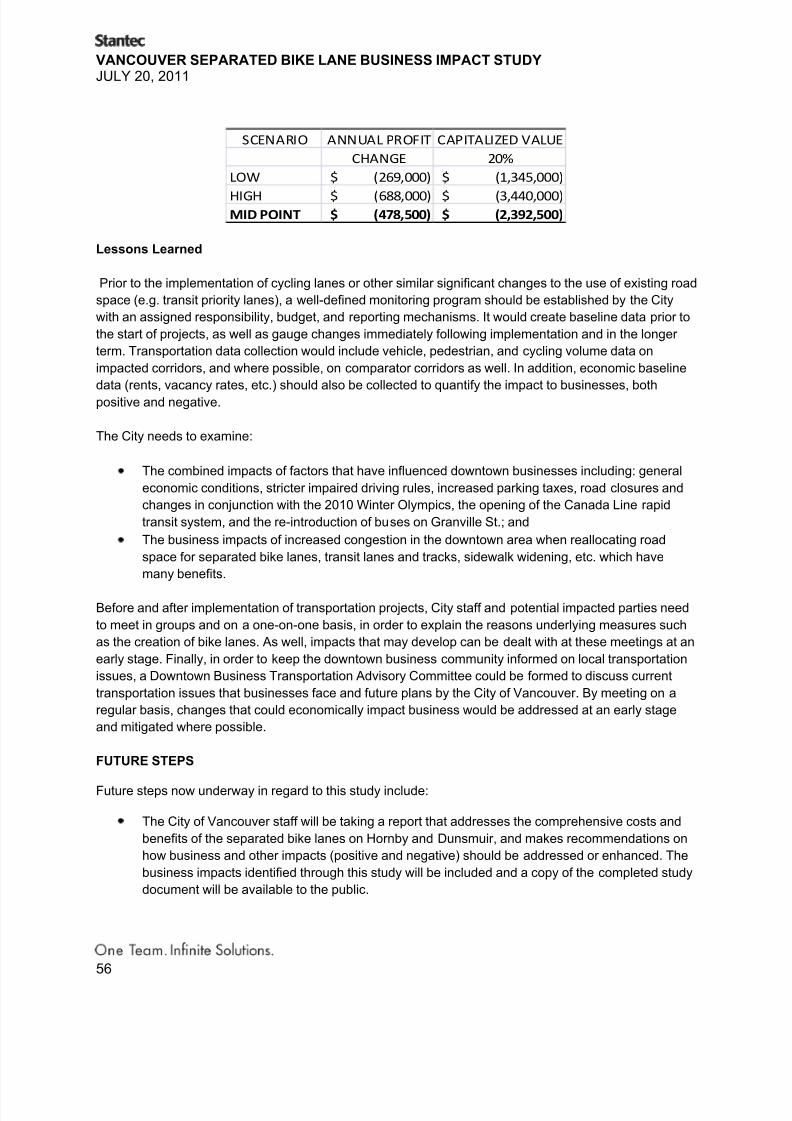
The following summarizes the impact scenarios in terms of high, low and midpoint. The high and low
scenarios are both extreme and thus the midpoint is the only reasonable estimate. In this analysis, the
cumulative impact is on the order of $2.4 million. This is relatively modest based on industry standardsand in general, insufficient to create persistent vacancies.
SCENARIO ANNUAL PROFIT CAPITALIZED VALUE
CHANGE 20%
LOW (269,000)$ (1,345,000)$
HIGH (688,000)$ (3,440,000)$
MID POINT (478,500)$ (2,392,500)$
Some businesses have been impacted significantly on some blocks on the separated bike lane system in
the downtown. However, the impact on the total downtown market has been modest and is expected to
become less and even minimal, over the next few years. This analysis assumes that mitigation strategiesare enacted. If they are not then the impact will extend to rents and property values, increasing the scale
and scope of the problem.
4.3 THE OFFICE TENANTS
The office tenancy information from leasing agents indicates that the market is strong and that demand
for office space in Vancouver is not being impacted by the installation of the separated bike lanes.
OFFICE BROKER INTERVIEW
In order to fully understand the impact of the separated bike lanes, senior office leasing agents at
Cushman and Wakefield were interviewed on their effects on office leasing and new office tower projects,
as well as the response from tenants on the lanes. The leasing agents noted that the separated bike
lanes have had no impact on actual office lease deals. As well, there has been no discussion of
separated bike lanes as part of tenant representation or building overview discussion, although some
smaller buildings with the bike lane at the front door have provided some negative feedback.
When asked about whether the separated bike lanes would enhance or hinder a new office tower project,
agents responded that the bike lanes could hinder a project if they affect access or egress to or from an
office lobby, detracts from curb appeal, or reduces access to parking for the retail component. Agents
anticipate that rents would climb by 5% in 2011, 5% in 2012, and another 5% in 2013. A number of firms
are considering their options for a new building in 2015.
In addition to the broker comments, the office tenant surveys have confirmed that any impact has been
mostly related to traffic delays where meeting and appointment times are being missed because visitors
are having additional trouble accessing downtown. It is expected that this modest impact will decline with
familiarity and ongoing changes to commuters travel patterns.
As mentioned before, this study does not consider issues such as the separated bike lanes encouraging
some employees to bike to work and the business impact of this on their health and possible less need of
VANCOUVER SEPARATED BIKE LANE BUSINESS IMPACT STUDYJULY 20, 2011
33
sick days. Such issues are valid but they amount to a small financial impact and their magnitude would be
impossible to calculate and would be beyond the scope of the study.
SPECIFIC IMPACT ON EXISTING OFFICE BUILDINGS
Every block of the separated bike lanes was carefully assessed as to changes in access and visibility.
The most important observations about office buildings and the separated bike lanes were:
Office buildings and office development sites located on corners or which have a large building
footprint typically have flexible access. The physical impact is not significant because they are
able to offer tenants and users multiple access options (different streets, dedicated loading,
parkade access etc.)
Specific and significant physical impact would therefore tend to be for smaller scale buildings, not
located on corners where bike lanes are immediately adjacent.
The inventory of the separated bike lane adjacent buildings revealed that the only office buildings
or sites that match these significant impact criteria are those located on the northeast corner of Hornby & Dunsmuir Streets. This area has been impacted more than any other because:
1. Both bike lanes intersect at this corner;
2. The right turn from Dunsmuir St. to Hornby St. has been eliminated;
3. Adjacent street parking stalls were eliminated; and
4. Direct vehicular and pedestrian access was impeded, even if slightly.
The building at 885 Dunsmuir St. is a ten-storey, 106,385 sq. ft. building dating from 1970. Although it is
on the corner, it is at the intersection of the two separated bike lanes and has them on both street
frontages. The building immediately north at 584 Hornby St. is a nine-storey, 54,055 sq. ft. building dating
from 1984. The buildings further north include a small parkade and several small scale buildings. This
portion of the city block could theoretically be consolidated into a larger scale office and mixed use
development at some time in the future.
CHANGES TO THE NORTHEAST CORNER OF DUNSMUIR AND HORNBY ST
According to the City of Vancouver, the following describes the curbside parking regulations adjacent to
these buildings:
Prior to June 2010, there were "No Stopping" regulations on the north and south sides of Dunsmuir St.
and a painted bike lane on the north side. The parking regulations have not changed. As such, Dunsmuir
St. access has not been impact significantly. Prior to December 2010, there were metered parking spaces
on the east side of Hornby St. between Dunsmuir and the lane (alley) north of Dunsmuir. North of the lanethere was a right turn lane and "No Stopping" regulations.
There were no loading or passenger zones and no opportunity to stop except in a vacant metered parking
space or illegally in front of the parking structure driveway, the lane (alley) or in the right turn lane. The
metered parking has now been removed. The conditions at the driveway and north of the lane are
effectively the same as before with respect to legal stopping. Illegal stopping is probably now less
attractive to some drivers as it would now block moving traffic.
VANCOUVER SEPARATED BIKE LANE BUSINESS IMPACT STUDYJULY 20, 2011
34
In summary, the major changes are restricted right turns, the removal of parking and the physical barrier
that the separated bike lanes have created. These are all material changes and in a weak office market
they would likely be sufficient to have a measurable impact on office rent. The office leasing and
investment market is expected to remain strong which reduces and mitigates business impact. However,
the degree of impact is not measureable. Despite the reduced accessibility, it is not possible to estimatean accurate business impact on this corner with its two small office buildings with retail at grade-level.
POTENTIAL NEW OFFICE BUILDING DEVELOPMENT SITES SPECIFIC IMPACT
Downtown Vancouver is currently one of the most valuable commercial real estate locations in North
America with approximately 214,944 sq. ft. being absorbed (leased or sold) in the first quarter of 2011.
Vacancy rates have also dropped from 4.6% to 3.7% over the same quarter. As demand is projected to
remain strong, new office developments are being proposed.
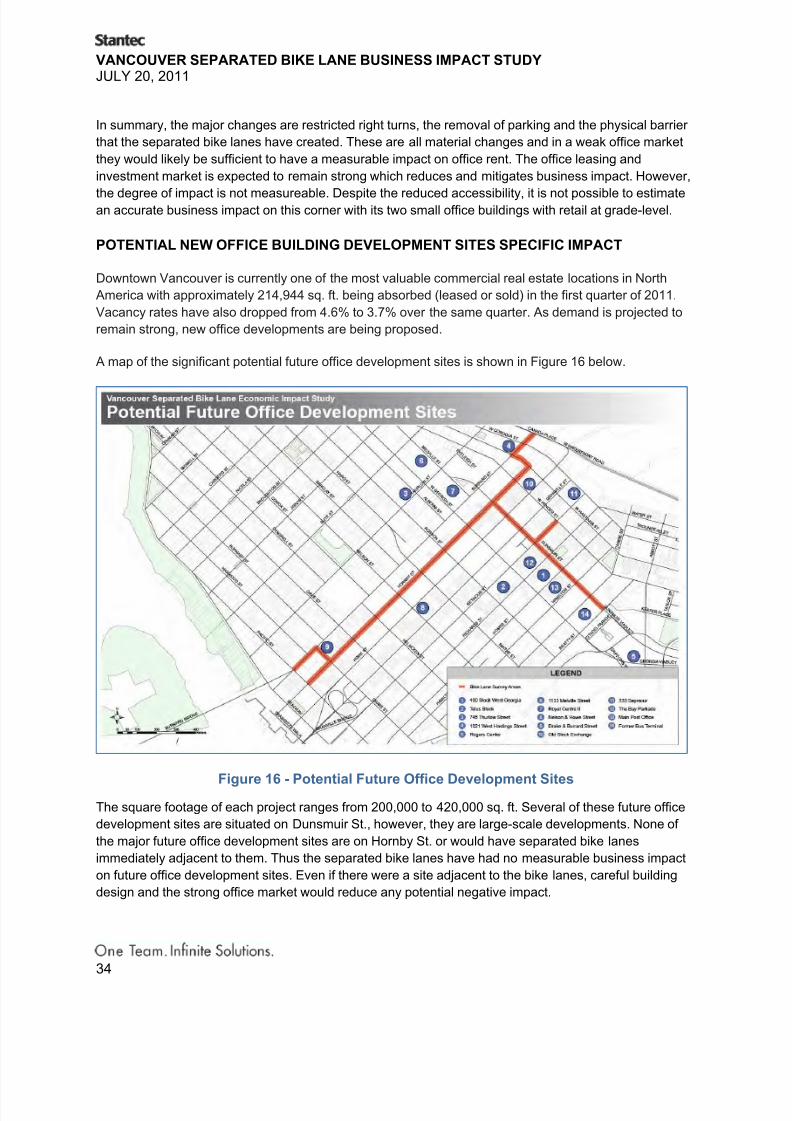
A map of the significant potential future office development sites is shown in Figure 16 below.
Figure 16 - Potential Future Office Development Sites The square footage of each project ranges from 200,000 to 420,000 sq. ft. Several of these future office
development sites are situated on Dunsmuir St., however, they are large-scale developments. None of
the major future office development sites are on Hornby St. or would have separated bike lanes
immediately adjacent to them. Thus the separated bike lanes have had no measurable business impact
on future office development sites. Even if there were a site adjacent to the bike lanes, careful building
design and the strong office market would reduce any potential negative impact.
VANCOUVER SEPARATED BIKE LANE BUSINESS IMPACT STUDYJULY 20, 2011
35
TRAFFIC CONGESTION AND OFFICE COMMUTERS
The business impact, if any, on the office market is not building specific and must therefore be focused on
the costs of congestion as well as changes in travel patterns in the CBD. The focus of the impact oncommuters is mainly on office tenants, rather than retail employees, since the primary impact for
commuters is during the morning peak commuter period which is often over before most retail stores are
open. The cost of traffic congestion is being treated in Vancouver ‟s broader report to Council on the total
impacts of the separated bike lanes in July 2011.
MEASURED TRAVEL TIME ON HORNBY ST.
Several days of travel time data has been collected by the City of Vancouver for Hornby St. at different
hours of the day before (during the months of September and October 2010) and after (during the months
of March and April 2011) the installation of the Hornby separated bike lane. An analysis of this information
shows the following:
Between Pacific and Davie: a minor delay of between 3 and 8 seconds
Between Davie and Robson: a minor delay at times between 3 and 14 seconds, while at other times
travel times have been reduced by 1 and 16 seconds
Between Robson and Georgia: little to no change
Between Georgia and Pender: no change or reduced travel time by 10 and 23 seconds
Between Pender and W. Hastings: a more significant delay of between 6 seconds and 1 minute
Thus, the total change in travel time for the Hornby corridor between Pacific and West Hastings has
ranged from a reduction of 5 seconds to an increase of one minute and 37 seconds, of which the latter is
equivalent to missing one traffic light. This change could have resulted from the implementation of the
bike lanes. However, as travel time data was only collected for a few days at a time, this change couldhave also simply reflected the natural variability that occurs between different days and time of the year,
or other construction projects and lane closures in the downtown core. To determine if these measured
travel times actually reflect reduced or increased travel delays for commuters, more data could be
collected.
The following maps graphically illustrate the measured average change in travel time for different
segments of Hornby St. during the peak morning and afternoon hours.
VANCOUVER SEPARATED BIKE LANE BUSINESS IMPACT STUDYJULY 20, 2011
37
Data was also collected for February 2011, but this data was analyzed separately to see if there was any
seasonal variation. Overall the changes seemed similar to March and April 2011.
Perceived Travel Time on Hornby
Meanwhile, when examining the upper floor employee‟s survey, the results show that the perception isthat commute travel time has increased on average by 5 minutes as a result of the Hornby separated bike
lane. While this is greater than the measured change in travel time noted above, studies have shown that
perceived travel time can greatly vary from objectively measured clock time.13 As a person‟s sense of
comfort and security is reduced, perceived time tends to increase. Congestion and lower commute
reliability also tends to increase perceived time. Additionally, other factors within Downtown or outside
Downtown (e.g. road construction) could impact employees‟ travel time. Thus, as mentioned before,
additional data should be collected to objectively determine what, if any, is the change in commute time
as a result of the separated bike lane.
Given these limitations with the available travel time data, along with the fact that there are economic
benefits and costs associated with longer commute times that are difficult to quantify and the valuation of
travel time depends on the user, trip purpose, and travel conditions, this study is unable to apply amonetary cost to the change in commute travel time along Hornby St.
14As mentioned before, however,
congestion is being addressed in other studies the City of Vancouver is conducting.
4.4 THE PROPERTY OWNERS
The value of real estate is based upon its potential to generate revenue. The source of revenue for
property owners is the rental stream from retail, office, hotel, or residential tenants. As such, the financial
and business impact on tenants is actually a mirror of the impact on owners.
This analysis has elected to express the business impact of sales declines, in terms of the tenants. The
business impact is relatively modest in scale and under no circumstances is any commercial space going
to become persistently vacant in downtown Vancouver. If the separated bike lanes remain and drivers
become used to them, there will be little or no adjustment in rent and the bike lane impact is expected to
decline over the next five years.
In addition to assessing the potential business impact on existing buildings and tenants, there is also a
consideration for future office buildings. After an assessment of each block face was completed, it
became clear that the separated bike lanes would have no impact on future office residential or retail
development potential in 31 out of the total 36 block faces. These are summarized in Appendix A. In
general, most of the sites are already either built out, are so large as to be able to compensate for any
changes in traffic patterns, are located on a corner, or have residential uses proposed for them.
13 Yuen-wah Li (2003), “Evaluating the Urban Commute Experience: A Time Perception Approach,” Journal of Public Transportation, Vol. 6, No. 4, pp. 41-67. Accessed on June 15, 2011 from www.nctr.usf.edu/jpt/pdf/JPT%206-4%20Li.pdf 14 Litman, T. Transportation Cost and Benefit Analysis II – Travel Time Costs. Accessed on June 16, 2011 fromhttp://www.vtpi.org/tca/tca0502.pdf
VANCOUVER SEPARATED BIKE LANE BUSINESS IMPACT STUDYJULY 20, 2011
38
Table 6 - Blocks with Potential Impact from Bike Lanes on Development
500 Dunsmuir St. 1. Ground level retail strip with second level.
Odd 2. Heritage buildings and small sites with minimal density potential. Moderate development impact.
600 Dunsmuir St. 1. Mid-rise hotel, high-rise tower, hotel, restaurants, and a coffee shop.
Odd 2. Road narrows to 3 lanes. Hotel site redevelopment moderate impact, but corner site.600 Dunsmuir St. 1 . Mid-rise office building. Mid-rise educational building, fast food restaurants.
Even 2. Small scale impact on Granville corner site redevelopment potential due to poor access.
800 Dunsmuir St. 1. Mid-rise office buildings with some retail and a coffee shop. Long-term redevelopment potential.
Odd 2. Significant impact on Dunsmuir & Hornby corner, as design cannot improve access,
with bike lanes on two sides.
500 Hornby St. 1. Mid-rise office buildings (3) and a parkade, with a coffee shop, fast food restaurants,
Even clothing stores and financial services.
2. Moderate impact on development potential of parkade and Dunsmuir corner. Potential for rezoning.
Out of the 36 block faces, only the 5 shown above may see a modest to significant impact from the
separated bike lanes. Four of them are on Dunsmuir St. and only one is on Hornby St. It should be noted
that by the time future development proposals are launched in the years to come, many other changesmay happen in the surrounding area that could affect development potential besides the separated bike
lanes. There is no certain measure of business impact on development potential, and as such, the owner
group is not impacted in a measurable way other than some tenants who have reported reduced sales.
VANCOUVER SEPARATED BIKE LANE BUSINESS IMPACT STUDYJULY 20, 2011
41
Table 7 - Hot Spot Blocks
Level of Impact Reported byGrade-level Businesses on
Impacted Corridors (Q. 15 of Grade-Level Business Survey)
Level of Impact Reported by PropertyOwners on Impacted Corridors (Q. 15 of
Property Owner Survey)
Street Block
P a r k i n g
V i s i b i l i t y
C u s t o m e r
A c c e s s
D e l i v e r i e s
N a v i g a t i n g
S t r e e t s *
P a r k i n g
V i s i b i l i t y
C u s t o m e r
A c c e s s
D e l i v e r i e s
P a s s e n g e r
L o a d i n g *
T r a f f i c
F l o w *
600 Dunsmuir xxx xx xxx xxx - x - xxx xxx xxx -
400 Hornby xxx - x xxx - x x xxx xxx - xxx
500 Hornby xxx x xx x x x xxx xxx xxx - -
600 Hornby xxx - x - - - - - - - -
1000 Hornby xxx x xxx xxx - x x x x - -
*impact was provided by respondent
Legend
xxx Very negative impact
xx Between little negative and very negative impact
x Little negative impact
- No response or no impact
4.6 HOTELS
The hotel industry requires convenient safe and attractive access. There are a significant number of hotels on the separated bike lanes, however only one hotel responded to the survey. This may be
because only this one hotel has experienced some form of negative business impact, or that the
mitigation measures that the City of Vancouver has implemented for a number of hotels located on
streets with separated bike lanes have been successful. These measures mainly involved changes in the
location of loading and passenger zones.
4.7 LIMITATIONS OF DATA USED IN STUDY
There are a number of limitations in this study, which include the following:
i) It would have been ideal to create a business impact survey prior to the construction of the
separated bike lanes in order to create benchmarks/baseline for the separated bike lanes andcomparator streets that would be monitored over time.
ii) The business impacts of the separated bike lanes, both positive and negative, should be
viewed as preliminary and a one-time investigation of the short term business impacts. It may
take years for the impact to become clear and definitive. It is too early to know the full
business effects of the separated bike lanes. As with any major infrastructure change in a city
there is normal adjustment period. Impacts may continue to be felt in the coming months but
will likely decline in future years as the City addresses the blocks where the impacts are
VANCOUVER SEPARATED BIKE LANE BUSINESS IMPACT STUDYJULY 20, 2011
42
highest, with mitigation measures for parking, loading zones, turn restrictions and
visibility/access issues. As well, it takes business customers time to adapt. This process has
already been started, with City representatives meeting these above-noted businesses to
address these issues.
iii) Although comparator streets were used to try to separate out the business impact of the
separated bike lanes, there is very likely some residual effect in the responses from other
potential factors impacting business losses or gains, in terms of sales, for downtown
businesses in the City of Vancouver.
These factors include:
The 2008-2009 economic downturn in Canada;
Increased parking rates due to the introduction of the HST in July 2010 and the 14% tax increase
for off-street paid parking implemented by TransLink;
Road closures and access changes due to the 2010 Winter Olympics;
The opening of the Canada Line rapid transit system in August 2009;
The fuel tax increase of January 201015;Downtown construction that has affected traffic patterns
Filming activity in the downtown core;
The re-introduction of buses on Granville St.; and
Stricter impaired driving rules.
In regard to the downturn in the economy between 2008 and 2009, this was very much felt in Metro
Vancouver and downtown Vancouver, and a partial recovery only started in 2010. The grade-level
business survey indicated that the business impacts contributed by the tax changes and the general
economic downturn were also ranked almost as highly as the separated bike lanes as key factors
decreasing business sales
iv) The analysis of the business impacts of the separated bike lanes had to rely on individual
responses of businesses to the surveys and their best estimates of the impacts of the
separated bike lanes in the surveys, in terms of changes in sales. This information is
somewhat biased in that the responses were self- selecting, and not a random sample that
would provide the greatest level of accuracy. As well, minimal hard sales data was received
from the businesses. Although this data indicated that estimated loss in sales was not as high
as reported, the responses by businesses have to be taken at their word. Perception in the
business market is reality.
v) It should be noted that this study is limited to quantifying the business impacts of the
separated bike lanes. It does not measure the macroeconomic or other related impacts of the
separated bike lanes, which include the implications on the health of residents and
employees, the health of the environment, shift to travel modes which are more sustainable,
and the City‟s image and international reputation. Some of these issues have been raised by
stakeholders in their survey and e-mail comments, which are summarized in the Appendices.
Transportation metrics will be addressed in a City staff report to Council in July 2011.
15
In January, 2010 the fuel tax levied by TransLink increased from 12 cents to 15 cents per litre, resulting in an increase of the totalprovincial motor fuel tax from 23.5 cents to 24 cents per litre. Source:http://www.sbr.gov.bc.ca/documents_library/notices/Notice_of_Fuel_Tax_Changes_and_Inventory_Requirements.pdf
VANCOUVER SEPARATED BIKE LANE BUSINESS IMPACT STUDYJULY 20, 2011
44
This segment of the separated bike lanes is relatively little used compared to other segments, since many
cyclists appear to reach their destinations prior to reaching this block. The block might be a candidate for
a design that allows for seasonal variation by installing flexible reflective poles to delineate the lane
marker separating the curb lane from the centre lane. The segment could be designated an exclusive
bike lane in the summer months and used as a shared lane for the rest of the year. Another option would
be to use automatic bollards that can be raised and lowered to establish a separated bike lane when
necessary.
5.1.2 500 Block Hornby (Between Pender and Dunsmuir)
The 500 block of Hornby has lost 10 parking spaces along the length of the east (right if moving in the
direction of traffic) side of the block where the bike lane was constructed and 6 spaces on the opposite
side of the street. Right turns for vehicles from Dunsmuir onto Hornby are now prohibited. The
combination of reduced parking and vehicle access may be responsible for the negative impacts the bike
lanes are having on businesses in this block.
One solution for the parking issue might be for the Diamond Parking lot on the east side of the block at
550 Hornby to offer short-term metered parking on the ground level for customers of businesses in the
500 block of Hornby St. to make up for a lack of on-street parking on this side. Not only would this help
businesses, it would also provide an additional revenue stream to this parking facility. As well, signage on
Hornby St. directing potential customers to the nearest parking structure could be put in place. This would
also help to get drivers in the habit of using parking structures rather than looking for on-street parking.
There is an issue here and elsewhere with vehicle access and egress to parking garages and laneways
(e.g. the 800 block of Hornby St. where the parking garage exit ramp is located close to the intersection of
Robson and Hornby Streets, creating a congestion issue as vehicles wait for a break in pedestrian,
cyclist, and vehicle traffic in order to merge onto the street). To cross the two-way separated bike lanes,vehicles often need to edge into the lanes and in order to see oncoming traffic and then merge into the
nearest lane. This creates a conflict zone with cyclists as well as a potential safety hazard. Mitigation
strategies that could ease the situation include warning lights to alert cyclists and pedestrians as well as
mirrors so that drivers can see oncoming traffic.
The 500 block also has an issue with traffic entering Hornby St. from three separate laneways. It would
be worthwhile to monitor signal timing at the intersection of Hornby and Pender to ensure that there is
enough time for vehicles to clear the block so that congestion is minimized, especially during rush hours.
Figure 21 – 500 Hornby St. Before and After Separated Bike Lanes
VANCOUVER SEPARATED BIKE LANE BUSINESS IMPACT STUDYJULY 20, 2011
45
As well, reintroducing the ability to turn right onto Hornby St. northbound from Dunsmuir might be
considered to improve egress from Dunsmuir block and access to the businesses on Hornby. However,
one risk is that additional congestion may result due to cars waiting to turn right. It may also be hazardous
to cyclists who are familiar with right turn restrictions at other intersections.
5.1.3 600 Block Hornby (Between W. Georgia and Dunsmuir)
To construct the separated bike lanes on the 600 block of Hornby, parking spaces were taken out on both
sides of the street. As well, right turns are no longer permitted onto Hornby St. from West Georgia St. on
a red light. However, a protected right turn signal phase has been introduced. Left turns onto Hornby St.
from West Georgia St. have always been illegal between 7am and 6pm. While this block was formerly
used for tour bus drop-offs, it no longer serves this function.
Additional signage on Hornby St. directing potential customers to the nearest parking structure, combinedwith a parking space counting system that informs them of the remaining number of spaces available,could be put in place to alleviate the demand for on-street parking.
5.1.4 1000 Block Hornby (between Helmcken and Nelson)
The 1000 block of Hornby St. had 11 on-street parking spaces removed to construct the separated bike
lanes. Parking is still permitted on the east side of the street, but the bike lane now runs between the curb
Figure 22 – 600 Hornby St. Before and After Separated Bike Lanes
Figure 23 - 1000 Hornby St. Before and After Separated Bike Lanes
VANCOUVER SEPARATED BIKE LANE BUSINESS IMPACT STUDYJULY 20, 2011
46
and the parking spaces. While this preserves parking, it means that drivers who park along the block
have to cross the bike lane to reach the sidewalk. As well, no right turns for vehicles from Helmcken St.
onto Hornby St. on red are permitted. The combination of reduced on-street parking and changing vehicle
access on the east side of the street may be causing negative impacts to businesses. The number of
loading spaces did not change.
Signage on Hornby St. directing potential customers to the nearest parking structure could be put in
place. One issue is that charges in parking structures are higher than for on-street parking, dissuading
people from using them. A long-term strategy to eventually charge similar hourly rates for on-street
parking as for parking garages would help to increase turnover of on-street parking spaces and make
better use of parking garages.
5.1.5 600 Block Dunsmuir (Between Seymour and Granville)
It is recommended that businesses on these two blocks be allotted designated parking spots in the
nearest off-street parking structure so that some parking demands for businesses on these streets are
alleviated. Painted markings on the asphalt on the south side of the street indicating a loading zone would
make it clearer that this lane is indeed used for loading, at least for part of the day.
A right-turn restriction has been added for vehicles turning right from Dunsmuir northbound onto
Seymour, and this may impact access to the 600 block of Dunsmuir if customers of businesses on this
block were turning right onto Seymour to access on-street parking. Reintroducing the ability to turn right
would improve egress from this block and access to the businesses. With such a change, the City would
need to be careful to clearly mark these changes, since cyclists will be familiar with right turn restrictions
at other intersections.
The 600 block of Dunsmuir did not have on-street parking prior to the installation of the separated bikelanes, but parking and loading space has been an ongoing issue. Parking regulations on the south (left if
moving in the direction of traffic) side of the street did not change after the implementation of the
separated bike lanes, but the fact that there are now only two lanes of vehicle traffic due to the addition of
the separated bike lane means that traffic must funnel into one lane when vehicles are unloading in the
far left lane. On the north side of the street, a painted bike lane was located adjacent to the sidewalk prior
to the implementation of the separated bike lane. It is possible that drivers had previously stopped illegally
in the bike lane to access some of the businesses on the north side of the street.
Figure 24 - 600 Dunsmuir St. Before and After Separated Bike Lanes
VANCOUVER SEPARATED BIKE LANE BUSINESS IMPACT STUDYJULY 20, 2011
53
7.0 Conclusions and Future Steps
The purpose of this study was to:
i) Assess the business impacts of the two separated bicycle lanes created in downtown Vancouver,
and specifically, the range of changes in annual business sales and profits since the lanes were
opened; and
ii) Identify the hot spots along the separate bicycle lanes (blocks where the business impacts
caused by loss of parking, reduced visibility, reduced access by new intersection turning
restrictions and/or changes to loading zones were the greatest) and suggest mitigation measures
to reduce or eliminate these issues.
The study was not intended to examine the broader economic benefits of separated bicycle lanes interms of increased mode share by bicycles or the related health, environmental and other benefits. As
well, it was also not intended to review the impacts of additional traffic congestion. These areas and many
other impacts of the bike lanes will be addressed in a comprehensive report to be presented by
Vancouver staff at a council meeting in July 2011.
The business impacts were determined by six surveys of stakeholders (i.e., businesses owners,
commercial property owners & managers, office employees, and customers along corridors and in the
rest of Metro Vancouver). Business owners were interviewed along the bike lane corridors and on
adjacent comparator corridors in close proximity and with similar business types - Howe St. for Hornby
and West Georgia St for Dunsmuir - to try to eliminate, as much as possible, the impact that other factors
have had businesses before and after the implementation of the bike lanes. Other information for the
study was obtained from the following sources:Follow-up interviews of businesses that indicated they had experienced negative impacts from
the bicycle lanes;
Feedback from workshop held in May 2011 to hear concerns about the bicycle lanes to which
impacted business along Hornby and Dunsmuir were invited; and
Emails from businesses sent to the consultant representatives.
Results
Grade-level Businesses Survey: This survey was the main source of useful business data for this
study. An analysis of responses received from 32% of the survey area businesses revealed the following:
In 2011, the total percentage change in annual sales from the previous year as indicated by survey
respondents was:
A: Hornby St. -11%
B: Howe St. (comparator to Hornby St.) -1%
C: Dunsmuir St. -2%
D: West Georgia St. (comparator to Dunsmuir St.) 2%
VANCOUVER SEPARATED BIKE LANE BUSINESS IMPACT STUDYJULY 20, 2011
54
In 2011, the net impact on sales that was attributed to the bike lanes among those who responded
was:
Hornby St.: -10% (Difference between A and B above)
Dunsmuir St.: -4% (Difference between C and D above)
These numbers represent the high end of the range of business impacts and have been used to
estimate the overall business impacts. Despite the use of comparator lanes to eliminate the impact of
the numerous policy changes, there may still be some residual impact from these factors in the data.
The business impacts were greater on the bike lane side of both streets were greater than on the side
without the lanes.
The largest sales declines reported by respondents on Hornby St. between 2010 and 2011 were
experienced along the 500, 600, 900 and 1000 blocks, while on Dunsmuir St. the 600 block noted the
greatest decline.
The financial impact of the bike lanes has been a loss of sales and a loss of profit. The total loss in
sales is estimated at $2.4 million over a year. Assuming profit is approximately 20% of sales, the
estimated annual loss in profit over a year would be about $480,000. This is relatively moderate
based on industry standards and, in general, insufficient to create persistent vacancies. Thedowntown is and will remain vibrant and the moderate negative impact of the lanes will diminish over
time as long as mitigation strategies take effect.
Commercial Property Owners and Property Managers Survey: The responses from 30% of property
owners and managers in the survey area indicated little difference in reported impacts between streets
with separated bike lanes and comparator streets:
Separated bike lanes were associated with an estimated loss of sales in the range 6-9% on both
streets with separated bike lanes and comparator streets
Parking tax changes and the HST were associated with an estimated loss of sales of between 9%
and 11% on both streets with separated bike lanes and comparator streets2011 vacancy rates were about the same on Dunsmuir Street and its comparator, West Georgia
Street. Vacancy rates dropped on Hornby Street during 2011, while rising on its comparator, Howe
Street
Customer Exit Survey: The analysis of a random sidewalk survey of 768 customers exiting businesses
on Dunsmuir and Hornby Streets revealed the following:
79% of respondents on Dunsmuir St. and 76% of respondents on Hornby St. had not changed their
shopping patterns as a result of the separated bike lanes. Of those who had changed their shopping
patterns, the net change (% shopping more minus % shopping less) reported was 11% shopping less
on Hornby St. and 3% shopping less on Dunsmuir St.
Factors that led to shopping less included increased traffic congestion, less parking, turning
restrictions, and reduced pedestrian safety.
Factors that led to shopping more included easier bike access, a safer environment for cyclists, a
more pleasant environment for cyclists and pedestrians, and easier access.
20% of customers on Hornby and Dunsmuir Streets arrived by automobile, compared with 42% by
public transit, 32% on foot, and about 8% by bike. Among automobile drivers, the group most likely to
be affected by the changes road use and traffic patterns for the separated bike lanes, 60% had not
changed their habits, while 34% were shopping less often and 1% shopping more often.