Page 1
VANET: Evaluating Smart Parking Performance in a Dublin Scenario
by
Wesley Fung
Dissertation
Presented to the
University of Dublin, Trinity College
in fulfilment
of the requirements
for the Degree of
Master in Computer Science
University of Dublin, Trinity College
Supervisor: Siobhan Clarke
May 2017
Page 2
Declaration of Authorship
I, Wesley Fung, declare that the following dissertation, except where otherwise stated, is entirely
my own work; that it has not previously been submitted as an exercise for a degree, either in Trinity
College Dublin, or in any other University; and that the library may lend or copy it or any part thereof
on request.
Wesley Fung
May 17, 2017
i
Page 3
Summary
This dissertation focuses on evaluating Vehicular Ad-Hoc Networking (VANET) in Dublin. More
specifically, the goal is to investigate whether VANET can assist with the dissemination of parking
data within a small scale city like Dublin. Parking data allows drivers know where vacant parking
spaces are at any given time. However, there are potential problems regarding making parking space
information public. One of the central concepts for the introduction of smart parking systems is to
minimise traffic congestion within an urban area. By making the parking information public, it does
not guarantee that traffic congestion and traffic emissions would decrease. Drivers may run into sce-
narios where they are en-route to a vacant parking spot, only to find that space has been taken seconds
before they arrive. There is a need for a system that oversees the parking spaces, coordinates with
cars, roadside units, or other traffic systems to take advantage of the real-time parking data fully.
Smart parking may be broken down into two distinct areas. One being the utilisation of sensors to
locate parking space occupancies. And the other is the dissemination of the sensed parking data to
the relevant users. While the dissertation focuses on the dissemination of data within Dublin, various
sensory techniques will also be explored.
While VANET has been around since the early 2000s, vehicular networking has not been put into
practice until now. With the roll-out of autonomous vehicles worldwide, one of the next steps for full
vehicular automation is to allow cars be aware of parking spaces in their nearby area. Various research
proposals have been explored to capture parking space vacancies. Using parking sensors located on
every parking spot is the most straightforward solution. However, the cost of deployment is by far
the highest of all the considerable options. Other solutions include utilising city-wide Closed Cir-
cuit Television (CCTV) for detection of parking vacancies, while others have explored utilising laser
range-finders on taxis circling the city to detect spaces. This dissertation includes a current state of
ii
Page 4
the art of the various parking sensing technology to date. Additionally, the dissemination of parking
data has also been discussed by several researchers. These include considerations for VANET based
models, while others have explored more centralised versions of parking data administration; where
one single system coordinates parking information to all drivers. In larger cities, parking information
dissemination may be distributed into districts, each district managing its set of parking spaces and
notifying the relevant users when spaces become available within their respective vicinity.
The goal of this dissertation is to evaluate VANET integration with smart parking facilities.
The solution involves simulation of the Dublin road network with Vehicles in Network Simula-
tion (VEINS). This software package couples Simulation of Urban MObility (SUMO), a microscopic
traffic simulator, and Objective Modular Network Testbed in C++ (OMNeT++), a discrete event sim-
ulator. Dublin traffic volumes and parking data will be factored into the evaluation process to provide
a realistic simulator model.
The metrics used are the number of drivers that had to defer to alternate parking areas due to
the parking area being fully occupied. Additional evaluation metrics are the emissions of vehicles
in each evaluation, comparing if there are any significant differences in the environmental pollution
from vehicles between all the scenarios.
iii
Page 5
VANET: Evaluating Smart Parking Performance in a Dublin Scenario
Wesley Fung, Master in Computer Science
University of Dublin, Trinity College, 2017
Supervisor: Siobhan Clarke
Traffic congestions and pollution is a major issue in many cities worldwide. Drivers cruising forparking spaces contribute heavily to these issues. For this reason, many researchers have performedstudies on the topic of smart parking, as well as VANET. With the introduction of smart parking,drivers can know where vacant parking spaces are. However, as an argument proposed by this dis-sertation, the surfacing of parking space information is not enough. Simply by knowing a parkingspot is vacant does not guarantee any driver a parking spot. A solution must be found to minimise thechances of a driver arriving at a parking spot that became occupied minutes beforehand.
VANET is a technology that supports inter-vehicular communications. VANET technologies al-low vehicles to communicate with other vehicles to ensure driver safety. As well as this, vehiclesmay relay information to Road Side Unit (RSU) for traffic light coordinate as well as traffic queuemanagement. This work is concerned with the integration of a smart parking system supported byVANET.
Dublin City is the domain of interest in this dissertation. For this reason, Dublin City-specificdata is acquired from various sources. The data is used in the simulation to build a realistic viewon the current parking behaviours of Dublin City. This work is concerned with using a simulationsoftware to build a VANET smart parking system evaluated on Dublin City. Vehicles communicatewith each other regarding parking space occupancies and vacancies. This involves the integration ofDublin specific traffic and parking data into the simulation.
The evaluation process involves comparing a baseline model to the VANET model as describedabove. The evaluation results show that VANET smart parking model minimises the amount of emis-sions produced. As well as this, a VANET smart parking model minimises the chances of driversarriving at parking spots that are occupied minutes beforehand.
Page 6
Acknowledgements
I would like to thank the following people for their continuous support, patience and time throughout
the course.
• My academic supervisor Prof. Siobhan Clarke for her knowledge, expertise and help through-
out the year.
• My family for their continued support throughout my entire college career.
• My classmates in Integrated Computer Science for their continuous motivation.
• Dublin City Council staff for providing the required traffic data.
• ParkingTag staff for providing the required parking data.
• Dr. Christopher Sommer of VEINS for assisting me on questions I had about VANET simula-
tion modelling in VEINS.
• Simulation of Urban MObility (SUMO) staff for answering my questions regarding SUMO.
WESLEY FUNG
University of Dublin, Trinity College
May 2017
v
Page 7
Contents
Declaration of Authorship i
Summary ii
Abstract iv
Acknowledgements v
List of Tables ix
List of Figures x
List of Acronyms xi
1 Introduction 11.1 Motivation . . . . . . . . . . . . . . . . . . . . . . . . . . . . . . . . . . . . . . . . 1
1.2 Research Question . . . . . . . . . . . . . . . . . . . . . . . . . . . . . . . . . . . 2
1.3 Research Objectives . . . . . . . . . . . . . . . . . . . . . . . . . . . . . . . . . . . 2
1.4 Research Challenges . . . . . . . . . . . . . . . . . . . . . . . . . . . . . . . . . . 3
1.5 Organisation . . . . . . . . . . . . . . . . . . . . . . . . . . . . . . . . . . . . . . . 4
2 State of the Art 62.1 Background . . . . . . . . . . . . . . . . . . . . . . . . . . . . . . . . . . . . . . . 6
2.2 Smart Parking . . . . . . . . . . . . . . . . . . . . . . . . . . . . . . . . . . . . . . 7
2.2.1 Parking Data Sensing . . . . . . . . . . . . . . . . . . . . . . . . . . . . . . 7
2.2.2 Parking Data Dissemination . . . . . . . . . . . . . . . . . . . . . . . . . . 16
2.3 Vehicle Networking . . . . . . . . . . . . . . . . . . . . . . . . . . . . . . . . . . . 19
2.3.1 Vehicle Ad-Hoc Networking (VANET) . . . . . . . . . . . . . . . . . . . . 19
2.3.2 Vehicular Cloud Computing (VCC) . . . . . . . . . . . . . . . . . . . . . . 20
2.4 Security . . . . . . . . . . . . . . . . . . . . . . . . . . . . . . . . . . . . . . . . . 21
2.4.1 802.11p . . . . . . . . . . . . . . . . . . . . . . . . . . . . . . . . . . . . . 21
vi
Page 8
2.5 Alternative Smart Parking Models . . . . . . . . . . . . . . . . . . . . . . . . . . . 22
2.6 Real World Examples . . . . . . . . . . . . . . . . . . . . . . . . . . . . . . . . . . 23
3 Design 253.1 Software . . . . . . . . . . . . . . . . . . . . . . . . . . . . . . . . . . . . . . . . . 25
3.1.1 SUMO . . . . . . . . . . . . . . . . . . . . . . . . . . . . . . . . . . . . . 25
3.1.2 OMNeT++ . . . . . . . . . . . . . . . . . . . . . . . . . . . . . . . . . . . 27
3.1.3 VEINS . . . . . . . . . . . . . . . . . . . . . . . . . . . . . . . . . . . . . 27
3.1.4 Conclusion . . . . . . . . . . . . . . . . . . . . . . . . . . . . . . . . . . . 27
3.2 Data . . . . . . . . . . . . . . . . . . . . . . . . . . . . . . . . . . . . . . . . . . . 28
3.2.1 Dublin City Parking Information . . . . . . . . . . . . . . . . . . . . . . . . 28
3.2.2 Dublin Traffic Flows . . . . . . . . . . . . . . . . . . . . . . . . . . . . . . 31
3.2.3 Dublin Parking Lot Data . . . . . . . . . . . . . . . . . . . . . . . . . . . . 32
3.2.4 Dublin On-Street Parking Data . . . . . . . . . . . . . . . . . . . . . . . . . 32
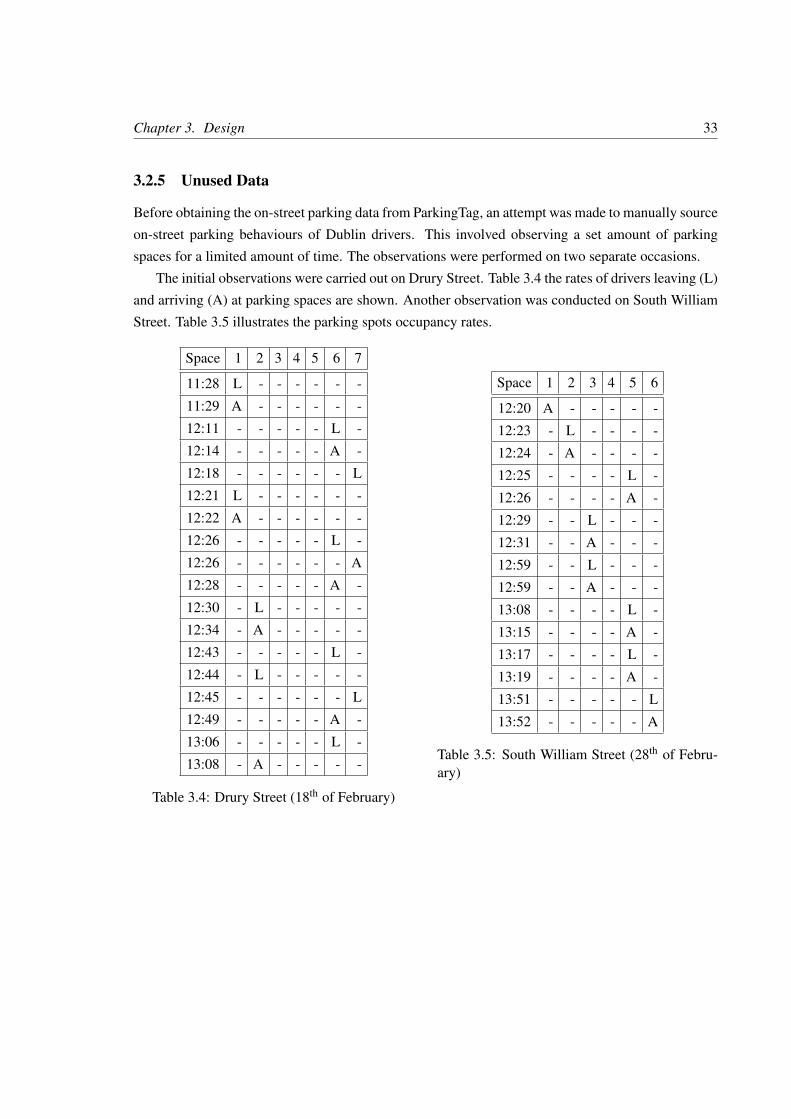
3.2.5 Unused Data . . . . . . . . . . . . . . . . . . . . . . . . . . . . . . . . . . 33
4 Implementation 344.1 Road network of Dublin . . . . . . . . . . . . . . . . . . . . . . . . . . . . . . . . 34
4.1.1 OpenStreetMaps + JOSM . . . . . . . . . . . . . . . . . . . . . . . . . . . 34
4.2 Route Generation . . . . . . . . . . . . . . . . . . . . . . . . . . . . . . . . . . . . 36
4.2.1 Trips . . . . . . . . . . . . . . . . . . . . . . . . . . . . . . . . . . . . . . 36
4.2.2 Routes . . . . . . . . . . . . . . . . . . . . . . . . . . . . . . . . . . . . . 36
4.3 Simulation Data . . . . . . . . . . . . . . . . . . . . . . . . . . . . . . . . . . . . . 37
4.3.1 Parking Lot . . . . . . . . . . . . . . . . . . . . . . . . . . . . . . . . . . . 37
4.3.2 On-Street Parking . . . . . . . . . . . . . . . . . . . . . . . . . . . . . . . . 38
4.3.3 Other . . . . . . . . . . . . . . . . . . . . . . . . . . . . . . . . . . . . . . 39
4.4 VANET Modelling . . . . . . . . . . . . . . . . . . . . . . . . . . . . . . . . . . . 40
4.4.1 Simulation Initialisation . . . . . . . . . . . . . . . . . . . . . . . . . . . . 40
4.4.2 Vehicle Initialisation . . . . . . . . . . . . . . . . . . . . . . . . . . . . . . 40
4.4.3 At Every Time Step . . . . . . . . . . . . . . . . . . . . . . . . . . . . . . . 44
4.4.4 Parking Duration . . . . . . . . . . . . . . . . . . . . . . . . . . . . . . . . 44
4.4.5 Exit Route Planning . . . . . . . . . . . . . . . . . . . . . . . . . . . . . . 45
4.4.6 Baseline . . . . . . . . . . . . . . . . . . . . . . . . . . . . . . . . . . . . . 45
5 Evaluation 465.1 Limitations . . . . . . . . . . . . . . . . . . . . . . . . . . . . . . . . . . . . . . . 46
5.2 Simulation Data . . . . . . . . . . . . . . . . . . . . . . . . . . . . . . . . . . . . . 47
vii
Page 9
5.3 Simulation - Computer Specifications . . . . . . . . . . . . . . . . . . . . . . . . . 48
5.4 Simulation Results . . . . . . . . . . . . . . . . . . . . . . . . . . . . . . . . . . . 49
5.4.1 Simulation run #1 . . . . . . . . . . . . . . . . . . . . . . . . . . . . . . . . 50
5.4.2 Simulation run #2 . . . . . . . . . . . . . . . . . . . . . . . . . . . . . . . . 52
5.4.3 Simulation run #3 . . . . . . . . . . . . . . . . . . . . . . . . . . . . . . . . 54
6 Conclusion 576.1 Future Works . . . . . . . . . . . . . . . . . . . . . . . . . . . . . . . . . . . . . . 57
6.2 Reflection . . . . . . . . . . . . . . . . . . . . . . . . . . . . . . . . . . . . . . . . 58
Appendices 65
viii
Page 10
List of Tables
2.1 An overview of parking sensors . . . . . . . . . . . . . . . . . . . . . . . . . . . . 7
2.2 Stationary Sensors Comparison Table . . . . . . . . . . . . . . . . . . . . . . . . . 15
2.3 Mobile Sensors Comparison Table . . . . . . . . . . . . . . . . . . . . . . . . . . . 15
2.4 Comparison of Parking Data Dissemination Approaches . . . . . . . . . . . . . . . 18
3.1 Traffic Simulation Software Considerations . . . . . . . . . . . . . . . . . . . . . . 26
3.2 Dublin Parking Lots and Capacities . . . . . . . . . . . . . . . . . . . . . . . . . . 30
3.3 Dublin Traffic Flow Locations . . . . . . . . . . . . . . . . . . . . . . . . . . . . . 31
3.4 Drury Street (18th of February) . . . . . . . . . . . . . . . . . . . . . . . . . . . . . 33
3.5 South William Street (28th of February) . . . . . . . . . . . . . . . . . . . . . . . . 33
5.1 Parking Lot Data in Simulation . . . . . . . . . . . . . . . . . . . . . . . . . . . . . 47
5.2 Traffic Flow Data in Simulation . . . . . . . . . . . . . . . . . . . . . . . . . . . . 48
ix
Page 11
List of Figures
2.1 Magnetometer Readings . . . . . . . . . . . . . . . . . . . . . . . . . . . . . . . . 12
2.2 Voronoi Model . . . . . . . . . . . . . . . . . . . . . . . . . . . . . . . . . . . . . 20
3.1 Dublin City Council Parking Zones Breakdown . . . . . . . . . . . . . . . . . . . . 29
4.1 SUMO Converted OpenStreetMaps (OSM) Map . . . . . . . . . . . . . . . . . . . . 35
4.2 Destination Sectors . . . . . . . . . . . . . . . . . . . . . . . . . . . . . . . . . . . 42
4.3 Granular Destinations . . . . . . . . . . . . . . . . . . . . . . . . . . . . . . . . . . 43
x
Page 12
List of Acronyms
ANPR Automatic Number Plate Recognition
CNN Convolutional Neural Network
DCC Dublin City Council
CCTV Closed Circuit Television
CLI Command Line Interface
EPA Environmental Protection Agency
GUI Graphical User Interface
HC Hybird Cloud
ITS Intelligent Traffic System
IVC Inter-Vehicle Communication
JOSM Java OpenStreetMaps
MANET Mobile Ad-Hoc Networking
OBU On-Board Unit
OMNeT++ Objective Modular Network Testbed in C++
OSM OpenStreetMaps
RFID Radio Frequency IDentification
RSU Road Side Unit
SUMO Simulation of Urban MObility
SVM Supported Vector Machines
xi
Page 13
TSA Travelling Salesman Algorithm
VANET Vehicular Ad-Hoc Networking
VEINS Vehicles in Network Simulation
VCC Vehicle Cloud Computing
VC Vehicle Cloud
VuC Vehicle using Cloud
V2G Vehicle-to-Grid
V2I Vehicle-to-Infrastructure
V2V Vehicle-to-Vehicle
xii
Page 14
Chapter 1
Introduction
In this chapter, the motivations behind this dissertation are outlined. The research question that this
dissertation poses to answer is introduced, along with the research objectives and challenges that go
with it. A final section explaining the organisation of the dissertation concludes this introductory
chapter.
1.1 Motivation
One of the core motivation behind smart parking is to minimise the number of drivers driving around
looking for a vacant parking spot within a city. By minimising the process of looking for parking
spaces, it will have a positive effect on the environment, as there will be fewer vehicles on the road
and fewer vehicle emissions. The minimisation of cruising vehicles is also advantageous regarding
traffic congestion in an urban setting, with fewer vehicles on the road, traffic levels may be alleviated.
In a study by Donald Shoup (Shoup, 2006), “Between 8 and 74 percent of the traffic was cruising for
parking, and the average time to find a kerb space ranged between 3.5 and 14 min”.
Minimising the number of drivers driving around looking for a vacant parking spot can be achieved
in different ways. One of the methods for achieving this is to introduce parking sensors in parking
locations. The parking sensors will be able to sense if a parking spot is vacant or not. This parking
data may be disseminated to all drivers. However, by surfacing the parking information to drivers, it
does not guarantee that a driver will get a parking spot. In other words, drivers will still need to cruise
for parking spots. For this reason, smart parking methodologies could potentially be improved.
Parking data dissemination methods is a significant aspect of developing an intelligent parking
system. Parking data dissemination explores how parking data should be made available to drivers.
In this paper (Verroios et al., 2011), various data dissemination techniques are explored. The paper
proposes three ways in which parking data could be disseminated. The “live” approach is one of the
1
Page 15
Chapter 1. Introduction 2
three data dissemination techniques. It proposes inter-vehicles communications regarding parking
space availabilities. This introduces the concept of VANET.
VANET is the utilisation of vehicular communications to achieve various goals. There are mul-
tiple VANET models; vehicle-to-infrastructure (V2I), vehicle-to-device (V2D), vehicle-to-vehicle
(V2V) and vehicle-to-grid (V2G). The VANET model of interest in this dissertation is vehicle-to-
vehicle (V2V). There are various motivations for VANET, some of those included are vehicle pla-
tooning, and forward collision mitigation. Vehicle platooning involves vehicles sharing their current
speed, acceleration and positioning information with other vehicles within their vicinity. By doing
so, vehicles may move in a more streamline motion along a street. In this Japanese study conducted
in 2008 (Sugiyamal et al., 2008), one of the reasons of traffic build-up is due to a small fluctuation
in the speed of an individual vehicle. The study was able to recreate a traffic jam that produced a
“shockwave” effect down the street, similar to a traffic jam in the real world. With the introduction
of inter-vehicular communication, cars may be able to keep the flow of traffic in a consistent man-
ner, thus avoiding unnecessary traffic congestions. Forward collision mitigation may assist drivers
in times of traffic accidents. Information regarding an accident that occurred on the street may be
propagated back along the road through vehicles on that street. Vehicles further along the street may
be able to make alternative routes to their destinations to alleviate traffic in that area.
Additionally, as self-driving vehicles are becoming increasingly popular, VANET and vehicular
cloud networking has become more and more likely. As outlined in (Gerla et al., 2014), the next step
in evolution is just around the corner: The Internet of Autonomous Vehicles.
This dissertation involves designing a VANET smart parking system. More specifically, a simu-
lation of a VANET based smart parking system will be evaluated on the city of Dublin. Dublin traffic
and parking data will be incorporated into the simulation to provide a realistic simulation model.
1.2 Research Question
The research question that this dissertation poses to answer is whether a VANET incorporated smart
parking system is beneficial to a small scale city like Dublin City. This involves questions regarding
whether a VANET smart parking system would minimise the number of drivers cruising looking for
parking spots. Evaluation metrics includes the amount of CO2 emission reductions if any, and the
number of drivers that arrive at a destined parking location to find that it has just been occupied.
1.3 Research Objectives
The research objectives that have been set and completed throughout the course of the year are listed
as follows.
Page 16
Chapter 1. Introduction 3
• To explore the current state of the art for smart parking sensors.
• To explore the current smart parking enabled cities and their solutions.
• To explore parking data dissemination methodologies.
• To gather Dublin city-specific traffic and parking information for use in this dissertations’ sim-
ulation.
• To simulate Dublin with a VANET model that supports smart parking.
1.4 Research Challenges
Various challenges had to be overcome to achieve the goal of this dissertation. In this section, the
research challenges, as well as limitations, are explained.
The primary objective of this dissertation is to investigate and evaluate the feasibility of a VANET
supported smart parking system for Dublin City. To achieve this, various Dublin specific data must
be obtained. This includes Dublin City traffic data and Dublin City parking data, both on-street
parking data and parking lot data. The lists below were compiled during the designing phase of
this dissertation. The first list highlights the available data that is readily available on public Irish
databases and websites. The second list includes data that is unavailable online and that had to be
acquired by other means.
Obtainable Data
• Parking Lot Occupancies - The Dublin City traffic website includes real-time information re-
garding available spaces in 14 parking lots within inner city Dublin. This data is useful and is
incorporated into the simulation.
• Parking Lots Locations - Knowledge of the location of parking lots within inner city Dublin is
necessary to route drivers to the desired parking lot in the simulation. The 14 parking lots that
the Dublin city traffic website provide is easily identifiable on Google Maps; their coordinates
are recorded.
• On-Street Parking Locations - Each on-street parking location is not available. However,
data.gov.ie features a dataset that contains all available parking meters in the county of Dublin.
Included in the dataset is the number of on-street parking spaces that they serve. This approxi-
mation of on-street parking locations is used in the simulation.
Page 17
Chapter 1. Introduction 4
• Average Traffic Volumes - Traffic volumes datasets are available on data.gov.ie. However,
the online traffic data is composed only of traffic data outside of inner city Dublin. More
specifically, the datasets only include inbound and outbound traffic of national roads along the
M50. The region of interest in this dissertation is central Dublin. Thus inner city Dublin traffic
volumes must be acquired by other means.
• Emissions - Used as an evaluation metric. VEINS features an emissions model that allows for
emissions results.
Unavailable Data
• Occupancy data on on-street parking spots - The parking duration of Dublin drivers in on-
street parking locations within the central Dublin city district is required to model a realistic
environment for this dissertations’ simulation.
• Inner Dublin city traffic data - More fine grain data of inner city traffic could be used to model a
more realistic traffic flow environment. The average traffic volumes as listed above are unable
to give a reasonable estimation of the traffic within inner city Dublin.
Despite the occupancy and traffic data not being accessible online, the process of acquiring the
data alternatively is explained in detail in section 3.2.
Research limitations also included the computational power required to run the simulations. There
were attempts to run simulations on university computers and from a personal laptop. However, in
both cases, the estimated completion time exceeded three weeks. Initially, the simulations were run
with the simulations’ GUI which would have impacted the run-time. University virtual machines
were requested to perform the simulations via the command line. Even from the college virtual
machines, the simulations took more than two weeks. Eventually, the simulations were scaled down
substantially so that the simulation could be complete in a reasonable time.
1.5 Organisation
The structure of the dissertation is split into six chapters. This organisation section concludes the
introductory chapter. Chapter two gives an in-depth analysis of the current state-of-the-art of smart
parking. This involves a literature review on the current VANET technologies, parking space sensing
technologies, parking data dissemination techniques, security and privacy considerations, smart park-
ing models and an assessment of smart parking solutions in other cities. Chapter three outlines the
design considerations before the implementation of the simulation model. The process of obtaining
the required traffic and parking data, as well as simulation software reviews. Chapter four discusses
Page 18
Chapter 1. Introduction 5
the implementation process of the chosen simulation overview. Chapter five details the evaluation
process and an analysis of the results. This is followed by the final chapter; Chapter six explores
possible future works and a conclusion to this dissertation.
This concludes the introductory chapter.
Page 19
Chapter 2
State of the Art
In this chapter, an overview of smart parking is provided. The overview includes parking data sensing
and parking data dissemination methodologies. As well as this, VANET and Vehicular Cloud Com-
puting (VCC) is discussed. Additionally, security considerations of vehicle networking protocols are
explored. This is followed by an analysis of solutions implemented in other cities worldwide.
2.1 Background
Kuhn defines a paradigm shift as a fundamental change in the basic concepts and experimental prac-
tices of scientific disciplines (Kuhn, 1970). In this paper (Eltoweissy et al., 2010), it mentions that
within the computing industry, various infrastructure providers with large computing resources are
often underutilised. The paper highlights the shift in which business models and computing resource
allocations have shifted towards an on-demand model. This shift is known today as cloud computing.
The same paper also envisions a shift in the ever increasing fleet of vehicles on the roads. In that, they
could potentially shift towards a system that can support a networking environment.
The huge fleet of energy-sufficient vehicles that crisscross our roadways, airways, and
waterways, most of them with a permanent Internet presence, featuring substantial on-
board computational, storage, and sensing capabilities can be thought of as a huge farm
of computers on the move.
The paper stresses that the computational power and sensing capabilities of vehicles, could po-
tentially be pooled together, to autonomously self-organise into the cloud and form what the paper
has called “Autonomous Vehicular Cloud (AVC)”. The comparison is made between the previously
underutilised computing resources of infrastructure providers to that of current autonomous vehicles
with no vehicular networking capabilities. In a similar way where cloud computing has introduced
6
Page 20
Chapter 2. State of the Art 7
the concept of on-demand computing resource models for consumers to utilise its resources entirely,
vehicles may act in a similar way to fully utilise their real-time on-the-road sensing capabilities as
well as coordination of communications and physical resources in an ad-hoc manner in traffic.
2.2 Smart Parking
In this section, the current state of the art of smart parking is explored. The initial section is an
analysis of various parking space sensors. The following section is an analysis of various parking
data dissemination approaches.
2.2.1 Parking Data Sensing
There are various tradeoffs to be considered as well as the applicability of the sensors for different
scenarios. An analysis of each sensor is provided along with a brief conclusion regarding the sen-
sors applicability to sense parking spaces. Figure 2.1 provides a brief overview of the sensors to be
discussed.
Sensor Technology Use in Parking Space DetectionAccelerometer Accelerometers in phones can be used to detect whether a driver
has taken a parking space
Acoustic Analysis of sound waves of the vehicles to track where vehicles
park within a parking lot
Computer Vision Utilisation of public CCTV or private parking lot cameras to track
vehicles
Crowdsensing Pooling of information from participating drivers to detect park-
ing space occupancies
Laser Range Finders Scanning on-street locations for parking space occupancies
Magnetometer Magnetometers in mobile phones to detect parked vehicles
Optical Fibre Detection of vehicles that cross an optical cable. Placement can
be at the entrances and exits of parking lots
RFID RFID readers to scan vehicles’ RFID tags upon entry to parking
lots
Ultrasonic Emits sound waves at a known location to detect if parking space
is occupied
Table 2.1: An overview of parking sensors
Page 21
Chapter 2. State of the Art 8
Accelerometer
Accelerometers can be found in many smartphones. Accelerometers can be used to detect a phone’s
orientation, motion and rotation. Information regarding a phones’ orientation can allow the phone’s
screen to adjust to landscape mode or portrait mode. Accelerometers in mobile phones can also be
used to recognise activity of a user (Brezmes et al., 2009).
PhonePark is a solution that includes a real-time analysis of device mode transitions to detect
parking space occupancies (Xu et al., 2013). It works by utilising information of a users’ mobile
phone. PhonePark proposes three detection methods of parking space occupancies. These are listed
below with an overview of how they work.
1. Bluetooth: This method of detection involves a mobile phone tethered to a vehicles’ Bluetooth
system. If the device is tethered to the vehicle, then it assumes that the vehicle is being driven.
When the Bluetooth disconnects, as the driver walks (10 meters) away from the vehicle, it infers
that the vehicle is parked.
2. Transition Models: Different states are used to classify whether a user is driving, walking
or stationary. If a transition sequence of driving to stationary, and stationary to walking is
observed. PhonePark infers that the vehicle is recently parked. The phone’s accelerometer is
used to make estimations as to whether the user is driving, walking or stationary.
3. Pay-by-Phone Piggyback: Pay-by-phone piggyback is to allow the user to pay through their
mobile phone. Upon payment, the user will be asked for their parking space number. This
information is forwarded from the pay-by-phone company to a central system that keeps track
of the parking spaces. Thus the parking space occupancy can be detected in this way.
While the methods of detection are possible, the paper acknowledges that not all drivers have
mobile phones. Thus the solution provided by PhonePark is not always possible. Additionally, the
paper acknowledges GPS errors, Bluetooth pairing difficulties and incorrect transition classifications.
All these errors contribute to inaccurately detecting parking space occupancies.
Acoustic
Acoustic sensors can detect the noise emitted from vehicle engine sounds. Within a parking lot
environment, a solution is proposed to utilise acoustic sensors to detect vehicles (Na et al., 2009).
Acoustic sensors are placed in areas within the parking lot. An acoustic localisation algorithm is in-
troduced to narrow the scope of where it estimates the vehicle has parked. In the parking lot scenario,
it assumes that cameras are available. Thus, by re-positioning the cameras’ viewing angle towards
Page 22
Chapter 2. State of the Art 9
the acoustically localised area, the parking lot system can confirm whether the parking spot has been
occupied.
Acoustic sensors are very sensitive to the environment they operate within. Although this paper
(Lee et al., 2008) does not directly focus on the analysis of an acoustic sensor parking space detector,
it mentions a possible solution that is worth considering. The paper states that each vehicle has
its characteristics, vehicle size, magnetic wave pattern and engine sound. With the combination of
magnetometers, ultrasonic sensors and acoustic sensors placed at the entrance of a parking lot. It
could build a database of the vehicles entering the parking lot, recording the vehicles’ body shape,
magnetic wave pattern and engine sounds with the above-mentioned sensors. With the placement of
sensors throughout the parking lot, it may be possible to track and localise where a particular vehicle
has parked, thus supplying information as to where a vehicle has taken up a parking spot.
While acoustic sensors might not be the most accurate method of detecting parking space occu-
pancies due to its sensitivity to its environment, they provide a fascinating insight to the utilisation of
non-obvious sensors to seek parking space occupancy rates. In both of the mentioned papers, acous-
tic sensors do not act alone to obtain parking data. The combination of cameras, magnetometers and
ultrasonic sensors are necessary to verify the data obtained from acoustic sensors.
Computer Vision
Computer vision involves parsing information from images of a video feed. Applications of com-
puter vision range from the detection of defective products on manufacturing assembly lines to facial
recognition software. Additionally, computer vision can be applied to the detection of vacant parking
spaces. This section includes an analysis of two papers that utilise computer vision to sense parking
information.
In this paper (Cho et al., 2016), it discusses taking advantage of CCTV cameras inside parking
lots to guide autonomous vehicles to a parking spot. The system proposes a central computing unit
that communicates with the autonomous vehicles. This assumes that a type of vehicular networking is
supported by the vehicles. The work was tested within a lab environment with a USB 3.0 camera. The
identification of parking spaces is identified by placing a coloured piece of paper in the centre of each
parking location. The coloured paper is hidden when the body of a vehicle is in its position. Thus,
the camera can identify whether a parking spot is vacant or occupied. However, the paper concludes
that dynamic characteristics, such as camera image noise and geometric orientations may impede its
use in general parking lot scenarios.
In this paper (Amato et al., 2017), it proposes a deep learning decentralised parking lot occupancy
detector. The solution is based on a deep Convolutional Neural Network (CNN) designed for use on
smart cameras. CNN involves the classification of images and recognising persistent attributes of
items and objects (Krizhevsky et al., 2012). Smart cameras are defined in the paper as “cameras
Page 23
Chapter 2. State of the Art 10
capable of processing the acquired images and transmitting just the result to a remote server”. The
proposed solution can learn where parking spaces are and detect whether a vehicle is parked on it or
not. The advantages of designing a decentralised detection system are that it may be deployed to other
smart cameras and learn by itself to detect parking space occupancies. This research took place on
publicly available parking lot datasets. “PKLot” and “Cnrpark-ext” are the two datasets used in this
study (PKLot, 2017; CNR-EXT , 2017). In both datasets, parking areas in different weather conditions
are available. With the datasets, the deep learning agent can classify parking spaces and detect their
occupancy statuses. This paper concludes that its solution outperforms other existing solutions within
the field of parking space occupancy detection with computer vision.
While the initial paper (Cho et al., 2016) discusses the utilisation of CCTV cameras inside parking
lots to guide autonomous vehicles, it could be extended to utilising city CCTV cameras to detect
parking spaces. However, since the detection method involves a coloured identifier on the parking
location, it may prove difficult to do the same with on-street parking locations.
On the analysis of the second paper (Amato et al., 2017), utilisation of a deep learning CNN
to detect parking space occupancies can be extended to many other smart cameras. This is a very
promising solution in assisting parking lots and urban areas equipped with CCTV cameras to detect
parking space occupancies.
Crowdsensing
Crowdsensing can be defined as the collection of data from citizens to provide a dataset where useful
information can be extracted from (Villanueva et al., 2016).
ParkJam (Kopeck & Domingue, 2012) is a proposal for a crowdsensing parking space app. It
uses publicly available geographic data to get parking areas. The app relies on participating users to
submit information regarding parking space availabilities. Incentives for users to take part in updating
the parking spaces include receiving information regarding vacant parking space in return.
While crowdsensing can provide up-to-date parking data, it requires constant user attention and
participation. ParkJam could be utilised more efficiently if users are not obliged to input the data
manually. PhonePark (Xu et al., 2013), as mentioned in the previous accelerometer section, uses
mobile phone accelerometers to detect whether a driver has parked. This information could be relayed
to a central system and broadcasted to other participating drivers. As a result, PhonePark is essentially
a crowdsensing application that uses an accelerometer to detect parking space occupancies.
Laser Scanners
Laser range finders are used to detect the distances from a source point into the distance. In a research
paper (Ono et al., 2002), a test vehicle with laser range finders attached to the side of the test vehicle
Page 24
Chapter 2. State of the Art 11
makes an attempt to detect on-street parking space occupancies. The laser scanners can retrieve depth
information from the side of the test vehicle to the side of the street. With a known location of parking
spaces, it would be able to analyse the distance between the test vehicle to the side of the street at
a known parking spot location. Thus, it would be able to infer whether or not the parking space is
occupied by analysing the distance between the test vehicle and the side of the street. If the distance
exceeds the distance between the test vehicle and the kerb, then it’s likely that that space is vacant.
Whereas if the distance is less than the normal distance between the test vehicle and the kerb, then it
is probably taken.
At times, the study found that the detection of black vehicles goes unnoticed. Thus, this paper has
devised two algorithms to further enhance the analysis of a normalised depth image obtained from
the laser range finder. They are known as the height-curve method and the depth-curve method. The
methods include computer vision techniques, such as edge detection to obtain additional information
from the depth images. With the depth-curve method, it can find the edge of the road, and if a vehicle
is present, it can detect the outline of the vehicle. Using the height-curve method, it can infer whether
the height of outline obtained through the depth-curve method is a vehicle or a wall. Through the
utilisation of both methods, the study concludes that it provides an accurate solution for the detection
of parking space occupancies with a laser range finder.
While the use of laser range finders is possible in the discovery of parking spaces, it requires a
vehicle to drive around, scanning all known parking spaces to provide updates. One idea would be to
attach these laser range-finders to the side of taxis. Similarly, they could be attached to other forms
of public transport systems. However, taxis are expected to cover more ground and circulate more
granular areas within an urban environment than general public transport.
Magnetometer
Magnetometers are used to detect large bodies of metal. This can be a useful application for the
detection of parked vehicles in parking spaces. As illustrated in this paper (Villanueva et al., 2016),
tests are carried out with the magnetometer on a Samsung Galaxy S4. The study was conducted in
three different scenarios. In the first scenario, the goal was to try and classify different magnetometer
readings in various situations. Additionally, an investigation into whether an active engine interferes
with the magnetometer readings is performed. The combinations investigated in the study are as
follows:
• (ssb) Test vehicle engine stopped, test vehicle stopped, adjacent vehicles on both side of test
vehicle
• (rsb) Test vehicle engine running, test vehicle stopped, adjacent vehicles on both sides of test
vehicle
Page 25
Chapter 2. State of the Art 12
• (rsl) Test vehicle engine running, test vehicle stopped, vehicle on left side of test vehicle
• (rsn) Test vehicle engine running, test vehicle stopped, no vehicles close to test vehicle
• (ssn) Test vehicle engine stopped, test vehicle stopped, no vehicles close to test vehicle
• (ssl) Test vehicle engine stopped, test vehicle stopped, vehicle on the left side of test vehicle
The study successfully classifies readings through the use of Supported Vector Machines (SVM).
SVM is a supervised machine learning algorithm. SVM is generally used for classifications and
regression (Suykens & Vandewalle, 1999).
Through the use of SVM, the readings from the magnetometer can be classified. For the purpose
of illustration, figure 2.1 shows the magnetometer readings obtained by the study. From figure 2.1,
it is clear that the magnetometer readings can be used for detecting whether a vehicle is stationed
nearby.
With these classifications, the mobile phone that performed the information sensing could relay
this information to a central server. In this way, the central server will have additional knowledge
regarding parking space occupancies within that specific magnetometers’ area.
Figure 2.1: Magnetometer Readings
In the second scenario, the aim was to investigate whether a moving test vehicle equipped with a
portable magnetometer can detect vacant parking spaces. The setup to this test case includes a line
Page 26
Chapter 2. State of the Art 13
of parked vehicles with one empty spot. The test vehicle drives alongside the line of parked vehicles,
emulating a vehicle driving down a street of parked vehicles. The magnetometer showed a significant
reading as it passed the vacant spot. Thus the investigation concludes that it is successful in detecting
empty parking spots while the test vehicle is moving.
In the third scenario, the distance of a parked vehicle to the test vehicle is investigated. The test
begins with the test vehicle parked beside another vehicle. The test vehicle is then moved further
and further away from a parked vehicle. The results show that the magnetometer readings are useless
unless vehicles are very near.
The results obtained through this paper indicates that it is possible to use magnetometers to detect
parking space occupancies. However, a suitable application has yet to be discussed. A magnetometer
may only sense parking spaces when the device is relatively near. Unless this is incorporated into a
crowdsensing scheme, there is no incentive for drivers to cruise a parking lot or urban streets sensing
spaces for other drivers. Integration of magnetometers onto taxis, as previously discussed in the laser
range finder section, could also be considered. By attaching magnetometers to public transport or
taxis, they may be able to scan parking areas for parking space availabilities.
Optical Fibre
Optical fibres can be used as load sensors to measure the weight of vehicles. A proposal for vehicle
detection with optical fibres is explored in this paper (Gupta & Upadhyaya, 2016). The study uses
phase-shift and amplitude analysis on the propagation of the optical fibre path to detect when a vehi-
cles’ is on it. The results show that optical fibres produce a high accuracy rating for the detection of
vehicles. The detection of individual vehicles could be useful by placing optical fibres at the entrances
and exits of parking lots; they may be able to accurately record how many vehicles are in the parking
lot at any given time. Additionally, optical fibres may be placed at both ends of a one-way street that
contains on-street parking locations. This could provide information regarding some parking spaces
on that street by finding the difference between the vehicles that have entered the street but have not
exited on the other end.
RFID
RFID is a technology that uses radio waves to read and capture information stored on a tag attached
to an object. RFID tags do not require a direct line of sight to function. RFID can be described with
two main components, a RFID tag and a RFID reader. The tag consists of a microchip that can store
data, as well as an antenna to transfer information bidirectionally. A reader emits a signal to RFID
tags, and tags can respond with the information that they have in their storage (Want, 2006).
RFID tags may be placed on vehicles, with RFID readers installed at parking lot entrances and
Page 27
Chapter 2. State of the Art 14
exits. As described in this paper (Pala & Inanc, 2007), tags can be generated for vehicles and stored
in a central database system. When vehicles enter the parking lot, the RFID reader scans the RFID
tags and checks whether they are authorised to enter the parking lot. If authorised, the barrier will be
raised to allow the vehicle to enter. The same process is performed to allow the vehicle to exit.
From the paper, it is observed that if two or more vehicles enter the parking lot at the same time,
the RFID readers will not be able to process both vehicles’ information correctly. For this reason, it
is advised to only process one vehicle at a time.
According to this paper (Dokur et al., 2016), RFID readers are very expensive. However, the use
of RFID sensors is highly accurate when performed in a controlled environment.
Ultrasonic
Ultrasonic sensors are widely used to sense parking space occupancies. The largest shopping centre
in Ireland, located in Dundrum, serves more than 3,500 spaces. Above every parking space in the
underground parking lot is an ultrasonic sensor (Gavin, 2008). The ultrasonic sensors are used to
sense the occupancy of an individual parking space, and the information is relayed to electronic
display boards both inside and outside the parking lot. Parking information signs inside the parking
lot guide drivers up and down levels and in between aisles. External electronic display boards guide
drivers to different parking lots.
Similarly, in this paper (Kianpisheh et al., 2012), ultrasonic sensors are placed above parking
spaces within a parking lot. The proposed smart parking system can use the ultrasonic sensors to
detect improper parking as well as parking space occupancy detection. In the same way, the smart
parking system relays information to the information display boards to inform drivers of the current
parking space occupancies in the area.
The use of ultrasonic sensors are highly accurate, and the cost of each sensor is relatively cheap
(Dokur et al., 2016). It is also worth noting that since ultrasonic sensors do not support multiple
detections of vehicles, the cost of deployment could become much more.
Comparison of Sensing Technologies
Table 2.2 and 2.3 illustrates general considerations put forward when comparing parking sensor tech-
nologies as defined in this paper (Lin et al., 2008). Additional information is obtained from (Dokur
et al., 2016) regarding the cost and accuracy of sensors mentioned.
An explanation of the columns of tables 2.2 and 2.3 are as follows:
Intrusive Installation (IV) Intrusive installation is defined as whether the sensor needs to be
embedded into the road. This could yield significant costs. For
Page 28
Chapter 2. State of the Art 15
example, on-street ultrasonic sensors may require installers to dig
up the road to install the sensors securely into the ground.
Multiple Detection (MD) The ability to detect multiple parking space vacancies at once.
Cost (C) The cost of each sensor is an important consideration. This also
depends on whether the sensor can detect multiple spaces. Detec-
tion of multiple spaces would bypass the need for a single sensor
per parking spot. Additionally, if the sensor requires intrusive in-
stallation, then the cost is likely to increase.
Accuracy (A) The accuracy of a sensor device depends on environmental factors,
as well as the method for detecting parking spaces.
In tables 2.2 and 2.3, the discussed parking sensors are compared.
Stationary Sensors
Sensor C IV MD A
Accelerometer * 7 X *
Acoustic *** 7 X *
Fibre Optics * 7 7 **
Magnetometer ** X 7 ***
RFID ** X 7 **
Ultrasonic * 7 X ***
Vision *** 7 X **
Table 2.2: Stationary Sensors Comparison Table
Mobile Sensors
Sensor C IV MD A
Crowdsource (Smartphone) 7 7 X 7
Laser Range Sensor *** 7 X ***
Ultrasonic * 7 X ***
Table 2.3: Mobile Sensors Comparison Table
Page 29
Chapter 2. State of the Art 16
Conclusion
A wide range of parking space sensing technologies has been discussed. There are many ways in
which parking space occupancies can be detected. From the unconventional ways of detection with
fibre optics and laser range sensors to the utilisation of ultrasonic sensors and RFID readers. Each
and every sensing solution provide adequate results for the detection of occupied parking spaces.
2.2.2 Parking Data Dissemination
Parking data dissemination refers to the method of sending parking data to drivers. In this dissertation,
the parking data dissemination model is assigned to the vehicles themselves; the parking data is
disseminated from vehicle to vehicle. Parking data dissemination could also take the form of vehicle
to infrastructure communications. This may take the form of utilising a RSU to relay information to
vehicles on the road. Different algorithms have been explored by various papers (Schlote et al., 2014),
(Verroios et al., 2011) and (Lin et al., 2008). In the following three sections, different approaches
outlined by (Verroios et al., 2011) are explained. Each approach is important as they lead up to this
dissertations’ simulation data dissemination process.
To note: The live model and cluster models are most applicable to this dissertations’ simulation.
However, information regarding the exact model is also outlined as part of an analysis of the paper.
Exact Model
As outlined in section 1.1, to avoid the scenario of drivers arriving at parking spaces that are just taken
is an issue for smart parking. Three well-defined algorithms are discussed (Verroios et al., 2011), the
paper takes into account various parking factors, including probabilities that the parking space will be
taken and time required to walk from the parking space to the drivers’ final destination. These factors
are incorporated in calculating the best cost path for a driver to traverse through. The analysis that
follows will be based on the formula below.
C(a, b, ttot) = tab + p(ttot) ∗ ωb + [1− p(ttot)] ∗D
The formula is based loosely on the travelling salesman method. The aim is to devise the least
cost path for a driver to get to a parking spot that is not already taken.
tab: Time required to drive from space a to space b
ωb : Time to walk from space to destination
D: Time penalty if space is taken
ttot: Time until parking spot is reached
p(ttot): Probability that the space is still available
Page 30
Chapter 2. State of the Art 17
ωb : Time to walk to the destination is weighted by p(ttot)
p(ttot) is calculated by a space average life-time (salt) variable.
Whereby:
p(ttot) =salt
ttot + salt
The time penalty denoted as D is calculated with the following factors:
• The amount of spaces missed (asm) by the driver as a result of arriving at already occupied
parking spots.
• The time it takes to drive from an occupied parking spot to another. This is referred to as spot
to spot (sts).
• The average walk time from all spaces to the destination (wat).
Thus the time penalty is formulated as:
D = asm ∗ sts+ wat
This formula forms the basis of calculating the best-cost path for a driver.
Cluster Model
Other forms of data dissemination discussed in the paper (Verroios et al., 2011) was to cluster parking
spaces. The motivations behind clustering spaces is that there is a concern for the limited processing
power that vehicles may possess. By clustering parking spaces, the computational power required to
determine a drivers’ trajectory will be minimised. The clusters are formed by the minimal distances
between parking spaces. The algorithm to compute the best cost path for drivers is similar to the
“exact” algorithm. However, instead of routing through exact spaces, it is altered to route through the
defined clusters.
With computational power of on-board devices in vehicles, the cluster sizes must also be adjusted
to avoid substantial computational load. Quality Threshold Clustering defines a threshold for the
radius of clusters. K-medoid clustering is used to create clusters that have minimal distances between
parking spots.
Live Model
The live approach focuses on inter-vehicle communications. As outlined in the paper (Verroios et al.,
2011), vehicles communicate with other vehicles within their vicinity to update and report parking
Page 31
Chapter 2. State of the Art 18
spaces occupancies and vacancies. Furthermore, re-adjustments may be made by vehicles to alter
their route trajectories dynamically. As previously mentioned in the cluster model section, one of the
focuses is to minimise the computations required on an on-board device of a vehicle. Thus the cluster
model is incorporated into this live approach. In other words, instead of dealing with each parking
spaces’ status, it updates each parking area cluster.
The “live” approach to dissemination parking data between vehicles forms the foundation of this
dissertations’ simulation. The “clustering model” forms the basis of the structure of the parking
spaces in this dissertations’ simulation.
Comparison of Approaches
Table 2.4 features a comparison of the three different approaches.
• Time Complexity: Amount of time the algorithm would take
• Dissemination Protocol: The process of data dissemination
• Parking Spaces Scope: The parking spaces associated with the algorithm
• Algorithms Involved: Additional algorithms involved in the approach
Algorithm Exact Approach Cluster Approach Live Approach
Time Complexity O(n3T2n), where n = no.
of parking spaces, T =
time of longest trip
O(n3T2n), where n = no.
of clusters, T = time of
longest trip
O(n∗m), where n = num-
ber of clusters, m = num-
ber of pre-existing spaces
Dissemination Pro-
tocol
On-board calculations
obtained from external
source (RSU)
On-board calculations
obtained from external
source (RSU)
Vehicles within vicinity
Parking Spaces
Scope
All available spaces that
match drivers’ destination
criteria
Only takes into account
clustered areas that match
driver’s destination crite-
ria
Nearby spaces only
Algorithms In-
volved Travelling Salesman Al-
gorithm (TSA)
K-medoids, Quality
Threshold Clustering
Update system, re-
calibration of trajectory
algorithm
Table 2.4: Comparison of Parking Data Dissemination Approaches
Page 32
Chapter 2. State of the Art 19
As Verroios et al. discuss in (Verroios et al., 2011), the custom simulation that is built to evaluate
the algorithms show that the “live” approach reaches close-to-optimal trajectories. Additionally, it
produced positive results for trade-offs between optimality and the computational requirements.
2.3 Vehicle Networking
2.3.1 Vehicle Ad-Hoc Networking (VANET)
VANET is a subclass of Mobile Ad-Hoc Networking (MANET). The technology allows Inter-Vehicle
Communication (IVC) and is used for various reasons. With IVC, vehicles can communicate with
other vehicles within their vicinity. This is known as Vehicle-to-Vehicle (V2V). Applications for V2V
communications include vehicle platooning and forward collision avoidance. In this survey (Kiess et
al., 2007), it outlines a V2V safety application. The application involves an emergency braking signal
that is propagated through vehicles along the road when a vehicle suddenly stops. As vehicles behind
receive this information, the vehicles themselves may be able to react on time. Other applications
include speed management to avoid traffic jams and a new form of a distress signal from approaching
emergency vehicles.
There are other forms of VANET models. These include Vehicle-to-Infrastructure (V2I) and
Vehicle-to-Grid (V2G). V2I allow vehicle communication with V2I supported junctions, traffic lights,
as well as road signs. In this paper (Milanes et al., 2012), it proposes an Intelligent Traffic System
(ITS) through the use of V2I communications. By proposing an intelligent traffic system, regulation
of traffic flow is possible. As well as this, the system can monitor each vehicles’ position and speed.
By monitoring these characteristics, the system may alert the driver of the vehicle when it estimates
a collision. Additionally, ITS has the potential to guide autonomous vehicles through bends on the
road. Road signs on road bends may act as a RSU and notify an approaching autonomous vehicle of
the speed and angle that the vehicle should approach the bend at. Alternatively, the road signs could
notify the driver of the vehicle through their dashboard.
With V2G, battery vehicles would be able to communicate with the electricity grid. Communica-
tion with the electric grid could allow vehicles to contribute to levelling the off-peak load (Guille &
Gross, 2009).
VANET models can also allow the dissemination of parking information. This can be achieved
in the form of V2I, where vehicles communicate with a RSU. Alternatively, V2V communications
could be used to disseminate the parking data. For example, when a vehicle gives up a parking spot,
it may announce as so, so that the information may be propagated to a vehicle nearby looking for a
parking space.
An increasing amount of vehicles is being equipped with on-board wireless communication units
Page 33
Chapter 2. State of the Art 20
to facilitate wireless network among vehicles and their environments (Lin et al., 2008). Thus more
vehicles on the road could have the potential to support a smart parking system network environment.
In another paper (Panayappan & Trivedi, 2007), the proposal brought forward involves an urban
area dissected in the form of a Voronoi diagram. This is illustrated in figure 2.2.
Figure 2.2: Voronoi Model
The paper proposes that a roadside unit RSU should be placed at the centre of each sector in
the Voronoi diagram. The RSU is responsible for handling all the information regarding parking
information within its corresponding sector. In other words, each unit can respond with the occupancy
levels of the parking spaces in their designated sectors. Vehicles approaching a designated sector will
be able to communicate with the appropriate RSU to query the parking space available within that
sector.
2.3.2 Vehicular Cloud Computing (VCC)
Vehicle Cloud Computing (VCC) can be defined as a new paradigm in which vehicles interact and
collaborate to sense the environment, process the data, propagate the results and share resources
(Mehmood et al., 2017). VANET models require On-Board Unit (OBU) to process more and more
information. As highlighted in this survey (Whaiduzzaman et al., 2014), vehicles are expected to
carry more storage, processing power and sensing capabilities in the near future. VCC provides a
solution to the influx of processing power required for OBU of vehicles. Additionally, vehicular
sensing capabilities can be further enhanced through the use of the cloud. Often underutilised vehicle
sensors could provide real-time environment information.
In this paper (Hussain et al., 2012), it proposes three different cloud architectures. These archi-
tectures are Vehicle Cloud (VC), Vehicle using Cloud (VuC), and Hybird Cloud (HC). In VC, the
Page 34
Chapter 2. State of the Art 21
vehicles themselves form the cloud. The pooling of resources is performed between the vehicles
themselves. The most appropriate example for VC is traffic light coordination. If there is vehicle
build-up within a particular area, then vehicles in that area can communicate with each other and
with the traffic light infrastructure to dynamically adjust junctions in real-time. In VuC, RSU are
introduced and act as gateways to the cloud services. The cloud services provided could give vehicles
access to real-time traffic information. The final cloud architecture is HC; it is the combination of the
VC and VuC architectures.
To conclude, with the introduction of VANET, there is a concern for the required processing
power of vehicles’ OBU and underutilised capabilities of vehicle sensors and storage. The different
VCC architecture types outlined above could provide a viable solution for handling future VANET
models.
2.4 Security
In this section, security and privacy concerns are explored. This section discusses the security con-
cerns of a smart parking system deployed on the dedicated 802.11p network.
2.4.1 802.11p
Inter-vehicular communication protocols have been explored in different forms. IEEE have devised a
new protocol, known as 802.11p, a dedicated protocol for short range communication between vehi-
cles. The goal is to provide an international standard for Wireless Access for Vehicular Environment
(WAVE). As vehicles cannot tolerate excessive connectivity delays, the protocol focuses on resolv-
ing these issues. The technology originates from Dedicated Short Range Communication (DSRC),
which is a short to medium range wireless communication channel for automotive use Miller & Shaw
(2001).
The implementation of the 802.11p protocol focuses on communication between OBU and RSU.
In this paper (Panayappan & Trivedi, 2007), it highlights key considerations regarding certificate
authentication for vehicular networking. The vehicle manufacturer would be required to assign a
certificate to each vehicles’ OBU. The traffic authority would be required to assign certificates to each
RSU. The messages transferred between OBU and RSU will be encrypted by their corresponding
private keys. Additionally, they are required to attach their corresponding certificates during message
transfers to authenticate one another.
A replay attack involves a malicious user eavesdropping on the connection between an OBU and
a RSU and recording a set of messages between them. A replay attack is initiated when the malicious
user replays the set of recorded messages into the channel. As explained in the paper (Panayappan &
Trivedi, 2007), this can be avoided by appending a geo-synchronised time obtained from GPS.
Page 35
Chapter 2. State of the Art 22
In this paper Ucar et al. (2016), it discusses the potential of attacks on the platooning of vehi-
cles that utilise the 802.11p protocol. Platooning of autonomous vehicles involves communication
between cars to traverse through road segments. It works by adjusting the speed, acceleration and
deceleration variables of each car within a platoon. The paper discusses how packet falsification may
be used to alter the acceleration variables. Alternatively, attackers may demonstrate a replay attack.
This will disrupt the stability of the platoon and is highly undesirable. In future works, it proposes im-
plementing a secure DSRC protocol that prevents jamming, membership falsifications and hijacking.
One of the proposed methods is to implement a secure key establishment to achieve confidentiality.
Additionally, it proposes in using the authentication of verified members in the platoon to adopt key
management and key refresh mechanisms.
The vulnerabilities of 802.11p have been explored by various papers. Not only could attackers
affect platooning vehicles, but also in the case of disseminating parking information. The falsifica-
tion of parking data is of concern as attackers may track and divert drivers from vacant spaces with
malicious intentions.
2.5 Alternative Smart Parking Models
In this section, an overview of two alternative smart parking models is outlined.
Reservation-Based Models
Reservation-based systems have also been researched by various papers, whereby drivers can buy
spaces before parking their cars. A central reservation-based system is discussed (Wang & He, 2011).
The paper is mainly focused on parking lot infrastructure. Thus the parking management system may
be easier to achieve. It devises a solution whereby drivers communicate directly with parking lots to
obtain information and to reserve spots within the parking lot.
Founded in 2015, ParkPnp (ParkPnp, 2015) is an Irish parking reservation system. ParkPnp is an
application, both on the web and on mobile. It promotes parking lot owners as well as homeowners
who have reserved parking locations to sell their parking spots to other road drivers.
Demand Based Models
SFPark (SFMTA, 2011) is a pilot project for smart parking, utilisation of parking sensors installed
into a selected amount of on-street parking spaces. A unique aspect of this system is that it tries
to keep around 10-15% of parking spaces free on a street or block. Using a demand based pricing
model, it increases the price for on-street parking spots if the street is near 85-90% occupancy. As
well as this, if the street is 85-90% free, then the parking charges will be lower. In this way, it hopes
Page 36
Chapter 2. State of the Art 23
to distribute the amount of parking space vacancies evenly throughout the city. The price rate also
factors in the time of day, and if any events are currently taking place in the vicinity of the parking
locations.
2.6 Real World Examples
By the end of this section, this literature review will be complete. Throughout this chapter, an anal-
ysis of how parking space sensing, data dissemination and vehicle networking can be achieved. To
conclude this chapter, real world examples are analysed in this section. This involves an analysis of
existing solution in cities around the world. Some of these smart parking systems are pilot schemes
while others are outsourced to private firms.
SmartParking Limited
SmartParking (Robert C. Hampshire, 2011) is a private company that provides smart parking solutions
for cities. In this section, the solutions provided by SmartParking are analysed. This is followed by a
list of the cities that they currently serve.
Sensors
The sensors by SmartParking consists of a magnetic and infrared sensor. The sensors are wireless and
are powered by long-life batteries. The occupancy information is broadcasted to electronic display
boards, to the SmartParking app to assist drivers in finding a vacant spot. However, regarding network
topology, it does not explicitly say whether a nearby RSU oversees these sensors or in what way they
communicate with the smart parking system (Sensors SmartParking, 2017).
ANPR
Cameras are used to oversee off-street parking locations. Automatic Number Plate Recognition
(ANPR) is used to detect the number plates of vehicles. This solution allows for barrier-free parking
lots (ANPR SmartParking, 2017).
RFID
SmartParking also offers RFID solutions for both on-street and off-street locations. For on-street
locations, permit holders can simply attach a RFID tag onto their vehicles to allow parking enforcers
verify that they are authorised to park in that spot.
Page 37
Chapter 2. State of the Art 24
RFID tags can also be extended to vehicles in an off-street scenario. Vehicles may require an
authorised tag to park in a specific space within a parking lot complex (RFID SmartParking, 2017).
Westminster - London (October 2014)
The deployment of 10,000 RFID intrusive sensors is installed around the city. Zone unit monitors are
installed in street lamps monitor each sector. The service is accessible to drivers from an app, where
they can receive real-time parking information as well as pay for spaces via their mobile phones
(Westminster SmartParking, 2013).
Cardiff - Wales (January 2017)
The deployment of 3,000 Infrared/Magnetometer sensors. The parking information is accessible
through an app and from electronic display boards. ANPR recognition technology are also deployed
in off-street parking locations (Cardiff SmartParking, 2017).
Other solutions
San Francisco (2011)
San Francisco has been the leading example of the implementation of a smart parking facility.
Since its implementation, a study in March 2014 shows that drivers cruising looking for parking
spots have been down by 50% (Millard-Ball et al., 2014). In another economic study on the SF-
Park implementation (Shriver, 2016), it provides positive feedback from the dissemination of parking
spaces around the city. Supported by the demand-based pricing model, the distribution of spaces have
provided a wider variance in the spaces available in each sector of the city and also has managed to
suppress drivers from cruising around looking for a spot. This is possible because the system poses to
retain at least 20% of each regions parking spaces free. This is so that the probability of spaces being
available as drivers drive into the area will be high.
Page 38
Chapter 3
Design
3.1 Software
In this section, the software considerations are discussed. An outline on each software is introduced,
along with the reasoning behind why the implementation was settled on VEINS, SUMO and OM-
NeT++.
3.1.1 SUMO
SUMO is a microscopic traffic simulator (Krajzewicz et al., 2012). A microscopic traffic simulator
allows vehicles to be modelled and simulated individually. There are other types of traffic simulators;
macroscopic and mesoscopic modelling. In this section, a brief description of the different types
of traffic simulators is outlined. This is followed by figure 3.1, illustrating the differences between
current traffic simulators.
Traffic Simulators
Microscopic Traffic Simulators Microscopic traffic simulators allow granular ground-based level
modelling. This includes the simulation of individual pedestrians. Furthermore, microscopic simu-
lators simulate each entity individually. In contrast to this, macroscopic traffic simulators focus on
general traffic flows.
Macroscopic Traffic Simulators Macroscopic traffic simulators focus on traffic planning analysis
workflows. Applications for macroscopic simulators include public transport modelling and construc-
tion works traffic planning. It may be useful to simulate public transport for various reasons. Some
of the features included in macroscopic public transport simulations are optimisations to bus routes to
minimise transfer times and fleet sizes. Public transport modelling may also be useful to estimate the
25
Page 39
Chapter 3. Design 26
costs and revenue generated from each transport route. With construction planning traffic analysis,
traffic bottlenecks may be simulated, and it may be possible to quantify detour traffic.
Mesoscopic Traffic Simulators Mesoscopic traffic simulators are useful for simulating traffic in
small groups. It may be seen as a grouping of microscopic simulation. Applications, where meso-
scopic traffic simulations are necessary, is for the simulation of vehicle platooning.
Traffic Simulator Comparison
In figure 3.1 various traffic simulation packages are outlined. The columns of the table are aspects
that were considered when choosing an appropriate traffic simulator for this dissertation. The list
below is compiled for definitions for non-obvious columns for figure 3.1.
• Simulation Model identifies the type of traffic simulator (microscopic/mesoscopic/macroscopic).
• Multi-Modal is the ability to simulate more than one type of traffic.
• The possibility of OSM map conversion to simulation readable road network.
Software Focus Simulation Model Multi-
Modal
Open
Source
OSM Cost
SUMO Traffic analysis and modelling Microscopic X X X Free
PVT VISSIM Traffic Engineering, Urban Plan-
ning, Public Transport
Microscopic X 7 7 C250 (Student 3-
day pass)
MATSIM Large-scale agent-based trans-
port simulation
Microscopic X X X Free
AORTA Optimisation of autonomous
traffic at a city-wide scale
Microscopic X X X Free
TransModeler Traffic impact analysis, and sig-
nal optimisation
Microscopic X 7 X $12,000
PVT VISUM Public transport master plans,
construction, traffic engineering
Macroscopic X 7 7 C250 (Student 3-
day pass)
AIMSUN Traffic engineering, traffic sim-
ulation, transportation planning,
emergency evacuation planning
Microscopic X 7 7 N/A
Quadstone Param-
ics
Traffic modelling, traffic
analysing
Microscopic X 7 X N/A
Table 3.1: Traffic Simulation Software Considerations
SUMO is the chosen traffic simulation for this dissertation. It provides tools for OSM road net-
work conversion, tools for trip generations, route generations and is widely supported by an active
community on their forum (Mailing List for SUMO, 2017).
Page 40
Chapter 3. Design 27
3.1.2 OMNeT++
OMNeT++ is a modular, C++ network simulation and framework (Varga & Hornig, 2008). OM-
NeT++ includes an INET framework that allows for simulation of different network protocols. The
network protocol of concern is Mobile Ad-Hoc Networks (MANETs). VANET is a type of MANET
and is used for vehicular communications. The ability for inter-vehicular communications is vital for
this dissertation.
3.1.3 VEINS
Vehicles in Network Simulation (VEINS) is a simulation framework that tries to make the simu-
lation of vehicular communications as realistic as possible. VEINS is set up to interact with both
OMNeT++ and SUMO. As mentioned in section 3.1.1, SUMO simulates the traffic aspect of this
dissertation. OMNeT++ as mentioned in section 3.1.2 is a network simulator that handles vehicular
packet transmissions. A physical layer modelling toolkit MiXiM is used to enhance the simulation
further. MiXiM provides models that can accurately describe radio interference and the shadow-
ing of static and moving obstacles within the simulation. VEINS also sets up a running server for
inter-communications between OMNeT++ and SUMO to provide additional realism of vehicular net-
working.
3.1.4 Conclusion
Another reason that SUMO is chosen as the traffic simulator, is that it allows the use of VEINS.
VEINS can be seen as a framework that is capable of simulating VANET. For this reason, VEINS,
SUMO and OMNeT++ are chosen for this dissertation.
Page 41
Chapter 3. Design 28
3.2 Data
In this section, the obtained Dublin City traffic and parking data is discussed. The process of acquiring
the data is outlined, as well as its application in relation to this dissertation.
3.2.1 Dublin City Parking Information
The list below is a general overview and reason to why they are required. The following sections
explain the process of obtaining each set of parking data, on-street and off-street.
• Parking Area Geographic Coordinates: To simulate vehicles parking in areas that allow parking,
all Dublin on-street parking locations, as well as parking lot locations, must be known. The
coordinate locations are recorded so that vehicles may be able to calculate which parking areas
are closest to their final destination during the simulation.
• Parking Area Capacities: The parking space capacity of each parking lot and the on-street
location is recorded. The capacities are used to determine how full a parking area is throughout
the simulation process.
• Parking Area SUMO Road ID: The SUMO road identifiers must be recorded for each parking
area so that the vehicles may be routed to them. SUMO road identifiers are the only accepted
parameter for the function for routeing vehicles dynamically within the simulation.
On-Street Parking Information
data.gov.ie offers various datasets for transport data in Ireland (data.gov.ie — Ireland’s open data
portal, 2017). The most granular transport dataset regarding on-street parking locations is the parking
meters dataset (Parking Meter Dataset, 2017). It does not contain the precise locations of each parking
spot, but it has the locations of every parking meter within Dublin city. More specifically, the dataset
includes Irish grid reference coordinates of all parking meters as well as the number of on-street
parking spaces that they serve. Thus this dataset is sufficient for the purpose of this simulation. The
dataset is also substantial as it references all known parking meters in Dublin. The area of interest for
this dissertation is inner city Dublin parking areas. This can be visualised as the “yellow” and “red”
areas in terms of Dublin City Council (DCC) defined parking zones as shown in figure 3.1 (Dublin
Parking Zone Tariffs, 2017).
The resultant dataset within the concerned zones includes 175 on-street parking meters that serve
12,289 parking spaces. Each parking meter coordinate is formatted to an Irish coordinate reference
plane. For the data to be usable in this dissertation, they must be converted to the more commonly
used geographic coordinate system. Online tools are available to complete this conversion process.
Page 42
Chapter 3. Design 29
The SUMO road identifiers are obtained through a manual mapping process of each parking meter
through the SUMO GUI.
Figure 3.1: Dublin City Council Parking Zones Breakdown
Page 43
Chapter 3. Design 30
Off-Street Parking Information
There are 14 parking lots that this dissertation takes into account. Table 3.2 includes the 14 parking
lots and their capacities.
Car Park Capacity
Arnotts Department Store 500
Christ Church 212
ILAC Shopping Centre 1000
Parnell Street 500
Marlboro Street 567
Abbey Street 340
Thomas Street 230
Setanta 145
Trinity Street 252
Stephen’s Green 1127
Brown Thomas 380
Dawson Street 370
Jervis Shopping Centre 264
Table 3.2: Dublin Parking Lots and Capacities
Most of the car parks in Dublin are operated by QPark. Information regarding their capacities
are available on each of the corresponding QPark parking lot websites. Other car parks are operated
by the shopping centres that they serve and the capacities of them are listed on the corresponding
shopping centre websites.
The coordinates of each of the car park locations are recorded through Google Maps.
The SUMO road identifiers are obtained through a manual mapping process of each car park
through the SUMO GUI.
Page 44
Chapter 3. Design 31
3.2.2 Dublin Traffic Flows
Dublin City traffic flow is incorporated into the simulation to build a realistic model.
A visit was made to the Dublin City Councils’ traffic department to obtain this data. In most major
junctions in Dublin, inductive loops are embedded beneath the ground just before the junctions’ traffic
lights. The sensor can detect whether a vehicle is above it. The sensor also acts as a counter, thus
recording the amount of traffic that passes a particular lane on the road.
On some roads, there is a secondary sensor embedded into the ground further along the road. If
there is a stationary vehicle detected above the secondary sensor, the traffic control station knows that
that particular road segment has a traffic queue. At the time of writing, DCC traffic control centre
does not have a sophisticated self-optimising traffic queue management system.
The obtained traffic flow data contains hourly intervals of the number of vehicles that have passed
the junctions. The time interval of the data is from January 2016 through to December 2016. A subset
of the data can be found in Appendix A.
Table 3.3 lists the roads that Dublin traffic flow data is recorded from, along with their national
road identifier. The areas that they originate from are also included.
Road Name Road ID Areas Served
Amiens Street R105 Fairview / Clontarf / Marino
Constitution Hill R108 Phisboro / Glasnevin
East Wall Road R131 Dublin Port Tunnel / East Wall
High Street R810 Rialto / Inchicore
Mount Street Lower R118 Ballsbridge
Parnell Square East N/A Drumcondra / Whitehall
Patrick Street R137 Harold’s Cross
Pearse Street R802 Ringsend / Irishtown
Stephen’s Green East R138 Donnybrook
Victoria Quay R148 Chapelizod / Ballyfermot
Wexford Street R114 Rathmines / Ranelagh
Table 3.3: Dublin Traffic Flow Locations
Page 45
Chapter 3. Design 32
3.2.3 Dublin Parking Lot Data
Live Dublin parking lot data is publicly available through the DCC website. Parking lot data is
required to provide a realistic model on the occupancies of Dublin parking lots. The data is used to
pad the spaces of parking lots in the simulation.
Scrapy is a Python crawler for extracting data from websites (Scrapy - Python Crawler, 2017).
A cronjob is a scheduler that allows computing tasks to be run at a specified time interval (CronTab
Documentation, 2017). A cronjob is set up for the crawler to scrape the live Dublin parking lot site
every five minutes. The data is periodically saved to an SQLite database so that it can be extracted
later on and used in the simulation. A subset of the parking lot data can be found in Appendix B.
3.2.4 Dublin On-Street Parking Data
Dublin on-street parking data involves obtaining the average park times of Dublin drivers within the
city. ParkingTag is the on-street parking space operator for Dublin. A data dump of 30 anonymous
drivers throughout the year of 2016 was provided from ParkingTag. The data dump includes the price
that each driver paid as well as the zones that the drivers parked in. These zones are the same zones
listed on figure 3.1.
The price to park in the yellow zone is C2.90, and red zones are C2.40. Given the price paid by
a driver, their time duration spent parked can be calculated. This data is used to determine how long
a driver is parked for during the simulation. A subset of the parking tag data provided by ParkingTag
can be found in Appendix C.
Page 46
Chapter 3. Design 33
3.2.5 Unused Data
Before obtaining the on-street parking data from ParkingTag, an attempt was made to manually source
on-street parking behaviours of Dublin drivers. This involved observing a set amount of parking
spaces for a limited amount of time. The observations were performed on two separate occasions.
The initial observations were carried out on Drury Street. Table 3.4 the rates of drivers leaving (L)
and arriving (A) at parking spaces are shown. Another observation was conducted on South William
Street. Table 3.5 illustrates the parking spots occupancy rates.
Space 1 2 3 4 5 6 7
11:28 L - - - - - -
11:29 A - - - - - -
12:11 - - - - - L -
12:14 - - - - - A -
12:18 - - - - - - L
12:21 L - - - - - -
12:22 A - - - - - -
12:26 - - - - - L -
12:26 - - - - - - A
12:28 - - - - - A -
12:30 - L - - - - -
12:34 - A - - - - -
12:43 - - - - - L -
12:44 - L - - - - -
12:45 - - - - - - L
12:49 - - - - - A -
13:06 - - - - - L -
13:08 - A - - - - -
Table 3.4: Drury Street (18th of February)
Space 1 2 3 4 5 6
12:20 A - - - - -
12:23 - L - - - -
12:24 - A - - - -
12:25 - - - - L -
12:26 - - - - A -
12:29 - - L - - -
12:31 - - A - - -
12:59 - - L - - -
12:59 - - A - - -
13:08 - - - - L -
13:15 - - - - A -
13:17 - - - - L -
13:19 - - - - A -
13:51 - - - - - L
13:52 - - - - - A
Table 3.5: South William Street (28th of Febru-ary)
Page 47
Chapter 4
Implementation
In this chapter, the implementation process is explained in detail. The initial section explains the
process of acquiring a suitable road network representation of Dublin City. This is followed by a
section on the generation of traffic flow through tools supplied by SUMO. The third section details
the various datasets that have been extracted and their role in the simulation. The final section features
a thorough explanation of the implementation of a VANET smart parking model for the simulation.
4.1 Road network of Dublin
4.1.1 OpenStreetMaps + JOSM
OSM is a free world map editor. It is community driven and features a vast amount of geospatial
information. Maps can be extracted straight from the website. A bounding box is used to extract
the region of interest, and multiple APIs are available to download the necessary information within
the bounding box. Since the data within a bounding box of a large urban area can be substantial,
custom queries can also be made to omit unnecessary data. An example of this is to omit pedestrian
walkways, storefront data and recreational areas from the map download query.
Java OpenStreetMaps (JOSM) is an OSM map editor(JOSM, 2017). It is a tool for editing OSM
maps locally and is used to contribute to the update of an OSM. JOSM is useful for this dissertation
as there are some minor roads leading to parking lots that are not defined within an OSM map. An
example of this is the entrance to the Arnotts parking lot. JOSM is used to add the alley leading to
the entrance to the parking lot.
Another reason for choosing OSM maps is that SUMO directly supports OSM map conversion
for use within SUMO. NETCONVERT is a SUMO tool that translates an OSM .xml map file to
the supported SUMO format (SUMO, 2008). OSM maps consist of “ways” and “nodes”. “Ways”
represent each road within a map, and “nodes” represent the junctions where “ways” are connected.
34
Page 48
Chapter 4. Implementation 35
Through NETCONVERT, a SUMO formatted map can be generated. The result can be seen in
figure 4.1.
Figure 4.1: SUMO Converted OSM Map
Page 49
Chapter 4. Implementation 36
4.2 Route Generation
SUMO is a microscopic simulator as discussed in 3.1.1. Microscopic simulators allow for individual
vehicle simulation. SUMO supplies tools for trip and route generation for each vehicle. A python
script for generating random trips is available. The script can also take parameters for specific start
locations, the time to insert the vehicle into the simulation at, and the final destination of the routes.
4.2.1 Trips
Trips are defined as the start and end location of a vehicle. The random trips script is used to generate
vehicles’ random destinations. The script is a tool supplied by SUMO. Shown below is an example
command of the creation of trips starting from Amiens Street.
python /sumo/tools/randomTrips.py –trip-attributes=“departLane=“-4925959” -n net.net.xml
-b 0 -e 3600 -p 3.07955518 -o ./amiensSt.xml
The depart lane attribute is the SUMO road identifier for Amiens Street. The .net.xml file is
the road network file of Dublin. -b and -e indicate the start and end time of the simulation; this is
used if using SUMO as the standalone simulator. However, in this case, VEINS itself redefines the
simulation time when the VEINS simulation starts.
-p is the period in which vehicles are inserted into the simulation. The value for -p is calculated
as follows. From the traffic flow data acquired from DCC, given that 1,169 vehicles head inbound
via Amiens Street in one particular hour. By dividing an hour of simulation time, 3600, by a number
of vehicles inbound, the period interval of when a car should be inserted into the simulation can be
calculated. In this case, 3600/1169 would equate to inserting a vehicle every 3.07955518 simulation
time.
For each route mentioned in section 3.2.2, random trips are created. Each route is outputted into
a .xml file for further use in route generation.
4.2.2 Routes
Routes are generated with DUAROUTER, a SUMO tool that uses Dijkstra’s Shortest Path Algorithm
by default to compute the shortest route from the start and end location of a vehicle (DUAROUTER,
2017). Listed below is the command for route generation, with the trip files generated in section 4.2.1.
duarouter -n net.net.xml –ignore-errors true –trip-files “./amiensSt.xml, ./constitution-
Hill.xml, ...” -o routes.rou.xml
Page 50
Chapter 4. Implementation 37
The road network file is included via the “-n” parameter. Errors occur when DUAROUTER is
unable to find a path for a single trip within a trip file. This is suppressed by the “ignore-errors”
parameter. The trip files are included after the “trip-files” attribute, and an output file is referenced.
The result is a SUMO readable route file that details each vehicles’ routes.
4.3 Simulation Data
Various data is needed for the simulation to work. Most of the data is manually acquired through
SUMO Graphical User Interface (GUI) or translated and formatted from datasets acquired online.
Section 3.2 details the data that have been acquired from external sources. In this section, a list is
compiled of the formatted datasets that the simulation interacts with directly. An explanation of the
data, as well as their purpose within the simulation, is also included.
To note: There are minor differences between SUMO coordinates and OMNeT++ coordinates.
More specifically, the origin for the SUMO coordinate plane is in the top left corner, while the origin
of OMNeT++ coordinates is on the bottom left corner. In the succeeding sections, there are references
to both OMNeT++ and SUMO coordinates. VEINS supplies a function that allows for SUMO to
OMNeT++ coordinate conversions and it is often used during and before the simulation.
4.3.1 Parking Lot
OMNeT++ Coordinates
Explanation OMNeT++ coordinates of each parking lot. The coordinates are initially obtained
through the SUMO GUI and converted to OMNeT++ coordinates with a coordi-
nate conversion function supplied by VEINS. This is done separately from the
simulation process. The conversion took place pre-implementation and saved to
a file for further use.
Purpose OMNeT++ coordinates of each parking lot are used to calculate the closest park-
ing lot to a vehicles’ final destination.
SUMO Lane IDs
Explanation SUMO lane IDs for each parking lot. The lane IDs are obtained through SUMO
GUI.
Purpose The parking lot lane ID is where each parking lot is situated in the SUMO road
network. The lane ID is required to route a vehicle to the road that the parking lot
Page 51
Chapter 4. Implementation 38
is located. Additionally, it is the only accepted parameter for the vehicle routing
function.
Capacity Data
Explanation The data includes the capacities of each parking lot. The process of acquiring this
data is explained in section 3.2.1.
Purpose The parking lot capacities are used to calculate the percentage of available spaces
of a particular parking lot during the simulation.
Vacancy Data
Explanation Dublin parking lot data is obtained as explained in section 3.2.3. The data in-
cludes Dublin parking lot vacancies at a particular time.
Purpose Dublin parking lot vacancy data is used to populate the parking lot spaces upon
simulation initialization.
4.3.2 On-Street Parking
OMNeT++ Coordinates
Explanation OMNeT++ converted coordinates of each on-street parking location. The dataset
is obtained through the VEINS supplied SUMO to OMNeT++ coordinate con-
version function.
Purpose Used to calculate the distances between a vehicles’ final destination to the on-
street parking locations.
SUMO Lane ID
Explanation The SUMO lane ID for each on-street parking location. The lane IDs are obtained
through the SUMO GUI.
Purpose The SUMO lane ID is used to route the vehicles to the location of the on-street
parking location.
Capacity Data
Explanation The on-street parking capacities. The process of acquiring the data is explained
in section 3.2.1
Page 52
Chapter 4. Implementation 39
Purpose On-street capacities are used to calculate the percentage of available spaces for a
specific on-street parking location during the simulation.
Parking Times
Explanation The parking duration of drivers. The dataset is obtained through ParkingTag as
explained in section 3.2.4.
Purpose The parking duration of a driver is used to assign the wait time for a vehicle after
it has parked during the simulation.
4.3.3 Other
Final Destination Sectors
Explanation A finite list of the final destinations that the vehicles randomly choose during the
simulation.
Purpose The reason behind this is to localise the destination to a set region within inner
city Dublin.
All SUMO Lanes and Coordinates
Explanation This is a dataset of the SUMO lane ID and the SUMO coordinate of each road
within the Dublin road network. In other words, it is a subset of the road network
file generated through NETCONVERT mentioned in section 4.1.1.
Purpose The purpose of this dataset stems from the dataset of destination sectors. Despite
the localised randomness of the destination sectors, there was a need for more
granular destinations for each vehicle within the destination sectors defined. The
SUMO coordinates of a particular road are required to calculate the relative dis-
tance to the final destination sector, and the SUMO lane ID is used to assign the
vehicle to the location if the destination criteria hold true. This is explained in
detail in section 4.4.2.
Exit Lane ID
Explanation A finite list of the exit lane IDs. The lane IDs are chosen near the points where
the vehicles enter.
Page 53
Chapter 4. Implementation 40
Purpose The vehicles’ route is destined for a randomly selected exit location. The lane ID
is used after a vehicles’ parking duration is up.
4.4 VANET Modelling
In this section, the main implementation part of the VANET smart parking simulation is explained.
This section is split into three parts, the initialisation phase of the simulation is discussed in sec-
tion 4.4.1. Section 4.4.2 explains each vehicles’ initialisation upon entering the simulation. Finally,
section 4.4.3 details the actions of the simulation at every time step.
4.4.1 Simulation Initialisation
The simulation initialization stage involves setting static variables for the duration of the simulation.
This includes the allocation for all parking area capacities as well as the allocation of lane identifiers
for parking lots. The simulation initialization stage is run once per simulation.
Assign Parking Area Capacities
Parking space capacities are used to calculate the remaining percentage of spaces left in a parking
area during the simulation process. This involves both on-street and parking lot occupancy rates. A
dedicated global vector is used to store each parking area capacity. In this way, each vehicle entering
the simulation will be able to access the variable instead of accessing the parking space capacities file
every time.
4.4.2 Vehicle Initialisation
Upon initialization, a vehicle is assigned a function for the duration of the simulation. The initial step
is to determine whether or not the vehicle is destined to park. A random variable is introduced to
determine whether the vehicle is driving into the city to park, or passing through the city. The latter is
to simulate traffic flow within the city. When a vehicle is destined to park, it must determine whether
they seek an on-street parking space or to park in a parking lot. This is determined through the use of
another random variable.
Population of Parking Area Spaces
A local copy of the parking space availability of both on-street and parking lots are kept in each
vehicle. In the initial setup, vehicles’ parking lot data is updated with the data obtained through the
Page 54
Chapter 4. Implementation 41
DCC website as described in section 3.2.3. On-street parking spaces are padded with spaces. The
default setting for padding on-street parking spaces is set at 95%.
Setting Vehicles’ Final Destination
The initial design of the system used the random trip destinations generated in section 4.2.1. However,
an issue occurred when vehicles’ final destinations ended up at the edge of the map. This became a
problem as vehicles would traverse across the map, then proceed to search for the closest parking
areas. At times, the closest parking areas from the edge of the map would require the vehicles to drive
back towards the city. This is not a realistic scenario. Thus a solution of localising the randomness is
introduced. Destination sectors are introduced to narrow down the acceptable final destination regions
within inner city Dublin.
Destination Sectors Destination sectors are manually defined areas of inner Dublin City. Desti-
nation sectors are introduced to localise the randomness of the destinations. The idea of destination
sectors came about during implementation. Initially, the design included both RSU and sensors. The
sensors acted as nodes that supplied information regarding the occupancy status of a particular park-
ing spot. The sensors would relay the information to a RSU, and the RSU would relay information
to vehicles within their administrative region. These administrative regions eventually turned into the
destination sectors on figure 4.2. There are two main reasons as to why these sectors are chosen.
1. It covers all the on-street and parking lot areas that the simulation is concerned with. The areas
covered represent the “yellow” and “red” zones as defined by DCC as shown in figure 3.1.
2. To distribute the number of parking areas that each sector oversees evenly. More importantly,
that there is not one single sector that covers the majority of parking areas.
Figure 4.2 illustrates the defined destination sectors.
Page 55
Chapter 4. Implementation 42
Figure 4.2: Destination Sectors
11 destination sectors are defined. Each represented by a red dot within the black circles in figure
4.2. The black circles represent the coverage of each sector. After the vehicle has randomly chosen
one of the 11 destinations, the list of all known parking areas is iterated through to find the closest
parking areas to the vehicles’ destination. Whether a vehicle seeks an on-street parking location or in
a parking lot is defined beforehand as mentioned at the beginning of section 4.4.2
However, this method of choosing the closest parking areas proved too deterministic. A vehicle
choosing one of the red dots as seen in figure 4.2 would result in choosing identical closest parking
areas for each vehicle travelling to that sector. Thus, a second pass is introduced to provide a more
granular final destination allocator.
Granular Final Destination A vehicle assignment of a final destination from a finite list proved to
be too deterministic. By picking a sector, the returned results for the closest parking areas within that
sector will be identical to another vehicles’ who chose that sector. Thus, a second pass is introduced
to allow vehicle set a final destination that within the bounds of the destination sector that was initially
chosen.
Page 56
Chapter 4. Implementation 43
Figure 4.3: Granular Destinations
Figure 4.3 illustrates an example of the granular destinations that vehicles could discover. All
granular destinations are checked whether they lie within the bounds of the sectors.
Finding Closest Parking Areas
After a final destination for the vehicle is determined, a list of the closest parking areas relative to the
vehicles’ destination must be found. The process is as follows:
1. Acknowledge if the vehicle is destined for an on-street parking space or a parking lot.
2. Using the distance formula, calculate the distances to all parking areas from the vehicles’ final
destination.
3. When calculating the distances between the parking areas and the destination, query the vehi-
cles’ local copy of parking space availability for parking areas greater than 95% full.
4. If the parking areas are greater than 95% full, it is not likely that they will arrive at that location
and find a vacant parking space. Thus, these parking areas are discarded and not included in
the resultant list.
Page 57
Chapter 4. Implementation 44
5. Store the parking locations that are less than 95% full in a list.
6. Sort the list by ascending order so that the closest parking area is at the start of the list.
7. Trim the list and return the first ten parking areas.
8. The vehicle is now able to traverse through a list of the closest parking areas relative to their
final destination. This resultant list also factors in the knowledge of parking space vacancy
rates of the parking areas.
At this point, the vehicle can plan its route towards the closest parking area to their destination.
Upon arrival, the vehicle increments its local table of parking spaces and broadcasts this update to all
vehicles in its vicinity. If the parking area is full upon arrival, the vehicle re-routes to the next closest
parking area on their list.
4.4.3 At Every Time Step
This section explains what occurs at every time step of the simulation. Each vehicle does the following
at every time step:
1. A vehicle checks if they have arrived at their destined parking location. This is done simply by
checking that the road that they are currently on equals to their final destinations’ road identifier.
If the vehicle has arrived at their final destination, then the parking space of their local parking
tracker is incremented. An update message is broadcasted to other vehicles in their vicinity.
The simulation time of this update is also included in this message so that on receipt, other
vehicles may update their local copies if their local copies are outdated.
2. If they are not parked, then a message containing information regarding parking space avail-
ability is sent out. More specifically, this message contains their local parking area availability
data as well as the simulation time on which it was updated. When a vehicle receives a mes-
sage, it inspects the messages last updated time and updates its local copy of parking space
availabilities accordingly.
3. A table for parked vehicles is checked. A detailed explanation of this is in section 4.4.4.
This concludes the explanation of the occurrences at every time step.
4.4.4 Parking Duration
A small issue was discovered during the implementation phase of the simulation. SUMO removes
the vehicle from the simulation when the vehicle has reached the end of its route. In other terms, the
Page 58
Chapter 4. Implementation 45
vehicles are taken out of the simulation upon reaching its final destination. This became an issue as
vehicles would take up the parking space indefinitely.
The solution involves keeping a list of the parking areas that the vehicles are parked, as well as
the parking duration of the vehicle. At every time step, the list is checked for vehicles that have
stayed for the parking duration time. When a parking duration is up, a vehicle is inserted into the
simulation in the location that the previous vehicle was removed. The vehicle waits for an update
on parking space availability from other vehicles. Once it receives an updated version of the parking
space availabilities, the vehicle decrements its parking spot from its local copy and broadcasts the
message to vehicles within the vicinity.
4.4.5 Exit Route Planning
Vehicles are destined to exit after their parking duration is up. An exit road is chosen randomly from
a finite list. This is to simulate traffic heading outbounds as well as notifying vehicles in their vicinity
that the parking space is now vacant.
4.4.6 Baseline
For the baseline simulation scenario, the inter-vehicle communication functions are removed. Vehi-
cles define a final destination the same way as in the VANET model. A baseline vehicle travels to the
closest parking area to their final destination and checks if there are any spaces available only when
they arrive at the parking area. If the parking area is full, they iterate to the next closest parking are
to their final destination. This emulates the current real world parking situation where inter-vehicular
communications are not available.
Page 59
Chapter 5
Evaluation
In this section, the results obtained from the simulation efforts are analysed. VEINS includes an emis-
sion model for calculating the emissions per vehicle during the simulation progress. The emissions
are based on this study (Cappiello et al., 2002). The study was performed on two specific vehicles,
a 1994 Dodge Spirit and a 1992 Suzuki Swift. The emissions from this study are extracted and in-
tegrated into the emissions model by VEINS. This emissions model is used for the output of the
simulations in this dissertation.
The evaluation process takes two runs. One for the baseline and the second with a VANET smart
parking system.
5.1 Limitations
The main limitation to the evaluation of the simulation is the computing power required to complete
a simulation run. Numerous computers were used over the course of this dissertation. In this section,
a timeline of the process of running the simulations and their limitations is explained.
Initially, a personal MacBook Pro was used. VMWare allowed the installation of Ubuntu 16.04.
SUMO, VEINS and OMNeT++ was installed on the virtual machine. However, the MacBook Pro
began exhibiting random shut downs. The random shut downs persisted, attempts were made to try
and come to a resolution to the problem, but to no avail.
University computers in the computer science labs were then used for the simulations. However,
estimations made for the duration of one complete run of simulations was assumed to be much lower.
An attempt was made to scale down all the data; this included the parking spaces available, the
number of vehicles inserted into the simulation as well as the parking duration of vehicles. Attempts
were also made to run the simulation without the simulators’ GUI and through the Command Line
Interface (CLI). However, an estimation of the simulation duration to complete exceeded three weeks.
46
Page 60
Chapter 5. Evaluation 47
2 University VMs were then acquired to run the simulations. The VMs had to be set up and
Ubuntu, along with SUMO, VEINS and OMNeT++ were installed on them. All simulations were run
from the CLI. A list of the specifications of each machine used is outlined in section 5.3.
5.2 Simulation Data
In this section, the data loaded into the simulation runs are defined in tables 5.1 and 5.2.
In table 5.1, the parking lot spaces recorded on the 27th of February 2017 at 9:00am are shown.
The occupied spaces column is used to populate the parking lot tables in the simulation.
Parking Lot Available Spaces Total Occupied
Parnell 168 500 332
ILAC 940 1000 60
Jervis 741 750 9
Arnotts 298 500 202
Marlboro 357 567 210
Abbey 274 340 66
Thomas Street 217 220 3
Christchurch 11 212 223
Setanta 35 145 110
Dawson 183 370 187
Trinity Street 249 252 3
Stephens Green 779 1127 348
Drury 367 465 98
Brown Thomas 357 380 23
Table 5.1: Parking Lot Data in Simulation
In table 5.2, traffic flow data on the 29th of April 2016 at 9:00am are shown. The period columns
indicate the rate at which vehicles are inserted into the simulation for that specific street. The per-
centages indicate the scaled down rate. 0% period indicates that there is no scaling, whereas 90%
indicates that it is scaled down by 90%. Taking Amiens Street as an example, a count of 1,169 ve-
hicles per hour is recorded. When there is no scaling, this equates to inserting a single vehicle every
3.08 simulation time. When the simulation is scaled at 90%, then a single vehicle is inserted every
30.80 simulation time.
Page 61
Chapter 5. Evaluation 48
Street Traffic Flows Period (0%) Period (50%) Period (90%)
Amiens Street 1169 3.08 6.16 30.80
Constitution Hill 647 5.56 18.70 55.47
East Wall Road 1593 2.26 4.52 22.60
High Street 613 5.87 11.75 58.73
Mount Street Lower 775 4.65 9.29 46.45
Parnell Square East 1031 3.49 6.98 34.92
Patrick Street 737 4.88 9.77 48.85
Pearse Street 520 6.92 13.85 69.23
Stephen’s Green East 1344 2.68 5.36 26.79
Victoria Quay 968 3.72 7.44 37.19
Wexford Street 385 9.35 18.70 93.51
Table 5.2: Traffic Flow Data in Simulation
5.3 Simulation - Computer Specifications
Listed below are the computer system specifications of each of the mentioned machines used:
MacBook Pro
Processor 2.6GHz i7-4960HQ (8 cores)
RAM 16GB
Dell Optiplex 9020
Processor 3.6GHz i7-4790 (8 cores)
RAM 8GB
University VMs (x2)
Please note: 2 VMs were requested, the specifications listed below is for a single VM.
Processor Dual CPU “Intel(R) Xeon(R) CPU X5650 @2.67GHz”
RAM Dell R410 1U Servers with 32GB Ram
Page 62
Chapter 5. Evaluation 49
5.4 Simulation Results
In this section, the simulation results are shown. Three simulations are run in total. The first simula-
tion run is scaled by 50% on the Dell Optiplex 9020 college computers. The second simulation run is
scaled by 50% on the university VMs. The third simulation run is scaled by 90% on university VMs.
Only the baseline of simulation 3 managed to reach 100%. The list below is included in all scenarios
of each simulation. The list provides an explanation of each statistic.
• Progress: The progress that the simulation made until it was terminated
• Time taken: The time the simulation ran for
• Events processed: The number of events processed
• Machine: The simulation machine
• Traffic Data: The date and time of the traffic data
• Parking Lot Data: The date and time of the parking lot data
• On-Street Initial Population: Initial population of on-street parking spaces
• Parking Duration Scale: Percentage indicating by how much parking space duration times are
scaled down by
One of the evaluation metrics for this simulation is to compare the number of vehicles that had to
re-route due to a parking space being taken. This evaluation metric is only outputted when simulations
can reach 100%. Each simulation is set to run for 1800 simulation time, which equates to 30 minutes
in real time.
Page 63
Chapter 5. Evaluation 50
5.4.1 Simulation run #1
In simulation #1, all the relevant data is scaled by 50%.
Baseline
• Progress: N/A%
• Time taken: 2 days 18 hours
• Events processed: N/A
• Machine: Dell Optiplex 9020
• Traffic Data: 29th April 2016 - 9:00am
• Parking Lot Data: 27th February 2017 - 9:00am
• On-Street Initial Population: 95% Occupied
• Parking Duration Scale: 50%
0123456789101112131415161718192021222324252627282930313233343536373839404142434445464748495051525354555657585960616263646566676869707172737475767778798081828384858687888990919293949596979899100101
0
50
100
150
200
250
300
350
400
450
500
Vehicle ID
Em
issi
ons(
g/km
)
Average Emissions: 218.711648476g/km
Page 64
Chapter 5. Evaluation 51
VANET
• Progress: N/A%
• Time taken: 3 days 15 hours
• Events processed: N/A
• Machine: Dell Optiplex 9020
• Traffic Data: 29th April 2016 - 9:00am
• Parking Lot Data: 27th February 2017 - 9:00am
• On-Street Initial Population: 95% Occupied
• Parking Duration Scale: 50%
0123456789101112131415161718192021222324252627282930313233343536373839404142434445464748495051525354555657585960616263646566676869707172737475767778798081828384858687888990919293949596979899100101
0
50
100
150
200
250
300
350
400
Vehicle ID
Em
issi
ons(
g/km
)
Average Emissions: 175.389672828g/km
Conclusion
Both graphs of simulation #1 show the first 103 vehicles that entered their corresponding simulation.
Within the first 103 vehicles range, the VANET model resulted in fewer emissions. However, neither
simulations were able to finish. Thus the results are not comparable.
Page 65
Chapter 5. Evaluation 52
5.4.2 Simulation run #2
In simulation #2, all the relevant data is scaled by 50%.
Baseline
• Progress: 53%
• Time taken: 9 days 12 hours
• Events processed: ~400 million
• Machine: University VM
• Traffic Data: 29th April 2016 - 9:00am
• Parking Lot Data: 27th February 2017 - 9:00am
• On-Street Initial Population: 95% Occupied
• Parking Duration Scale: 50%
0123456789101112131415161718192021222324252627282930313233343536373839404142434445464748495051525354555657585960616263646566676869707172737475767778798081828384858687888990919293949596979899100101102103104105106107108109110111112113114115116117118119120121122123124125126127128129130131132133134135136137138139140141142143144145146147148149150151152153154155156157158159160161162163164165166167168169170171172173174175176177178179180181182183184185186187188189190191192193194195196197198199200201202203204205206207208209210211212213214215216217218219220221222223224225226227228229230231232233234235236
200
400
600
800
1,000
Vehicle ID
Em
issi
ons(
g/km
)
Average Emissions: 561.198626609g/km
Page 66
Chapter 5. Evaluation 53
VANET
• Progress: 10%
• Time taken: 4 days 9 hours
• Events processed: ~17 million
• Machine: University VM
• Traffic Data: 29th April 2016 - 9:00am
• Parking Lot Data: 27th February 2017 - 9:00am
• On-Street Initial Population: 95% Occupied
• Parking Duration Scale: 50%
0123456789101112131415161718192021222324252627282930313233343536373839404142434445464748495051525354555657585960616263646566676869707172737475767778798081828384858687888990919293949596979899100101102103104105106107108109110111112113114115116117118119120121122123124125126127128129130131132133134135136137138139140141142143144145146147148149150151152153154155156157158159160161162163164165166167168169170171172173174175176177178179180181182183184185186187188189190191192193194195196197198199200201202203204205206207208209210211212213214215216217218219220221222223224225226227228229230231232233234235236
0
100
200
300
400
Vehicle ID
Em
issi
ons(
g/km
)
Average Emissions: 175.149905231g/km
Conclusion
The gap between baseline and VANET models in simulation run #two are incomparable. The process
took too long, and a decision was made to terminate the simulations. The simulation is then re-scaled
and repeated for simulation #3.
Page 67
Chapter 5. Evaluation 54
5.4.3 Simulation run #3
In simulation #3, all the relevant data is scaled by 90%
Baseline
• Progress: 100%
• Time taken: 1d 10hr
• Events processed: ~7 million
• Machine: University VM
• Traffic Data: 29th April 2016 - 9:00am
• Parking Lot Data: 27th February 2017 - 9:00am
• On-Street Initial Population: 95% Occupied
• Parking Duration Scale: 90%
0123456789101112131415161718192021222324252627282930313233343536373839404142434445464748495051525354555657585960616263646566676869707172737475767778798081828384858687888990919293949596979899100101102103104105106107108109110111112113114115116117118119120121122123124125126127128129130131132133134135136137138139140141142143144145146
200
400
600
800
1,000
1,200
1,400
1,600
1,800
Vehicle ID
Em
issi
ons(
g/km
)
Average Emissions: 703.977383507g/km
Number of vehicles that had to re-route: 76 vehicles
Page 68
Chapter 5. Evaluation 55
VANET
• Progress: 100%
• Time taken: 1d 6hr
• Events processed: ~10 million
• Machine: University VM
• Traffic Data: 29th April 2016 - 9:00am
• Parking Lot Data: 27th February 2017 - 9:00am
• On-Street Initial Population: 95% Occupied
• Parking Duration Scale: 90%
0123456789101112131415161718192021222324252627282930313233343536373839404142434445464748495051525354555657585960616263646566676869707172737475767778798081828384858687888990919293949596979899100101102103104105106107108109110111112113114115116117118119120121122123124125126127128129130131132133134135136137138139140141142143144145
0
200
400
600
800
1,000
1,200
Vehicle ID
Em
issi
ons(
g/km
)
Average Emissions: 639.881142556g/km
Number of vehicle that had to re-route: 64 vehicles
Conclusion
The results show the 146 vehicles, with their completed time through the simulation. The average
emissions produced in the VANET model is observed to be less than that of the baseline model. As
well as this, the number of vehicles that had to be re-routed is also less. Despite the fact that the
Page 69
Chapter 5. Evaluation 56
results exhibit fewer vehicles required to re-route as well as fewer emissions produced, it should not
be concluded that VANET is the solution to smart parking. Additional runs should be simulated at
different traffic and parking levels.
The average of the baseline model is higher, with a handful of vehicles exceeding 1,400g/km.
This may be due to the greater number of vehicles that had to re-route.
Additionally, it should be noted that the traffic data and parking lot data are on different dates.
This is because the parking lot was not being recorded in 2016.
The Dublin real time parking lot site frequently contains parking lot that returns no data. Thus
the dataset that I have accumulated over the six months, starting January 2017, contains several blank
fields. I tried my best to find an hour that contains the most amount of data. An hours worth of data
is split into 5-minute intervals. There were some gaps in the data, so I interpolated values to obtain a
full set of parking data.
Page 70
Chapter 6
Conclusion
6.1 Future Works
The primary considerations for future works regarding this dissertation are to undergo more simula-
tion efforts. There are three main areas where additional work should be put into, these are explained
in the sections below.
Evaluation on Different Dates
Identical parking and traffic data are used for all three simulations in this dissertation. For future
works, evaluation should be done on different dates to avoid biased results. This consideration of
unbiased results was already acknowledged as parking and traffic data was acquired externally. The
traffic and parking datasets acquired externally span the course of one year, from January 2016 to
December 2016.
An initial plan was to simulate more than one date. However, there was a naive expectation that
the simulations would run within a week.
Evaluation Averaging
I realise that I have designed the simulation in a non-deterministic manner. The inputs to the simu-
lation are constant. However, vehicles decide their final destinations in a non-deterministic way. For
this reason, the evaluation comparison between one specific VANET model with a baseline model is
not entirely accurate.
In future works, along with additional evaluations on different dates as outlined above. An ag-
gregation of each VANET simulation scenario can be averaged and compared to an average of all the
baseline simulation scenarios.
57
Page 71
Chapter 6. Conclusion 58
Simulation Optimisation
The computational power required to run the simulations is very high. To define a region of interest to
simulate is regarded as one of the top solutions in easing the computations required for a simulation
to run. However, given that this dissertation is based on Dublin Inner City, it is not possible to make
the simulation region of interest any more granular.
In my design of the VANET model, the vehicles are inserted into the simulation solely from roads.
A future alteration could be to insert vehicles from parking areas too. In the current implementation,
it takes an extended period to simulate the first vehicle to leave a parking spot. This is due to vehicles
only being inserted from the roads. This could be avoided; the simulation could start when a vehicle
leaves a parking spot by inserting vehicles from parking areas from the beginning. In this way, the
initial process of waiting for vehicles to fill the city can be avoided.
6.2 Reflection
Smart parking technology has its limits. The cost of deployment for smart parking systems can be
substantial, especially when parking sensors are required to be installed in every known parking spot
location. Additionally, a system that oversees these sensors is also required for the deployment of
a such a system. The undeniable costs of deployment may deter governments from introducing this
system into cities. This is part of the motivation behind exploring various parking space sensing
technologies to compile an updated list of alternative sensing solutions.
Sensing parking spaces are one side of the coin, the other side is to introduce a robust system to
disseminate the data efficiently and effectively. One of the core related works examined in section
2.2.2 forms the basis of exploring futuristic solutions for data dissemination. Notably, VANET is an
increasingly popular field. With the recent introduction of autonomous vehicles, it would be highly
unlikely that VANET would not have a major role in the development of self-driving vehicles in the
future.
Concerns are raised regarding the computational power required on OBUs of vehicles. This
specific field is only starting to mature, as the considerations put forward regarding inter-vehicular
communications has not yet been made a reality. Despite this, considerations have already been
explored regarding how a VANET architecture should be formed. The questions raised is, whether
inter-vehicular communications should be solely dedicated to vehicles on the road, or should RSUs
act as gateways to a public cloud that serves information to vehicles that support networking, or
should there be a hybrid cloud model to satisfy both ends as we head into uncharted territories.
As outlined in the introduction to this dissertation, main motivations to smart parking are to
minimise drivers from cruising around looking for spaces. From an environmental perspective, this
is vital to sustain good air quality in urban districts. The European Union (EU) have provided targets
Page 72
Chapter 6. Conclusion 59
for the year 2020 for all EU members. One of those targets is a 20% reduction of non-emission
trading scheme sector emissions on 2005 levels (Pereira et al., 2005). However, according to the
Environmental Protection Agency (EPA) of Ireland (Gas & Projections, 2017), by 2020, Ireland is
projected to be 4% - 6% below 2005 levels. This is very low in comparison to the requirement of
20% by 2020. Although it does not look hopeful for Ireland to reach its targets by then, it would help
to contribute towards the goal in any way possible, achieved or not.
This concludes this dissertation. Thanks for reading.
Page 73
References
Amato, G., Carrara, F., Falchi, F., Gennaro, C., Meghini, C., & Vairo, C. (2017). Deep learning for
decentralized parking lot occupancy detection. Expert Systems with Applications, 72, 327–334.
doi: 10.1016/j.eswa.2016.10.055
ANPR SmartParking. (2017). Retrieved from https://www.smartparking.com/
automatic-number-plate-recognition-anpr
Brezmes, T., Gorricho, J. L., & Cotrina, J. (2009). Activity recognition from accelerometer data
on a mobile phone. Lecture Notes in Computer Science (including subseries Lecture Notes in
Artificial Intelligence and Lecture Notes in Bioinformatics), 5518 LNCS(PART 2), 796–799. doi:
10.1007/978-3-642-02481-8{\ }120
Cappiello, A., Chabini, I., Nam, E., Lue, A., & Zeid, A. (2002). A Statistical Model of Vehicle Emis-
sions and Fuel Consumption. Intelligent Transportation Systems, 2002. Proceedings.(September),
801–809.
Cardiff SmartParking. (2017). Retrieved from https://www.smartparking.com/
keep-up-to-date/press-releases/cardiff-city-council-set-to-unveil
-europe-s-first-citywide-deployment-of-bay-sensor-technology
Cho, J., Park, J., Baek, U., Hwang, D., Choi, S., Kim, S., & Kim, K. (2016). Automatic parking
system using background subtraction with CCTV environment international conference on con-
trol, automation and systems (ICCAS 2016). In 2016 16th international conference on control,
automation and systems (iccas) (pp. 1649–1652). doi: 10.1109/ICCAS.2016.7832520
CNR-EXT. (2017). Retrieved from http://claudiotest.isti.cnr.it/park
-datasets/CNR-EXT/models/
CronTab Documentation. (2017). Retrieved from https://help.ubuntu.com/community/
CronHowto
data.gov.ie — Ireland’s open data portal. (2017). Retrieved from https://data.gov.ie/
data
60
Page 74
References 61
Dokur, O., Katkoori, S., & Elmehraz, N. (2016). Embedded system design of a real-time parking
guidance system. In 2016 annual ieee systems conference (syscon) (pp. 1–8). Retrieved from
http://ieeexplore.ieee.org/document/7490653/ doi: 10.1109/SYSCON.2016
.7490653
DUAROUTER. (2017). Retrieved from http://sumo.dlr.de/wiki/DUAROUTER
Dublin Parking Zone Tariffs. (2017). Retrieved from http://www.dsps.ie/zones map.pdf
Eltoweissy, M., Olariu, S., & Younis, M. (2010). Towards autonomous vehicular clouds: A position
paper (Invited paper). Lecture Notes of the Institute for Computer Sciences, Social-Informatics and
Telecommunications Engineering, 49 LNICST , 1–16. doi: 10.1007/978-3-642-17994-5{\ }1
Gas, G., & Projections, E. (2017). EPA 2017 GHG Emission Projections Re-
port Ireland’s Greenhouse Gas Emission Projections EPA 2017 GHG Emission Projec-
tions Report Overview of Ireland’s Greenhouse Gas Emission Projections (Tech. Rep. No.
April). Retrieved from http://www.epa.ie/pubs/reports/air/airemissions/
ghgprojections/EPA 2017 GHG Emission Projections Summary Report.pdf
Gavin, K. (2008). Bay-Specific Parking Guidance Information System Installed At Dundrum Town
Centre (Tech. Rep.). Retrieved from http://www.agkdisplays.com/wordpress/wp
-content/uploads/2013/02/Dundrum-Article.pdf
Gerla, M., Lee, E.-K., Pau, G., & Lee, U. (2014). Internet of vehicles: From intelligent grid to
autonomous cars and vehicular clouds. 2014 IEEE World Forum on Internet of Things (WF-IoT),
46, 241–246. doi: 10.1109/WF-IoT.2014.6803166
Guille, C., & Gross, G. (2009). A conceptual framework for the vehicle-to-grid (V2G) implementa-
tion. Energy Policy, 37(11), 4379–4390. doi: 10.1016/j.enpol.2009.05.053
Gupta, S., & Upadhyaya, V. (2016). Automated vehicle detection using optical fiber communication.
In 2016 ieee sensors (pp. 1–3). doi: 10.1109/ICSENS.2016.7808495
Hussain, R., Son, J., Eun, H., Kim, S., & Oh, H. (2012). Rethinking Vehicular Communi-
cations: Merging VANET with cloud computing. CloudCom 2012 - Proceedings: 2012 4th
IEEE International Conference on Cloud Computing Technology and Science, 606–609. doi:
10.1109/CloudCom.2012.6427481
JOSM. (2017). Retrieved from https://josm.openstreetmap.de/
Page 75
References 62
Kianpisheh, A., Mustaffa, N., Limtrairut, P., & Keikhosrokiani, P. (2012). Smart Parking System
(SPS) architecture using ultrasonic detector. International Journal of Software Engineering and its
Applications, 6(3), 51–58.
Kiess, W., Rybicki, J., & Mauve, M. (2007). On the nature of Inter-Vehicle Communication. Commu-
nication in Distributed Systems (KiVS), 2007 ITG-GI Conference, 1–10. Retrieved from http://
ieeexplore.ieee.org/xpl/articleDetails.jsp?tp=&arnumber=5755516
Kopeck, J., & Domingue, J. (2012). PARKJAM: Crowdsourcing Parking Availability Information
with Linked Data (Demo). N/A. doi: 10.1007/978-3-662-46641-4
Krajzewicz, D., Erdmann, J., Behrisch, M., & Bieker, L. (2012, 12). Recent Development and
Applications of {SUMO - Simulation of Urban MObility}. International Journal On Advances in
Systems and Measurements, 5(3), 128–138.
Krizhevsky, A., Sutskever, I., & Hinton, G. E. (2012). ImageNet Classification with Deep Con-
volutional Neural Networks. Advances In Neural Information Processing Systems, 1–9. doi:
http://dx.doi.org/10.1016/j.protcy.2014.09.007
Kuhn, T. S. (1970). The Structure of Scientific Revolutions (Vol. II) (No. 2). doi: 10.1119/1.1969660
Lee, S., Yoon, D., & Ghosh, A. (2008). Intelligent parking lot application using wireless sensor
networks. 2008 International Symposium on Collaborative Technologies and Systems, 48–57. doi:
10.1109/CTS.2008.4543911
Lin, X., Lu, R., Zhang, C., Zhu, H., Ho, P.-H., & Shen, X. (2008). Security in vehicular
ad hoc networks. IEEE Communications Magazine, 46(4), 88–95. Retrieved from http://
ieeexplore.ieee.org/xpl/articleDetails.jsp?arnumber=4481346 doi: 10
.1109/MCOM.2008.4481346
Mailing List for SUMO. (2017). Retrieved from https://sourceforge.net/p/sumo/
mailman/sumo-user/
Mehmood, A., Ahmed, S. H., & Sarkar, M. (2017). Cyber-Physical Systems in Vehicular Communi-
cations. Springer. doi: 10.4018/978-1-5225-0773-4.ch015
Milanes, V., Villagra, J., Godoy, J., Simo, J., Perez, J., & Onieva, E. (2012). An intelligent V2I-based
traffic management system (Vol. 13) (No. 1). doi: 10.1109/TITS.2011.2178839
Millard-Ball, A., Weinberger, R. R., & Hampshire, R. C. (2014). Is the curb 80% full or 20% empty?
Assessing the impacts of San Francisco’s parking pricing experiment. Transportation Research
Page 76
References 63
Part A: Policy and Practice, 63, 76–92. Retrieved from http://dx.doi.org/10.1016/
j.tra.2014.02.016 doi: 10.1016/j.tra.2014.02.016
Miller, H. J., & Shaw, S.-L. (2001). Geographic Information Systems for Transportation. Oxford
University Press.
Na, K., Kim, Y., & Cha, H. (2009). Acoustic sensor network-based parking lot surveillance system.
Lecture Notes in Computer Science (including subseries Lecture Notes in Artificial Intelligence and
Lecture Notes in Bioinformatics), 5432 LNCS, 247–262. doi: 10.1007/978-3-642-00224-3{\ }16
Ono, S., Kagesawa, M., & Ikeuchi, K. (2002). A probe car for parking-vehicle detection by using laser
range sensor. In Intelligent vehicle symposium, 2002. ieee (Vol. 2, pp. 322–327). doi: 10.1109/
IVS.2002.1187972
Pala, Z., & Inanc, N. (2007). Smart parking applications using RFID technology. In Rfid eurasia,
2007 1st annual (pp. 1–3). doi: 10.1109/RFIDEURASIA.2007.4368108
Panayappan, R., & Trivedi, J. (2007). VANET-based approach for parking space availability. Pro-
ceedings of the fourth . . . , 75–76. Retrieved from http://dl.acm.org/citation.cfm
?id=1287763 doi: 10.1145/1287748.1287763
Parking Meter Dataset. (2017). Retrieved from https://data.gov.ie/dataset/parking
-meters-location-tariffs-and-zones-in-dublin-city
ParkPnp. (2015). Retrieved from https://parkpnp.com/
Pereira, C. S., Luıs, O., & Quelhas, G. (2005). Overview of Europe 2020 targets (Vol. 1; Tech. Rep.
No. April).
PKLot. (2017). Retrieved from http://web.inf.ufpr.br/vri/news/parking-lot
-database
RFID SmartParking. (2017). Retrieved from https://www.smartparking.com/
technologies/rfid-solutions
Robert C. Hampshire. (2011). Smart Parking. Retrieved from http://eldigital.bcn.cat/
es/barcelona-despliega-el-primer-smart-parking-en-las-corts
107139.html
Schlote, A., King, C., Crisostomi, E., & Shorten, R. (2014). Delay-tolerant stochastic algorithms for
parking space assignment (Vol. 15) (No. 5). doi: 10.1109/TITS.2014.2304356
Page 77
References 64
Scrapy - Python Crawler. (2017). Retrieved from https://scrapy.org/
Sensors SmartParking. (2017). SmartParking Limited. Retrieved from https://
www.smartparking.com/technologies/in-ground-vehicle-detection
-sensors
SFMTA. (2011). San Francisco Park (SFPark). Retrieved from http://sfpark.org/
Shoup, D. C. (2006). Cruising for parking. Transport Policy, 13(6), 479–486. doi: 10.1016/
j.tranpol.2006.05.005
Shriver, A. (2016). Understanding the Block-Level Price Elasticity of On-Street Parking Demand :
A Case Study of San Francisco ’ s SFpark Project (Doctoral dissertation). doi: 10.13140/RG.2.1
.2046.8089
Sugiyamal, Y., Fukui, M., Kikuchi, M., Hasebe, K., Nakayama, A., Nishinari, K., . . . Yukawa, S.
(2008). Traffic jams without bottlenecks-experimental evidence for the physical mechanism of the
formation of a jam. New Journal of Physics, 10. doi: 10.1088/1367-2630/10/3/033001
SUMO. (2008). NETCONVERT. Retrieved from http://sumo.dlr.de/wiki/NETCONVERT
Suykens, J. A. K., & Vandewalle, J. (1999). Least Squares Support Vector Machine Classifiers.
Neural Processing Letters 9, 9(3), 293–300. doi: 10.1023/A:1018628609742
Ucar, S., Ergen, S. C., & Ozkasap, O. (2016, 12). Security vulnerabilities of IEEE 802.11p and
visible light communication based platoon. In 2016 ieee vehicular networking conference vnc (pp.
1–4). doi: 10.1109/VNC.2016.7835972
Varga, A., & Hornig, R. (2008). AN OVERVIEW OF THE OMNeT++ SIMULATION ENVIRON-
MENT. Proceedings of the First International ICST Conference on Simulation Tools and Tech-
niques for Communications Networks and Systems. doi: 10.4108/ICST.SIMUTOOLS2008.3027
Verroios, V., Efstathiou, V., & Delis, A. (2011). Reaching available public parking spaces
in urban environments using ad hoc networking (Vol. 1) (No. 1). Retrieved from http://
ieeexplore.ieee.org/xpl/articleDetails.jsp?arnumber=1443594 doi: 10
.1109/MDM.2011.49
Villanueva, F. J., Villa, D., Santofimia, M. J., Barba, J., & Lopez, J. C. (2016). Crowdsensing smart
city parking monitoring. IEEE World Forum on Internet of Things, WF-IoT 2015 - Proceedings,
751–756. doi: 10.1109/WF-IoT.2015.7389148
Page 78
References 65
Wang, H., & He, W. (2011). A reservation-based smart parking system. 2011 IEEE Conference
on Computer Communications Workshops, INFOCOM WKSHPS 2011, 690–695. doi: 10.1109/
INFCOMW.2011.5928901
Want, R. (2006). An Introduction to RFID. IEEE CS and IEEE ComSoc, 25–33.
Westminster SmartParking. (2013). Retrieved from https://www.smartparking.com/
keep-up-to-date/press-releases/smart-parking-secures-landmark
-westminster-city-council-contract-for-its-real-time-bay-sensor
-parking-solution
Whaiduzzaman, M., Sookhak, M., Gani, A., & Buyya, R. (2014). A survey on vehicular cloud
computing. Journal of Network and Computer Applications, 40(1), 325–344. doi: 10.1016/j.jnca
.2013.08.004
Xu, B., Wolfson, O., Yang, J., Stenneth, L., Yu, P. S., & Nelson, P. C. (2013). Real-time street parking
availability estimation. In Proceedings - ieee international conference on mobile data management
(Vol. 1, pp. 16–25). doi: 10.1109/MDM.2013.12
Page 79
Appendix
Appendix A
On Friday, 29th April 2016. Each approach represents each route entering that junction.
Time Approach 1 Approach 2 Approach 3 Approach 4 Approach 5 Approach 6
01:00 63 70 114 46 71 364
02:00 59 42 65 20 25 211
03:00 32 20 40 16 12 120
04:00 31 29 41 19 11 131
05:00 18 24 39 15 60 156
06:00 44 50 61 21 47 223
07:00 74 114 265 87 103 643
08:00 135 271 354 110 184 1054
09:00 150 348 341 82 169 1090
10:00 194 315 294 84 187 1074
11:00 155 252 285 63 166 921
12:00 149 248 282 81 163 923
13:00 156 265 331 90 156 998
14:00 171 255 288 90 161 965
15:00 139 280 325 81 178 1003
16:00 157 300 340 88 155 1040
17:00 207 272 310 94 150 1033
18:00 207 296 289 88 115 995
19:00 146 216 341 89 118 910
20:00 163 221 304 79 154 921
21:00 161 172 232 72 159 796
22:00 133 127 190 54 142 646
23:00 113 112 147 63 129 564
24:00 91 87 145 55 93 471
66
Page 80
References 67
Appendix B
Spaces available on Monday, 27th of February 2017. Each row separated in two minute intervals.
PN IL JR AR MA AB TH CC SE DW TR GR DR BT
168 940 741 298 357 274 217 115 35 183 255 779 367 357
161 936 733 296 353 274 217 111 34 180 255 776 365 355
161 936 733 296 353 274 217 111 33 180 255 776 365 355
161 936 733 296 353 274 217 111 32 180 255 776 365 355
147 933 722 294 347 269 216 107 31 173 247 759 359 353
138 930 716 293 343 266 215 107 30 172 245 755 353 353
138 930 716 293 343 266 215 107 30 172 245 755 353 353
138 930 716 293 343 266 215 107 30 172 245 755 353 353
129 920 707 292 338 262 215 103 29 177 242 753 350 351
129 920 707 292 338 262 215 103 29 177 242 752 350 351
129 920 707 292 338 262 215 103 29 177 242 746 350 351
121 918 699 291 336 261 215 100 28 178 238 743 346 350
121 918 699 291 336 261 215 100 28 178 238 732 346 350
112 910 691 288 330 257 212 99 28 178 236 728 340 349
112 910 691 288 330 257 212 99 28 178 236 728 340 349
112 910 691 288 330 257 212 99 28 178 236 728 340 349
105 909 686 287 325 256 211 96 24 177 230 717 339 348
105 909 686 287 325 256 211 96 24 177 230 717 339 348
105 909 686 287 325 256 211 96 24 177 230 717 339 348
98 901 681 285 318 257 209 92 21 174 228 709 335 347
91 895 671 283 308 254 208 90 19 171 224 699 334 346
91 895 671 283 308 254 208 90 19 171 224 699 334 346
91 895 671 283 308 254 208 90 19 171 224 699 334 346
83 885 662 279 304 249 208 86 18 165 223 688 326 343
83 885 662 279 304 249 208 86 18 165 223 688 326 343
83 885 662 279 304 249 208 86 18 165 223 688 326 343
68 873 650 279 300 247 208 85 13 155 223 682 314 341
68 873 650 279 300 247 208 85 13 155 223 675 314 341
64 866 647 275 295 247 208 83 10 153 218 669 311 340
64 866 647 275 295 247 208 83 10 153 218 669 311 340
PN: Parnell, IL: ILAC, JR: Jervis, AR: Arnotts, MA: Marlborough, AB: Abbey, TH: Thomas, CC:
Christchurch, SE: Setanta, DW: Dawson, TR: Trinity, GR: RCS, DR: Drury, BT: Brown Thomas
Page 81
References 68
Appendix C
Date Amount Zone Customer
15/11/2016 11:50 1.60 Red Driver 1
07/03/2016 13:04 4.35 Yellow Driver 5
21/06/2016 13:23 1.45 Yellow Driver 6
16/11/2016 08:58 3.87 Yellow Driver 8
11/11/2016 12:51 2.00 Red Driver 10
19/01/2016 15:20 1.45 Yellow Driver 11
30/01/2016 15:19 2.42 Yellow Driver 12
07/01/2016 11:40 1.20 Red Driver 13
21/06/2016 11:47 1.60 Red Driver 13
14/01/2016 12:47 1.69 Yellow Driver 13
30/03/2016 12:59 0.97 Yellow Driver 13
25/05/2016 10:04 1.93 Yellow Driver 13
25/07/2016 11:01 2.90 Yellow Driver 13
24/10/2016 11:18 1.93 Yellow Driver 13
22/11/2016 12:51 1.45 Yellow Driver 13
06/01/2016 10:57 1.45 Yellow Driver 14
14/09/2016 11:51 2.90 Yellow Driver 14
24/05/2016 14:04 1.21 Yellow Driver 15
08/10/2016 14:34 0.97 Yellow Driver 16
24/10/2016 13:52 2.17 Yellow Driver 17
24/02/2016 12:21 2.40 Red Driver 21
01/06/2016 15:00 1.20 Red Driver 24
16/05/2016 11:10 2.90 Yellow Driver 25