49


Copyright
By
Matthew Van Grinsven
2015

Glaciogenic, Geomorphic, And Insolation Effects During Mis 2 On The Lacustrine
Sediment Flux Of Tulare Lake, California
By
Matthew Van Grinsven, M.S.
A Thesis Submitted to the Department of Geological Sciences,
California State University Bakersfield
In Partial Fulfillment for the Degree of
Masters of Petroleum Geology
Fall 2015
Van Grinsven ���iii
Glaciogenic, Geomorphic, And Insolation Effects During Mis 2 On The Lacustrine
Sediment Flux Of Tulare Lake, California By Matthew Van Grinsven
This thesis or project has been accepted on behalf of the Department of Geological Sciences by their supervisory committee:
___________________________________________________________________________Dr. Robert Negrini Committee Chair
___________________________________________________________________________Dr. Adam Guo
___________________________________________________________________________Dr. Matthew Kirby
Van Grinsven ���x
ACKNOWLEDGEMENTS
This work would not be possible without the invaluable guidance and expertise of my
advisor, Dr. Robert Negrini, as well as insightful comments from committee advisors, Dr.
Matthew Kirby and Dr. Adam Guo. Funding was provided NSF grants HRD#1137774 and
EHR#030332,. I am grateful to B. Jackson, R. Jimenez, H. Holt, G. Kaur, L. Medina, R.
McGuire, B. Oliver, J. Reagan, L. Rubi, C. Rivas, N. Velasco, Ja. Wilson, and Jo. Wilson for
their help running samples. K. Padilla and E. Powers provided help with maintaining
laboratory instruments and supplies. J. Loisel provided advise regarding the Bacon Age
Modeling software.

Van Grinsven ���xi
ABSTRACT
Ever since the MIS 2 glacial maximum, Tulare Lake, CA, has been the terminus of four of
the largest rivers from the southern Sierra Nevada Mountains and hydrologic modeling has
shown that its surface elevation is a good gauge of Sierran stream discharge. Here we extend
the relative paleolake-level record of Tulare Lake from the TL05-4 cores back to ~26 cal ka
BP. Proxy data from these cores include magnetic susceptibility, grain size, total inorganic
and organic carbon, and carbon-nitrogen ratios. To some extent, these data covary and based
on comparisons of the Holocene part of this record with earlier trench sample-based lake-
level records, they reflect relative lake level. The earliest part of the record shows that Tulare
Lake experienced a sharp increase in lake level, possibly associated with the Dansgaard-
Oeschger Event 2 or an increase in spill over elevation caused during periods of glacial
advance. Evidenced by the gradually decreasing clay content, lake-level gradually decreased
during the Tioga Glaciation (25-15 cal ka BP). This may have been caused by decreased
summer precipitation and winter precipitation that was sequestered in the snowpack. During
the late Tioga Glaciation, large amounts of runoff from the melting glaciers and addition of
water from the Kings River filled the lake and significantly increase the sill height of the fan
dam (18.6-15 cal ka BP) to more or less present elevations. After this, Tulare Lake stabilized
and varied in conjunction primarily due to changes in sea surface temperatures. Correlations
can be drawn between the new results shown here, to insolation, and to changing lake
conditions of other lakes within California. This argues that the entire region is sensitive to
insolation.

Van Grinsven ���xii
TABLE OF CONTENTS
Acknowledgements…………………………………………………………………………x
Abstract…………………………………………………………………………………….xi
Table of Contents………………………………………………………………………….xii
List of Figures…………………………………………………………………………..…xiv
Introduction………………………………………………………………………….…..….1
Regional and Geologic Setting……………………………………………………..4
Methods……………………………………………………………………………………...7
Results and Observations…………………………………………………………………10
Age Control…………………………………………………………….……..……10
Lithology……………………………………………………………….……..……10
Sediment Analyses and Interpretations………………………………………….11
Summary of Observations and Interpretations…………………………………13
Earliest Pleistocene; 26-24.7 cal ka BP; Zone 1………………………………..….13
Early Late Pleistocene; 24.7-21.7 cal ka BP; Zone 2………………………..……..14
Middle Late Pleistocene; 21.7-17.6 cal ka BP; Zone 3…………………………….14
Late Pleistocene; 17.6-14.6 cal ka BP; Zone 4…………………………………….15
Pleistocene/Holocene Transition; 14.6-12.0 cal ka BP; Zone 5……………………16
Discussion………………………………………………………………………………….16
Physical Linkage between climate forcing and system response……………….16
Comparisons with other North Atlantic lacustrine records……………….……19
Divergent responses of Tulare and Mono Lakes………………………………...20
Conclusions………………………………………………………………………………..21

Van Grinsven ���xiii
References…………………………………………………………………………………22
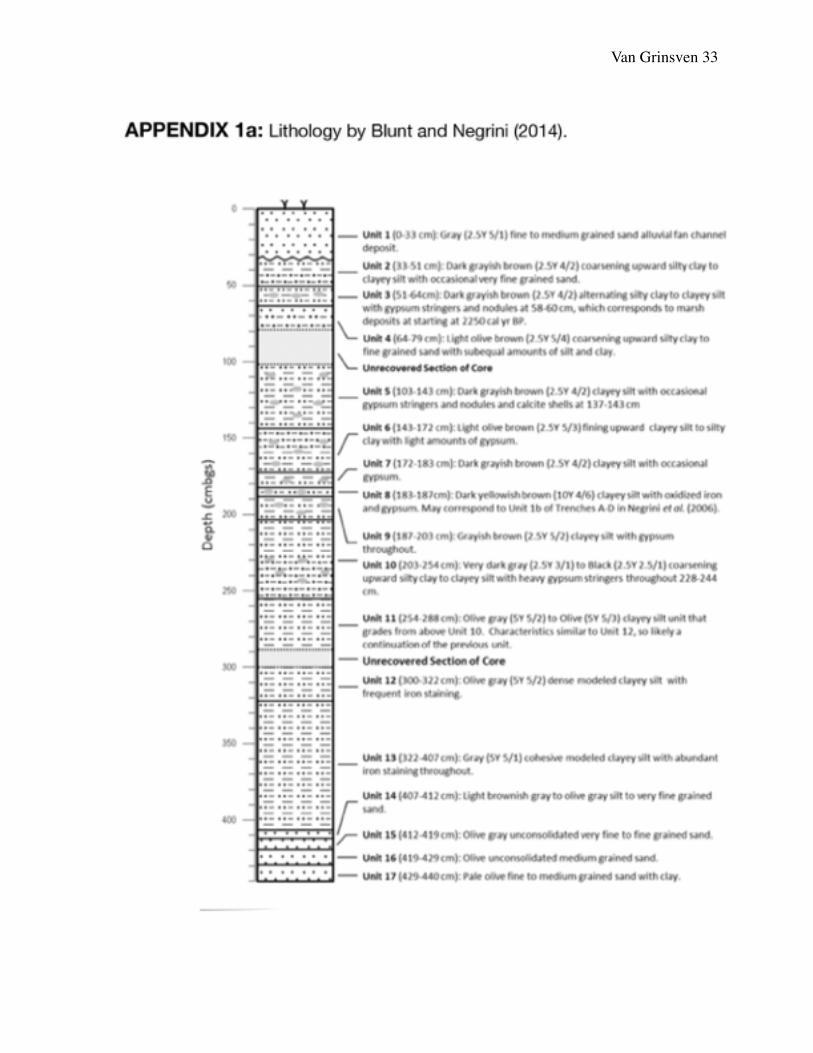
Appendix 1a……………………………………………………………………………….33
Lithology by Blunt and Negrini (2014)
Appendix 1b………………………………………………………………………………34
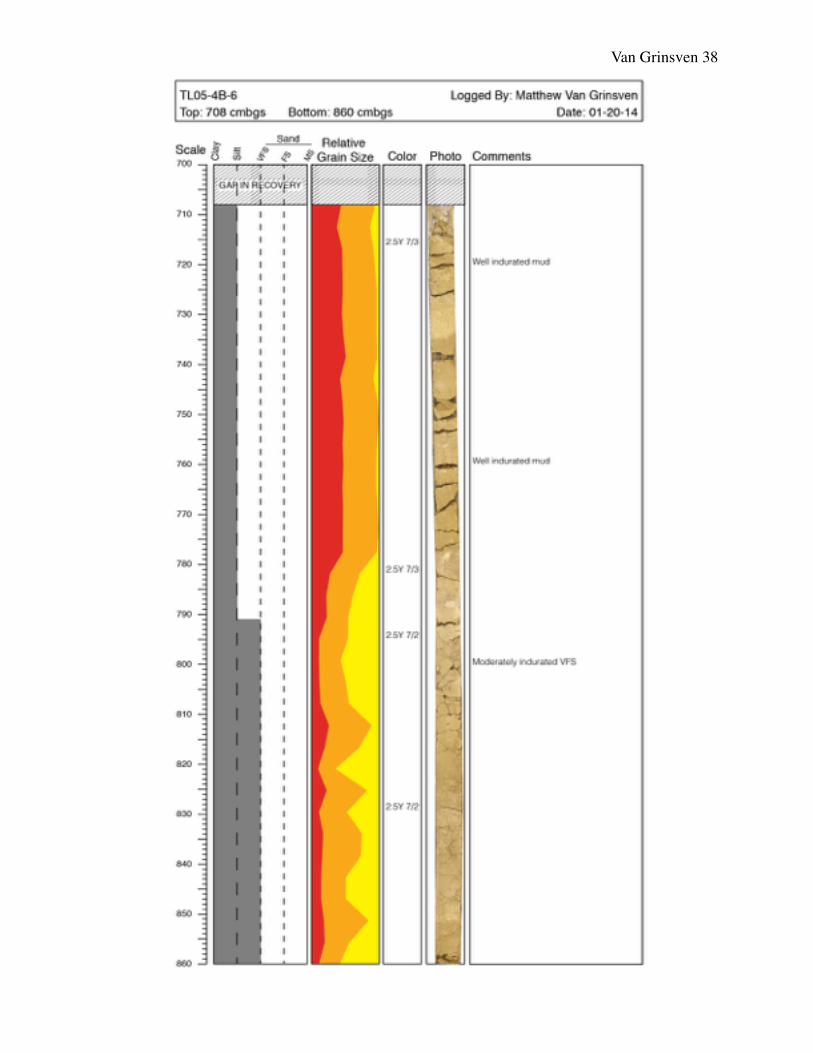
Lithology described by this study
Appendix 2a………………………………………………………………………………39
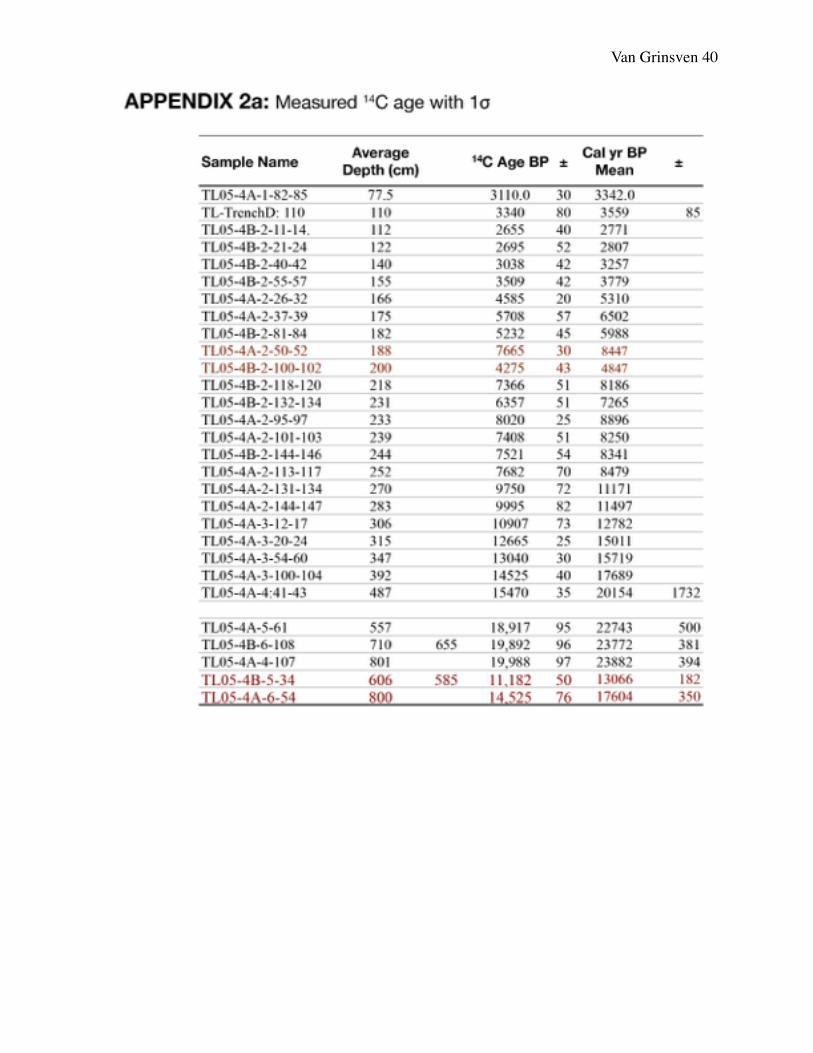
Measured 14C age with 1σ
Appendix 2b………………………………………………………………………………47
Calibration Curves of Radiocarbon Dates

Van Grinsven ���xiv
LIST OF FIGURES
Figure 1……………………………………………………………………………………25
Index Map of Tulare Lake and surrounding region
Figure 2……………………………………………………………………………………26
Relative lake level during the Holocene
Figure 3……………………………………………………………………………………26
The link between lake level and precipitation and evaporation
Figure 4……………………………………………………………………………………27
Map of the Kings River Fan
Figure 5……………………………………………………………………………………28
Simplified lake core schematic of the TL05-4A cores
Figure 6……………………………………………………………………………………29
Age Model
Figure 7……………………………………………………………………………………30
Geophysical and geochemical proxies from TL05-4 cores
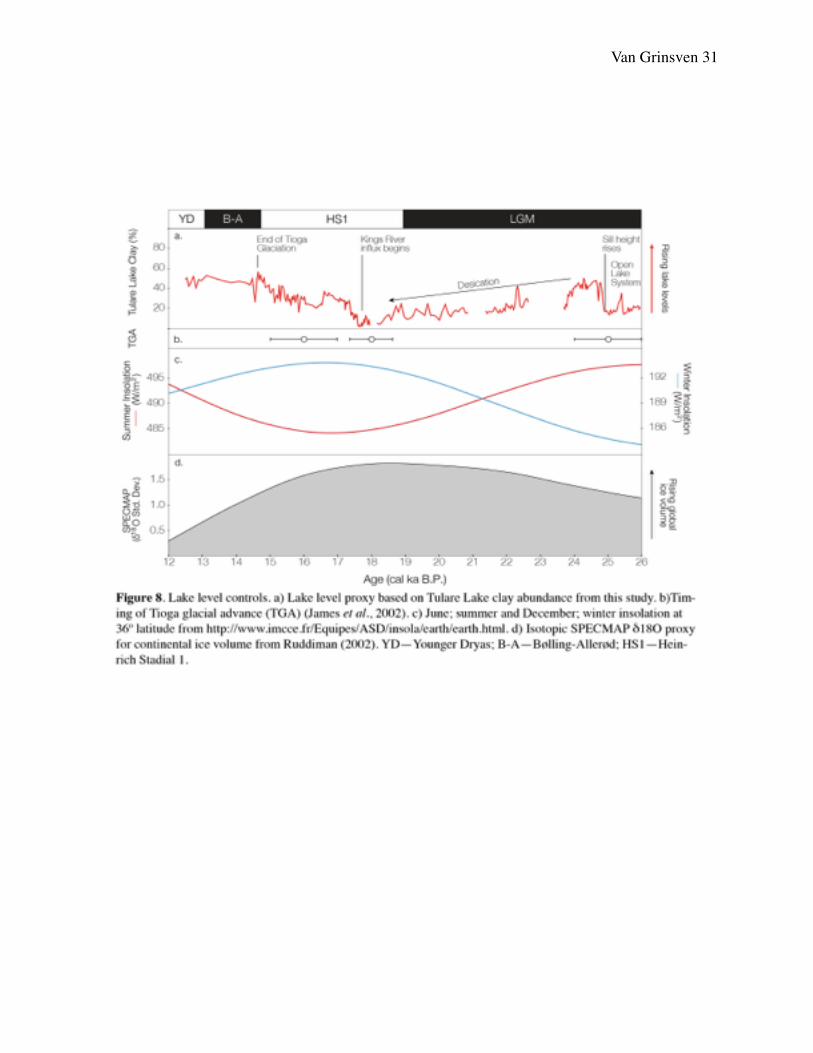
Figure 8……………………………………………………………………………………31
Lake level controls and driving mechanisms
Figure 9……………………………………………………………………………………32
Comparison between hydrologic proxy of Tulare Lake and Mono Lake

Van Grinsven ���1
GLACIOGENIC, GEOMORPHIC, AND INSOLATION EFFECTS DURING MIS 2 ON THE LACUSTRINE SEDIMENT FLUX OF TULARE LAKE, CALIFORNIA
Matthew J. Van GrinsvenCalifornia State University Bakersfield, Department of Geological Sciences,9001 Stockdale Highway, Bakersfield, Ca. 93311
INTRODUCTION
Physical and chemical changes within lacustrine sediment serve as proxies for past
lake levels and, hence, climate change, particularly when terminal lake basins are studied.
Here, this study focuses on the record of the relative paleo-lake level of one such terminal
lake: Tulare Lake, CA. New data are presented spanning the past ~25,000 years adding more
than 6,000 years to the previously published record. The behavior of this hydrologic system
now covers the latest Pleistocene when climatic boundary condition were radically different
due to the presence of continental ice sheets as well as glaciers in the Sierra Nevada
Mountains, reduced trace gas concentrations (e.g., CO2), and altered ocean—atmosphere
dynamics (e.g., sea surface temperatures and storm tracks) (Wahrhaftig and Birman, 1965;
Lorius et al 1985; Blunt and Negrini, in press; Oster et al., 2015).
Tulare Lake is located centrally in California within the San Joaquin Valley (Figure
1). The lake serves as a catchment for the rivers draining most of the southern Sierra Nevada
Mountains and eastern Coast Ranges and four of these rivers are the largest rivers of the
southernmost Central Valley. For this reason, shifts in regional climate should be reflected in
complementary changes in the lacustrine sediment. Previous studies have shown that lake
level has also fluctuated by several tens of meters as a response to fluvial geomorphology due
to the combined effects of regional climate and thickness of the alluvial fan spillover along
the northern margin of the lake (Atwater et al., 1986; Davis, 1999; Negrini, 2006; Blunt and

Van Grinsven ���2
Negrini, in press).
Oster et al. 2015, found that, across much of the southwestern United States, the
majority of modern precipitation occurs due to westerly storms in the winter and spring.
Climatological modeling from their study simulates small (up to ∼10%) increases in the
proportion of winter precipitation at the Last Glacial Maximum. Furthermore, the location
and strength of the semi-permanent pressure systems present during this period are
responsible for steering winter storm tracks to deliver moisture to western North America.
Notably, this study had no data surrounding Tulare Lake to corroborate their findings.
Studies on lakes of the Great Basin, which lie just east of the Sierra Nevada
Mountains, have found that, during the late Pleistocene, the region experienced a rise in the
surface elevations of its lake associated with the advance of the Sierran glaciers (Benson,
1999). Lake transgressions during this period seem to be correlated with global affecting
northern hemisphere climates. Changes in the seasonal distribution of insolation play an
important role in the winter wetness and summer evaporation (Benson et al., 1997; Maher et
al., 2014). However, a more comprehensive understanding of the mechanisms of climate
forcing and the physical linkages between climate forcing and system response is needed in
order to predict the spatial scales over which climate varies coherently (Benson, 1999). This
study will limit comparisons from the Great Basin to Owens and Mono Lakes, which are at
the far west of the Great Basin and drain from the southern Sierra Nevada. Tulare Lake lies at
an equivalent latitude close to these lakes, so it would be reasonable that these lakes would
follow similar changes in climate. However, Tulare Lake lies closer to the Pacific Ocean;
furthermore, the Sierra Nevada Mountains lie to the east of Tulare Lake but west of the Great
Basin lakes. These differences may explain any deviance between the lacustrine response of

Van Grinsven ���3
the two regions, particularly due to the westerly onshore flow and pronounced rain shadow
effect against the Sierra Nevada Mountains. Periods over which Tulare Lake and lakes of the
Great Basin (i.e. Owens Lake, Mono Lake) covary may be indicative of periods over which
the Western United States is responsive to more widespread climate change rather than more
small scale regional changes in the environment.
Blunt and Negrini (in press) refined the lacustrine record of Tulare, first interpreted by
Davis (1999) and Negrini et al. (2006), using high resolution geochemical and geophysical
proxy data from the upper 4.5 meters of the TL05-4 cores to interpret relative lake level over
the last ~18 ka. Among their most significant results are that bulk organic matter dates are
similar to the measured ages of freshwater mussel shells at the same depth. Furthermore,
radiocarbon dating associated with the adjacent Buena Vista Lake also had little offset
between measured organic shell and charcoal dates which supports a small reservoir effect
for this system (Culleton, 2006). Blunt and Negrini (in press) found a good fit between lake
levels and Pacific sea surface temperatures (SSTs) during the Holocene suggesting that
conditions of the Pacific drive Sierran precipitation. However, the relationship between SSTs
and lake level is less clear prior to 14 ka. The authors justify the mismatch between SSTs and
lake level during this early period by recognizing that the lake may have been affected by
melting of the Sierran ice cap during the latest Pleistocene (Figure 2). This study applies the
same approach as Blunt and Negrini (in press), linking lacustrine proxies to regional climatic
events but extends the lacustrine record back further in time throughout MIS2 and clarifies
how the regional environment was different throughout the last glacial cycle.
Van Grinsven ���4
Regional and Geologic Setting
The environment surrounding the lake is classified as a semi-arid steppe with sporadic
rainfall and low humidity with high potential evapotranspiration (Köppen, 1936; Peel et al.,
2004). Typically the study area experiences high temperatures and receives little amounts of
precipitation with low velocity winds between 5 and 25 kmph (3-15 mpg) (Preston, 1981).
According to the Western Regional Climate Center’s website, the mean summer temperatures
are hottest in July and range from highs of 37–38 ºC (98–100 ºF) to lows of 18–20 ºC (64–68
ºF). In December, temperatures are coolest, ranging highs of 12–13 ºC (54–56 ºF) to lows of
0–2 ºC (32–36 ºF). January, February, and March are the wettest months, and July and
August are the driest. Overall the region receives little precipitation; mean annual rainfall is
between 15–23 cm/yr (6–9 in/yr). Because the region is hot and dry, evaporation rates of
standing water (i.e., lake water) exceed precipitation rates by at least one m/yr (Atwater et
al., 1986). Furthermore, because evapotranspiration is higher than precipitation, runoff from
Sierran streams is likely the primary source of water into Tulare Lake (Blunt and Negrini, in
press). Indeed, Atwater et al. (1986) showed that flux of lake level was primarily driven by
changes in Sierran runoff with little effect from the small ephemeral streams from the west
(Figure 3). Currently, the four major Sierran rivers that feed Tulare Lake are: the Kings,
Kaweah, Tule, and Kern Rivers (Figure 1).
Two alluvial fans inter-finger along the northwestern margin of the lake and their
elevation controls the spillover sill that effectively dams Tulare Lake. Los Gatos Creek from
the Kettleman hills builds the western fan, but adds little water to the lake (Atwater et al.,
1986). The Kings River fan from the east derives its sediment from the Kings River (Figure
4). A study by Weissmann et al. (2005) examined the Kings River Fan and found that the
Van Grinsven ���5
Kings River used to flow northward through an incised valley within the alluvial fan. They
claim that sometime during the last glacial maximum, this valley filled and the terminus
migrated south. This shift likely added great amounts of water into the lake but the timing of
this switch is poorly defined. Timing of the shift is based on limited ash dating, fossil
evidence, capping soil morphology, and paleomagnetic reversals correlated across
depositional units. Additionally, sediment of the Kings River during this time may be
enriched with glacial material due to the southern extent of glaciers with in the Sierra Nevada
(Figure 1). Thus a shift in lacustrine deposit characteristics may help identify when the
terminus of the Kings began to empty into Tulare Lake.
Both Owens and Mono lakes are closed-basin lakes with source streams that originate
in the southern and central Sierra Nevada Mountains (Figure 1). Studies by Benson (1997;
1999; 2004) found that lakes of the Great Basin experience similar lake-level changes
particularly during the Tioga Glaciation. Because of strong correlations between the sediment
characteristics of these lakes and the fact that they are dispersed over a large area, it is
believed that regional climate change is responsible for the changes in lake depth. Like
Tulare Lake, these western lakes of the Great Basin including Owens and Mono Lakes also
drain the central Sierra Nevada Mountains. The paper also found a link to North Atlantic
climate records like the SPECMAP δ18O proxy for alpine glaciation and δ18O values from
Greenland ice cores. One important finding was that during the last alpine glacial interval,
cold-dry stades alternated with warm-wet interstades on millennial (Dansgaard-Oeschger)
time scales.
Kirby et al. (2006, 2007, in review) and Bird et al. (2010) found a relationship
between Silver Lake, Dry Lake, Lake Elsinore, and Baldwin Lake’s hydrologic state (i.e.,

Van Grinsven ���6
relative lake level) and incoming solar radiation as forced by seasonally changing earth-sun
orbital parameters or Milankovich forcing. These observations span the last Glacial through
the Holocene suggesting that Milankovitch forcing is an important first-order driver of
hydroclimatic change in the coastal southwest US. This effect may be particularly
pronounced due to Tulare Lake’s geodetic location. Tulare Lake lies at a higher latitude than
other coastal southwestern lakes and for this reason may experience more dramatic shifts in
insolation (Pidwirny, 2006).
During the winter, the westerly winds carry moist Pacific air onshore. As this moist
air condenses against windward side of the Sierras, the precipitation falls within the
headwaters of the rivers, which feed Tulare Lake. Changes in winter insolation likely modify
heat transfer over the Pacific region and modulates the winter season Pacific storm track
(Ibarra et al., 2014; Oster et al., 2015). Oster et al. (2015) hypothesized that lower winter
insolation resulted in more frequent winter storms. During MIS2 insolation was decreasing,
which may change the amount of winter precipitation in the region.
Here, we test the insolation-forcing hypothesis using a new sediment-based lake level
reconstruction for Tulare Lake during MIS2, while considering the evolving glacio/
geomorphic environment. We attribute geophysical and geochemical changes to likely
sources of flux within the Tulare Lake drainage basin, and compare these findings to varied
studies of the region in an attempt to correlate climate change across the region. It’s
important to note that the amount of glacial melt may also have a strong influence on runoff.
Sierran glacial moraines have preserved three principal periods of glacial advance during the
latest Pleistocene (Phillips et al., 1996; James et al., 2002). These advances occur at 25.0 ±
1.0, 18.0 ± 0.6, and 16.0 ± 1.0 cal ka BP. During these periods, runoff may be low, as the

Van Grinsven ���7
precipitation would be caught in the snowpack (Hallet et al., 1996). These advances may
obscure the effects of changing precipitation.
METHODS
This study utilized the same two multi-drive cores of Blunt and Negrini (in press)
which were taken from a location at (36.0066094, -119.936270) and (36.0065750,
-119.9362444) (Figure 2). TL05-4A is composed of 10 drives with a total depth of 15.1
meters below the ground surface (mbgs) (Figure 5). TL05-4B consists of 9 drives, which
reaches a depth of 11.7 mbgs. The cores, TL05-4A and TL05-4B were recovered from within
100 meters of trench A of Negrini et al. (2006).
Drives 1-3 of TL05-4A and drive 2 of TL05-4B were studied by Blunt and Negrini (in
press). The present study examined drives 4-6 of TL05-4A (4.52-9.00 mbgs) and drives 5 and
6 (5.53-8.45 mbgs) of TL05-4B. The cores were described, photographed, and sampled in
2x2x1.8 cm P-1 boxes at a 2-cm interval (Appendix 1a). Drives from the TL05-4B core were
studied to cover gaps between drives of the TL05-4A core created during coring. The two
adjacent cores were correlated using magnetic susceptibility.
Data from twenty-four AMS 14C dates on bulk organic carbon were obtained from
previous studies which include twenty-two from Blunt and Negrini (in press) with one
unpublished date, as well as one sample from Negrini et al. (2006). In addition to these
samples, five additional AMS 14C dates were measured from bulk organic carbon taken from
the drives of interest within the TL05-4A and 4B cores. These samples were spaced
approximately 50 cm apart. Dated samples were processed at the University of Arizona AMS
Laboratory.
All twenty-nine samples were analyzed using the Bacon algorithm to construct an age

Van Grinsven ���8
model using IntCal13.14c data set (Reimer et al., 2013). Bacon uses Bayesian statistics to
reconstruct accumulation histories for deposits by assuming that the core will be constrained
by chronological/stratigraphical ordering of dates. Only models with positive accumulation
rates are accepted and distortion by outlying dates is greatly minimized since ages are
modeled using a student-t distribution with wide tails (Blaauw and Christen, 2013). See
Appendix 2b for the carbon calibration curves.
Grain size can be a reliable measure of lake depth and has been used to indicate the
relative depth of Tulare Lake (Blunt and Negrini, in press; Roza et al., in review). In our
study, a Malvern Mastersizer 2000 laser diffraction grain size analyzer was used to measure
sampled grain sizes. Organic matter, carbonates or biogenic silica were found to be negligible
so no effort was made to remove before analysis (Padilla, 2015). Samples soaked in
deionized water were sieved to <1 mm to avoid clogging the plumbing before being
analyzed.
Magnetic susceptibility is commonly measured in lacustrine sediment studies to
correlate between cores. Evans and Heller (2003) showed that the magnetic properties of lake
sediments can be highly responsive to regional environmental changes and may be influenced
by climate change. Because the principle driving mechanism of magnetic susceptibility is
highly variable from lake to lake, susceptibility is often poorly correlated from lake to lake
(Evans and Heller, 2003). However, correlations from different cores within the same lake
are often well defined. This study used a Bartington MS2 magnetic susceptibility meter with
an MS2B bottle sensor to obtain the mass-normalized magnetic susceptibility for each
sample. Previous samples of Blunt and Negrini (in press) were volume normalized, so to
make a valid comparison their samples were recalculated to mass-normalized measurements

Van Grinsven ���9
by taking their kappa values and dividing by mass.
The concentrations and relationship between carbon and nitrogen of lake sediments
can provide insights into the past environment. It is assumed that original productivity is
quantitatively reflected in the amount of biomass that sinks to the lake floor. Therefore, total
organic carbon (TOC) and nitrogen (N) values can act as indicators for past lake productivity,
which may be influenced by lake level (Meyers, 1997). Total inorganic carbon (TIC)
typically precipitates when a lake low with a reduced water volume promoting
supersaturation and, by extension, precipitation (Cohen, 2003) presuming that carbon and
calcium chemistries of the source waters are reasonably constant. Additionally, the ratio
between TOC and N content has been used to understand past lake conditions. Plant material
derived from terrestrial sources tends to have a higher carbon to nitrogen ratio (C/N) while
aquatic plant matter has a relatively low C/N ratio (Meyers and Lallier-Vergés, 1999). Thus,
higher C/N ratios of lake sediments indicate greater runoff caused by wetter periods (Cohen,
2003; Kirby et al., 2012).
100 mg samples were ground and dried to measure the total inorganic carbon (TIC)
using a UIC model 5020 Carbon Coulometer CM150 after it was liberated into CO2 gas with
perchloric acid in a UIC CM5230 Acidification Module. Dried and ground samples of 20-25
mg were used to measure the total carbon (TC) and nitrogen mass percents with a Costech
4010 Elemental Analyzer. Total organic carbon (TOC) was obtained by subtracting TIC from
TC values. TOC and N results were then used to calculate C/N ratios and converted to molar
ratios after McFadden et al. (2005). The TL05-4A adjacent, TL05-5B core was measured
using the same methods and reproducibility between the two cores was better than 1%. This
agrees with Blunt and Negrini (in press) who studied higher in the section from the same core

Van Grinsven ���10
but used two laboratories to process their samples. Blunt and Negrini (in press) samples from
TL05-4B-2 were processed at the University of Minnesota Limnological Research Center
Core Facility (LaCore) using the same methodology and equipment as with the samples run
at CSU Bakersfield from the TL05-04-1, 2, 3 core segments.
RESULTS AND OBSERVATIONS
Age control
The refined age model is illustrated in Figure 6. The curve of the upper 4 meters of
core is likely more precise due to the abundance of radiocarbon dates.
At the bottom of the core, sedimentation rate averages 0.057 cm/yr. At 17.7 cal ka BP
there is a small inflection and average sedimentation rate decreases to 0.037 cm/yr until
around 15 cal ka BP when the average sedimentation rate decreases again to 0.022 cm/yr
although as described above this section has more variability in sedimentation rate.
It is common for the age of radiocarbon-dated material to be overestimated by up to a
few thousand years due to the reworking of organic matter in sediment and to the residence
time of HCO3- in the water column prior to incorporation into the plant or animal matter that
is eventually dated. A small lake reservoir effect for this system was suggested by Blunt and
Negrini (in press) due to the agreement of dates from freshwater mussel shells and bulk
organic matter. The measured total inorganic carbon averages less than 1%, which is also
consistent with a small lake reservoir effect.
Lithology
The abridged stratigraphy of drives 1-3 of TL05-4A and drive 2 of TL05-4B as
described in Blunt and Negrini (in press) can be found in Appendix 1a. The complete
stratigraphy of cores from this study using drives 4-6 of TL05-4A and drives 4-6 of TL05-4B

Van Grinsven ���11
are described with accompanying photographs in Appendix 1b. Overall, the sediments are
composed of very fine sands, silts and muds.
The bottom of the described section is predominately light grey silt (~50%) with
equal parts sand and clay. Average grain size decreases dramatically to nearly clay-size at
8.30 mbgs. There is very little to no sand from 6.40 mbgs to 8.30 mbgs and color of this
section varies from pale yellow to light yellowish brown. Additionally evaporite minerals
including gypsum can be found in the interval between 6.40 mbgs and 6.92 mbgs. The
relative sand and silt fractions are variable between 6.40 mbgs to 4.50 mbgs. Clay content
steadily decreases from 40% at 8.30 mbgs down to <5% at 4.50 mbgs. Very fine bits of
charcoal, iron staining and rare trace fossils / bioturbation can be observed in this section. At
4.50 mbgs the grain size is nearly entirely very fine sand with trace silt and clays and is a pale
red in color. At 4.19 mbgs the sand fraction decreases nearly instantaneously and the silt
fraction increases just as dramatically. The color ranges from olive grey to pale olive and is
commonly unconsolidated in this interval. Clay content steadily increases to nearly 50% at
3.00 mbgs with a slight dip centered at 3.90 mbgs. Above this there are sub-equal portions of
silt and clay with very little sand content.
Sediment Analyses and Their Proxy Interpretations
Figure 7 shows the sediment analyses with their respective proxy interpretation for
Tulare Lake versus calibrated age. Excluding 7b, all plots of Figure 7 include data from
TL05-4A-3, TL05-4A-4, TL05-4A-5, TL05-4A-6, TL05-4B-5, and TL05-4B-6. The A core is
illustrated in blue, and B core is illustrated with purple. Drives from TL05-4B were studied
to replicate data from drives 5 and 6 of TL05-4A as well as to minimize the gap between
TL05-4A-5, TL05-4A-6. There is generally a good fit with few exceptions between core data

Van Grinsven ���12
of both TL05-4A and TL05-4B.
Mean bulk grain size (Figure 7a) fluctuates from clay to silt to sand throughout the
record and these observable shifts we use to define five distinct zones throughout the late
Pleistocene. In Zone 1, grain size is dominantly silty, with sub-equal portions of sand and
clay (26.0-24.7 cal ka BP). Grain size significantly decreases to the silt/clay boundary at 24.7
cal ka BP, which marks the transition to Zone 2. Following this drop, particle size steadily
increases to the silt / sand boundary, which signals the beginning of Zone 3 at 21.7 cal ka BP.
During Zone 3, (24.7-17.6 cal ka BP) sediment size is relatively coarse, and has high
amplitude fluctuations between sand and silt. At 17.6 cal ka BP there is a sharp decrease in
grain size, which marks the transition to Zone 4. Combined, Zone 2 and 3 exhibit a relatively
stable clay fraction that steadily decreases from about 40% down to 8%. Zone 4 begins with
a sharp drop in grain size, which then remains constant, averaging at fine silt. The clay and
silt percentages during this period steadily rise although the silt fraction begins to decline
after 16.3 cal ka BP. A small drop in clay and increase in silt is observed from 16.6 to 16.0 cal
ka BP. After this fluctuation, silt steadily decreases until silt and clay are sub-equal. Grain
size of Zone 5 is particularly homogenous and grain size averages on the silt/clay boundary.
The sandiest section can be located at the transition from Zone 3 to Zone 4.
For this study, normalized magnetic susceptibility is primarily used to correlate
between TL05-4A and TL05-4B but interestingly, susceptibility is higher during Zone 1
through Zone 3. This is in agreement with the other proxies, which show great shifts at the
Zone 3/4 transition. Magnetic susceptibility follows a similar trend to silt + clay grain size
fractions in the early part of the record, but the relationship is obscured after Zone 3.
TOC, N, and C/N vary throughout the record, however all undergo an inflection at the

Van Grinsven ���13
transition between Zones 3 and 4. TIC ranges between 0.5 and 1% initially but becomes
nearly undetectable at the end of early in Zone 3. TOC and N show similar trends. TOC
typically <0.5% during Zones 1 through 3 increases to approximately 1% during Zone 4 and
throughout Zone 5. Nitrogen closely follows the trends observed by clay content throughout
the record. N%, typically less than 0.05%, increases following Zone 3 to approximately
0.15%. TOC and N fractions rise during Zone 4 and remain relatively stable during Zone 5.
The C/N ratio correlates well with these trends and typically falls below 10 until the later part
half of Zone 4, when is averages slightly greater than 10. TOC, N, and C/N experience a
slight decrease similar to the clay fraction from 16.6 to 16.0 cal ka BP during Zone 4.
Summary of Observations and Interpretations
Earliest Pleistocene; 26-24.7 cal ka BP; Zone 1
At the beginning of the record, grain size is stable and moderately coarse suggesting that the
sample location was closer to the source as the lake level regressed and the influent
prograded lake-ward. Negrini et al. (2000) came to a similar conclusion about Summer Lake,
a lake in central Oregon. They found that when lake levels were low, grain size increased
throughout the lake because of higher depositional energy related to closer distances to the
mouths of streams. Low TOC and N indicate that the lake was relatively barren. TIC% is
<0.5 suggesting low evaporation (Cohen, 2003).
However, low precipitate material can also be explained by the state of a lake (open
or closed). In an open lake, where water flows from the lake, its saturation state (with respect
to carbonate phases) decreases as outflow increases (Benson, 2003). This is likely occurring
during Zone 1, which can make changes in carbon and nitrogen abundances more
ambiguous. This agrees with Atwater et al. (1986), who postulated that the fan-dam, which
Van Grinsven ���14
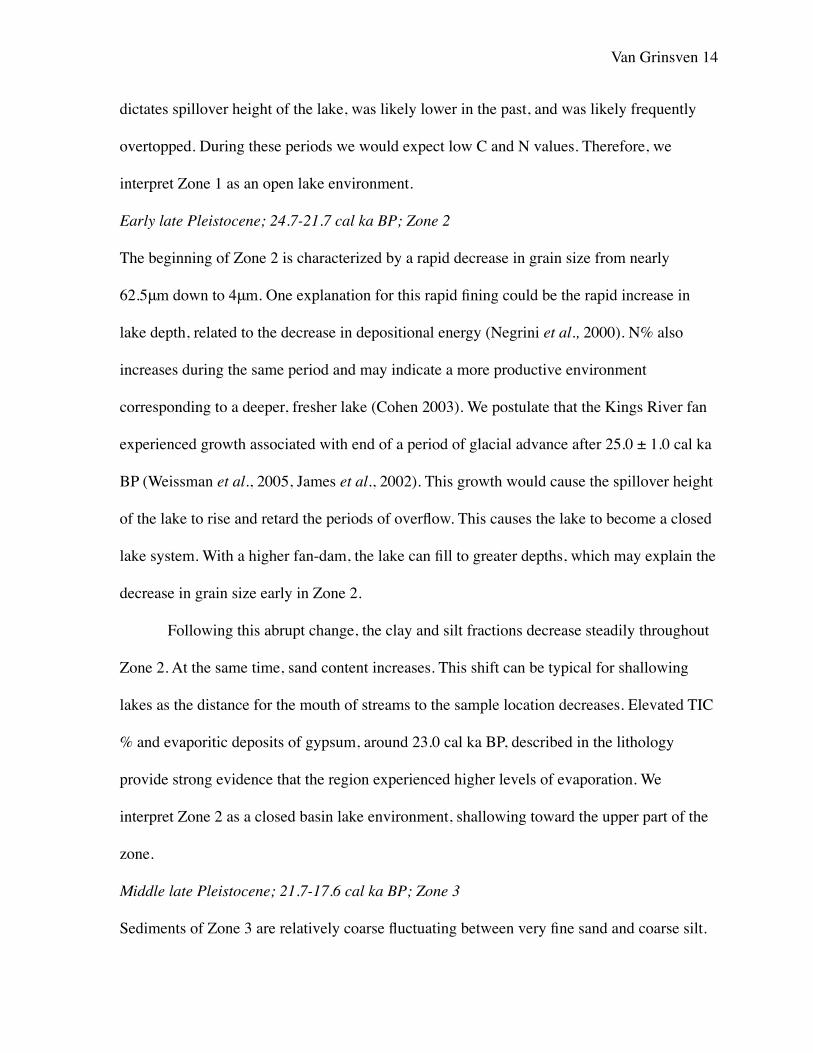
dictates spillover height of the lake, was likely lower in the past, and was likely frequently
overtopped. During these periods we would expect low C and N values. Therefore, we
interpret Zone 1 as an open lake environment.
Early late Pleistocene; 24.7-21.7 cal ka BP; Zone 2
The beginning of Zone 2 is characterized by a rapid decrease in grain size from nearly
62.5μm down to 4μm. One explanation for this rapid fining could be the rapid increase in
lake depth, related to the decrease in depositional energy (Negrini et al., 2000). N% also
increases during the same period and may indicate a more productive environment
corresponding to a deeper, fresher lake (Cohen 2003). We postulate that the Kings River fan
experienced growth associated with end of a period of glacial advance after 25.0 ± 1.0 cal ka
BP (Weissman et al., 2005, James et al., 2002). This growth would cause the spillover height
of the lake to rise and retard the periods of overflow. This causes the lake to become a closed
lake system. With a higher fan-dam, the lake can fill to greater depths, which may explain the
decrease in grain size early in Zone 2.
Following this abrupt change, the clay and silt fractions decrease steadily throughout
Zone 2. At the same time, sand content increases. This shift can be typical for shallowing
lakes as the distance for the mouth of streams to the sample location decreases. Elevated TIC
% and evaporitic deposits of gypsum, around 23.0 cal ka BP, described in the lithology
provide strong evidence that the region experienced higher levels of evaporation. We
interpret Zone 2 as a closed basin lake environment, shallowing toward the upper part of the
zone.
Middle late Pleistocene; 21.7-17.6 cal ka BP; Zone 3
Sediments of Zone 3 are relatively coarse fluctuating between very fine sand and coarse silt.
Van Grinsven ���15
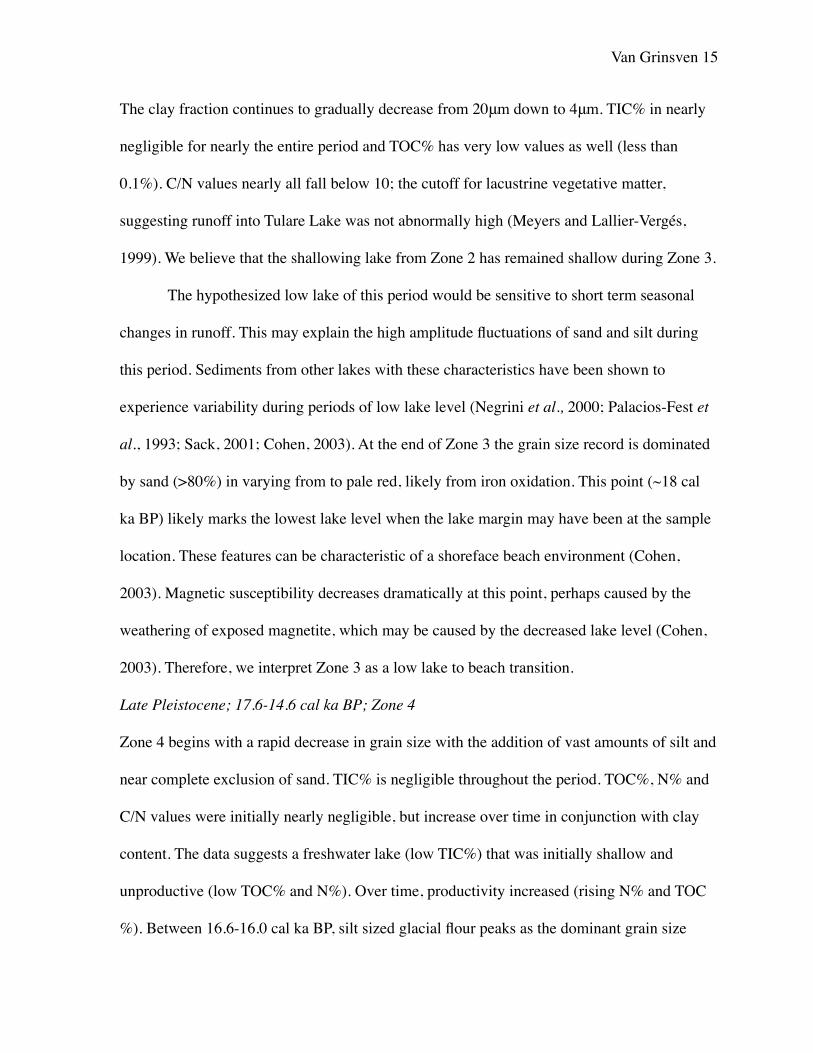
The clay fraction continues to gradually decrease from 20μm down to 4μm. TIC% in nearly
negligible for nearly the entire period and TOC% has very low values as well (less than
0.1%). C/N values nearly all fall below 10; the cutoff for lacustrine vegetative matter,
suggesting runoff into Tulare Lake was not abnormally high (Meyers and Lallier-Vergés,
1999). We believe that the shallowing lake from Zone 2 has remained shallow during Zone 3.
The hypothesized low lake of this period would be sensitive to short term seasonal
changes in runoff. This may explain the high amplitude fluctuations of sand and silt during
this period. Sediments from other lakes with these characteristics have been shown to
experience variability during periods of low lake level (Negrini et al., 2000; Palacios-Fest et
al., 1993; Sack, 2001; Cohen, 2003). At the end of Zone 3 the grain size record is dominated
by sand (>80%) in varying from to pale red, likely from iron oxidation. This point (~18 cal
ka BP) likely marks the lowest lake level when the lake margin may have been at the sample
location. These features can be characteristic of a shoreface beach environment (Cohen,
2003). Magnetic susceptibility decreases dramatically at this point, perhaps caused by the
weathering of exposed magnetite, which may be caused by the decreased lake level (Cohen,
2003). Therefore, we interpret Zone 3 as a low lake to beach transition.
Late Pleistocene; 17.6-14.6 cal ka BP; Zone 4
Zone 4 begins with a rapid decrease in grain size with the addition of vast amounts of silt and
near complete exclusion of sand. TIC% is negligible throughout the period. TOC%, N% and
C/N values were initially nearly negligible, but increase over time in conjunction with clay
content. The data suggests a freshwater lake (low TIC%) that was initially shallow and
unproductive (low TOC% and N%). Over time, productivity increased (rising N% and TOC
%). Between 16.6-16.0 cal ka BP, silt sized glacial flour peaks as the dominant grain size

Van Grinsven ���16
fraction and begins to decrease. This anomaly between 16.6 and 16.0 correlates to a period of
glacial advance, during which the climate would be relatively cooler, favoring decreased
productivity (low N% + TOC%) and a decrease in lake level (reduced clay content) (Phillips
et al., 1996; Levesque et al., 1994). As Blunt and Negrini (in press) suggested, a warming of
the region following this spike in silt content, specifically after 16 cal ka BP combined with
increased visibility within the water column as the percentage of glacial flour decreased may
explain the continuing increase in productivity (N%). The same warming trend driving
productivity may be causing the Sierran glaciers to recede. An alternate explanation for the
light elevation in C/N may be caused by extra runoff from retreating glaciers after 16.0 cal ka
BP. C/N values greater than 10 can be caused by the addition of terrestrial vegetation into the
lake by increased runoff; however, the C/N values are still near the threshold for lacustrine
vegetative matter (Meyers and Lallier-Vergés, 1999).
Pleistocene/Holocene Transition; 14.6-12.0 cal ka BP; Zone 5
This time corresponds to Blunt and Negrini’s (in press) Zone 3. This period is characterized
by uniformity between all proxies during the Pleistocene/Holocene transition. Sediment size
is well-mixed, equal fractions of silt and clay with no sand. TIC% is negligible and TOC%
and N% are low (~0.75% and 0.125% respectively). This suggests that Tulare Lake was
relatively stable with low productivity although the lake had higher productivity than it had
earlier in the record.
DISCUSSION
Physical Linkage between climate forcing and system response
Until 24.7 cal ka BP, Tulare Lake was likely an open lake system due to a low spillover
height causing the lake to remain moderately shallow, but an event at the transition between

Van Grinsven ���17
Zone 1 and 2 caused the lake to fill, likely a thickening of the Kings River Fan (Figure 8a).
Weissmann et al. (2005) found that during periods of glacial outwash, increased sediment
supply caused the Kings River Fan to build. This period of glacial outwash would most likely
correspond to the end of the period of glacial advance that ended 25.0 ± 1.0 ka BP (Figure
8b) (Phillips et al., 1996; James et al., 2002). We postulate that more accommodation space
in the lake basin allowed water to accumulate resulting in lake level rise. There may be a
small increase in productivity after the lake rises due to a small increase in nitrogen, but more
likely it is just a product of a larger water column over the sample location. This is assumed
since original productivity is quantitatively reflected in the amount of biomass that sinks to
the lake floor and greater amounts of water can account for more nitrogen and carbon
(Cohen, 2003).
Following this rapid lake level rise, the lake begins to recede and dissolved material
in the lake becomes more concentrated. Evidence of this includes: precipitated gypsum, low
organic matter, and a gradual decrease in clay content. This can be caused by higher winter
insolation, which favors a decrease in the frequency of winter storms across southwest North
America. This is response to a lower latitude polar jet stream position caused by decreasing
winter insolation (Figure 8c) (Kirby et al., 2006, 2007, in review; Bird et al., 2010). The
aggregate decreased precipitation combined with colder average temperature that would
occur during glacial periods would cause any remaining precipitation to become sequestered
in the snowpack/icepack rather than discharged into Tulare Lake. The sequestration of
precipitation in the ice may be further exacerbated by simultaneously decreasing summer
insolation. Low summer insolation can result in low summer temperatures resulting in
decreased melt. This could reduce runoff within Sierran rivers during the summer.

Van Grinsven ���18
Up to this point, the Kings River had been flowing north away from Tulare Lake and
the Kings River fan had been developing by the addition of glacially enriched sediment
within the Kings River. A period of glacial advance (18.0 ± 0.6 ka BP after James et al.,
2002), which coincides with the end of Zone 3, caused the Kings River to cut a new channel
through its alluvial fan and the river moves south into Tulare Lake (Weissmann et al., 2005).
We estimate that the river incision and terminus switch occurred by just prior to 17.6 cal ka
BP, which is the transition between this paper’s Zone 3 and Zone 4.
With the addition of the large Kings River, Tulare Lake rises rapidly. Grain size
decreases rapidly and lake productivity increases as the lake fills. The Kings River’s
headwaters are the most northerly of any river that feeds into Tulare Lake. As such, it would
have abundant glacial debris in its sediment load. The spike in silt at the transition between
Zone 3 and 4 is caused by the addition of the glacial flour rich Kings River water. Increased
runoff during this small interglacial period between TGA 3 and TGA 4 would also cause sill
height of the fan dam to rise.
A short hiatus during TGA 4 between 16.6 and 16.0 cal ka BP is reflected by
decreased clay, increased silt, decreased carbon and nitrogen. This change is created by
decreased glacial runoff into the lake, which is a product of less melt from the advancing
glaciers. TGA 4 is the final glacial advance during the Tioga Glaciation. The Sierra Nevada
begins to deglaciate following this event and this deglaciation is reflected in the decreasing
silt content. This agrees with Weissmann et al. (2005) who found that there was a significant
decrease in sediment load at the end of glacial periods and the beginning of interglacial
periods. Warming during this period, combined with potentially clearer water column from
the decrease of glacial flour causes productivity of the lake to continue to climb. Also final

Van Grinsven ���19
runoff from the receding glaciers causes the fan dam to aggrade for the final time thereby
forcing the Kings River to drain into Tulare Lake on the south side of its fan up to the
present.
14.6 cal ka BP marks the end of glacial effects on Tulare Lake and this age agrees the
timing of Clark and Gillespie (1997) who concluded that the Sierra Nevada was largely
deglaciated by 15-14 ka BP. This marks Tulare Lake’s transition to Zone 5, when the lake is
relatively stable and sea surface temperatures become the dominant factor controlling
precipitation in the Sierra Nevada and, hence, Tulare Lake level (Blunt and Negrini, in press).
Comparisons with other North American lacustrine records
Studies of lakes of the Great Basin (i.e. Mono Lake, Owens Lake) have found lakes
level to oscillate on a millennial scale, which can be tied to global climate change recorded in
the North Atlantic ice records (Benson 1999). Owens Lake is a good analogue to Tulare Lake
because both are located at similar latitudes and have similar catchments, but dilution by
glacially derived sediment within Owens Lake during the Tioga Glaciation makes climate
flux difficult to distinguish during this period (~24-15 cal ka BP) (Benson 1999). However,
correlation between the δ18O and TIC records of Mono Lake suggest that glacier activity
wasn’t sufficient enough to completely mask the usefulness of the TIC record from this more
northern lake as a hydrologic proxy (Benson, 1999). According to Benson et al. (1997) these
low TIC values are a response within Mono Lake to decreasing summer insolation. Benson et
al. (1997) explains that this decrease is likely caused by the dilution by the influx of
glaciogenic detritus,
There are notable similarities between trends within Tulare Lake’s clay fraction and
Mono Lake’s TIC% (Figure 9). TIC% from Tulare Lake was not used as a comparison due to

Van Grinsven ���20
the expected differences in precipitation and evaporation between the two lakes. It is
expected that clay content more accurately reflects Tulare Lake’s relative depth, an
expectation that is supported by consistancy between the clay proxy and lake elevation
inferred from the stratigraphy exposed in the trench studies (Negrini et al. 2006; Blunt and
Negrini, in press). Correlation between Tulare Lake’s clay content and Mono Lake’s
insolation-responsive TIC reveal that both lakes have similar trends between 18 and 24 cal ka
BP (Figure 9). This is reasonable since both lakes have a considerable fraction of their
drainage area, originating in the insolation controlled glaciated region of the Sierra Nevada
Mountains.
Divergent responses of Tulare and Mono Lakes
Both Tulare Lake and Mono Lake are affected by Sierran glacial activity associated
with the last ice age. Additionally it appears that changing insolation affects both lakes,
however, both lakes respond in different ways to these changes. Within the Great Basin,
higher lake levels, as illustrated by low TIC values, are associated with low summer
insolation values. Benson (1999) postulated that summer insolation modulates the size of
Sierran alpine glaciers. On the other hand, Tulare Lake responds in the opposite manner. Due
to Tulare Lake’s close proximity to the Great Basin, it is likely that Tulare Lake experiences
the same insolation-caused decrease in evaporation as Mono Lake. Despite this, the
lacustrine sediment record indicates that Tulare Lake underwent desiccation during the Tioga
Glaciation.
One plausible cause for the difference between lakes of the Great Basin and the
surrounding southern California lakes is the presence of the Sierra Nevada Mountains. These
mountains create a well-known rain shadow effect across much of western North America

Van Grinsven ���21
and rain falls preferentially on the western side of the mountains. This may buffer the effects
of changing amounts of precipitation within the Great Basin and more importantly exacerbate
the effects of decreased winter precipitation by increased winter insolation. Evaporation rates
and summer temperatures are likely unaffected by the presence of the Sierran divide, so lakes
on both sides are affected by wide scale climate shifts modulating the Sierran ice sheet but
only lakes closer to the Pacific Ocean will be affected by changing precipitation.
CONCLUSION
This study has found that during the last glacial period, until 14.7 cal ka BP,
hydrologic variability of Tulare Lake has been controlled by three dominant factors:
geomorphic changes caused by the switch of the Kings River terminus, insolation by
Milankovitch forcing and waning glacial conditions exhibited by the retreat of the southern
Sierra ice sheet. Separation from more eastern lakes by the Sierra Nevada caused Tulare
Lake’s hydrologic flux to be inversely correlated with those of the westernmost Great Basin.
During the last ice age, increasing winter insolation shifted the winter storm track and
decreasing precipitation surrounding Tulare Lake. It appears that lakes of Western North
America are susceptible to changes in insolation but orogenic effects like the rain shadow
effect across the Sierra Nevada Mountains caused the lakes to reflect these changes in
differing manners.

Van Grinsven ���22
REFERENCES
Atwater, B. F., Adam, D. P., Bradbury, J. P., Forester, R. M., Mark, R. K., Lettis, W. L., Fisher, G. R., Gobalet, K. W., Robinson, S. W., 1986. A Fan Dam for Tulare Lake, California, and implications for the Wisconsin Glacial history of the Sierra Nevada. Bulletin of the Geological Society of America 97: 97–109.
Benson, L.V., 2004. Western lakes. In: Gillespie. A.R., Porter, S.C. & Atwater,. B.F. (eds) The Quaternary Period in the United States. Elsevier, Amsterdam. 185-204.
Benson, L.V., S.P. Lund, J.W. Burdett, M. Kashgarian, Rose, J.P. Smoot, and M. Schwartz, 1997. Correlation of Late-Pleistocene lake-level oscillations in Mono Lake California, with North Atlantic climate events, Quaternary Research, 49: 1–10.
Benson, L. 1999. Records of Millennial-Scale Climate Change from the Great Basin of the Western United States. USGS Staff—Published Research. Paper 792. http://digitalcommons.unl.edy/usgsstaffpub/792.
Bird, B. W., Kirby, M. E., Howat, I. M. and Tulaczyk, S. (2010), Geophysical evidence for Holocene lake-level change in southern California (Dry Lake). Boreas, 39: 131–144. doi: 10.1111/j.1502-3885.2009.00114.x
Blaauw, M., Christen, J. A., 2014. Bacon manual. http://chrono.qub.ac.uk/blaauw/wiggles/.
Blunt, A., Negrini, R. M., in press. Latest Pleistocene through the Holocene lake levels from the TL05-4 cores, Tulare Lake, CA, U.S.A., Quaternary International. do:10.1016/j.quaint.2015.07.001
Clark, D. H., Gillespie, A. R. 1997. Timing and significance of late-glacial and Holocene cirque glaciation in the Sierra Nevada, California. Quaternary International 38/39: 21–38.
Cohen, A. S., 2003. Paleolimnology, Oxford Univ. Press, 500 p.
Culleton, B. J., 2006. Implications of a freshwater radiocarbon reservoir correction for the timing of late Holocene settlement of the Elk Hills, Kern County, California. Journal of Archaeological Science 33: 1331–1339.
Davis, O. K., 1999. Pollen analysis of Tulare Lake, California: great basin-like vegetation in central California during the full-glacial and early Holocene. Review of Palaeobotany and Palynology 107: 249–257.
Evans, M. E., Heller, F., 2003. Environmental Magnetism, Academic Press, San Diego, CA.
Hallet, B., Hunter, L., Bogen, J., 1996. Rates of erosion and sediment evacuation by glaciers: a review of field data and their implications. Global Planet. Chang. 12: 213–235.
Ibarra, D. E., Egger, A. E., Weaver, K. L., Harris, C. R., & Maher, K. 2014. Rise and fall of late Pleistocene pluvial lakes in response to reduced evaporation and precipitation: Evidence from Lake Surprise, California. Geological Society of America Bulletin, B31014-1.
James, L. A., Harbor, J., Fabel, D., Dahms, D., Elmore, D., 2002. Late Pleistocene Glaciations in Northwestern Sierra Nevada, California Quaternary Research 57: 409–419.
Kirby, M.E., Knell, E.J., Anderson, W.T., Lachniet, M.S., Silveira, E., Palermo, J., Hiner, C.A., Eeg,

Van Grinsven ���23
H., Arevalo, A., Lucero, R., Murrieta, R. in press. Evidence for Insolation and Pacific Forcing of Late Glacial through Holocene Climate in the Central Mojave Desert (Silver Lake, CA), Quaternary Research,
Kirby, M.E., Lund, S. L., and Bird, B.W. 2006. Mid-Wisconsin Sediment Record From Baldwin Lake Reveals Hemispheric Climate Dynamics (Southern CA, USA), Palaeogeography, Palaeoclimatology, Palaeoecology, 241, p. 267-283, doi:10.1016/j.palaeo.2006.03.043.
Kirby, M. E., Lund, S. P., Anderson, M. A., Bird, B. W., 2007. Insolation forcing of Holocene climate change in Southern California: a sediment study from Lake Elsinore. Journal of Paleolimnology 38: 395–417.
Kirby, M. E., Zimmerman, S. R. H., Patterson, W. P., Rivera, J. J., 2012. A 9170-year record of decadal-to-multi-centennial scale pluvial episodes from the coastal Southwest United States: a role for atmospheric rivers Quaternary Science Reviews 46: 57–65.
Köppen, W., 1936. Das geographisca System der Klimate. In: Köppen, W., Geiger, G. (Eds.), Handbuch der Klimatologie, 1. C. Gebr, Borntraeger, pp. 1–44.
Levesque, A.J., Cwynar, L.C.,and Walker, I.R. 1994. A multiproxy investigation of late glacial climate and vegation change at Pine Ridge Pond, southwest new Brunswick, Canada. Quat. Res. 42: 316–327.
Lorius, C., J. Jouzel, C. Ritz, L. Merlivat, N. I. Barkov, Y. S. Korotkevich and V. M. Kotlyakov. (1985). "A 150,000-year climatic record form Antarctic Ice." Nature. 316: 591-596.
Maher, K., Ibarra, D.E., Oster, J.L., Miller, D.M., Redwine, J.L., Reheis, M.C., Harden, J.W., 2014, Uranium isotopes in soils as a proxy for past infiltration and precipitation across the western United States." American Journal of Science 314.4: 821-857.
McFadden, M. A., Patterson, W.P., Mullins, H.T., Anderson, W.T., 2005. Multi-proxy approach to long- and short-term Holocene climate-change: Evidence from eastern Lake Ontario. Journal of Paleolimnology 33: 371–391.
Meyers. P.A., 1997, Organic Geochemical proxies of paleoceanographic, paleolimnologic and paleoclimatic processes. Org. Geochem. 27: 213–250.
Meyers, P.A., Lallier-Vergès, E., 1999. Lacustrine sedimentary organic matter records of Late Quaternary paleoclimates. Journal of Paleolimnology 21: 345–372.
Negrini, R.M., Erbes, D.B., Faber, K.,Herrera, A.M.,Roberts, A.P.,Cohen, A.S.,Wigand, P.E., Foit Jr., F.F., 2000. A paleoclimate record for the past 250,000 years from Summer Lake, Oregon, USA; I, Chronology and magnetic proxies for lake level. Journal of Paleolimnology 2: 125–149.
Negrini, R. M., Wigand, P. E., Draucker, S., Gobalet, K., Gardner, J. K., Sutton, M. Q., Yohe, R. M., 2006. The Rambla highstand shoreline and the Holocene lake-level history of Tulare Lake, California, USA. Quaternary Science Reviews 25: 1599–1618.
Oster, J. L., Ibarra, D. E., Winnick, M. J., & Maher, K. (2015). Steering of westerly storms over western North America at the Last Glacial Maximum. Nature Geoscience.
Peel, M.C., McMahon, T.A., Finalyson, B.L., 2004. Continental differences in the variability of annual runoff-update and reassessment. Journal of Hydrology 295: 185–197.

Van Grinsven ���24
Phillips, F.M., Zreda, M.G., Benson, L.V., Plummer, M.A., Elmore, D., Sharma, P. 1996. Chronology for fluctuations in late Pleistocene Sierra Nevada glaciers and lake. Science 274: 749–761.
Pidwirny, M. 2006. "Earth-Sun Relationships and Insolation". Fundamentals of Physical Geography, 2nd Edition. Date Viewed. http://www.physicalgeography.net/fundamentals/6i.html
Palacios-Fest, M., A. Cohen, J. Ruiz & B. Blank, 1993. Comparative paleoclimatic interpretations from non marine ostracodes using faunal assemblages, trace element shell chemistry and stable isotope data. In Swart, P. K., K. C. Lohman, J. McKenzie & S. Savin (eds), Climate Change in Continental Isotopic Records. Am. Geophys. Union Geophys. Mono. 78: 179–190.
Preston, W.L., 1981. Vanishing Landscapes: Land and Life in the Tulare Lake Basin. University of California Press, Berkeley, CA.
Reimer, P.J., Bard, E., Bayliss, A., Beck, J.W., Blackwell, P.G., Bronk Ramsey, C., Buck, C.E., Edwards, R.L., Friedrich, M., Grootes, P.M., Guilderson, T.P., Haflidason, H., Hajdas, I., Hatté, C., Heaton, T.J., Hoffmann, D.L., Hogg, A.G., Hughen, K.A., Kaiser, K.F., Kromer, B., Manning, S.W., Niu, M., Reimer, R.W., Richards, D.A., Scott, M.E., Southon, J.R., Turney, C.S.M., van der Plicht, J., 2013. IntCal13 and Marine13 radiocarbon age calibration curves 0-50,000 yr cal BP. Radiocarbon 55(4): 1869-1887.
Sack, D. 2001. Shoreline and basin configuration techniques in paleolimnology, in Last, W.M., and Smol, J.P., eds., Tracking environmental change using lake sediments, v. 1. Kluwer, Dordrecht, The Netherlands: 49-71.
Svensson, A., Andersen, K.K., Bigler, M., Clausen, H.B., Dahl-Jensen, D., Davies, S.M., Johnsen, S.J., Muscheler, R., Parrenin, F., Rasmussen, S.O., Röthlisberger, R., Seierstad, I., Steffensen, J.P., and Vinther, B.M., 2008. A 60,000 year Greenland stratigraphic ice core chronology. Climate of the Past, 4: 47–57.
Wahrhaftig, C., and Birdman, J.H., 1965. The Quaternary of the Pacific mountain system in California, in Wright, H. E., Jr. and Frey, D. G.. eds, The Quaternary of the United State; Princeton, New Jersey,Princeton University Press: 299-340.
Weissman G. S., Bennett, G. L., Lansdale, A. L., 2005. Factors controlling sequence development on Quaternary fluvial fans, San Joaquin Basin, California, USA. in Alluvial fans; geomorphology, sedimentology, dynamics. Geological Society Special Publications, 251: 169–186.

Van Grinsven ���25

Van Grinsven ���26

Van Grinsven ���27

Van Grinsven ���28

Van Grinsven ���29

Van Grinsven ���30
Van Grinsven ���31

Van Grinsven ���32
Van Grinsven ���33

Van Grinsven ���34

Van Grinsven ���35

Van Grinsven ���36

Van Grinsven ���37
Van Grinsven ���38

Van Grinsven ���39
Van Grinsven ���40


