33
Vanguard Managed Payout Fund Semiannual Report | June 30, 2017
| Date post: | 17-May-2018 |
| Category: |
Documents |
| Upload: | truongtuyen |
| View: | 216 times |
| Download: | 1 times |
Vanguard Managed Payout Fund
Semiannual Report | June 30, 2017

Contents
Please note: The opinions expressed in this report are just that—informed opinions. They should not be considered promisesor advice. Also, please keep in mind that the information and opinions cover the period through the date on the front of thisreport. Of course, the risks of investing in your fund are spelled out in the prospectus.
See the Glossary for definitions of investment terms used in this report.About the cover: No matter what language you speak, Vanguard has one consistent message and set ofprinciples. Our primary focus is on you, our clients. We conduct our business with integrity as a faithful steward of your assets. This message is shown translated into seven languages, reflecting our expanding globalpresence.
A new format, unwavering commitment
As you begin reading this report, you’ll notice that we’ve made someimprovements to the opening sections—based on feedback from you,our clients.
Page 1 starts with a new ”Your Fund’s Performance at a Glance,” aconcise, handy summary of how your fund performed during the period.
In the renamed ”Chairman’s Perspective,” Bill McNabb will focus onenduring principles and investment insights.
We’ve modified some tables, and eliminated some redundancy, but wehaven’t removed any information.
At Vanguard, we’re always looking for better ways to communicate andto help you make sound investment decisions. Thank you for entrustingyour assets to us.
Your Fund’s Performance at a Glance. . . . . . . . . . . . . . . . . . 1
Chairman’s Perspective. . . . . . . . . . . . . . . . . . . . . . . . . . . . . 2
Advisor’s Report. . . . . . . . . . . . . . . . . . . . . . . . . . . . . . . . . . . 6
Fund Profile. . . . . . . . . . . . . . . . . . . . . . . . . . . . . . . . . . . . . .10
Performance Summary. . . . . . . . . . . . . . . . . . . . . . . . . . . . .11
Financial Statements. . . . . . . . . . . . . . . . . . . . . . . . . . . . . . 12
About Your Fund’s Expenses. . . . . . . . . . . . . . . . . . . . . . . . 23
Trustees Approve Advisory Arrangement. . . . . . . . . . . . . . 25
Glossary. . . . . . . . . . . . . . . . . . . . . . . . . . . . . . . . . . . . . . . . 27
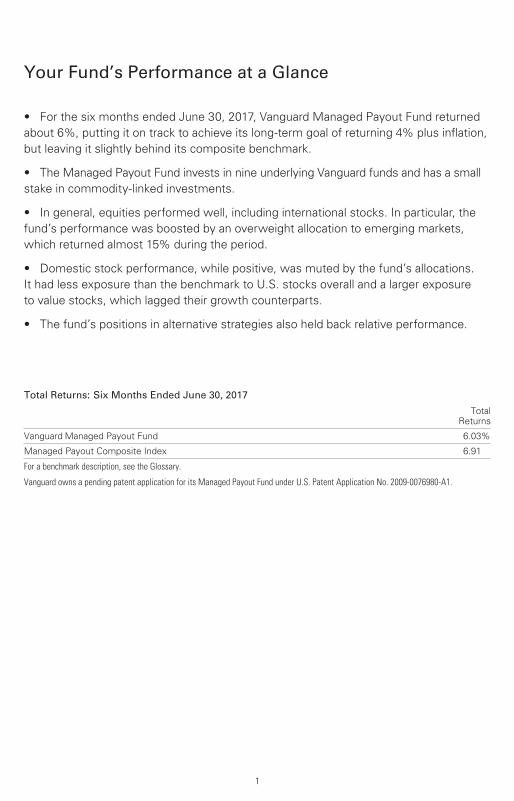
Your Fund’s Performance at a Glance
1
Total Returns: Six Months Ended June 30, 2017
TotalReturns
Vanguard Managed Payout Fund 6.03%
Managed Payout Composite Index 6.91
For a benchmark description, see the Glossary.
Vanguard owns a pending patent application for its Managed Payout Fund under U.S. Patent Application No. 2009-0076980-A1.
• For the six months ended June 30, 2017, Vanguard Managed Payout Fund returned
about 6%, putting it on track to achieve its long-term goal of returning 4% plus inflation,
but leaving it slightly behind its composite benchmark.
• The Managed Payout Fund invests in nine underlying Vanguard funds and has a small
stake in commodity-linked investments.
• In general, equities performed well, including international stocks. In particular, the
fund’s performance was boosted by an overweight allocation to emerging markets,
which returned almost 15% during the period.
• Domestic stock performance, while positive, was muted by the fund’s allocations.
It had less exposure than the benchmark to U.S. stocks overall and a larger exposure
to value stocks, which lagged their growth counterparts.
• The fund’s positions in alternative strategies also held back relative performance.
Dear Shareholder,
More than a decade ago, the eminent
investor and commentator Howard Marks
published a memo to his clients titled
simply “Risk.” In it, Howard distilled the
relationship between investors and risk.
“When you boil it all down, it’s the
investor’s job to intelligently bear risk
for profit,” he wrote.
It’s not surprising, then, that everyone
from portfolio managers to behavioral
economists avidly studies how investors’
reactions to risk influence not only individual
investment decisions but also the broader
financial markets. I’m a big fan of some of
the behavioral finance work being done,
which includes studies by our own
investment strategists and analysts.
A lens on investor behavior
For example, Vanguard’s Investment
Strategy Group introduced a “risk
speedometers” report in January to look
at how investors are reacting to market
developments. This lens on real-world
behavior measures the risk investors are
taking in a given period by calculating the
difference between net cash flows into
higher-risk assets, such as stocks, and
net cash flows into lower-risk assets,
such as Treasuries. The measures are
then compared with long-term averages.
In the spring, the risk speedometer spiked.
The spike was fueled by investors’
decisions to direct more of their equity
Chairman’s Perspective
Bill McNabb
Chairman and Chief Executive Officer
2

dollars to international investments
in developed and emerging markets,
and their bond dollars to riskier
credit categories.
A spiking speedometer seems a fitting
analogy for what can happen. I consider
myself a responsible driver. Still, when
the highway is clear and the weather
is nice, I might glance down at the
speedometer and find that my right
foot has gotten a little heavy.
The same phenomenon is possible with
our investment portfolios. Just as our
attention can drift from our speed—
and the risk level on the road—we can
neglect the risk level of our portfolio’s
asset allocation. Experience teaches
that investors are especially prone to
lose sight of risk when markets have
been buoyant.
How I manage risk in my own portfolio
Rebalancing—periodically adjusting your
asset allocation so it stays in line with your
goals and risk tolerance—is one of the
best ways I know of to help manage risk.
Without rebalancing, your portfolio may
end up potentially riskier than you intended
and no longer aligned with your goals.
I have a ritual I perform every June and
again each December, between Christmas
and New Year’s, as I prepare for a series
of annual meetings with the Vanguard
crew. I’ll set aside some time, review my
Market Barometer
Total Returns
Periods Ended June 30, 2017
Five Years
Six Months One Year (Annualized)
Stocks
Russell 1000 Index (Large-caps) 9.27% 18.03% 14.67%
Russell 2000 Index (Small-caps) 4.99 24.60 13.70
Russell 3000 Index (Broad U.S. market) 8.93 18.51 14.58
FTSE All-World ex US Index (International) 13.95 20.53 7.68
Bonds
Bloomberg Barclays U.S. Aggregate Bond Index
(Broad taxable market) 2.27% -0.31% 2.21%
Bloomberg Barclays Municipal Bond Index
(Broad tax-exempt market) 3.57 -0.49 3.26
Citigroup Three-Month U.S. Treasury Bill Index 0.30 0.46 0.13
CPI
Consumer Price Index 1.46% 1.63% 1.31%
3

investment portfolio, and, if necessary,
rebalance back to my target asset
allocation.
My own portfolio is a mix of equity and
fixed income funds, and I invest in both
actively managed funds and index funds.
Most years, I’ll make a minor adjustment
to get back to the appropriate asset
allocation for my own longer-term
goals and risk tolerance. It’s not all that
complicated, although my portfolio is a
little more complex than some because
I own more funds than we’d typically
suggest. As chairman of Vanguard’s
funds, I feel I should own a significant
number of them.
Consider your options
You should consider rebalancing if your
target allocation is off by 5 percentage
points or more. Admittedly, this is often
easier said than done. When an invest-
ment has performed exceptionally well,
people have a hard time trimming it.
They can be led astray by that old
(and none-too-helpful) investing saw:
Let your winners run.
Fortunately, in recent years we’ve seen all
sorts of investors take steps to rebalance.
Many of the endowments, foundations,
and traditional pension plans that Vanguard
serves have good processes built into
their investment guidelines to make sure
rebalancing takes place on a regular basis.
And among investors in defined contribution
retirement plans, more and more are using
target-date funds, where rebalancing
happens automatically.
If you choose to rebalance on your own,
use your target asset allocation as your
guidepost. Don’t be afraid to buy into
bad news. In a sense, don’t worry about
the noise of the marketplace. If you work
with an advisor, make sure he or she
understands the importance you place
on your rebalancing ritual.
And remember, the goal of rebalancing is
to manage risk, not to avoid it altogether.
Risk is inherent in investing—we just
want to bear that risk intelligently.
In that insightful memo on risk, Howard
Marks included a saying often attributed
to Will Rogers: “You’ve got to go out on
a limb sometimes because that’s where
the fruit is.”
Tim Buckley chosen
as Vanguard’s next CEO
In closing, I’ll note senior leadership
changes that we announced in July. Our
board of directors has elected Vanguard
Chief Investment Officer Tim Buckley as
president and director of Vanguard. Under
the planned transition, Tim will succeed
me as Vanguard’s chief executive officer
on January 1, 2018.
I’m delighted with our board’s selection
of Tim. We first met in 1991 when Tim
was interviewing for a job at Vanguard. In
the decades since, we’ve worked closely
together, and he’s always impressed me
as a man of tremendous character and
an outstanding leader with a passion for
serving our clients. During the transition
4

period, I will work closely with Tim in
managing the firm and overseeing its
operations.
Replacing Tim as chief investment officer
is Greg Davis, who had been global head
of Vanguard Fixed Income Group. And
succeeding Greg as our fixed income
leader is John Hollyer, who most recently
served as our global head of investment
risk management. I know Greg and
John will both do a superb job in their
new roles.
As with past successions, I will remain as
chairman for a period of time determined
by the board. On a personal note, it has
been an honor and a privilege to lead
Vanguard. Having spent more than half
my life at Vanguard, I have come to know
many fabulous crew members who are
incredibly dedicated to Vanguard’s
mission. Please be assured that Tim and
the rest of the team will serve you and our
other clients extremely well as Vanguard
prepares for its next chapter.
As always, thank you for investing
with Vanguard.
Sincerely,
F. William McNabb III
Chairman and Chief Executive Officer
July 14, 2017
Vanguard fund shareholders encouraged to vote in proxy campaign
This summer you will be asked to vote on the election of trustees for all U.S.-domiciled
Vanguard funds. Shareholders will also be asked to vote on several fund policy proposals
that we believe are in the best interests of all shareholders.
Vanguard filed a preliminary proxy statement on July 13, 2017, with the U.S. Securities and
Exchange Commission (SEC). Following the SEC’s review, we expect to provide the proxy
materials to Vanguard fund shareholders beginning in late August 2017. That’s when you
can begin to vote online, by phone, or by mail.
A shareholder meeting is scheduled to be held in Scottsdale, Arizona, on November 15,
2017, when voting will conclude. We encourage you to vote promptly. Please visit
vanguard.com for updates.
5
Advisor’s Report
6
For the six months ended June 30,
2017, Vanguard Managed Payout Fund
returned about 6%, putting it on track
to achieve its long-term goal of returning
4% plus inflation. Over shorter periods,
we measure performance relative to the
fund’s composite benchmark. Its return
through the first half of this year trailed
that of its benchmark.
Surprising global growth and a tempered
outlook for the new administration’s
legislative agenda caused a shift in stock
market leadership during the period. That
market environment was reflected in the
performance of the Managed Payout Fund’s
underlying investments. In general, equities
performed well, especially international
and emerging markets stocks. But, value
stocks, which surged in the wake of last
year’s election, detracted from relative
performance as they lagged behind
mature growth companies.
During the trailing three-year period,
the fund performed in line with its
benchmark. Its average annual return
(+4.2%), however, failed to meet the
fund’s long-term objective of returning
4% plus inflation. For the five-year period
through June 2017, the fund exceeded
the return of its composite benchmark
and met its investment objective, with
an average annual return of 7.89%.
Investment objectiveThe idea for the Managed Payout Fund
originated with the success of the
endowment and foundation investing
model in the United States, dating to
the 1970s. Many endowment pools
seek to operate in perpetuity while
preserving capital and regularly spending
a certain percentage of assets. This is
similar to what many investors, particularly
in retirement, try to achieve. Broad
asset-class diversification, a disciplined
spending policy, and a focus on long-term
performance helped make endowments
successful.
The Managed Payout Fund also has a
dual objective. In any given year, we
try to outperform the benchmark on a
risk-adjusted basis, and in the long run
we seek to provide a return that at least
equals spending plus inflation. (If we
spend 4% and inflation is 2%, the fund’s
objective is to produce a return of 6% or
more.) Meeting this objective is critical
for making periodic distributions and
preserving capital.
We believe that markets are generally
efficient in the long term, but short-term
inefficiencies should allow our prudent,
fundamentally driven strategy to achieve
superior risk-adjusted results by concen-
trating on systematic opportunities within
and between asset classes and by
managing investment risks.
To evaluate our success, we need an
appropriate benchmark, so the fund’s
strategic asset allocation benchmark
considers the objective of making stable
distributions to shareholders. We use
this as a guide when making tactical
decisions about specific investment
vehicle allocations.
7
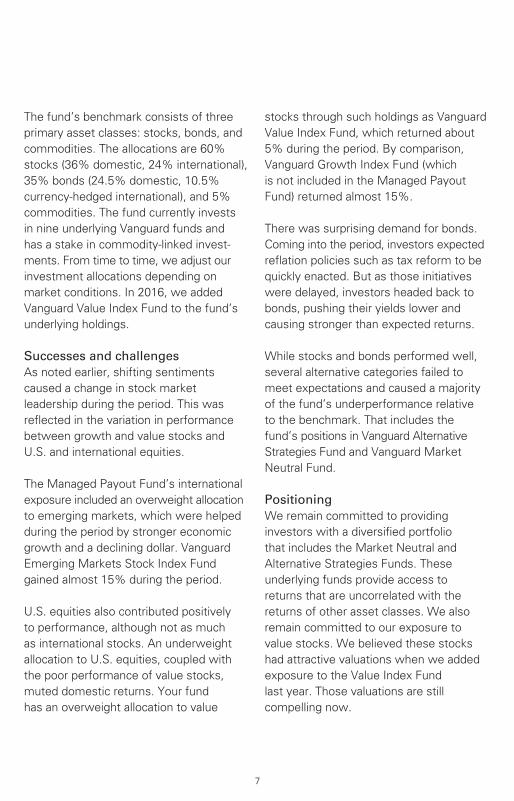
The fund’s benchmark consists of three
primary asset classes: stocks, bonds, and
commodities. The allocations are 60%
stocks (36% domestic, 24% international),
35% bonds (24.5% domestic, 10.5%
currency-hedged international), and 5%
commodities. The fund currently invests
in nine underlying Vanguard funds and
has a stake in commodity-linked invest-
ments. From time to time, we adjust our
investment allocations depending on
market conditions. In 2016, we added
Vanguard Value Index Fund to the fund’s
underlying holdings.
Successes and challengesAs noted earlier, shifting sentiments
caused a change in stock market
leadership during the period. This was
reflected in the variation in performance
between growth and value stocks and
U.S. and international equities.
The Managed Payout Fund’s international
exposure included an overweight allocation
to emerging markets, which were helped
during the period by stronger economic
growth and a declining dollar. Vanguard
Emerging Markets Stock Index Fund
gained almost 15% during the period.
U.S. equities also contributed positively
to performance, although not as much
as international stocks. An underweight
allocation to U.S. equities, coupled with
the poor performance of value stocks,
muted domestic returns. Your fund
has an overweight allocation to value
stocks through such holdings as Vanguard
Value Index Fund, which returned about
5% during the period. By comparison,
Vanguard Growth Index Fund (which
is not included in the Managed Payout
Fund) returned almost 15%.
There was surprising demand for bonds.
Coming into the period, investors expected
reflation policies such as tax reform to be
quickly enacted. But as those initiatives
were delayed, investors headed back to
bonds, pushing their yields lower and
causing stronger than expected returns.
While stocks and bonds performed well,
several alternative categories failed to
meet expectations and caused a majority
of the fund’s underperformance relative
to the benchmark. That includes the
fund’s positions in Vanguard Alternative
Strategies Fund and Vanguard Market
Neutral Fund.
PositioningWe remain committed to providing
investors with a diversified portfolio
that includes the Market Neutral and
Alternative Strategies Funds. These
underlying funds provide access to
returns that are uncorrelated with the
returns of other asset classes. We also
remain committed to our exposure to
value stocks. We believed these stocks
had attractive valuations when we added
exposure to the Value Index Fund
last year. Those valuations are still
compelling now.
8
Capital markets may be unpredictable
in the short term, but we believe that
our decisions position the fund, and
our investors’ resources, well over the
medium to long term. We continue to
monitor conditions and position the
portfolio within the risk-controlled
framework.
Thank you for entrusting us with your
investments.
Portfolio Managers:
John Ameriks, Principal
Anatoly Shtekhman, CFA
Vanguard Quantitative Equity Group
July 21, 2017
9
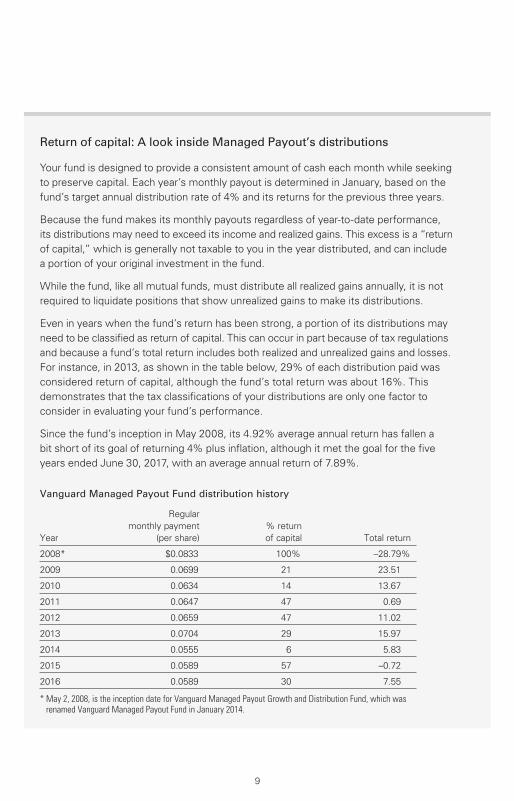
Return of capital: A look inside Managed Payout’s distributions
Your fund is designed to provide a consistent amount of cash each month while seeking
to preserve capital. Each year’s monthly payout is determined in January, based on the
fund’s target annual distribution rate of 4% and its returns for the previous three years.
Because the fund makes its monthly payouts regardless of year-to-date performance,
its distributions may need to exceed its income and realized gains. This excess is a “return
of capital,” which is generally not taxable to you in the year distributed, and can include
a portion of your original investment in the fund.
While the fund, like all mutual funds, must distribute all realized gains annually, it is not
required to liquidate positions that show unrealized gains to make its distributions.
Even in years when the fund’s return has been strong, a portion of its distributions may
need to be classified as return of capital. This can occur in part because of tax regulations
and because a fund’s total return includes both realized and unrealized gains and losses.
For instance, in 2013, as shown in the table below, 29% of each distribution paid was
considered return of capital, although the fund’s total return was about 16%. This
demonstrates that the tax classifications of your distributions are only one factor to
consider in evaluating your fund’s performance.
Since the fund’s inception in May 2008, its 4.92% average annual return has fallen a
bit short of its goal of returning 4% plus inflation, although it met the goal for the five
years ended June 30, 2017, with an average annual return of 7.89%.
Vanguard Managed Payout Fund distribution history
Regular
monthly payment % return
Year (per share) of capital Total return
2008* $0.0833 100% –28.79%
2009 0.0699 21 23.51
2010 0.0634 14 13.67
2011 0.0647 47 0.69
2012 0.0659 47 11.02
2013 0.0704 29 15.97
2014 0.0555 6 5.83
2015 0.0589 57 –0.72
2016 0.0589 30 7.55
* May 2, 2008, is the inception date for Vanguard Managed Payout Growth and Distribution Fund, which was renamed Vanguard Managed Payout Fund in January 2014.

Managed Payout Fund
Fund ProfileAs of June 30, 2017
1 This figure—drawn from the prospectus dated April 26, 2017—represents an estimate of the weighted average of the expense ratiosand any transaction fees charged by the underlying mutual funds (the ”acquired” funds) in which the Managed Payout Fund invests. Forthe six months ended June 30, 2017, the fund’s annualized expense figure totals 0.35%, representing the fund’s own annualized expenseratio of 0.02% together with acquired fund fees and expenses of 0.33%. (Approximately 40% of the total expenses are attributable to theshort-sale dividend and borrowing expenses reported by Vanguard Market Neutral Fund and Vanguard Alternative Strategies Fund.)
10
Total Fund Characteristics
Ticker Symbol VPGDX
30-Day SEC Yield 1.75%
Acquired Fund Fees and Expenses1 0.34%
Total Fund Volatility Measures
Managed
Payout
Composite
Index
DJ
U.S. Total
Market
FA Index
R-Squared 0.97 0.83
Beta 0.87 0.50
These measures show the degree and timing of the fund’s fluctuations compared with the indexes over 36 months.
Allocation to Underlying Investments
Vanguard Total Stock Market Index
Fund Investor Shares 20.1%
Vanguard Total International Stock
Index Fund Investor Shares 20.1
Vanguard Total Bond Market II
Index Fund Investor Shares 12.3
Vanguard Alternative Strategies
Fund Investor Shares 12.2
Vanguard Global Minimum Volatility
Fund Investor Shares 7.4
Vanguard Market Neutral Fund
Investor Shares 6.7
Vanguard Total International Bond
Index Fund Investor Shares 6.0
Vanguard Emerging Markets Stock
Index Fund Investor Shares 5.1
Vanguard Value Index Fund
Investor Shares 5.1
Commodities 5.0
Fund Asset Allocation
57.8% Stocks
18.9% Alternatives
18.3% Bonds
5.0% Commodities

All of the returns in this report represent past performance, which is not a guarantee of future results that may be achieved by the fund. (Current performance may be lower or higher thanthe performance data cited. For performance data current to the most recent month-end, visitour website at vanguard.com/performance.) Note, too, that both investment returns and principal value can fluctuate widely, so an investor’s shares, when sold, could be worth more or less than their original cost. The returns shown do not reflect taxes that a shareholder would pay
on fund distributions or on the sale of fund shares.
Managed Payout Fund
Performance Summary
See Financial Highlights for dividend and capital gains information.
11
Fiscal-Year Total Returns (%): May 2, 2008, Through June 30, 2017
–28.79 –29.29
2008
23.51 24.01
2009
13.67 12.40
2010
0.69
–0.90
2011
11.02 10.68
2012
15.9712.28
2013
5.83 6.58
2014
–0.72 –2.04
2015
7.55 7.80
2016
6.03 6.91
2017
Managed Payout Fund
Managed Payout Composite Index
For a benchmark description, see the Glossary.
Note: For 2017, performance data reflect the six months ended June 30, 2017.
On January 17, 2014, Vanguard Managed Payout Growth Focus Fund and Vanguard Managed Payout Distribution Focus Fund were merged into Vanguard Managed Payout Growth and Distribution Fund, which was then renamed Vanguard Managed Payout Fund. Returns before the merger reflect the performance of the former Managed Payout Growth and Distribution Fund.
Average Annual Total Returns: Periods Ended June 30, 2017
Since Inception
Inception Date One Year Five Years Income Capital Total
Managed Payout Fund 5/2/2008 9.25% 7.89% 3.00% 1.92% 4.92%

Investment Companies (95.0%)
U.S. Stock Funds (25.2%)
Vanguard Total Stock Market Index Fund Investor Shares 6,287,056 380,681
Vanguard Value Index Fund Investor Shares 2,555,671 96,247
476,928
Global Stock Fund (7.4%)
Vanguard Global Minimum Volatility Fund Investor Shares 10,799,870 140,506
International Stock Funds (25.2%)
Vanguard Total International Stock Index Fund Investor Shares 22,808,935 380,225
Vanguard Emerging Markets Stock Index Fund Investor Shares 3,744,345 96,642
476,867
U.S. Bond Fund (12.3%) 1 Vanguard Total Bond Market II Index Fund Investor Shares 21,743,891 233,312
International Bond Fund (6.0%)
Vanguard Total International Bond Index Fund Investor Shares 10,458,605 113,371
Alternative Funds (18.9%)
Vanguard Alternative Strategies Fund Investor Shares 11,441,168 230,654
Vanguard Market Neutral Fund Investor Shares 10,740,852 127,172
357,826
Total Investment Companies (Cost $1,507,122) 1,798,810
Temporary Cash Investments (4.9%)
Money Market Fund (0.0%)1 Vanguard Market Liquidity Fund, 1.181% 5,898 590
Market
Value•
Shares ($000)
Managed Payout Fund
Consolidated Statement of Net AssetsAs of June 30, 2017
Consolidated Financial Statements (unaudited)
The fund reports a complete list of its holdings in regulatory filings four times in each fiscal year, at
the quarter-ends. For the second and fourth fiscal quarters, the lists appear in the fund’s semiannual
and annual reports to shareholders. For the first and third fiscal quarters, the fund files the lists with
the Securities and Exchange Commission on Form N-Q. Shareholders can look up the fund’s Forms
N-Q on the SEC’s website at sec.gov. Forms N-Q may also be reviewed and copied at the SEC’s
Public Reference Room (see the back cover of this report for further information).
12

Managed Payout Fund
U.S. Government and Agency Obligations (4.9%)
2,3 Fannie Mae Discount Notes 0.827%–0.901% 7/12/17 11,110 11,1072,3 Fannie Mae Discount Notes 0.862%–0.877% 7/26/17 3,829 3,8272,3 Fannie Mae Discount Notes 0.907% 8/2/17 5,678 5,6732,3 Fannie Mae Discount Notes 0.932% 8/9/17 4,260 4,2562,4 Federal Home Loan Bank Discount Notes 0.837%–0.842% 7/5/17 7,101 7,1012,4 Federal Home Loan Bank Discount Notes 0.860% 7/12/17 2,100 2,0992,4 Federal Home Loan Bank Discount Notes 0.817% 7/14/17 179 1792,4 Federal Home Loan Bank Discount Notes 0.936% 7/18/17 1,875 1,8742,4 Federal Home Loan Bank Discount Notes 1.021% 7/25/17 500 5002,4 Federal Home Loan Bank Discount Notes 1.021% 7/28/17 401 4012,4 Federal Home Loan Bank Discount Notes 1.051% 8/2/17 4,091 4,0882,4 Federal Home Loan Bank Discount Notes 1.036% 8/9/17 3,960 3,9562,4 Federal Home Loan Bank Discount Notes 1.042% 8/17/17 2,600 2,5972,4 Federal Home Loan Bank Discount Notes 0.963%–1.003% 9/5/17 2,870 2,8652,4 Federal Home Loan Bank Discount Notes 1.083% 9/8/17 1,000 9982,3 Freddie Mac Discount Notes 0.802%–0.842% 7/3/17 1,560 1,5602,3 Freddie Mac Discount Notes 0.871% 7/13/17 571 5712,3 Freddie Mac Discount Notes 0.911%–0.921% 7/20/17 3,000 2,9992,3 Freddie Mac Discount Notes 0.882% 8/3/17 1,100 1,0992,3 Freddie Mac Discount Notes 1.042% 8/14/17 705 7042,3 Freddie Mac Discount Notes 1.013% 9/6/17 4,502 4,4942,3 Freddie Mac Discount Notes 1.022% 9/18/17 306 3052 United States Treasury Bill 0.770% 7/6/17 4,845 4,8452 United States Treasury Bill 0.861% 7/27/17 1,313 1,3122,5 United States Treasury Bill 0.962% 8/31/17 7,000 6,9892 United States Treasury Bill 0.985%–1.013% 9/21/17 6,570 6,5562 United States Treasury Bill 1.003%–1.008% 9/28/17 10,019 9,9952 United States Treasury Bill 1.003% 10/5/17 545 543
93,493
Total Temporary Cash Investments (Cost $94,077) 94,083
Total Investments (99.9%) (Cost $1,601,199) 1,892,893
Other Assets and Liabilities (0.1%)
Other Assets 8,248
Liabilities (6,722)
1,526
Net Assets (100%)
Applicable to 103,836,583 outstanding $.001 par value shares of
beneficial interest (unlimited authorization) 1,894,419
Net Asset Value Per Share $18.24
Face Market
Maturity Amount Value•
Coupon Date ($000) ($000)
13

Managed Payout Fund
Consolidated Statement of Assets and Liabilities
Assets
Investments in Securities, at Value
Unaffiliated Issuers 93,493
Affiliated Vanguard Funds 1,799,400
Total Investments in Securities 1,892,893
Receivables for Investment Securities Sold 6,612
Receivables for Accrued Income 573
Receivables for Capital Shares Issued 1,063
Total Assets 1,901,141
Liabilities
Payables for Investment Securities Purchased 5,373
Payables for Capital Shares Redeemed 1,164
Payables to Vanguard 23
Other Liabilities 162
Total Liabilities 6,722
Net Assets 1,894,419
At June 30, 2017, net assets consisted of:
Amount
($000)
Paid-in Capital 1,626,930
Overdistributed Net Investment Income (25,563)
Accumulated Net Realized Gains 1,358
Unrealized Appreciation (Depreciation) 291,694
Net Assets 1,894,419
Amount
($000)
• See Note A in Notes to Financial Statements.
1 Affiliated fund available only to Vanguard funds and certain trusts and accounts managed by Vanguard. Rate shown for Vanguard Market Liquidity Fund is the 7-day yield.
2 Security is owned by the Vanguard MPF Portfolio, which is a wholly owned subsidiary of the Managed Payout Fund.
3 The issuer was placed under federal conservatorship in September 2008; since that time, its daily operations have been managed by the Federal Housing Finance Agency and it receives capital from the U.S. Treasury, as needed to maintain a positive net worth, in exchange for senior preferred stock.
4 The issuer operates under a congressional charter; its securities are generally neither guaranteed by the U.S. Treasury nor backed by the full faith and credit of the U.S. government.
5 Securities with a value of $1,553,000 have been segregated as collateral for open swap contracts.
See accompanying Notes, which are an integral part of the Financial Statements.
14

Six Months Ended
June 30, 2017
($000)
Investment Income
Income
Income Distributions Received from Affiliated Funds 13,113
Interest 302
Total Income 13,415
Expenses—Note B
Management and Administrative 176
Trustees’ Fees and Expenses 7
Custodian Fees 11
Total Expenses 194
Net Investment Income 13,221
Realized Net Gain (Loss)
Capital Gain Distributions Received from Affiliated Funds 1,112
Investment Securities Sold 246
Swap Contracts (3,786)
Realized Net Gain (Loss) (2,428)
Change in Unrealized Appreciation (Depreciation) of Investment Securities 93,679
Net Increase (Decrease) in Net Assets Resulting from Operations 104,472
Consolidated Statement of Operations
Managed Payout Fund
See accompanying Notes, which are an integral part of the Financial Statements.
15
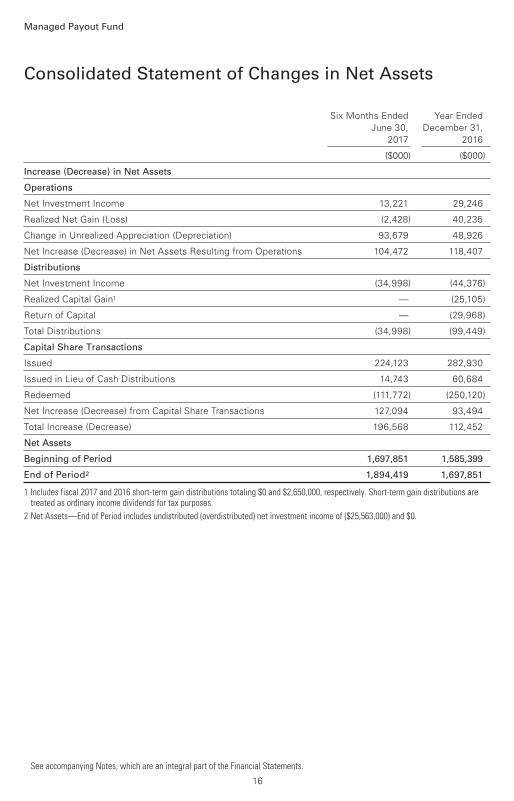
Consolidated Statement of Changes in Net Assets
Managed Payout Fund
See accompanying Notes, which are an integral part of the Financial Statements.
Six Months Ended Year Ended
June 30, December 31,
2017 2016
($000) ($000)
Increase (Decrease) in Net Assets
Operations
Net Investment Income 13,221 29,246
Realized Net Gain (Loss) (2,428) 40,235
Change in Unrealized Appreciation (Depreciation) 93,679 48,926
Net Increase (Decrease) in Net Assets Resulting from Operations 104,472 118,407
Distributions
Net Investment Income (34,998) (44,376)
Realized Capital Gain1 — (25,105)
Return of Capital — (29,968)
Total Distributions (34,998) (99,449)
Capital Share Transactions
Issued 224,123 282,930
Issued in Lieu of Cash Distributions 14,743 60,684
Redeemed (111,772) (250,120)
Net Increase (Decrease) from Capital Share Transactions 127,094 93,494
Total Increase (Decrease) 196,568 112,452
Net Assets
Beginning of Period 1,697,851 1,585,399
End of Period2 1,894,419 1,697,851
1 Includes fiscal 2017 and 2016 short-term gain distributions totaling $0 and $2,650,000, respectively. Short-term gain distributions are treated as ordinary income dividends for tax purposes.
2 Net Assets—End of Period includes undistributed (overdistributed) net investment income of ($25,563,000) and $0.
16
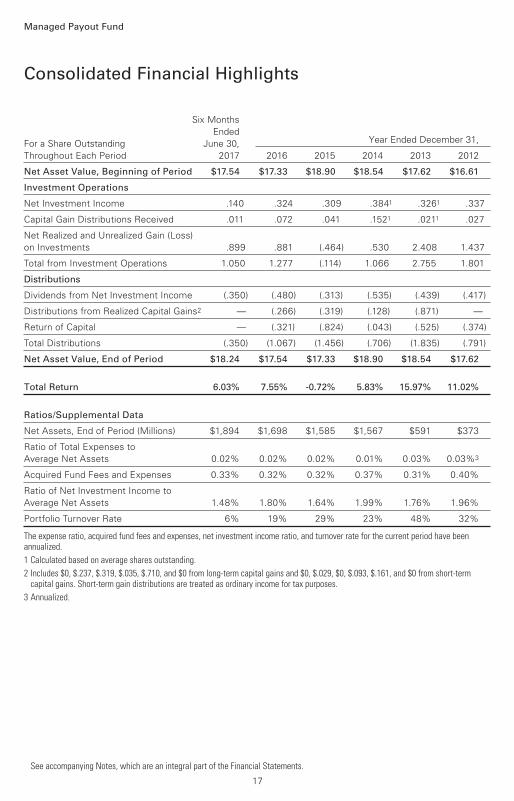
Six Months
Ended
For a Share Outstanding June 30, Year Ended December 31,
Throughout Each Period 2017 2016 2015 2014 2013 2012
Net Asset Value, Beginning of Period $17.54 $17.33 $18.90 $18.54 $17.62 $16.61
Investment Operations
Net Investment Income .140 .324 .309 .3841 .3261 .337
Capital Gain Distributions Received .011 .072 .041 .1521 .0211 .027
Net Realized and Unrealized Gain (Loss)
on Investments .899 .881 (.464) .530 2.408 1.437
Total from Investment Operations 1.050 1.277 (.114) 1.066 2.755 1.801
Distributions
Dividends from Net Investment Income (.350) (.480) (.313) (.535) (.439) (.417)
Distributions from Realized Capital Gains2 — (.266) (.319) (.128) (.871) —
Return of Capital — (.321) (.824) (.043) (.525) (.374)
Total Distributions (.350) (1.067) (1.456) (.706) (1.835) (.791)
Net Asset Value, End of Period $18.24 $17.54 $17.33 $18.90 $18.54 $17.62
Total Return 6.03% 7.55% -0.72% 5.83% 15.97% 11.02%
Ratios/Supplemental Data
Net Assets, End of Period (Millions) $1,894 $1,698 $1,585 $1,567 $591 $373
Ratio of Total Expenses to
Average Net Assets 0.02% 0.02% 0.02% 0.01% 0.03% 0.03%3
Acquired Fund Fees and Expenses 0.33% 0.32% 0.32% 0.37% 0.31% 0.40%
Ratio of Net Investment Income to
Average Net Assets 1.48% 1.80% 1.64% 1.99% 1.76% 1.96%
Portfolio Turnover Rate 6% 19% 29% 23% 48% 32%
The expense ratio, acquired fund fees and expenses, net investment income ratio, and turnover rate for the current period have been annualized.
1 Calculated based on average shares outstanding.
2 Includes $0, $.237, $.319, $.035, $.710, and $0 from long-term capital gains and $0, $.029, $0, $.093, $.161, and $0 from short-term capital gains. Short-term gain distributions are treated as ordinary income for tax purposes.
3 Annualized.
Consolidated Financial Highlights
See accompanying Notes, which are an integral part of the Financial Statements.
Managed Payout Fund
17

Notes to Consolidated Financial Statements
Managed Payout Fund
Vanguard Managed Payout Fund is registered under the Investment Company Act of 1940 as an
open-end investment company, or mutual fund. The fund combines a managed distribution policy
with a strategy to invest across a wide spectrum of asset classes and investments that are expected
to add diversification and result in a more consistent return pattern than a traditional balanced
portfolio of stocks, bonds, and cash. Financial statements and other information about each
underlying fund are available on vanguard.com.
The Consolidated Financial Statements include Vanguard MPF Portfolio (“the subsidiary”), which
commenced operations on February 23, 2015. The subsidiary is wholly owned by the fund and is
a unit trust established in the Cayman Islands under the Trusts Law (2011 Revision) of the Cayman
Islands, which is organized to invest in certain commodity-linked investments on behalf of the fund,
consistent with the fund’s investment objectives and policies. The commodity-linked investments
and other investments held by the subsidiary are subject to the same risks that apply to similar
investments if held directly by the fund. As of June 30, 2017, the fund held $95,971,000 in the
subsidiary, representing 5% of the fund’s net assets. All inter-fund transactions and balances
(including the fund’s investment in the subsidiary) have been eliminated, and the Consolidated
Financial Statements include all investments and other accounts of the subsidiary as if held
directly by the fund.
A. The following significant accounting policies conform to generally accepted accounting principles
for U.S. investment companies. The fund consistently follows such policies in preparing its financial
statements.
1. Security Valuation: Investments are valued at the net asset value of each underlying Vanguard
fund determined as of the close of the New York Stock Exchange (generally 4 p.m., Eastern time)
on the valuation date. Temporary cash investments are valued using the latest bid prices or using
valuations based on a matrix system (which considers such factors as security prices, yields,
maturities, and ratings), both as furnished by independent pricing services.
2. Swap Contracts: The fund gains exposure to commodities through the subsidiary’s investment
in swaps that earn the total return on a specified commodity index. Under the terms of the swaps,
the subsidiary receives the total return on the specified index (receiving the increase or paying the
decrease in the value of the specified index), applied to a notional amount. The subsidiary also pays
a floating rate that is based on short-term interest rates, applied to the notional amount. At the
same time, the subsidiary invests an amount approximating the notional amount of the swap in
high-quality temporary cash investments.
The notional amounts of swap contracts are not recorded in the Consolidated Statement of Assets
and Liabilities. Swaps are valued daily based on market quotations received from independent
pricing services or recognized dealers and the change in value is recorded in the Consolidated
Statement of Assets and Liabilities and Consolidated Statement of Operations as unrealized
appreciation (depreciation) until periodic payments are made, or the termination of the swap,
at which time realized gain (loss) is recorded. A risk associated with all types of swaps is the
possibility that a counterparty may default on its obligation to pay net amounts due to the
subsidiary. The subsidiary’s maximum amount subject to counterparty risk is the unrealized
appreciation on the swap contract. The subsidiary mitigates its counterparty risk by entering
into swaps only with a diverse group of prequalified counterparties, monitoring their financial
strength, entering into master netting arrangements with its counterparties, and requiring its
counterparties to transfer collateral as security for their performance. In the absence of a default,
18

Managed Payout Fund
the collateral pledged or received by the fund cannot be repledged, resold, or rehypothecated.
In the event of a counterparty’s default (including bankruptcy), the subsidiary may terminate
any swap contracts with that counterparty, determine the net amount owed by either party in
accordance with its master netting arrangements, and sell or retain any collateral held up to the
net amount owed to the subsidiary under the master netting arrangements. The swap contracts
contain provisions whereby a counterparty may terminate open contracts if the subsidiary’s net
assets decline below a certain level, triggering a payment by the subsidiary if the subsidiary is in
a net liability position at the time of the termination. The payment amount would be reduced by
any collateral the subsidiary has pledged. Any securities pledged as collateral for open contracts
are noted in the Consolidated Statement of Net Assets. The value of collateral received or pledged
is compared daily to the value of the swap contracts exposure with each counterparty, and any
difference, if in excess of a specified minimum transfer amount, is adjusted and settled within
two business days.
During the six months ended June 30, 2017, the subsidiary’s average amount of investment in
total return swaps represented 7% of net assets, based on the average of notional amounts at
each quarter-end during the period.
3. Federal Income Taxes: The fund intends to continue to qualify as a regulated investment
company and distribute all of its taxable income. The subsidiary is classified as a foreign corporation
for U.S. tax purposes, and because it does not carry on a U.S. trade or business, is generally not
subject to U.S. federal income tax. The subsidiary also complies with the Foreign Account Tax
Compliance Act (“FATCA”) and thus will not be subject to 30% withholding under FATCA on any
income from U.S. investments. In addition, the subsidiary is not subject to Cayman Islands income
tax. The subsidiary will generally distribute any earnings and profits to the fund each year, and such
income will be qualifying income to the fund. Management has analyzed the fund’s tax positions
taken for all open federal income tax years (December 31, 2013–2016) and for the period ended
June 30, 2017, and has concluded that no provision for federal income tax is required in the fund’s
financial statements.
4. Distributions: Distributions to shareholders are recorded on the ex-dividend date. Monthly
distributions are determined based on a specified percentage payout rate of 4% of the fund’s
average net asset value. The monthly distribution rate is reset annually based on changes in the
fund’s average net asset value. Effective January 1, 2017, the monthly distribution rate is $.0584
per share. Distributions declared by the fund are reallocated at fiscal year-end to ordinary income,
capital gain, and return of capital to reflect their tax character.
5. Credit Facility: The fund and certain other funds managed by The Vanguard Group (“Vanguard”)
participate in a $3.1 billion committed credit facility provided by a syndicate of lenders pursuant to
a credit agreement that may be renewed annually; each fund is individually liable for its borrowings,
if any, under the credit facility. Borrowings may be utilized for temporary and emergency purposes,
and are subject to the fund’s regulatory and contractual borrowing restrictions. The participating
funds are charged administrative fees and an annual commitment fee of 0.10% of the undrawn
amount of the facility; these fees are allocated to the funds based on a method approved by the
fund’s board of trustees and borne by the funds in which the fund invests (see Note B). Any
borrowings under this facility bear interest at a rate based upon the higher of the one-month
London Interbank Offered Rate, federal funds effective rate, or overnight bank funding rate plus
an agreed-upon spread.
19

Managed Payout Fund
The fund had no borrowings outstanding at June 30, 2017, or at any time during the period
then ended.
6. Other: Income and capital gain distributions received are recorded on the ex-dividend date.
Premiums and discounts on debt securities purchased are amortized and accreted, respectively, to
interest income over the lives of the respective securities. Security transactions are accounted for
on the date securities are bought or sold. Costs used to determine realized gains (losses) on the
sale of investment securities are those of the specific securities sold.
B. In accordance with the terms of a Funds’ Service Agreement (the “FSA”) between Vanguard
and the fund, Vanguard furnishes to the fund investment advisory, corporate management,
administrative, marketing, and distribution services at Vanguard’s cost of operations (as defined
by the FSA). These costs of operations are allocated to the fund based on methods and guidelines
approved by the board of trustees. The FSA provides that expenses otherwise allocable to
Vanguard funds-of-funds may be reduced or eliminated to the extent of savings realized by the
underlying Vanguard funds. Accordingly, all expenses for services provided by Vanguard to the
fund and all other expenses incurred by the fund during the period ended June 30, 2017, were
borne by the underlying Vanguard funds in which the fund invests. The fund’s trustees and officers
are also trustees and officers, respectively, of the underlying Vanguard funds, as well as directors
and employees, respectively, of Vanguard.
Under a separate agreement, Vanguard provides corporate management and administrative
services to the subsidiary for an annual fee of 0.40% of average net assets of the subsidiary.
In addition, the subsidiary pays an unaffiliated third party, VGMF I (Cayman) Limited, an affiliate
of Maples Trustee Services (Cayman) Limited, a fee plus reasonable additional expenses for
trustee services. All of the subsidiary’s expenses are reflected in the Consolidated Statement of
Operations and in the Ratio of Total Expenses to Average Net Assets in the Consolidated Financial
Highlights. Expenses of Vanguard mutual funds in which the fund invests are reflected in the
Acquired Fund Fees and Expenses in the Consolidated Financial Highlights.
C. Various inputs may be used to determine the value of the fund’s investments. These inputs
are summarized in three broad levels for financial statement purposes. The inputs or methodologies
used to value securities are not necessarily an indication of the risk associated with investing in
those securities.
Level 1—Quoted prices in active markets for identical securities.
Level 2—Other significant observable inputs (including quoted prices for similar securities, interest
rates, prepayment speeds, credit risk, etc.).
Level 3—Significant unobservable inputs (including the fund’s own assumptions used to determine
the fair value of investments).
20
Managed Payout Fund
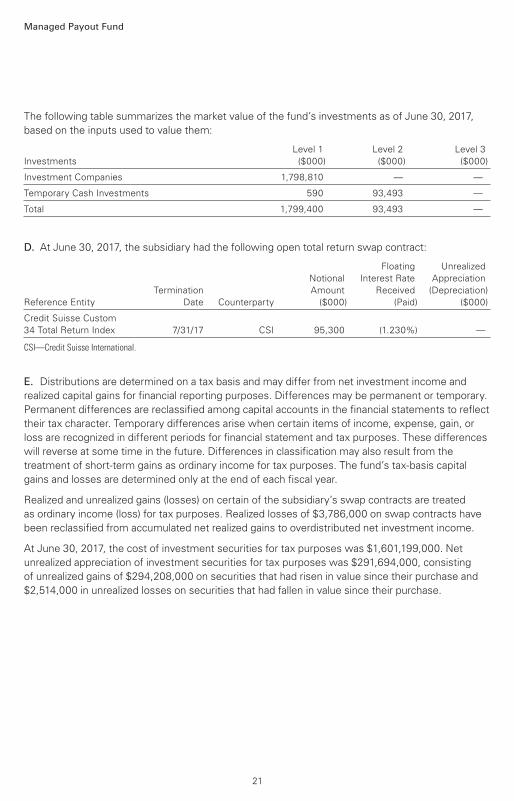
The following table summarizes the market value of the fund’s investments as of June 30, 2017,
based on the inputs used to value them:
Level 1 Level 2 Level 3
Investments ($000) ($000) ($000)
Investment Companies 1,798,810 — —
Temporary Cash Investments 590 93,493 —
Total 1,799,400 93,493 —
D. At June 30, 2017, the subsidiary had the following open total return swap contract:
Floating Unrealized
Notional Interest Rate Appreciation
Termination Amount Received (Depreciation)
Reference Entity Date Counterparty ($000) (Paid) ($000)
Credit Suisse Custom
34 Total Return Index 7/31/17 CSI 95,300 (1.230%) —
CSI—Credit Suisse International.
E. Distributions are determined on a tax basis and may differ from net investment income and
realized capital gains for financial reporting purposes. Differences may be permanent or temporary.
Permanent differences are reclassified among capital accounts in the financial statements to reflect
their tax character. Temporary differences arise when certain items of income, expense, gain, or
loss are recognized in different periods for financial statement and tax purposes. These differences
will reverse at some time in the future. Differences in classification may also result from the
treatment of short-term gains as ordinary income for tax purposes. The fund’s tax-basis capital
gains and losses are determined only at the end of each fiscal year.
Realized and unrealized gains (losses) on certain of the subsidiary’s swap contracts are treated
as ordinary income (loss) for tax purposes. Realized losses of $3,786,000 on swap contracts have
been reclassified from accumulated net realized gains to overdistributed net investment income.
At June 30, 2017, the cost of investment securities for tax purposes was $1,601,199,000. Net
unrealized appreciation of investment securities for tax purposes was $291,694,000, consisting
of unrealized gains of $294,208,000 on securities that had risen in value since their purchase and
$2,514,000 in unrealized losses on securities that had fallen in value since their purchase.
21
Managed Payout Fund
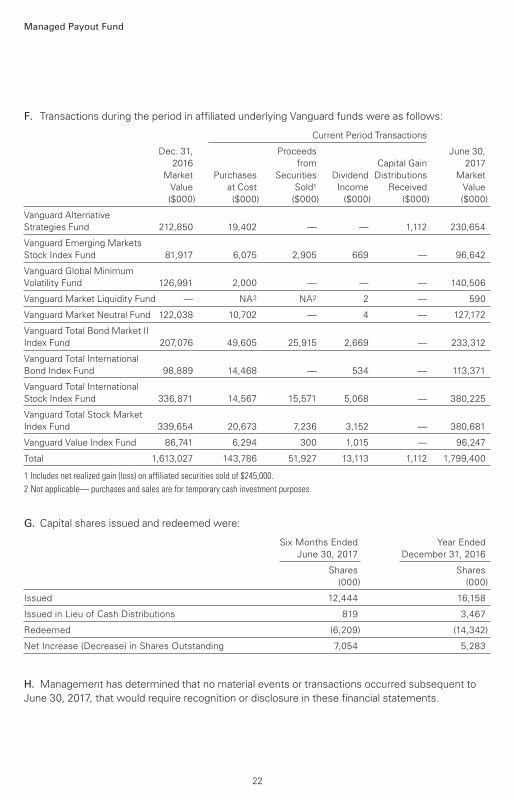
F. Transactions during the period in affiliated underlying Vanguard funds were as follows:
Current Period Transactions
Dec. 31, Proceeds June 30,
2016 from Capital Gain 2017
Market Purchases Securities Dividend Distributions Market
Value at Cost Sold1 Income Received Value
($000) ($000) ($000) ($000) ($000) ($000)
Vanguard Alternative
Strategies Fund 212,850 19,402 — — 1,112 230,654
Vanguard Emerging Markets
Stock Index Fund 81,917 6,075 2,905 669 — 96,642
Vanguard Global Minimum
Volatility Fund 126,991 2,000 — — — 140,506
Vanguard Market Liquidity Fund — NA2 NA2 2 — 590
Vanguard Market Neutral Fund 122,038 10,702 — 4 — 127,172
Vanguard Total Bond Market II
Index Fund 207,076 49,605 25,915 2,669 — 233,312
Vanguard Total International
Bond Index Fund 98,889 14,468 — 534 — 113,371
Vanguard Total International
Stock Index Fund 336,871 14,567 15,571 5,068 — 380,225
Vanguard Total Stock Market
Index Fund 339,654 20,673 7,236 3,152 — 380,681
Vanguard Value Index Fund 86,741 6,294 300 1,015 — 96,247
Total 1,613,027 143,786 51,927 13,113 1,112 1,799,400
1 Includes net realized gain (loss) on affiliated securities sold of $245,000.
2 Not applicable— purchases and sales are for temporary cash investment purposes.
G. Capital shares issued and redeemed were:
Six Months Ended Year Ended
June 30, 2017 December 31, 2016
Shares Shares
(000) (000)
Issued 12,444 16,158
Issued in Lieu of Cash Distributions 819 3,467
Redeemed (6,209) (14,342)
Net Increase (Decrease) in Shares Outstanding 7,054 5,283
H. Management has determined that no material events or transactions occurred subsequent to
June 30, 2017, that would require recognition or disclosure in these financial statements.
22

About Your Fund’s Expenses
23
As a shareholder of the fund, you incur ongoing costs, which include costs for portfolio
management, administrative services, and shareholder reports (like this one), among others.
Operating expenses, which are deducted from a fund’s gross income, directly reduce the
investment return of the fund.
A fund’s expenses are expressed as a percentage of its average net assets. The Managed Payout
Fund, in addition to its own expenses, bears its proportionate share of the costs for the underlying
funds in which it invests. These indirect expenses make up the acquired fund fees and expenses,
also expressed as a percentage of average net assets.
The following examples are intended to help you understand the ongoing cost (in dollars) of investing
in your fund and to compare these costs with those of other mutual funds. The examples are based
on an investment of $1,000 made at the beginning of the period shown and held for the entire
period. The costs were calculated using the expense ratio and the acquired fund fees and expenses
for the Managed Payout Fund.
The accompanying table illustrates your fund’s costs in two ways:
• Based on actual fund return. This section helps you to estimate the actual expenses that you
paid over the period. The ”Ending Account Value“ shown is derived from the fund‘s actual return,
and the third column shows the dollar amount that would have been paid by an investor who started
with $1,000 in the fund. You may use the information here, together with the amount you invested,
to estimate the expenses that you paid over the period.
To do so, simply divide your account value by $1,000 (for example, an $8,600 account value divided
by $1,000 = 8.6), then multiply the result by the number given for your fund under the heading
”Expenses Paid During Period.“
• Based on hypothetical 5% yearly return. This section is intended to help you compare your
fund‘s costs with those of other mutual funds. It assumes that the fund had a yearly return of 5%
before expenses, but that the expense ratio is unchanged. In this case—because the return used is
not the fund’s actual return—the results do not apply to your investment. The example is useful in
making comparisons because the Securities and Exchange Commission requires all mutual funds to
calculate expenses based on a 5% return. You can assess your fund’s costs by comparing this
hypothetical example with the hypothetical examples that appear in shareholder reports of other
funds.
Note that the expenses shown in the table are meant to highlight and help you compare ongoing costs only and do not reflect transaction costs incurred by the fund for buying and selling securities. Further, the expenses do not include any purchase, redemption, or account service fees described in the fund prospectus. If such fees were applied to your account, your costs would be higher. Your fund does not carry a “sales load.”
The calculations assume no shares were bought or sold during the period. Your actual costs may
have been higher or lower, depending on the amount of your investment and the timing of any
purchases or redemptions.
You can find more information about the fund’s expenses, including annual expense ratios, in the
Financial Statements section of this report. For additional information on operating expenses and
other shareholder costs, please refer to your fund’s current prospectus.

24
Six Months Ended June 30, 2017
Managed Payout Fund
Beginning
Account Value
12/31/2016
Ending
Account Value
6/30/2017
Expenses
Paid During
Period
Based on Actual Fund Return $1,000.00 $1,060.31 $1.79
Based on Hypothetical 5% Yearly Return 1,000.00 1,023.06 1.76
These calculations are based on the fund’s expense ratio for the most recent six-month period together with its acquired fund fees andexpenses. The combined, annualized expense figure for the period shown is 0.35%. The dollar amount shown as “Expenses Paid” is equalto the expense figure multiplied by the average account value over the period, multiplied by the number of days in the most recentsix-month period, then divided by the number of days in the most recent 12-month period (181/365).

The board of trustees of Vanguard Managed Payout Fund has renewed the fund’s investment
advisory arrangement with The Vanguard Group, Inc. (Vanguard), through its Quantitative Equity
Group. The board determined that continuing the fund’s internalized management structure was
in the best interests of the fund and its shareholders.
The board based its decision upon an evaluation of the advisor’s investment staff, portfolio
management process, and performance. This evaluation included information provided to the
board by Vanguard’s Portfolio Review Department, which is responsible for fund and advisor
oversight and product management. The Portfolio Review Department met regularly with the
advisor and made monthly presentations to the board during the fiscal year that directed the
board’s focus to relevant information and topics.
The board, or an investment committee made up of board members, also received information
throughout the year during advisor presentations. For each advisor presentation, the board was
provided with letters and reports that included information about, among other things, the advisory
firm and the advisor’s assessment of the investment environment, portfolio performance, and
portfolio characteristics.
In addition, the board received monthly reports, which included a Market and Economic Report,
a Fund Dashboard Monthly Summary, and a Fund Performance Report.
Prior to their meeting, the trustees were provided with a memo and materials that summarized the
information they received over the course of the year. They also considered the factors discussed
below, among others. However, no single factor determined whether the board approved the
arrangement. Rather, it was the totality of the circumstances that drove the board’s decision.
Nature, extent, and quality of services
The board reviewed the quality of the investment management services provided to the fund
since its inception in 2008, and took into account the organizational depth and stability of the
advisor. The board considered that Vanguard has been managing investments for more than three
decades. The Quantitative Equity Group adheres to a sound, disciplined investment management
process; the team has considerable experience, stability, and depth.
The board concluded that Vanguard’s experience, stability, depth, and performance, among other
factors, warranted continuation of the advisory arrangement.
Investment performance
The board considered the fund’s performance since its inception in 2008, including any periods
of outperformance or underperformance compared with a benchmark index. The board concluded
that the performance was such that the advisory arrangement should continue. Information about
the fund’s most recent performance can be found in the Performance Summary section of
this report.
Cost
The board concluded that the expenses of each of the underlying funds in which the Managed
Payout Fund invests are well below their peer-group averages. Information about the fund’s
expenses and acquired fund fees and expenses appears in the About Your Fund’s Expenses
section of this report as well as in the Consolidated Financial Statements section.
Trustees Approve Advisory Arrangement
25
The board does not conduct a profitability analysis of Vanguard because of Vanguard’s unique
“at-cost” structure. Unlike most other mutual fund management companies, Vanguard is owned
by the funds it oversees and produces “profits” only in the form of reduced expenses for fund
shareholders.
The benefit of economies of scale
The board concluded that Vanguard’s at-cost arrangement with the fund and its underlying funds
ensures that the fund will realize economies of scale as the assets of the underlying funds grow,
with the cost to shareholders declining as assets increase.
The board will consider whether to renew the advisory arrangement again after a one-year period.
26
Glossary
27
30-Day SEC Yield. A fund’s 30-day SEC yield is derived using a formula specified by the U.S.
Securities and Exchange Commission. Under the formula, data related to the fund’s security
holdings in the previous 30 days are used to calculate the fund’s hypothetical net income for that
period, which is then annualized and divided by the fund’s estimated average net assets over the
calculation period. For the purposes of this calculation, a security’s income is based on its current
market yield to maturity (for bonds), its actual income (for asset-backed securities), or its
projected dividend yield (for stocks). Because the SEC yield represents hypothetical annualized
income, it will differ—at times significantly—from the fund’s actual experience. As a result, the
fund’s income distributions may be higher or lower than implied by the SEC yield.
Acquired Fund Fees and Expenses. Funds that invest in other Vanguard funds bear
proportionate shares of the operating, administrative, and advisory expenses of the underlying
funds, and they must pay any fees charged by those funds. The figure for acquired fund fees and
expenses represents a weighted average of these underlying costs. Acquired is a term that the
Securities and Exchange Commission applies to any mutual fund whose shares are owned by
another fund.
Beta. A measure of the magnitude of a fund’s past share-price fluctuations in relation to the ups
and downs of a given market index. The index is assigned a beta of 1.00. Compared with a given
index, a fund with a beta of 1.20 typically would have seen its share price rise or fall by 12%
when the index rose or fell by 10%. For this report, beta is based on returns over the past 36
months for both the fund and the index. Note that a fund’s beta should be reviewed in conjunction
with its R-squared (see definition). The lower the R-squared, the less correlation there is between
the fund and the index, and the less reliable beta is as an indicator of volatility.
Expense Ratio. A fund’s total annual operating expenses expressed as a percentage of the fund’s
average net assets. The expense ratio includes management and administrative expenses, but
does not include the transaction costs of buying and selling portfolio securities.
Inception Date. The date on which the assets of a fund (or one of its share classes) are first
invested in accordance with the fund’s investment objective. For funds with a subscription period,
the inception date is the day after that period ends. Investment performance is measured from
the inception date.
R-Squared. A measure of how much of a fund’s past returns can be explained by the returns
from the market in general, as measured by a given index. If a fund’s total returns were precisely
synchronized with an index’s returns, its R-squared would be 1.00. If the fund’s returns bore no
relationship to the index’s returns, its R-squared would be 0. For this report, R-squared is based
on returns over the past 36 months for both the fund and the index.

28
Benchmark Information
Managed Payout Composite Index: Weighted 36% CRSP US Total Market Index, 24.5%
Bloomberg Barclays U.S. Aggregate Float Adjusted Index, 24% FTSE Global All Cap ex US Index,
10.5% Bloomberg Barclays Global Aggregate ex-USD Float Adjusted RIC Capped Index (USD
Hedged), and 5% Bloomberg Commodity Index as of May 1, 2015. In prior periods, the composite
was 42% CRSP US Total Market Index, 28% Bloomberg Barclays U.S. Aggregate Float Adjusted
Index, 18% FTSE Global All Cap ex US Index, 7% Bloomberg Barclays Global Aggregate ex-USD
Float Adjusted RIC Capped Index (USD Hedged), and 5% Bloomberg Commodity Index (Dow
Jones-UBS Commodity Index through June 30, 2014) through April 30, 2015; and 35% CRSP US
Total Market Index (MSCI US Broad Market Index through May 31, 2013), 12% Bloomberg
Barclays U.S. Aggregate Float Adjusted Index (Bloomberg Barclays U.S. Aggregate Bond Index
through December 31, 2009), 15% FTSE Global All Cap ex US Index (MSCI All Country World ex
USA Investable Market Index through May 31, 2013), 3% Bloomberg Barclays Global Aggregate
ex-USD Float Adjusted RIC Capped Index (USD Hedged), 15% Citigroup Three-Month U.S.
Treasury Bill Index, 10% Dow Jones-UBS Commodity Index, and 10% REIT Spliced Index (MSCI
US REIT Index adjusted to include a 2% cash position through April 30, 2009) through January 31,
2014. International stock benchmark returns are adjusted for withholding taxes.

The People Who Govern Your Fund
The trustees of your mutual fund are there to see that the fund is operated and managed in your
best interests since, as a shareholder, you are a part owner of the fund. Your fund’s trustees also
serve on the board of directors of The Vanguard Group, Inc., which is owned by the Vanguard
funds and provides services to them on an at-cost basis.
A majority of Vanguard’s board members are independent, meaning that they have no affiliation
with Vanguard or the funds they oversee, apart from the sizable personal investments they have
made as private individuals. The independent board members have distinguished backgrounds
in business, academia, and public service. Each of the trustees and executive officers oversees
197 Vanguard funds.
Information for each trustee and executive officer of the fund appears below. The mailing address
of the trustees and officers is P.O. Box 876, Valley Forge, PA 19482. More information about the
trustees is in the Statement of Additional Information, which can be obtained, without charge,
by contacting Vanguard at 800-662-7447, or online at vanguard.com.
Interested Trustee1
F. William McNabb III
Born 1957. Trustee Since July 2009. Chairman of
the Board. Principal Occupation(s) During the Past
Five Years and Other Experience: Chairman of the
Board of The Vanguard Group, Inc., and of each of
the investment companies served by The Vanguard
Group, since January 2010; Director of The Vanguard
Group since 2008; Chief Executive Officer and
President of The Vanguard Group, and of each of
the investment companies served by The Vanguard
Group, since 2008; Director of Vanguard Marketing
Corporation; Managing Director of The Vanguard
Group (1995–2008).
Independent Trustees
Emerson U. Fullwood
Born 1948. Trustee Since January 2008. Principal
Occupation(s) During the Past Five Years and Other
Experience: Executive Chief Staff and Marketing
Officer for North America and Corporate Vice President
(retired 2008) of Xerox Corporation (document manage-
ment products and services); Executive in Residence
and 2009–2010 Distinguished Minett Professor at
the Rochester Institute of Technology; Lead Director
of SPX FLOW, Inc. (multi-industry manufacturing);
Director of the United Way of Rochester, the University
of Rochester Medical Center, Monroe Community
College Foundation, North Carolina A&T University,
and Roberts Wesleyan College; Trustee of the
University of Rochester.
Rajiv L. Gupta
Born 1945. Trustee Since December 2001.2 Principal
Occupation(s) During the Past Five Years and Other
Experience: Chairman and Chief Executive Officer
(retired 2009) and President (2006–2008) of Rohm
and Haas Co. (chemicals); Director of Arconic Inc.
(diversified manufacturer), HP Inc. (printer and
personal computer manufacturing), and Delphi
Automotive plc (automotive components); Senior
Advisor at New Mountain Capital.
Amy Gutmann
Born 1949. Trustee Since June 2006. Principal
Occupation(s) During the Past Five Years and Other
Experience: President of the University of Pennsylvania;
Christopher H. Browne Distinguished Professor of
Political Science, School of Arts and Sciences, and
Professor of Communication, Annenberg School for
Communication, with secondary faculty appointments
in the Department of Philosophy, School of Arts and
Sciences, and at the Graduate School of Education,
University of Pennsylvania; Trustee of the National
Constitution Center.
JoAnn Heffernan Heisen
Born 1950. Trustee Since July 1998. Principal
Occupation(s) During the Past Five Years and Other
Experience: Corporate Vice President and Member of
the Executive Committee (1997–2008), Chief Global
Diversity Officer (retired 2008), Vice President and
Chief Information Officer (1997–2006), Controller
(1995–1997), Treasurer (1991–1995), and Assistant
Treasurer (1989–1991) of Johnson & Johnson
(pharmaceuticals/medical devices/consumer
products); Director of Skytop Lodge Corporation
(hotels) and the Robert Wood Johnson Foundation;
Member of the Advisory Board of the Institute for
Women’s Leadership at Rutgers University.
F. Joseph Loughrey
Born 1949. Trustee Since October 2009. Principal
Occupation(s) During the Past Five Years and Other
Experience: President and Chief Operating Officer
(retired 2009) of Cummins Inc. (industrial machinery);
Chairman of the Board of Hillenbrand, Inc. (specialized
consumer services), Oxfam America, and the Lumina

Foundation for Education; Director of the V Foundation
for Cancer Research; Member of the Advisory Council
for the College of Arts and Letters and Chair of the
Advisory Board to the Kellogg Institute for International
Studies, both at the University of Notre Dame.
Mark Loughridge
Born 1953. Trustee Since March 2012. Principal
Occupation(s) During the Past Five Years and Other
Experience: Senior Vice President and Chief Financial
Officer (retired 2013) at IBM (information technology
services); Fiduciary Member of IBM’s Retirement
Plan Committee (2004–2013); Director of the Dow
Chemical Company; Member of the Council on
Chicago Booth.
Scott C. Malpass
Born 1962. Trustee Since March 2012. Principal
Occupation(s) During the Past Five Years and Other
Experience: Chief Investment Officer and Vice
President at the University of Notre Dame; Assistant
Professor of Finance at the Mendoza College of
Business at Notre Dame; Member of the Notre Dame
403(b) Investment Committee, the Board of Advisors
for Spruceview Capital Partners, the Board of Catholic
Investment Services, Inc. (investment advisor), and
the Board of Superintendence of the Institute for the
Works of Religion; Chairman of the Board of TIFF
Advisory Services, Inc. (investment advisor).
André F. Perold
Born 1952. Trustee Since December 2004. Principal
Occupation(s) During the Past Five Years and Other
Experience: George Gund Professor of Finance and
Banking, Emeritus at the Harvard Business School
(retired 2011); Chief Investment Officer and
Co-Managing Partner of HighVista Strategies
LLC (private investment firm); Overseer of the
Museum of Fine Arts Boston.
Peter F. Volanakis
Born 1955. Trustee Since July 2009. Principal
Occupation(s) During the Past Five Years and Other
Experience: President and Chief Operating Officer
(retired 2010) of Corning Incorporated (communications
equipment); Chairman of the Board of Trustees of
Colby-Sawyer College; Member of the Board of
Hypertherm, Inc. (industrial cutting systems,
software, and consumables).
Executive Officers
Glenn Booraem
Born 1967. Investment Stewardship Officer Since
February 2017. Principal Occupation(s) During the
Past Five Years and Other Experience: Principal of
The Vanguard Group, Inc.; Treasurer (2015–2017),
Controller (2010–2015), and Assistant Controller
(2001–2010) of each of the investment companies
served by The Vanguard Group.
Thomas J. Higgins
Born 1957. Chief Financial Officer Since September
2008. Principal Occupation(s) During the Past Five
Years and Other Experience: Principal of The Vanguard
Group, Inc.; Chief Financial Officer of each of the
investment companies served by The Vanguard
Group; Treasurer of each of the investment companies
served by The Vanguard Group (1998–2008).
Peter Mahoney
Born 1974. Controller Since May 2015. Principal
Occupation(s) During the Past Five Years and Other
Experience: Principal of The Vanguard Group, Inc.;
Controller of each of the investment companies served
by The Vanguard Group; Head of International Fund
Services at The Vanguard Group (2008–2014).
Anne E. Robinson
Born 1970. Secretary Since September 2016. Principal
Occupation(s) During the Past Five Years and Other
Experience: Managing Director of The Vanguard
Group, Inc.; General Counsel of The Vanguard Group;
Secretary of The Vanguard Group and of each of the
investment companies served by The Vanguard Group;
Director and Senior Vice President of Vanguard
Marketing Corporation; Managing Director and
General Counsel of Global Cards and Consumer
Services at Citigroup (2014–2016); Counsel at
American Express (2003–2014).
Michael Rollings
Born 1963. Treasurer Since February 2017. Principal
Occupation(s) During the Past Five Years and Other
Experience: Managing Director of The Vanguard
Group, Inc.; Treasurer of each of the investment
companies served by The Vanguard Group; Director
of Vanguard Marketing Corporation; Executive Vice
President and Chief Financial Officer of MassMutual
Financial Group (2006–2016).
Vanguard Senior Management Team
Mortimer J. Buckley James M. Norris
John James Thomas M. Rampulla
Martha G. King Glenn W. Reed
John T. Marcante Karin A. Risi
Chris D. McIsaac
Chairman Emeritus and Senior Advisor
John J. Brennan
Chairman, 1996–2009
Chief Executive Officer and President, 1996–2008
Founder
John C. Bogle
Chairman and Chief Executive Officer, 1974–1996
1 Mr. McNabb is considered an “interested person,” as defined in the Investment Company Act of 1940, because he is an officer of the Vanguard funds.
2 December 2002 for Vanguard Equity Income Fund, the Vanguard Municipal Bond Funds, and the Vanguard State Tax-Exempt Funds.

P.O. Box 2600
Valley Forge, PA 19482-2600
Connect with Vanguard® > vanguard.com
Fund Information > 800-662-7447
Direct Investor Account Services > 800-662-2739
Institutional Investor Services > 800-523-1036
Text Telephone for PeopleWho Are Deaf or Hard of Hearing > 800-749-7273
This material may be used in conjunctionwith the offering of shares of any Vanguardfund only if preceded or accompanied bythe fund’s current prospectus.
All comparative mutual fund data are from Lipper, aThomson Reuters Company, or Morningstar, Inc., unlessotherwise noted.
You can obtain a free copy of Vanguard’s proxy votingguidelines by visiting vanguard.com/proxyreporting or bycalling Vanguard at 800-662-2739. The guidelines arealso available from the SEC’s website, sec.gov. Inaddition, you may obtain a free report on how your fundvoted the proxies for securities it owned during the 12months ended June 30. To get the report, visit eithervanguard.com/proxyreporting or sec.gov.
You can review and copy information about your fund atthe SEC’s Public Reference Room in Washington, D.C. Tofind out more about this public service, call the SEC at202-551-8090. Information about your fund is alsoavailable on the SEC’s website, and you can receivecopies of this information, for a fee, by sending arequest in either of two ways: via email addressed [email protected] or via regular mail addressed to thePublic Reference Section, Securities and ExchangeCommission, Washington, DC 20549-1520.
CFA® is a registered trademark owned by CFAInstitute.
© 2017 The Vanguard Group, Inc.All rights reserved.Vanguard Marketing Corporation, Distributor.
Q14972 082017


