29
Vanguard Research: Megatrends A Tale of Two Paths: The Future of China For institutional and sophisticated investors only. Not for public distribution.
Vanguard Research:
Megatrends
A Tale of Two Paths: The Future of China
For institutional and sophisticated investors only. Not for public distribution.

About the Megatrends seriesMegatrends have accompanied humankind throughout history. From the Neolithic Revolution to the Information Age, innovation has been the catalyst for profound socioeconomic, cultural, and political transformation. The term “Megatrends” was popularized by author John Naisbitt, who was interested in the transformative forces that have a major impact on both businesses and societies, and thus the potential to change all areas of our personal and professional lives.
Vanguard’s “Megatrends” is a research effort that investigates fundamental shifts in the global economic landscape that are likely to affect the financial services industry and broader society. A megatrend may bring market growth or destroy it, increase competition or add barriers to entry, and create threats or uncover opportunities. Exploring the long-term nature of massive shifts in technology, demographics, and globalization can help us better understand how such forces may shape future markets, individuals, and the investing landscape in the years ahead.
Vanguard Investment Strategy Group’s Global Economics Team
From left to right: Joseph Davis, Ph.D., Global Chief Economist; Roger A. Aliaga-Díaz, Ph.D., Americas Chief Economist; Peter Westaway, Ph.D., Europe Chief Economist; Qian Wang, Ph.D., Asia-Pacific Chief Economist. Americas: Jonathan Lemco, Ph.D.; Andrew J. Patterson, CFA; Joshua M. Hirt, CFA; Maximilian Wieland; Asawari Sathe, M.Sc.; Adam J. Schickling, CFA. Europe: Shaan Raithatha, CFA; Roxane Spitznagel, M.Sc.; Griffin Tory. Asia-Pacific: Beatrice Yeo, CFA; Alexis Gray, M.Sc.
2 For institutional and sophisticated investors only. Not for public distribution.

MegatrendA Tale of Two Paths: The Future of China
■ China’s rise over the past century has seen its economy grow from being a tenth ofthe size of the U.S. economy in the 1990s to close to two-thirds of the size today,raising speculation that it might eventually overtake the U.S. as the world’s economicpowerhouse.1
■ Whether China tips the global balance of economic power or remains stuck in themiddle-income trap over the next two decades will hinge primarily on its ability tomaneuver through rising international and domestic challenges. Based on a panelregression model across 100 countries over 20 years, we find that there remainsconsiderable room for China to boost productivity through increases in educationquality, domestic innovation, privatization reforms, and a more symmetric openingof capital markets.
■ Under our assumption of a moderate pace of domestic reforms in a “slowbalized”world, China will eventually surpass the U.S. in its economic size—but only after 2050.2
However, should China accelerate its domestic reforms immediately, the time taken toreach U.S. GDP could be further reduced by around 10 years. Alternatively, should Chinafail to implement domestic reforms in a timely manner, the economy may eventually finditself trudging down the path of long-term stagnation, with growth likely falling below 2%.
■ China’s long-term trajectory has implications for global growth, geopolitics, andfinancial markets. Spillovers from its new sources of growth, the need to balanceglobal economic power, and the potential expansion of its equity and bond marketswill have an impact on regional economies and investors.
1 Size is measured using the level of nominal GDP in USD, sourced from the World Bank.
2 In a “slowbalized” world, the most likely trajectory for global trade lies somewhere between the rapid growth we saw before the global financial crisis in 2008 and outright deglobalization; see Lemco et al. (2021).
Authors
Qian Wang, Ph.D. Adam J. Schickling, CFA Beatrice Yeo, CFA
3For institutional and sophisticated investors only. Not for public distribution.

4
China’s economic rise: Reforms hold the key to a brighter future
China’s double-digit growth during the last three decades has elevated its economy to the second largest in the world after the U.S. and has made it the largest manufacturer and exporter, as well as the biggest holder of foreign exchange reserves. The country’s importance is expected to grow in coming years as it boosts domestic demand and further opens its capital markets (Figure 1). However, the economy’s rapid rise has added to concerns about potential shifts in the gravity of economic power from the West to the East.
Should China sustain its growth at the minimum 4.7% annualized rate needed to achieve its medium-term goal of doubling GDP per capita by 2035, it will surpass the U.S. to become the world’s largest economy by 2040.3 At first glance, this growth rate seems easily reachable, given that the economy has averaged 6.7% growth from 2014 to 2019. But international experience tells us that such high potential growth rates are unsustainable as the catch-up effect fades and competitive advantages soften. Many middle-income countries fall into stagnation after failing to implement much-needed structural reforms to offset these headwinds, a phenomenon often referred to as the “middle-income trap.”4 Furthermore, China
3 See China’s 14th Five-Year Plan announcement pertaining to its 2035 goal of doubling GDP per capita: https://www.globaltimes.cn/content/1205131.shtml.
4 The phrase “middle-income trap” was first raised by Garrett (2004). He observed that many middle-income countries fell into stagnation because they failed to compete with both high-income countries (because of a lack of technology and supportive system) and low-income countries (because of lack of cheap labor). Latin American and Middle Eastern countries are examples of the middle-income trap. This occurs because of unfavorable demographic dynamics; low economic diversity; inefficient financial markets; lack of high-quality infrastructure; low innovation; weak economic, political, and judicial systems; and inefficient labor markets. These factors must be mitigated by structural reforms.
faces unique constraints such as high leverage and overcapacity issues, as well as long-established, more well-known productivity headwinds from inefficient state-owned enterprises, combined with new challenges resulting from a more hostile global geopolitical environment.
Against this backdrop, we examine the current headwinds facing China and explore reforms needed to ensure its long-term competitiveness amid a more uncertain external environment. We conclude that China will most likely be able to successfully transition from high-growth economic miracle to a slower, more sustainable growth path that places a greater weight on an innovative, private-enterprise, and consumer-driven economy. This will enable it to eventually double its economic size—but not until 2040—and surpass the U.S. economy in nominal GDP terms after 2050. However, we acknowledge the risks involved in this transition, such as if China fails to engineer institutional reforms in a timely manner or if an outright deglobalization complicates matters further. Whether China successfully maneuvers these challenges and rises to become a global superpower will have important spillover effects on regional economies, geopolitics, and investors, which will be discussed in the second half of this paper.
Figure 1. China’s economic rise has further room to run
4%
10%
4%7%
3% 3%6%
1% 1%
16%
29%
13%
23%
12%10%
16%
8%
14%
24%
17%
9%
4%
35%
22%
16%
40% 39%
GDP Manufacturingoutput
Exports Foreignexchangereserves
Consumption Foreigndirect
investments
U.S.Treasuryholdings
Equitymarket
Bondmarket
China 2000 China 2019 U.S. 2019
Percentage of world total
Sources: Vanguard calculations, based on data from the United Nations database.
For institutional and sophisticated investors only. Not for public distribution.

5
A lower risk of hard landing, but secular risks remain
Vanguard’s 2017 white paper Navigating the Transition: China’s Future at a Crossroads highlighted how high debt ratios, overcapacity in the industrial sector, and rising asset bubbles posed downside risks for potential growth and elevated concerns around a near-term hard landing for China. On this front, it is commendable that the deleveraging, decapacity, and destocking campaigns in recent years, along with a more prudent focus on “quality” of growth and sound macroprudential measures, have helped reduce key economic and financial imbalances (see Figure A-1 in the Appendix on page 25).5 This in turn reduces the chance of a near-term hard landing and places China in a better position to engineer further structural reforms needed to strengthen its long-term growth potential.6
5 Excluding 2020, the pace of increase in China’s debt ratios, for instance, has more than halved in the last five years, while the significant buildup of assets in the industrial sector has also seen improvements following the ramp-up in the capacity utilization rate. Although 2020 saw some retracements in this financial derisking progress in efforts to combat COVID-19, a large part of the increase in the debt-to-GDP ratio can be attributed to weaker nominal GDP rather than a significant buildup in credit. In fact, credit growth increased by a total of only 2.8 percentage points during 2020, compared with 20 percentage points during the 2008 global financial crisis.
6 A hard landing is defined as GDP growth falling sharply below 2% before rebounding over time as policymakers are forced to enact policy reforms (i.e., a V-shaped growth trajectory).
Yet prevalent supply-side headwinds suggest that China is not immune to risks associated with long-term stagnation. Specifically, China has now approached a point where the catch-up effect associated with historically high growth rates when income levels are relatively low is rapidly diminishing as it becomes richer (Figure 2). Although countries such as Japan and South Korea experienced similar declines in growth rates in the 1970s and 1990s, respectively, globalization, industrial innovation, and structural reforms allowed them to successfully transition to high-income status. Whether China follows in their footsteps or remains stuck in middle-income status will hinge, critically, on whether it can innovate and institute reforms amid external and domestic headwinds.
Figure 2. As countries move to higher-income status, growth slows
0
2
4
6
8
10
12%
0 5,000 10,000 15,000 20,000 25,000 30,000 35,000 40,000 45,000 50,000
Five
-yea
r av
erag
e an
nu
al g
row
thra
te o
f re
al G
DP
per
cap
ita
Real GDP per capita (2010 USD)
Japan 2019
China 2019
South Korea 2019 Asian tigers 2019
19651965
1965
1965
Note: “Asian tigers” are the high-growth economies of South Korea, Hong Kong, Taiwan, and Singapore.Sources: Vanguard calculations, based on data from the World Bank.
For institutional and sophisticated investors only. Not for public distribution.
6
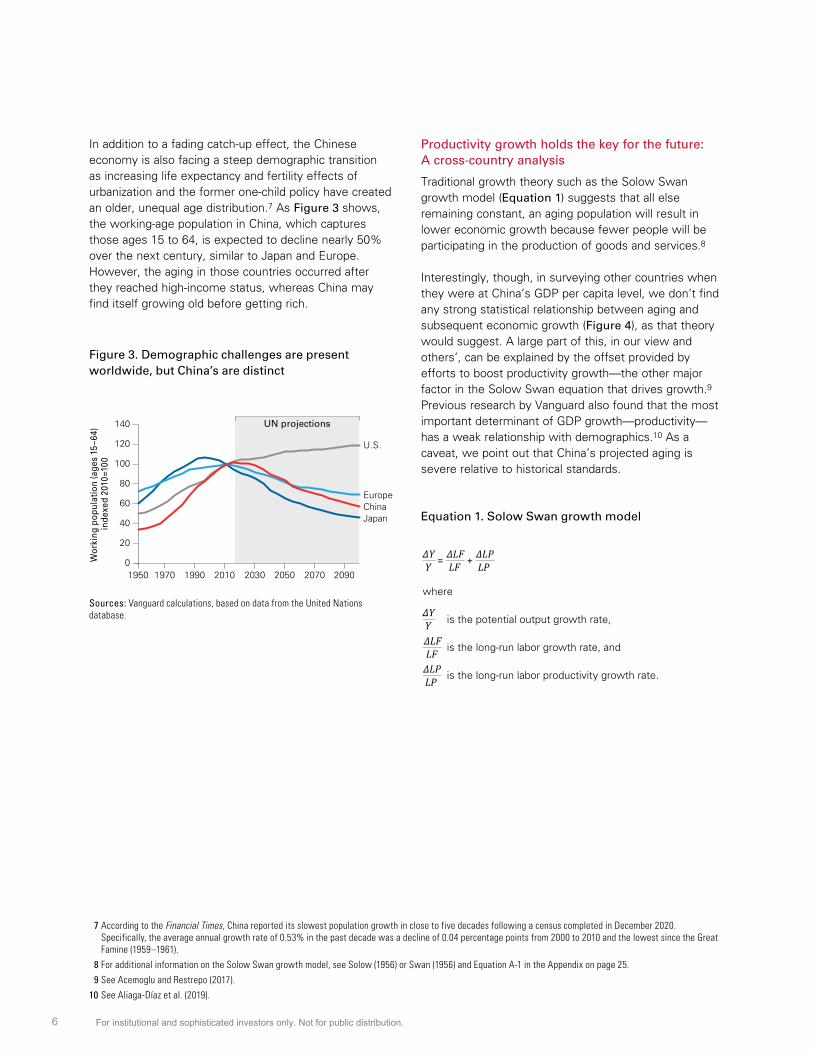
In addition to a fading catch-up effect, the Chinese economy is also facing a steep demographic transition as increasing life expectancy and fertility effects of urbanization and the former one-child policy have created an older, unequal age distribution.7 As Figure 3 shows, the working-age population in China, which captures those ages 15 to 64, is expected to decline nearly 50% over the next century, similar to Japan and Europe. However, the aging in those countries occurred after they reached high-income status, whereas China may find itself growing old before getting rich.
7 According to the Financial Times, China reported its slowest population growth in close to five decades following a census completed in December 2020. Specifically, the average annual growth rate of 0.53% in the past decade was a decline of 0.04 percentage points from 2000 to 2010 and the lowest since the Great Famine (1959–1961).
8 For additional information on the Solow Swan growth model, see Solow (1956) or Swan (1956) and Equation A-1 in the Appendix on page 25.
9 See Acemoglu and Restrepo (2017).
10 See Aliaga-Díaz et al. (2019).
Productivity growth holds the key for the future: A cross-country analysis
Traditional growth theory such as the Solow Swan growth model (Equation 1) suggests that all else remaining constant, an aging population will result in lower economic growth because fewer people will be participating in the production of goods and services.8
Interestingly, though, in surveying other countries when they were at China’s GDP per capita level, we don’t find any strong statistical relationship between aging and subsequent economic growth (Figure 4), as that theory would suggest. A large part of this, in our view and others’, can be explained by the offset provided by efforts to boost productivity growth—the other major factor in the Solow Swan equation that drives growth.9 Previous research by Vanguard also found that the most important determinant of GDP growth—productivity—has a weak relationship with demographics.10 As a caveat, we point out that China’s projected aging is severe relative to historical standards.
Figure 3. Demographic challenges are present worldwide, but China’s are distinct
0
20
40
60
80
100
120
140
1950 1970 1990 2010 2030 2050 2070 2090
ChinaJapan
U.S.
Europe
UN projections
Wor
king
pop
ulat
ion
(age
s 15
–64)
in
dexe
d 20
10=1
00
Sources: Vanguard calculations, based on data from the United Nations database.
Equation 1. Solow Swan growth model
ΔY ΔLF ΔLPLF LPY +=
where
is the potential output growth rate,
is the long-run labor growth rate, and
is the long-run labor productivity growth rate.
ΔYYΔLFLFΔLPLP
For institutional and sophisticated investors only. Not for public distribution.

7
Figure 4. No clear evidence that demographic deficits derail subsequent growth rates
R² = 0.0012
–2
–1
0
1
2
3%
–4 –2 0 2 4 6 8 10%
15-y
ear
chan
ge
in la
bo
r fo
rce
(CA
GR
)
15-year change in real GDP (CAGR)
China projected
Notes: Growth rates are the compound annual growth rate (CAGR) over the 15-year period, or the longest available depending on the start date (when the country was China’s current GDP per capita size). The dotted gray line reflects that in this data sample, any relationship between labor force growth and GDP growth appears inconclusive.Sources: Vanguard calculations, based on data from the World Bank.
To determine the major factors that have explained productivity growth over the past half-century, we began with a cross-country panel regression model similar to the one used by Li et al. (2017). Their model sought to examine the correlation between per capita income and education in five specific years across more than 100 countries, with the only explanatory variable being the average years of schooling for those age 25 or above. To assess China’s position relative to the rest of the world, the authors excluded China for all regressions, then
examined the position of China relative to the regression line in each of the five years. We build upon this framework by adding additional variables that could help explain productivity growth over time, including core control variables such as investment and government share of GDP, as well as less conventional variables such as privatization reforms, research and development (R&D) spending, and economic globalization on both trade and capital terms (Figure 5).
For institutional and sophisticated investors only. Not for public distribution.

8
Figure 5. Drivers of productivity growth
Driver Description
Human capital
Li et al. (2017) found a strong relationship between education and a country’s income levels, with a 0.1-year rise in the years of schooling associated with a 2.6% rise in income. In our model, we measure human capital using the average years of schooling for those age 25 and above.
Investment and government share of GDP
In a growth decomposition exercise, Caselli, Esquivel, and Lefort (1996) included core variables traditionally considered vital to an economy’s growth potential, such as total stock of initial physical capital, population growth rate, and government spending. We build upon their approach by including investment and government share of GDP as independent variables in our regression.
Idea Diffusion
Using a proprietary “Idea Diffusion” metric, Davis et al. (2020) found that the global sharing of ideas leads to a more productive world. Specifically, the authors estimate that a 0.1-unit rise in Idea Diffusion increases the average growth rate in real output per worker by 2% over a five-year period. In other words, as an economy absorbs more ideas from outside its domestic knowledge pool, it generally grows at a higher rate than if all ideas were domestically sourced. We include this measure in our cross-country regression to proxy for global innovation.
R&D share of GDP
In addition to global innovation, domestic innovation and R&D have proven to be an important contributor to productivity growth. In particular, Guellec and van Pottelsberghe de la Potterie (2001) found that an increase of 1% in domestic R&D generates 0.13% in productivity growth. We proxy domestic innovation via R&D spending as a percentage of GDP in our regression.
Privatization reforms
Barro (2003) found that institutional quality is among the most important determinants of long-run per capita output. We build upon this by including a regulatory quality index from the World Bank, which measures perceptions of the ability of the government to formulate and implement sound policies and regulations that permit and promote private sector development.
Economic globalization
Lee (2016) found that a higher degree of trade openness has a strong, positive effect on GDP per capita. We build upon this by including an economic globalization variable that incorporates both trade globalization and capital liberalization measures from the KOF Swiss Economic Institute. Capital liberalization was included in addition to trade liberalization because academic literature suggests that the growth rate of output per worker rises by an average of 2.3% per year when emerging economies liberalize their capital markets (Henry, 2003). This finding can be attributed to a more efficient allocation of capital and a decrease in the cost of capital leading to a rise in investment.
Trade globalization measures the exports of goods and services as well as the degree of trade regulations/barriers and free-trade agreements a country has. Capital liberalization measures the capital flows and stocks of foreign assets and liabilities, as well as the prevalence of foreign ownership and regulations to international capital flows. The final economic globalization index included in the regression is an equally weighted average of the two indexes.
Source: Vanguard.
For institutional and sophisticated investors only. Not for public distribution.
9
Our regression model is expressed in Equation 2, where GDP per capita is a function of capital, human capital, and a group of measures of technology and reforms, including Idea Diffusion, R&D, privatization, and economic globalization. In our analysis, we use the nominal GDP levels of countries as weights, which means that we weight the productivity driver-income relationship for larger economies more than that of smaller ones, with the full sample period spanning from 1996 to 2017.11
We find that human capital, R&D, privatization reforms, and globalization are all important factors in predicting GDP per capita in our cross-country sample. All of our variables are statistically significant, and together, they explain over 90% of the variation in GDP per capita over time across countries (see Figure A-2 in the Appendix on page 26).
11 We find that a weighted approach delivers more robust results than an unweighted approach.
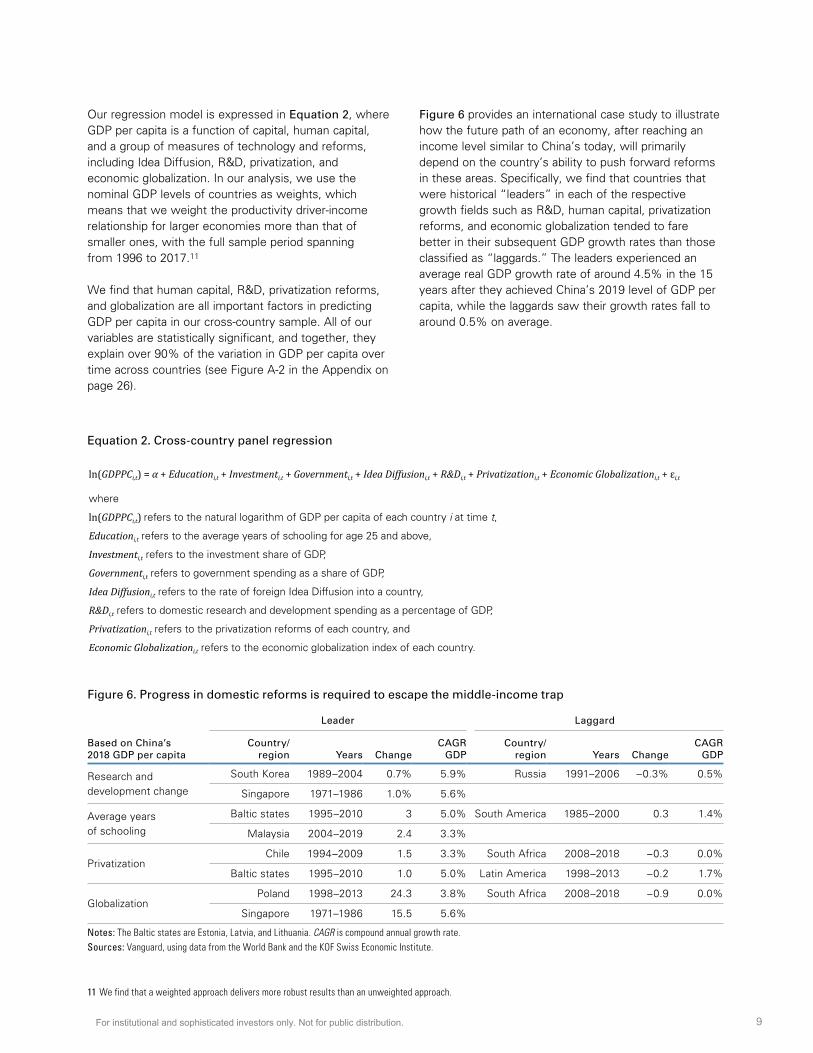
Figure 6 provides an international case study to illustrate how the future path of an economy, after reaching an income level similar to China’s today, will primarily depend on the country’s ability to push forward reforms in these areas. Specifically, we find that countries that were historical “leaders” in each of the respective growth fields such as R&D, human capital, privatization reforms, and economic globalization tended to fare better in their subsequent GDP growth rates than those classified as “laggards.” The leaders experienced an average real GDP growth rate of around 4.5% in the 15 years after they achieved China’s 2019 level of GDP per capita, while the laggards saw their growth rates fall to around 0.5% on average.
Equation 2. Cross-country panel regression
ln(GDPPCi,t) = α + Educationi,t + Investmenti,t + Governmenti,t + Idea Diffusioni,t + R&Di,t + Privatizationi,t + Economic Globalizationi,t + εi,t
where
ln(GDPPCi,t) refers to the natural logarithm of GDP per capita of each country i at time t,
Educationi,t refers to the average years of schooling for age 25 and above,
Investmenti,t refers to the investment share of GDP,
Governmenti,t refers to government spending as a share of GDP,
Idea Diffusioni,t refers to the rate of foreign Idea Diffusion into a country,
R&Di,t refers to domestic research and development spending as a percentage of GDP,
Privatizationi,t refers to the privatization reforms of each country, and
Economic Globalizationi,t refers to the economic globalization index of each country.
Figure 6. Progress in domestic reforms is required to escape the middle-income trap
Leader Laggard
Based on China’s 2018 GDP per capita
Country/ region Years Change
CAGR GDP
Country/ region Years Change
CAGR GDP
Research and development change
South Korea 1989–2004 0.7% 5.9% Russia 1991–2006 –0.3% 0.5%
Singapore 1971–1986 1.0% 5.6%
Average years of schooling
Baltic states 1995–2010 3 5.0% South America 1985–2000 0.3 1.4%
Malaysia 2004–2019 2.4 3.3%
PrivatizationChile 1994–2009 1.5 3.3% South Africa 2008–2018 –0.3 0.0%
Baltic states 1995–2010 1.0 5.0% Latin America 1998–2013 –0.2 1.7%
GlobalizationPoland 1998–2013 24.3 3.8% South Africa 2008–2018 –0.9 0.0%
Singapore 1971–1986 15.5 5.6%
Notes: The Baltic states are Estonia, Latvia, and Lithuania. CAGR is compound annual growth rate.Sources: Vanguard, using data from the World Bank and the KOF Swiss Economic Institute.
For institutional and sophisticated investors only. Not for public distribution.

10
China in perspective
Against this backdrop, we set out to analyze each growth factor within China’s context to assess its progress to date and identify areas of opportunities over the next decade. In particular, we build upon the framework of Li et al. (2017) by assessing where China stands relative to its past and to the rest of the world.
Factor 1—Human capital
Similar to Li et al. (2017), we find that in terms of human capital, China was below the regression line (Figure 7) starting in the five years leading up to 2003, with per capita income about 90% of the level predicted by the global averages shown by the regression line. This suggests that China’s human capital was not being fully utilized at that time.
Additionally, China also leaned toward the far left of the regression line, which speaks to its low initial levels of education of roughly six years, relative to the global average of 10 years. Over the years, China has steadily moved toward and along the regression line, and by 2017, it converged to the regression line, suggesting a much higher-quality education standard. Relative to G7 countries, however, China still has room for improvement when it comes to developing human capital.
How to read the bubble charts
One can think of each factor’s contribution to productivity growth as having two components: the extent to which it moves toward the line and its growth along the line. Moving along the regression line means that higher per capita income is positively associated with higher levels of that particular factor. Moving higher toward the regression line signifies, whether through an increase in factor quality or a more efficient use of that factor, gradually increasing pass-through effects from higher levels of that factor leading to higher growth. The opposite is true for a movement lower and away from the regression line.
Figure 7. Human capital has become more in line with global standards
ln p
er c
apit
a G
DP
6
7
8.35
10
11
12
13
6.36
China
20035-yearaverage
G7
8.82
6
20085-yearaverage
China
6.92
G7
9.19
6
20135-yearaverage
China
7.36
G7
9.38
60 2 4 6 10 12 14 16
Average years of schooling
20175-yearaverage
China
7.72
G7
Notes: Bubble size reflects the country’s GDP level. A list of the countries used in the regression can be found in Figure A-3 in the Appendix on page 26. ln is natural logarithm, the difference of which is used to calculate the growth rate of GDP per capita.Source: Vanguard.
For institutional and sophisticated investors only. Not for public distribution.

11
Indeed, despite China’s rapid progress in increasing the number of college graduates and enrollment in recent years, it still has abundant room to increase its average years of schooling for the broader population, with the percentage of college and high school graduates still less than a third of that of developed countries such as the
U.S. A more educated workforce can have flow-through effects at boosting our second factor, R&D, given the strong positive correlation between the proportion of adults with a postsecondary education and the number of research personnel, which to date has been relatively small in China (Figure 8).
Figure 8. China’s low research concentration can be improved by investing in higher education
0
10
20
30
40
50
60%
0
1,000
2,000
3,000
4,000
5,000
6,000
7,000
8,000
9,000
Den
mar
k
Sou
th K
orea
Sw
eden
Finl
and
Nor
way
Aus
tria
Net
herla
nds
Japa
n
Irel
and
Ger
man
y
Bel
gium
Slo
veni
a
Fran
ce
Uni
ted
Kin
gdom
Por
tuga
l
Cze
ch R
epub
lic
Est
onia
Gre
ece
Pol
and
Spa
in
Slo
vaki
a
Rus
sia
Ital
y
Chi
na
Research personnel
Percentage of those ages 25 to 64 with postsecondary education
Res
earc
h p
erso
nn
elp
er m
illio
n p
op
ula
tio
n
Per
cen
tag
e o
f ad
ult
s w
ith
p
ost
seco
nd
ary
edu
cati
on
Sources: Vanguard calculations, based on data from the World Bank and the OECD.
For institutional and sophisticated investors only. Not for public distribution.
12
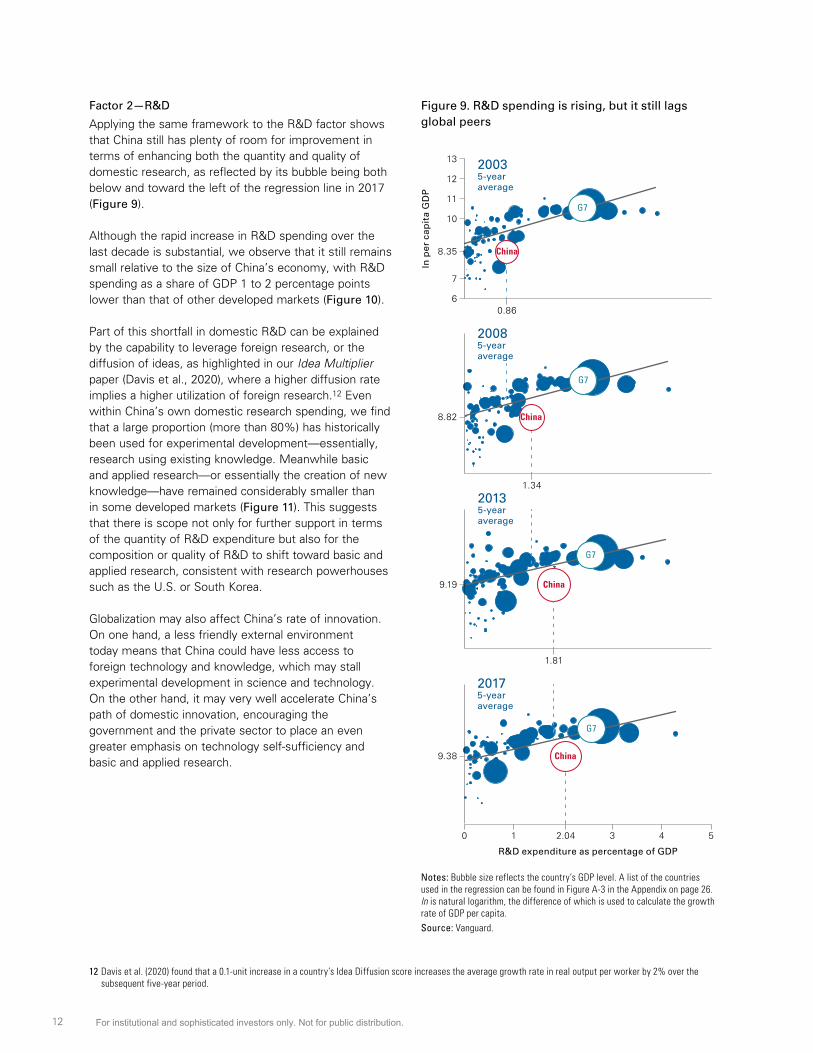
Factor 2—R&D
Applying the same framework to the R&D factor shows that China still has plenty of room for improvement in terms of enhancing both the quantity and quality of domestic research, as reflected by its bubble being both below and toward the left of the regression line in 2017 (Figure 9).
Although the rapid increase in R&D spending over the last decade is substantial, we observe that it still remains small relative to the size of China’s economy, with R&D spending as a share of GDP 1 to 2 percentage points lower than that of other developed markets (Figure 10).
Part of this shortfall in domestic R&D can be explained by the capability to leverage foreign research, or the diffusion of ideas, as highlighted in our Idea Multiplier paper (Davis et al., 2020), where a higher diffusion rate implies a higher utilization of foreign research.12 Even within China’s own domestic research spending, we find that a large proportion (more than 80%) has historically been used for experimental development—essentially, research using existing knowledge. Meanwhile basic and applied research—or essentially the creation of new knowledge—have remained considerably smaller than in some developed markets (Figure 11). This suggests that there is scope not only for further support in terms of the quantity of R&D expenditure but also for the composition or quality of R&D to shift toward basic and applied research, consistent with research powerhouses such as the U.S. or South Korea.
Globalization may also affect China’s rate of innovation. On one hand, a less friendly external environment today means that China could have less access to foreign technology and knowledge, which may stall experimental development in science and technology. On the other hand, it may very well accelerate China’s path of domestic innovation, encouraging the government and the private sector to place an even greater emphasis on technology self-sufficiency and basic and applied research.
12 Davis et al. (2020) found that a 0.1-unit increase in a country’s Idea Diffusion score increases the average growth rate in real output per worker by 2% over the subsequent five-year period.
Figure 9. R&D spending is rising, but it still lags global peers
ln p
er c
apit
a G
DP
6
7
8.35
10
11
12
13
0.86
8.82
1.34
9.19
1.81
9.38
0 1 2.04 3 4 5
20035-yearaverage
20085-yearaverage
20135-yearaverage
20175-yearaverage
China
China
China
China
G7
G7
G7
G7
R&D expenditure as percentage of GDP
Notes: Bubble size reflects the country’s GDP level. A list of the countries used in the regression can be found in Figure A-3 in the Appendix on page 26. ln is natural logarithm, the difference of which is used to calculate the growth rate of GDP per capita.Source: Vanguard.
For institutional and sophisticated investors only. Not for public distribution.

13
Figure 10. Domestic innovation is rising, but still has room to catch up
a. R&D spending (USD, billions)
0
100
200
300
400
500
600
1996 1999 2002 2005 2008 2011 2014 2017
United StatesChina
JapanGermanySouth Korea
b. R&D spending (percentage of GDP)
0
1
2
3
4
5
1996 1999 2002 2005 2008 2011 2014 2017
United StatesChina
JapanGermany
South Korea
Notes: R&D spending as a percentage of GDP is measured in purchasing power parity (PPP) terms. In PPP terms, China’s GDP is already larger than that of the U.S., having surpassed it in 2017. Throughout this paper, when referencing China’s surpassing U.S. GDP after 2050, we’re using nominal GDP in U.S. dollars.Sources: Vanguard, using data from the World Bank.
Figure 11. China’s R&D has scope to shift more toward research
ChinaSouthKorea
JapanUnitedKingdom
UnitedStates
5%
11%17%12%17%17%
21%21%
43%
19%
63%
40%
67% 62%
84%
Basic research is experimental and theoretical work that is undertaken not to recap long-term benefits but to advance the state of knowledge.
Applied research is original work to acquire new knowledgethat is undertaken with a specific application in view. It aimsto determine possible uses for the findings of basic researchor to determine new ways of achieving specific,predetermined objectives.
Experimental development is systematic work using existing knowledge gained from research or practical experience that is directed toward producing new materials, products, or devices; installing new processes, systems, or services; or substaintially improving what has been produced or installed in the past.
Note: Percentages may not total 100 because of rounding.Sources: Vanguard, using data from the OECD.
For institutional and sophisticated investors only. Not for public distribution.
14
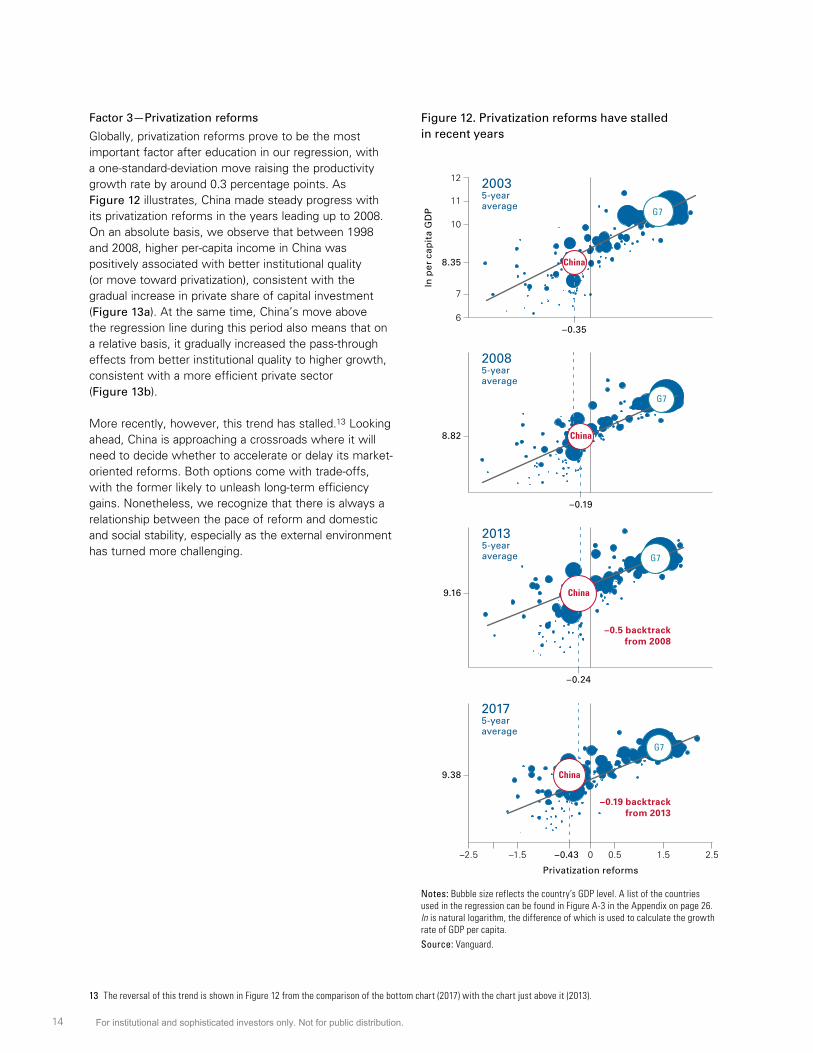
Factor 3—Privatization reforms
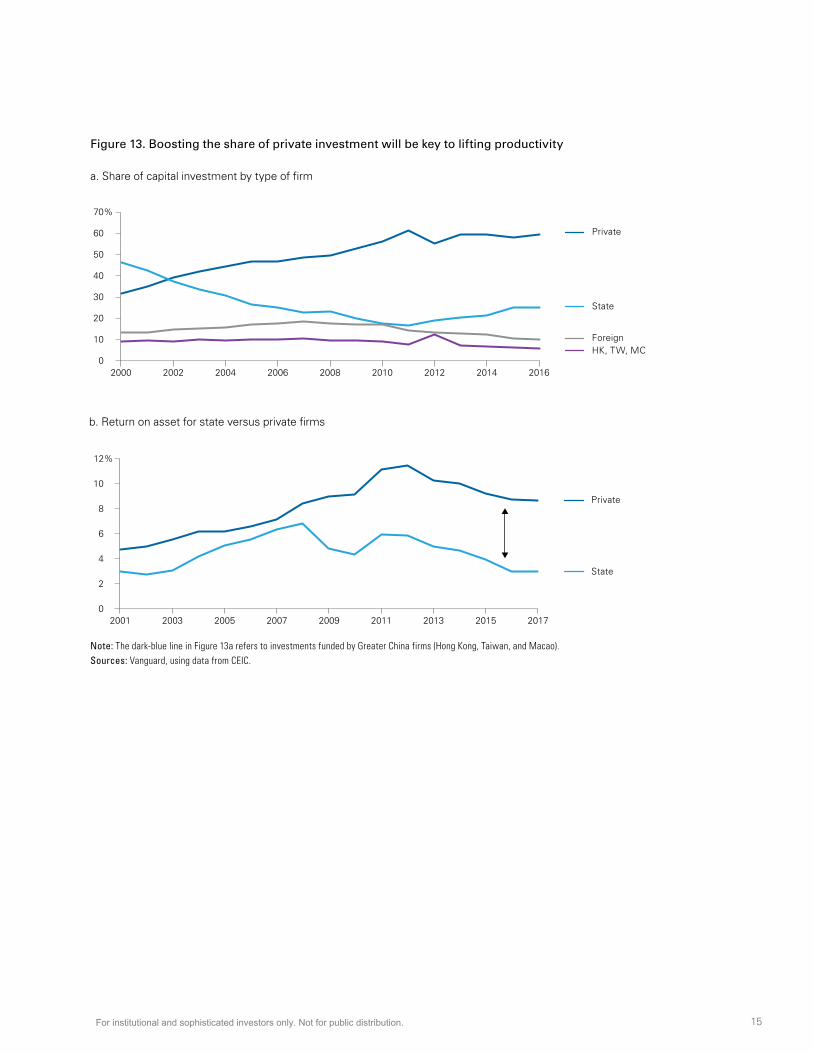
Globally, privatization reforms prove to be the most important factor after education in our regression, with a one-standard-deviation move raising the productivity growth rate by around 0.3 percentage points. As Figure 12 illustrates, China made steady progress with its privatization reforms in the years leading up to 2008. On an absolute basis, we observe that between 1998 and 2008, higher per-capita income in China was positively associated with better institutional quality (or move toward privatization), consistent with the gradual increase in private share of capital investment (Figure 13a). At the same time, China’s move above the regression line during this period also means that on a relative basis, it gradually increased the pass-through effects from better institutional quality to higher growth, consistent with a more efficient private sector (Figure 13b).
More recently, however, this trend has stalled.13 Looking ahead, China is approaching a crossroads where it will need to decide whether to accelerate or delay its market-oriented reforms. Both options come with trade-offs, with the former likely to unleash long-term efficiency gains. Nonetheless, we recognize that there is always a relationship between the pace of reform and domestic and social stability, especially as the external environment has turned more challenging.
13 The reversal of this trend is shown in Figure 12 from the comparison of the bottom chart (2017) with the chart just above it (2013).
Figure 12. Privatization reforms have stalled in recent years
ln p
er c
apit
a G
DP
6
7
8.35
10
11
12
–0.35
8.82
–0.19
9.16
–0.24
9.38
–2.5 –1.5 –0.43 0 0.5 1.5 2.5
20035-yearaverage
20085-yearaverage
20135-yearaverage
20175-yearaverage
Privatization reforms
China
G7
China
G7
China
G7
China
G7
–0.5 backtrackfrom 2008
–0.19 backtrackfrom 2013
Notes: Bubble size reflects the country’s GDP level. A list of the countries used in the regression can be found in Figure A-3 in the Appendix on page 26. ln is natural logarithm, the difference of which is used to calculate the growth rate of GDP per capita.Source: Vanguard.
For institutional and sophisticated investors only. Not for public distribution.
15
Figure 13. Boosting the share of private investment will be key to lifting productivity
a. Share of capital investment by type of firm
0
10
20
30
40
50
60
70%
2000 2002 2004 2006 2008 2010 2012 2014 2016
Private
State
ForeignHK, TW, MC
b. Return on asset for state versus private firms
0
2
4
6
8
10
12%
2001 2003 2005 2007 2009 2011 2013 2015 2017
Private
State
Note: The dark-blue line in Figure 13a refers to investments funded by Greater China firms (Hong Kong, Taiwan, and Macao).Sources: Vanguard, using data from CEIC.
For institutional and sophisticated investors only. Not for public distribution.

16
Factor 4—Economic globalization China made considerable progress opening its market to the external sector leading up to the global financial crisis, in terms of both trade and capital flows (Figure 14), as it emerged as the “world’s factory” and welcomed foreign investors into its capital markets. More recently, however, our economic globalization measure has shown signs of decline (Figure 15) as China gradually rebalances away from trade to domestic consumption and investment. The tightening of capital controls after 2014 has also weighed on capital globalization. Although the decline in trade globalization comes as no surprise as the economic structure changes, we see room for improvement on the capital-globalization front to allow for more two-way symmetric exchange of capital rather than the current asymmetric capital flow promoting northbound flows but limiting southbound flows.14
Figure 15. Tightening of capital controls post-2014 has contributed to a decline in China’s globalization measure
56
49
43
50
44 46
Trade globalization Financial globalization
2007 2014 2018 2007 2014 2018
Notes: Trade globalization measures the export of goods and services as well as the degree of trade regulations/barriers and number of free trade agreements a country has. Financial globalization measures foreign direct investment, portfolio investment, and the regulations to international capital flows. Sources: Vanguard, using data from the KOF Swiss Institute.
14 Northbound trading allows foreign investors to invest directly in securities listed on the Shanghai Stock Exchange (i.e., capital inflow into China), while southbound trading allows domestic investors from Mainland China to invest directly in securities offshore (i.e., capital outflow).
Figure 14. Economic globalization has backtracked in recent years
ln p
er c
apit
a G
DP
6
7
8.35
10
11
12
13
39.54
8.82
50.22
9.19
47.64
9.38
0 20 45.9 60 80 100 120
20035-yearaverage
20085-yearaverage
20135-yearaverage
20175-yearaverage
Economic globalization
China
G7
China
G7
China
G7
China
G7
–2.58 backtrackfrom 2008
–1.74 backtrackfrom 2013
Notes: Bubble size reflects the country’s GDP level. A list of the countries used in the regression can be found in Figure A-3 in the Appendix on page 26. ln is natural logarithm, the difference of which is used to calculate the growth rate of GDP per capita.Source: Vanguard.
For institutional and sophisticated investors only. Not for public distribution.

17
The future: Lower but more sustainable growth
To gauge how China’s overall growth trajectory would look if it makes significant progress or backslides on the above-mentioned factors, we conducted a counterfactual exercise to identify the areas of opportunities and risk. Our calculations show that on the external front, if the globalization of ideas had stagnated back in the early 1990s, China’s growth would have been about 2% lower today, all else equal (Figure 16). This implies that China’s annual real GDP growth in the years leading up to COVID-19 would have been around 4% instead of 6%. In the tail-risk event that the Idea Diffusion rate does not just stagnate but effectively falls to 0—effectively eliminating all international knowledge sharing—this slowing in growth would be further magnified by nearly 4 percentage points, dropping the pre-COVID-19 growth rate from 6% to closer to 2%.
Figure 16. Counterfactual analysis—Domestic reforms hold the key to the upside
Difference in annual GDP growth
–2.4%
0.8%
–1.5%
0.9%
–1.4%
1.0%
–1.3%
1.5%
–1.2%
2.6%
Variables stagnant at pre-2000 levels
Variables catch up to G7 average
Idea Diffusion
Globalization R&D Human capital
Privatization
Note: Idea Diffusion, in an optimistic scenario, would be catching up to the G7 leader, not the G7 average.Source: Vanguard.
Although these numbers suggest that the external environment matters for the future of China, an acceleration of domestic reforms can help mitigate these headwinds, our analysis shows. For example, Figure 16 also shows that if China had caught up to the G7 average standard on privatization reforms over the past two decades, growth could have been close to 3% higher today, suggesting that there remains much room to boost domestic reforms. Similarly, investing in domestic R&D and education proves to have a bigger incremental impact on the upside potential than that of external factors such as the globalization of ideas, trade, and capital flows.
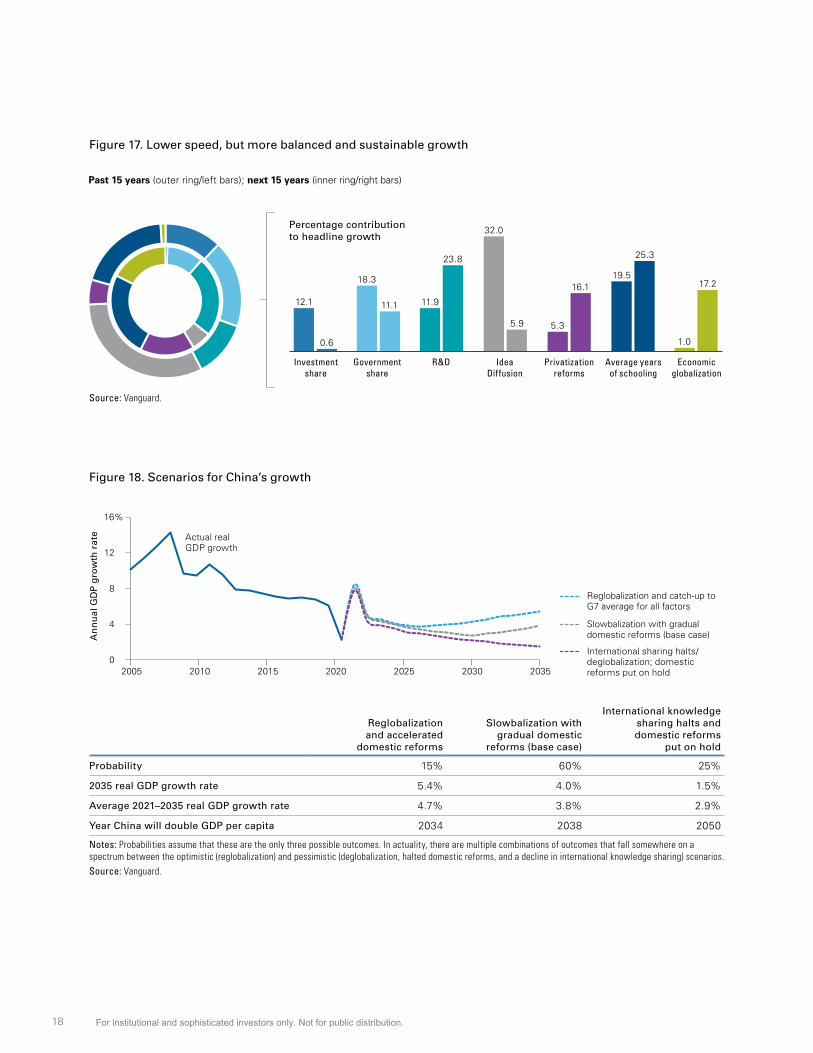
Figure 17 shows our base-case assumption of how these various growth factors are likely to evolve over the next 15 years. Although the rate of growth will be lower than that of the last 15 years, as reflected by the size of the pie, the drivers of growth will likely become more diversified and balanced, with the economy depending more on privatization reforms, human capital, domestic R&D, and two-way opening of its capital markets than on investment spending and foreign research.
Per our counterfactual analysis, we present various risk scenarios to our baseline over the next 15 years (Figure 18). In a highly optimistic scenario, where reglobalization takes place on the external front and China accelerates domestic reforms and plays catch-up to the G7 average standard for all the above-mentioned factors, China will be able to achieve its goal of doubling its GDP by 2035, with its terminal real GDP growth rate being around 5.4%.
On the other hand, if the external environment sours to a deglobalization state or if knowledge sharing between China and the developed world halts, and if China fails to accelerate domestic innovation and privatization reforms, China will likely end up in a long-term stagnation phase, where growth will continue to decelerate and settle at a 1% terminal rate by 2035. Under this scenario, China may never reach its 2035 goal of doubling GDP per capita. That said, if China uses the more hostile global environment as an opportunity to accelerate domestic reforms, its growth rate at the end of the 15-year time frame will exceed that of our base-case scenario, highlighting the importance of domestic reforms over the fate of the external environment.
For institutional and sophisticated investors only. Not for public distribution.
18
Figure 17. Lower speed, but more balanced and sustainable growth
Investmentshare
Governmentshare
R&D IdeaDiffusion
Privatizationreforms
Average yearsof schooling
Economicglobalization
Percentage contribution to headline growth
Past 15 years (outer ring/left bars); next 15 years (inner ring/right bars)
12.1
18.3
11.9
32.0
5.3
19.5
1.00.6
11.1
23.8
5.9
16.1
25.3
17.2
Source: Vanguard.
Figure 18. Scenarios for China’s growth
0
4
8
12
16%
2005 2010 2015 2020 2025 2030 2035
An
nu
al G
DP
gro
wth
rat
e
Reglobalization and catch-up to G7 average for all factors
Actual realGDP growth
Slowbalization with gradual domestic reforms (base case)
International sharing halts/ deglobalization; domestic reforms put on hold
Reglobalization and accelerated
domestic reforms
Slowbalization with gradual domestic
reforms (base case)
International knowledge sharing halts and domestic reforms
put on hold
Probability 15% 60% 25%
2035 real GDP growth rate 5.4% 4.0% 1.5%
Average 2021–2035 real GDP growth rate 4.7% 3.8% 2.9%
Year China will double GDP per capita 2034 2038 2050
Notes: Probabilities assume that these are the only three possible outcomes. In actuality, there are multiple combinations of outcomes that fall somewhere on a spectrum between the optimistic (reglobalization) and pessimistic (deglobalization, halted domestic reforms, and a decline in international knowledge sharing) scenarios.Source: Vanguard.
For institutional and sophisticated investors only. Not for public distribution.
19
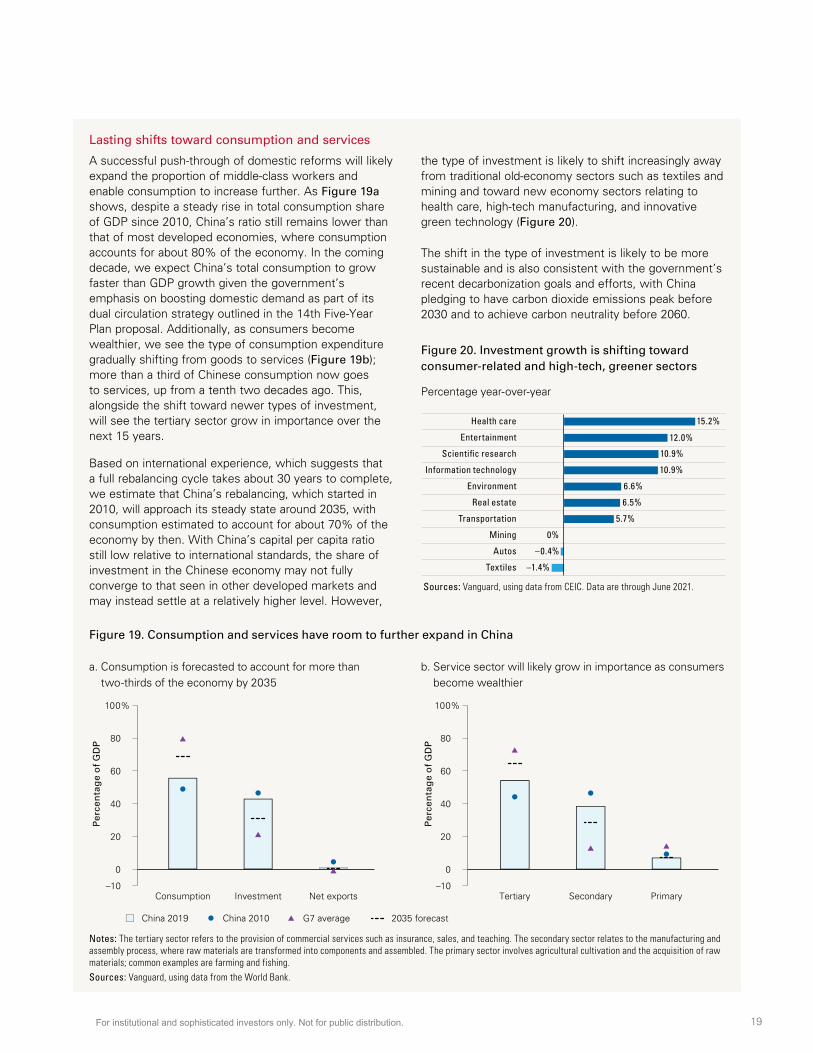
Lasting shifts toward consumption and services
A successful push-through of domestic reforms will likely expand the proportion of middle-class workers and enable consumption to increase further. As Figure 19a shows, despite a steady rise in total consumption share of GDP since 2010, China’s ratio still remains lower than that of most developed economies, where consumption accounts for about 80% of the economy. In the coming decade, we expect China’s total consumption to grow faster than GDP growth given the government’s emphasis on boosting domestic demand as part of its dual circulation strategy outlined in the 14th Five-Year Plan proposal. Additionally, as consumers become wealthier, we see the type of consumption expenditure gradually shifting from goods to services (Figure 19b); more than a third of Chinese consumption now goes to services, up from a tenth two decades ago. This, alongside the shift toward newer types of investment, will see the tertiary sector grow in importance over the next 15 years.
Based on international experience, which suggests that a full rebalancing cycle takes about 30 years to complete, we estimate that China’s rebalancing, which started in 2010, will approach its steady state around 2035, with consumption estimated to account for about 70% of the economy by then. With China’s capital per capita ratio still low relative to international standards, the share of investment in the Chinese economy may not fully converge to that seen in other developed markets and may instead settle at a relatively higher level. However,
the type of investment is likely to shift increasingly away from traditional old-economy sectors such as textiles and mining and toward new economy sectors relating to health care, high-tech manufacturing, and innovative green technology (Figure 20).
The shift in the type of investment is likely to be more sustainable and is also consistent with the government’s recent decarbonization goals and efforts, with China pledging to have carbon dioxide emissions peak before 2030 and to achieve carbon neutrality before 2060.
Figure 20. Investment growth is shifting toward consumer-related and high-tech, greener sectors
Percentage year-over-year
15.2%Health care
12.0%Entertainment
10.9%Scienti�c research
10.9%Information technology
6.6%Environment
6.5%Real estate
5.7%Transportation
0%Mining
–0.4%Autos
–1.4%Textiles
Sources: Vanguard, using data from CEIC. Data are through June 2021.
Figure 19. Consumption and services have room to further expand in China
a. Consumption is forecasted to account for more thantwo-thirds of the economy by 2035
–10
0
20
40
60
80
100%
Consumption Investment Net exports
China 2019 2035 forecastG7 averageChina 2010
Per
cen
tag
e o
f G
DP
b. Service sector will likely grow in importance as consumersbecome wealthier
–10
0
20
40
60
80
100%
Tertiary Secondary Primary
Per
cen
tag
e o
f G
DP
Notes: The tertiary sector refers to the provision of commercial services such as insurance, sales, and teaching. The secondary sector relates to the manufacturing and assembly process, where raw materials are transformed into components and assembled. The primary sector involves agricultural cultivation and the acquisition of raw materials; common examples are farming and fishing.Sources: Vanguard, using data from the World Bank.
For institutional and sophisticated investors only. Not for public distribution.

20
Implications for the rest of the world
Uneven spillover to global growth
China’s lower growth rate and domestic consumption rebalancing will have uneven impacts throughout the world. The China dividend—the economic tailwind other economies reaped from China’s twenty-first-century surge—will decline as the world’s second-largest economy settles into a more sustainable, lower growth trajectory.15 China’s shift to a consumer-based economy will also present variation of trading partners’ economic responses (Figure 21), with some countries, such as
15 See Arora and Vamvakidis (2011), which estimates that a 1-percentage-point increase in China’s growth is correlated with an average 0.5-percentage-point increase in the growth of other countries.
Japan and South Korea, benefiting from the rise of the Chinese consumer. Tourism, luxury goods, and education are just a few examples of how a richer Chinese consumer will have positive economic spillover effects for developed economies.
Brazil is expected to be the hardest-hit economy as the slowdown in China’s old-economy industries disproportionally impairs Brazilian exports. Otherwise, the total economic impact for much of the developed world will be a modest 0.1 to 0.2 percentage points.
Figure 21. Uneven regional impacts from a rebalancing Chinese economy
0.42
0.16
0.050.09
0.05 0.060.04 0.04
0.02
0.26
0.090.06 0.08 0.07
0.03 0.04 0.03 0.01
0.210.18
0.11 0.100.13
0.060.03 0.03 0.03
Brazil South Korea Japan Germany South Africa Euro area Canada U.S. U.K.
Official GDP Old economy index New economy index
Beta (response to a 1% increase in China indicator)
Notes: A vector autoregression model was used to measure the effects of China’s old and new economy growth momentum on the respective country or region’s growth. The sample period covers from 2006 to 2018.Sources: Vanguard calculations, based on data from Thomson Reuters Datastream, CEIC, and Bloomberg.
For institutional and sophisticated investors only. Not for public distribution.

21
U.S.-China relationship is likely to remain contentious
China’s economic rise may further complicate itsrelationship with the U.S., which to date has beenchallenged by fundamental disagreement on manycritical issues and the long-term competitive dynamicsof two global economic powers. As Figure 22 shows,a pursuit of China’s reform agenda in our base case islikely to elevate it to replace the U.S. as the world’s
16 “World’s largest economy” is in terms of nominal GDP in U.S. dollars. We note that China’s nominal GDP per capita will still be smaller than that of the U.S. even if nominal GDP levels converge, given China’s larger population size.
largest economy within three decades.16 Should China accelerate reforms immediately, the time taken to reach U.S. GDP will be further reduced by around 10 years. On the other hand, if China chooses not to reform, it may continue to lag the U.S. in economic size, but ongoing technology competition may mean that the contentious relationship between the two countries is likely to persist.
Figure 22. China is set to become the world’s largest economy if reforms are undertaken
0
10
20
30
40
50
60
70
80
1990 2000 2010 2020 2030 2040 2050
No
min
al G
DP
(in
tri
llio
n U
SD
)
China reglobalization and acceleration
China slowbalization and gradual reforms (base case)
China deglobalization and no reforms
U.S.
China
Sources: Vanguard, using data from the World Bank.
For institutional and sophisticated investors only. Not for public distribution.

22
China’s share of global financial markets is expected to double
By promoting more symmetric two-way capital flows as part of its reform agenda, China could see its capital markets grow as foreign investor flows intensify. Although China is presently the second-largest equity and bond market globally, its capital markets as a percentage of GDP remain considerably behind the developed-market average (Figure 23a), suggesting there is room for growth. Based on our forecasts of GDP
17 The equity benchmark is the FTSE Global All Cap Index; the bond benchmark is the Bloomberg Barclays Global Aggregate Bond Index.
growth, international capital openness, and domestic economic reforms to strengthen the role of direct financing, we expect China’s equity market capitalization as a percentage of GDP to increase from 61% in 2019 to 76% in 2035. We expect bond market capitalization to increase from 105% to 136% of GDP. For a globally diversified investor, this translates to China’s portfolio allocation roughly doubling from 7% to 14% in an equity portfolio and 7% to 12% in bond portfolios by 2035 (Figure 23b).17
Figure 23. China’s growing capital markets affect investors globally
a. Market size as a percentage of GDP
61%
105%
76%
136%
105%
184%
Equity Bond
China (2019)
China (2035 forecast)
G7 average (2019)
b. China allocation in global portfolio
7% 7%
14%
12%
Equity Bond
2020 2035 forecast
Notes: China’s 2035 market capitalization forecast is estimated via cross-sectional ordinary least squares regression, with GDP growth, international capital openness, and privatization as independent variables. Future portfolio allocation is calculated by taking the forecasted market size as a percentage of GDP and China’s expected GDP as a percentage of global GDP in 2035, assuming other economies’ financial markets grow at recent trends. Portfolio allocation indicates total share of Chinese companies, regardless if traded as A shares or H shares. Sources: Vanguard calculations, based on data from the World Bank and Bloomberg.
For institutional and sophisticated investors only. Not for public distribution.
23
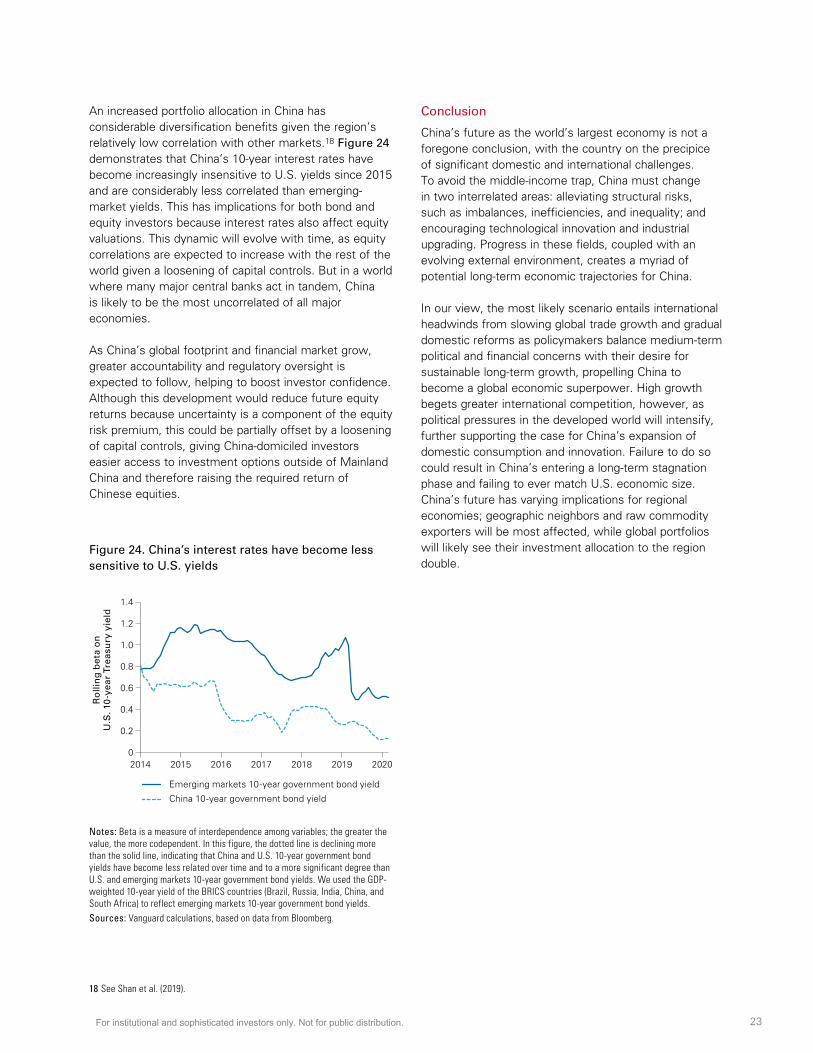
An increased portfolio allocation in China has considerable diversification benefits given the region’s relatively low correlation with other markets.18 Figure 24 demonstrates that China’s 10-year interest rates have become increasingly insensitive to U.S. yields since 2015 and are considerably less correlated than emerging-market yields. This has implications for both bond and equity investors because interest rates also affect equity valuations. This dynamic will evolve with time, as equity correlations are expected to increase with the rest of the world given a loosening of capital controls. But in a world where many major central banks act in tandem, China is likely to be the most uncorrelated of all major economies.
As China’s global footprint and financial market grow, greater accountability and regulatory oversight is expected to follow, helping to boost investor confidence. Although this development would reduce future equity returns because uncertainty is a component of the equity risk premium, this could be partially offset by a loosening of capital controls, giving China-domiciled investors easier access to investment options outside of Mainland China and therefore raising the required return of Chinese equities.
Figure 24. China’s interest rates have become less sensitive to U.S. yields
0
0.2
0.4
0.6
0.8
1.0
1.2
1.4
2014 2015 2016 2017 2018 2019 2020
Emerging markets 10-year government bond yield
China 10-year government bond yield
Ro
llin
g b
eta
on
U.S
. 10
-yea
r Tr
easu
ry y
ield
Notes: Beta is a measure of interdependence among variables; the greater the value, the more codependent. In this figure, the dotted line is declining more than the solid line, indicating that China and U.S. 10-year government bond yields have become less related over time and to a more significant degree than U.S. and emerging markets 10-year government bond yields. We used the GDP-weighted 10-year yield of the BRICS countries (Brazil, Russia, India, China, and South Africa) to reflect emerging markets 10-year government bond yields. Sources: Vanguard calculations, based on data from Bloomberg.
18 See Shan et al. (2019).
Conclusion
China’s future as the world’s largest economy is not a foregone conclusion, with the country on the precipice of significant domestic and international challenges. To avoid the middle-income trap, China must change in two interrelated areas: alleviating structural risks, such as imbalances, inefficiencies, and inequality; and encouraging technological innovation and industrial upgrading. Progress in these fields, coupled with an evolving external environment, creates a myriad of potential long-term economic trajectories for China.
In our view, the most likely scenario entails international headwinds from slowing global trade growth and gradual domestic reforms as policymakers balance medium-term political and financial concerns with their desire for sustainable long-term growth, propelling China to become a global economic superpower. High growth begets greater international competition, however, as political pressures in the developed world will intensify, further supporting the case for China’s expansion of domestic consumption and innovation. Failure to do so could result in China’s entering a long-term stagnation phase and failing to ever match U.S. economic size. China’s future has varying implications for regional economies; geographic neighbors and raw commodity exporters will be most affected, while global portfolios will likely see their investment allocation to the region double.
For institutional and sophisticated investors only. Not for public distribution.

24
References
Acemoglu, Daron, and Pascual Restrepo, 2017. Secular Stagnation? The Effect of Aging on Economic Growth in the Age of Automation. American Economic Review 107(5): 174–179.
Aliaga-Díaz, Roger, Jonathan Lemco, Jonathan Petersen, and Adam J. Schickling, 2019. The Economics of a Graying World. Valley Forge, Pa.: The Vanguard Group.
Arora, Vivek, and Athanasios Vamvakidis, 2011. China’s Economic Growth: International Spillovers. China & World Economy 19(5): 31-46.
Barro, Robert, 2003. Determinants of Economic Growth in a Panel of Countries. Annals of Economics and Finance 4(2): 231–274.
Caselli, Francesco, Gerardo Esquivel, and Fernando Lefort, 1996. Reopening the Convergence Debate: A New Look at Cross-Country Growth Empirics. Journal of Economic Growth 1(3): 363–389.
Davis, Joseph, Qian Wang, Andrew Patterson, Adam J. Schickling, and Asawari Sathe, 2020. The Idea Multiplier: An Acceleration in Innovation is Coming. Valley Forge, Pa.: The Vanguard Group.
Garrett, Geoffrey, 2004. Globalization’s Missing Middle. Foreign Affairs, November/December; available at https://www.foreignaffairs.com/articles/2004-11-01/globalizations-missing-middle.
Guellec, Dominique, and Bruno van Pottelsberghe de la Potterie, 2001. R&D and Productivity Growth: Panel Data Analysis of 16 OECD Countries. OECD Science, Technology and Industry Working Papers 2001/3. Paris, France: Organisation for Economic Cooperation and Development.
Henry, Peter Blair, 2003. Capital-Account Liberalization, the Cost of Capital, and Economic Growth. American Economic Review 93(2): 91–96.
Higgins, Patrick, Tao Zha, and Wenna Zhong, 2016. Forecasting China’s Economic Growth and Inflation. China Economic Review 41(C): 46–61.
Lee, Jong-Wha, 2016. China’s Economic Growth and Convergence. CAMA Working Papers 2016-30. Acton, Australia: The Centre for Applied Macroeconomic Analysis, Crawford School of Public Policy, the Australian National University.
Lemco, Jonathan, Asawari Sathe, Adam J. Schickling, Maximilian Wieland, and Beatrice Yeo, 2021. The Deglobalization Myth(s). Valley Forge, Pa.: The Vanguard Group.
Li, Hongbin, Prashant Loyalka, Scott Rozelle, and Binzhen Wu, 2017. Human Capital and China’s Future Growth. Journal of Economic Perspectives 31(1): 25–48.
Shan, Chenyu, Dragon Yongjun Tang, Sarah Qian Wang, and Chang Zhang, 2019. The Diversification Benefits and Policy Risks of Accessing China’s Stock Market; available at http://cfrc.pbcsf.tsinghua.edu.cn/Public/Uploads/upload/CFRC2019_1856.pdf.
Solow, M. Robert, 1956. A Contribution to the Theory of Economic Growth. The Quarterly Journal of Economics 70(1): 65-94.
Swan, W. Trevor, 1956. Economic growth and Capital Accumulation. Economic Record 32(2): 334-361.
Wang, Qian, Jessica Mengqi Wu, and Zoe Bryn Odenwalder, 2017. Navigating the Transition: China’s Future at a Crossroads. Valley Forge, Pa.: The Vanguard Group.
For institutional and sophisticated investors only. Not for public distribution.

25
Appendix
Figure A-1. China’s emphasis on growth quality has seen some reduction in demand-side headwinds
(>) indicates higher values lead to healthier and more sustainable growth prospects (<) indicates lower values lead to healthier and more sustainable growth prospects
2015 2019 2020
Financial imbalances
Debt-to-GDP ratio (<) 251% 278% 306%
Five-year change in debt-to-GDP ratio (<) 55% 27% 40%
Overcapacity reduction
Inventory-to-sales ratio (months) (< ) 18.3 14.5 17.7
Industry capacity utilization ratio (>) 74.6 77.5 78
Economic rebalancing
Consumption versus investment share of GDP (>) 8% 13% 11%
Service versus manufacturing share of GDP (>) 10% 16% 17%
Macro policy cushion
Foreign exchange (FX) reserves (USD trillion)* (>) 3.0 3.1 3.2
Total social financing growth trough to peak** (<) 5.1% 0.6% 3%
Policy rate cuts** (<) 1.3% 0.1% 0.3%
Asset price appreciation
Five-year increase in margin trading (RMB billion) (<) 53.1 -0.9 31.3
Five-year increase in retail speculation (new trading accounts opened, million) (<) 2.6 –1.4 0.5
Property price growth year-over-year (Tier 1 city) (<) 19.9% 3.9% 4.0%
Notes: *We used 2016’s FX reserves to compare to 2019, given that most of the 2015-16 FX drain happened in the latter year. ** We compared the 2015-16 easing cycle to the 2018-19 easing cycle.Sources: Vanguard, using data from WIND, CEIC, and the Bank of International Settlements.
Equation A-1: Solow Swan growth model
Y = AKαLβ
Y/L = AKαLβ-1 = AKα/L1-β
Y/L = AKα/Lα = A(K/L)α
The equation is derived per the following:
Start with Cobb-Douglas production function:
Solow-Swan growth model, which rewrote Cobb-Douglas function into per-capita form:
Y = A(K/L)αL = (Y/L)L%∆Y = %∆(Y/L) + %∆L
where Y/L re�ects labor productivity.
Note: For more information, see: https://www.pitt.edu/~mgahagan/Solow.htm
For institutional and sophisticated investors only. Not for public distribution.
26
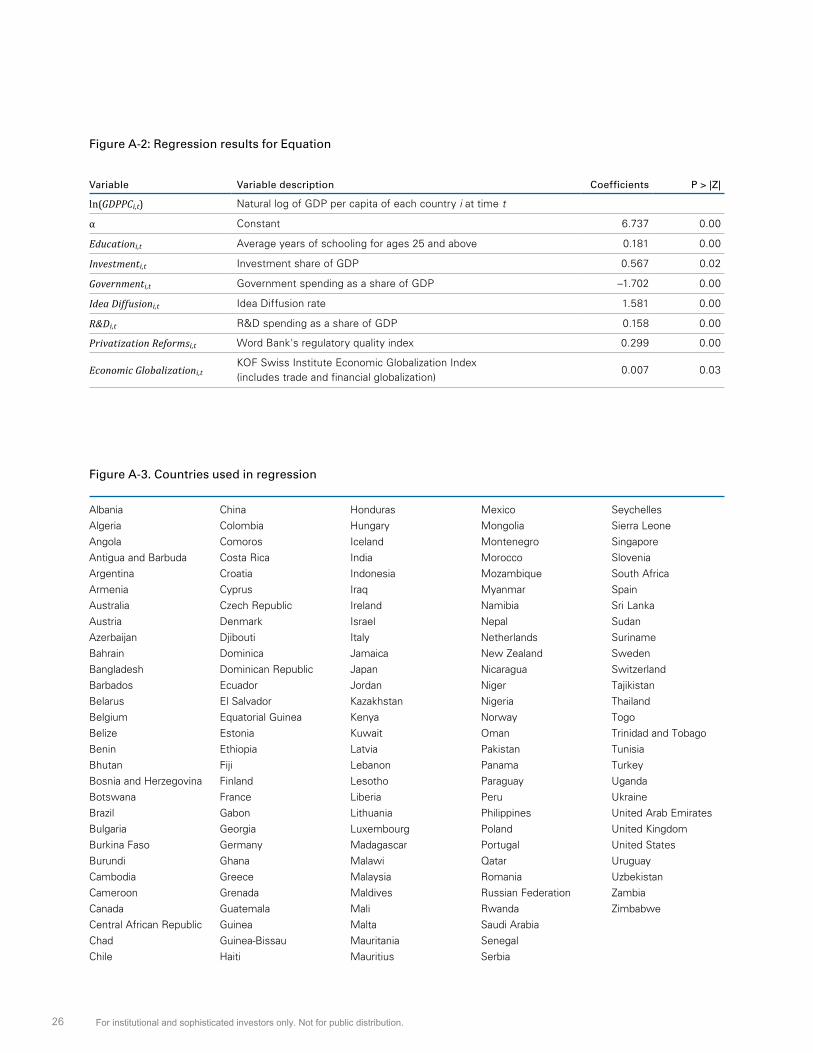
Figure A-2: Regression results for Equation
Variable Variable description Coefficients P > |Z|
ln(GDPPCi,t) Natural log of GDP per capita of each country i at time t
α Constant 6.737 0.00
Educationi,t Average years of schooling for ages 25 and above 0.181 0.00
Investmenti,t Investment share of GDP 0.567 0.02
Governmenti,t Government spending as a share of GDP –1.702 0.00
Idea Diffusioni,t Idea Diffusion rate 1.581 0.00
R&Di,t R&D spending as a share of GDP 0.158 0.00
Privatization Reformsi,t Word Bank's regulatory quality index 0.299 0.00
Economic Globalizationi,tKOF Swiss Institute Economic Globalization Index (includes trade and financial globalization)
0.007 0.03
Figure A-3. Countries used in regression
AlbaniaAlgeriaAngolaAntigua and BarbudaArgentinaArmeniaAustraliaAustriaAzerbaijanBahrainBangladeshBarbadosBelarusBelgiumBelizeBeninBhutanBosnia and HerzegovinaBotswanaBrazilBulgariaBurkina FasoBurundiCambodiaCameroonCanadaCentral African RepublicChadChile
ChinaColombiaComorosCosta RicaCroatiaCyprusCzech RepublicDenmarkDjiboutiDominicaDominican RepublicEcuadorEl SalvadorEquatorial GuineaEstoniaEthiopiaFijiFinlandFranceGabonGeorgiaGermanyGhanaGreeceGrenadaGuatemalaGuineaGuinea-BissauHaiti
HondurasHungaryIcelandIndiaIndonesiaIraqIrelandIsraelItalyJamaicaJapanJordanKazakhstanKenyaKuwaitLatviaLebanonLesothoLiberiaLithuaniaLuxembourgMadagascarMalawiMalaysiaMaldivesMaliMaltaMauritaniaMauritius
MexicoMongoliaMontenegroMoroccoMozambiqueMyanmarNamibiaNepalNetherlandsNew ZealandNicaraguaNigerNigeriaNorwayOmanPakistanPanamaParaguayPeruPhilippinesPolandPortugalQatarRomaniaRussian FederationRwandaSaudi ArabiaSenegalSerbia
SeychellesSierra LeoneSingaporeSloveniaSouth AfricaSpainSri LankaSudanSurinameSwedenSwitzerlandTajikistanThailandTogoTrinidad and TobagoTunisiaTurkeyUgandaUkraineUnited Arab EmiratesUnited KingdomUnited StatesUruguayUzbekistanZambiaZimbabwe
For institutional and sophisticated investors only. Not for public distribution.

Connect with Vanguard® vanguard.com
All investing is subject to risk, including the possible loss of the money you invest. Past performance is no guarantee of future results.
CFA® is a registered trademark owned by CFA Institute.
© 2021 The Vanguard Group, Inc. All rights reserved.
ISGTTTC 092021
For institutional and sophisticated investors only. Not for public distribution.

Important Information
VIGM, S.A. de C.V. Asesor en Inversiones Independiente (“Vanguard Mexico”) registration number: 30119-001-(14831)-19/09/2018. The registration of Vanguard Mexico before the Comisión Nacional Bancaria y de Valores (“CNBV”) as an Asesor en Inversiones Independiente is not a certification of Vanguard Mexico’s compliance with regulation applicable to Advisory Investment Services (Servicios de Inversión Asesorados) nor a certification on the accuracy of the information provided herein. The supervision scope of the CNBV is limited to Advisory Investment Services only and not to all services provided by Vanguard Mexico.
This material is solely for informational purposes and does not constitute an offer or solicitation to sell or a solicitation of an offer to buy any security, nor shall any such securities be offered or sold to any person, in any jurisdiction in which an offer, solicitation, purchase or sale would be unlawful under the securities law of that jurisdiction. Reliance upon information in this material is at the sole discretion of the reader.
Securities information provided in this document must be reviewed together with the offering information of each of the securities which may be found on Vanguard’s website: https://www.vanguardmexico.com/web/cf/mexicoinstitutional/en/home or www.vanguard.com
Vanguard Mexico may recommend products of The Vanguard Group Inc. and its affiliates and such affiliates and their clients may maintain positions in the securities recommended by Vanguard Mexico.
ETF Shares can be bought and sold only through a broker and cannot be redeemed with the issuing fund other than in very large aggregations. Investing in ETFs entails stockbroker commission and a bid-offer spread which should be considered fully before investing. The market price of ETF Shares may be more or less than net asset value.
All investments are subject to risk, including the possible loss of the money you invest. Investments in bond funds are subject to interest rate, credit, and inflation risk. Governmental backing of securities apply only to the underlying securities and does not prevent share-price fluctuations. High-yield bonds generally have medium- and lower-range credit quality ratings and are therefore subject to a higher level of credit risk than bonds with higher credit quality ratings.
There is no guarantee that any forecasts made will come to pass. Past performance is no guarantee of future results.
Prices of mid- and small-cap stocks often fluctuate more than those of large-company stocks. Funds that concentrate on a relatively narrow market sector face the risk of higher share-price volatility. Stocks of companies are subject to national and regional political and economic risks and to the risk of currency fluctuations, these risks are especially high in emerging markets. Changes in exchange rates may have an adverse effect on the value, price or income of a fund.
The information contained in this material derived from third-party sources is deemed reliable, however Vanguard Mexico and The Vanguard Group Inc. are not responsible and do not guarantee the completeness or accuracy of such information.
This document should not be considered as an investment recommendation, a recommendation can only be provided by Vanguard Mexico upon completion of the relevant profiling and legal processes.
This document is for educational purposes only and does not take into consideration your background and specific circumstances nor any other investment profiling circumstances that could be material for taking an investment decision. We recommend to obtain professional investment advice based on your individual circumstances before taking an investment decision.
These materials are intended for institutional and sophisticated investors use only and not for public distribution.
Materials are provided only for their exclusive use and shall not be distributed to any other individual or entity. Broker-dealers, advisers, and other intermediaries must determine whether their clients are eligible for investment in the products discussed herein.
The information contained herein does not constitute an offer or solicitation and may not be treated as such in any jurisdiction where such an offer or solicitation is against the law, or to anyone for whom it is unlawful to make such an offer or solicitation, or if the person making the offer or solicitation is not qualified to do so.
THESE MATERIALS ARE PROVIDED AT THE REQUEST OF AND FOR THE EXCLUSIVE USE OF RECIPIENT AND CONTAIN HIGHLY CONFIDENTIAL INFORMATION, WHICH SHALL NOT BE REPRODUCED OR TRANSMITTED TO ANY THIRD PARTIES WITHOUT VANGUARD’S PRIOR WRITTEN CONSENT. THE CONTENTS OF THESE MATERIALS SHALL NOT BE UNDERSTOOD AS AN OFFER OR SOLICITATION TO BUY OR SELL SECURITIES IN BRAZIL AND VANGUARD IS NOT MAKING ANY REPRESENTATION WITH RESPECT TO THE ELIGIBILITY OF ANY RECIPIENT OF THESE MATERIALS TO ACQUIRE THE INTERESTS IN THE SECURITIES DESCRIBED HEREIN UNDER THE LAWS OF BRAZIL. SUCH SECURITIES HAVE NOT BEEN REGISTERED IN BRAZIL AND NONE OF THE INTERESTS IN SUCH SECURITIES MAY BE OFFERED, SOLD, OR DELIVERED, DIRECTLY OR INDIRECTLY, IN BRAZIL OR TO ANY RESIDENT OF BRAZIL EXCEPT PURSUANT TO THE APPLICABLE LAWS AND REGULATIONS OF BRAZIL.
This document does not constitute, and is not intended to constitute, a public offer in the Republic of Colombia, or an unlawful promotion of financial/capital market products. The offer of the financial products described herein is addressed to fewer than one hundred specifically identified investors. The financial products described herein may not be promoted or marketed in Colombia or to Colombian residents, unless such promotion and marketing is made in compliance with Decree 2555/2010 and other applicable rules and regulations related to the promotion of foreign financial/capital market products in Colombia.
The Product is not and will not be registered before the Colombian National Registry of Securities and Issuers (Registro Nacional de Valores y Emisores - RNVE) maintained by the Colombian Financial Superintendency, or before the Colombian Stock Exchange. Accordingly, the distribution of any documentation in regard to the financial products described here in will not constitute a public offering of securities in Colombia.
The financial products described herein may not be offered, sold or negotiated in Colombia, except under circumstances which do not constitute a public offering of securities under applicable Colombian securities laws and regulations; provided that, any authorized person of a firm authorized to offer foreign securities in Colombia must abide by the terms of Decree 2555/2010 to offer the such products privately to its Colombian clients.
The distribution of this material and the offering of shares may be restricted in certain jurisdictions. The information contained in this material is for general guidance only, and it is the responsibility of any person or persons in possession of this material and wishing to make application for shares to inform themselves of, and to observe, all applicable laws and regulations of any relevant jurisdiction. Prospective applicants for shares should inform themselves of any applicable legal requirements, exchange control regulations and applicable taxes in the countries of their respective citizenship, residence or domicile.
This offer conforms to General Rule No. 336 of the Chilean Financial Market Commission (Comisión para el Mercado Financiero). The offer deals with securities not registered under Securities Market Law, nor in the Securities Registry nor in the Foreign Securities Registry of the Chilean Financial Market Commission, and therefore such securities are not subject to its oversight. Since such securities are not registered in Chile, the issuer is not obligated to provide public information in Chile regarding the securities. The securities shall not be subject to public offering unless they are duly registered in the corresponding Securities Registry in Chile. The issuer of the securities is not registered in the Registries maintained by the Chilean Financial Market Commission, therefore it is not subject to the supervision of the Chilean Financial Market Commission or the obligations of continuous information.
For institutional and sophisticated investors only. Not for public distribution.

© 2021 The Vanguard Group, Inc. All rights reserved.
ISGFBY 062021
Connect with Vanguard® vanguardmexico.com
Esta oferta se acoge a la norma de carácter general n° 336 de la Comisión para el Mercado Financiero. La oferta versa sobre valores no inscritos bajo la Ley de Mercado de Valores en el Registro de Valores o en el Registro de Valores extranjeros que lleva la Comisión para el Mercado Financiero, por lo que tales valores no están sujetos a la fiscalización de ésta. Por tratarse de valores no inscritos, no existe la obligación por parte del emisor de entregar en Chile información pública respecto de esos valores. Los valores no podrán ser objeto de oferta pública mientras no sean inscritos en el Registro de Valores correspondiente. El emisor de los valores no se encuentra inscrito en los Registros que mantiene la Comisión para el Mercado Financiero, por lo que no se encuentra sometido a la fiscalización de la Comisión para el Mercado financiero ni a las obligaciones de información continua.
The securities described herein have not been registered under the Peruvian Securities Market Law (Decreto Supremo No 093-2002-EF) or before the Superintendencia del Mercado de Valores (SMV). There will be no public offering of the securities in Peru and the securities may only be offered or sold to institutional investors (as defined in Appendix I of the Institutional Investors Market Regulation) in Peru by means of a private placement. The securities offered and sold in Peru may not be sold or transferred to any person other than an institutional investor unless such securities have been registered with the Registro Público del Mercado de Valores kept by the SMV. The SMV has not reviewed the information provided to the investor. This material is for the exclusive use of institutional investors in Peru and is not for public distribution.
The financial products describe herein may be offered or sold in Bermuda only in compliance with the provisions of the Investment Business Act 2003 of Bermuda. Additionally, non-Bermudian persons may not carry on or engage in any trade or business in Bermuda unless such persons are authorized to do so under applicable Bermuda legislation. Engaging in the activity of offering or marketing the Products in Bermuda to persons in Bermuda may be deemed to be carrying on business in Bermuda.
Vanguard is not intending, and is not licensed or registered, to conduct business in, from or within the Cayman Islands, and the interests in the financial products described herein shall not be offered to members of the public in the Cayman Islands.
The financial products describe herein have not been and will not be registered with the Securities Commission of The Bahamas. The financial products described herein are offered to persons who are non-resident or otherwise deemed non-resident for Bahamian Exchange Control purposes. The financial products described herein are not intended for persons (natural persons or legal entities) for which an offer or purchase would contravene the laws of their state (on account of nationality or domicile/registered office of the person concerned or for other reasons). Further, the offer constitutes an exempt distribution for the purposes of the Securities Industry Act, 2011 and the Securities Industry Regulations, 2012 of the Commonwealth of The Bahamas.
This document is not, and is not intended as, a public offer or advertisement of, or solicitation in respect of, securities, investments, or other investment business in the British Virgin Islands (“BVI”), and is not an offer to sell, or a solicitation or invitation to make offers to purchase or subscribe for, any securities, other investments, or services constituting investment business in BVI. Neither the securities mentioned in this document nor any prospectus or other document relating to them have been or are intended to be registered or filed with the Financial Services Commission of BVI or any department thereof.
This document is not intended to be distributed to individuals that are members of the public in the BVI or otherwise to individuals in the BVI. The funds are only available to, and any invitation or offer to subscribe, purchase, or otherwise acquire such funds will be made only to, persons outside the BVI, with the exception of persons resident in the BVI solely by virtue of being a company incorporated in the BVI or persons who are not considered to be “members of the public” under the Securities and Investment Business Act, 2010 (“SIBA”). Any person who receives this document in the BVI (other than a person who is not considered a member of the public in the BVI for purposes of SIBA, or a person resident in the BVI solely by virtue of being a company incorporated in the BVI and this document is received at its registered office in the BVI) should not act or rely on this document or any of its contents.
This document does not constitute an offer or solicitation to invest in the securities mentioned herein. It is directed at professional / sophisticated investors in the United States for their use and information. The Fund is only available for investment by non-U.S. investors, and this document should not be given to a retail investor in the United States. Any entity responsible for forwarding this material, which is produced by VIGM, S.A. de C.V., Asesor en Inversiones Independiente in Mexico, to other parties takes responsibility for ensuring compliance with applicable securities laws in connection with its distribution.
For institutional and sophisticated investors only. Not for public distribution.


