Connect with Vanguard > vanguard.com • This paper presents Vanguard’s global perspectives on the future of growth, inflation, interest rates, and stock and bond returns over the next ten years. As in past outlooks, we anticipate that the modest global recovery will likely endure at a below-average pace through a period of low interest rates, continuing high unemployment and debt levels, and elevated policy uncertainty. • We detail how, after years of slightly disappointing 2% real growth, the U.S. in 2014–2015 faces cyclical risks tilted toward better-than-trend growth for the first time since the onset of the global financial crisis. Our economic outlook, in short, is one of resiliency . • We also explain why last year’s unease about the “reach for yield” is now joined by concern about “froth” in certain equity markets. Market volatility is likely as the Federal Reserve undertakes the multistep, multiyear process of unwinding its extraordinarily easy monetary policy. Rather than frame this process as a negative, we view it as an indication of increasing economic strength. Vanguard research January 2014 Note: The authors would like to thank the members of Vanguard’s Investment Strategy Group for their valuable feedback and contributions, in particular Harshdeep Ahluwalia, Vytautas Maciulis, Christos Tasopoulos, and Ravi Tolani. Vanguard’s economic and investment outlook Authors Joseph Davis, Ph.D. Roger Aliaga-Díaz, Ph.D. Charles J. Thomas, CFA Andrew J. Patterson, CFA
Note: The authors would like to thank the members of Vanguard’s Investment Strategy Group for their valuable feedback and contributions, in particular Harshdeep Ahluwalia, Vytautas Maciulis, Christos Tasopoulos, and Ravi Tolani.
Vanguard’sdistinctapproachtoforecastingTo treat the future with the deference it deserves, Vanguard believes that market forecasts are best viewed in a probabilistic framework. This publication’s primary objectives are to describe the projected long-term return distributions that contribute to strategic asset allocation decisions and to present the rationale for the ranges and probabilities of potential outcomes. This analysis discusses our global outlook from the perspective of a U.S. investor with a dollar-denominated portfolio.
Global market outlook summary
Global economy.Forthefirsttimesincethefinancialcrisis,ourleadingindicatorspointtoaslightpickup innear-termgrowthfortheUnitedStates,partsofEurope,andotherselectdevelopedmarkets.ContinuedprogressinU.S.consumerdeleveraging,strongcorporatebalancesheets,firmerglobaltrade,andlessfiscaldragindicateU.S.growthapproaching3%.Thatsaid,thiscyclicalassessmentshouldbeplacedagainstabackdropofhighunemploymentandgovernmentdebt;ongoingstructuralreformsinEurope,China,andJapan;andextremelyaggressivemonetarypolicywithexitstrategiesthathaveyettobetested.
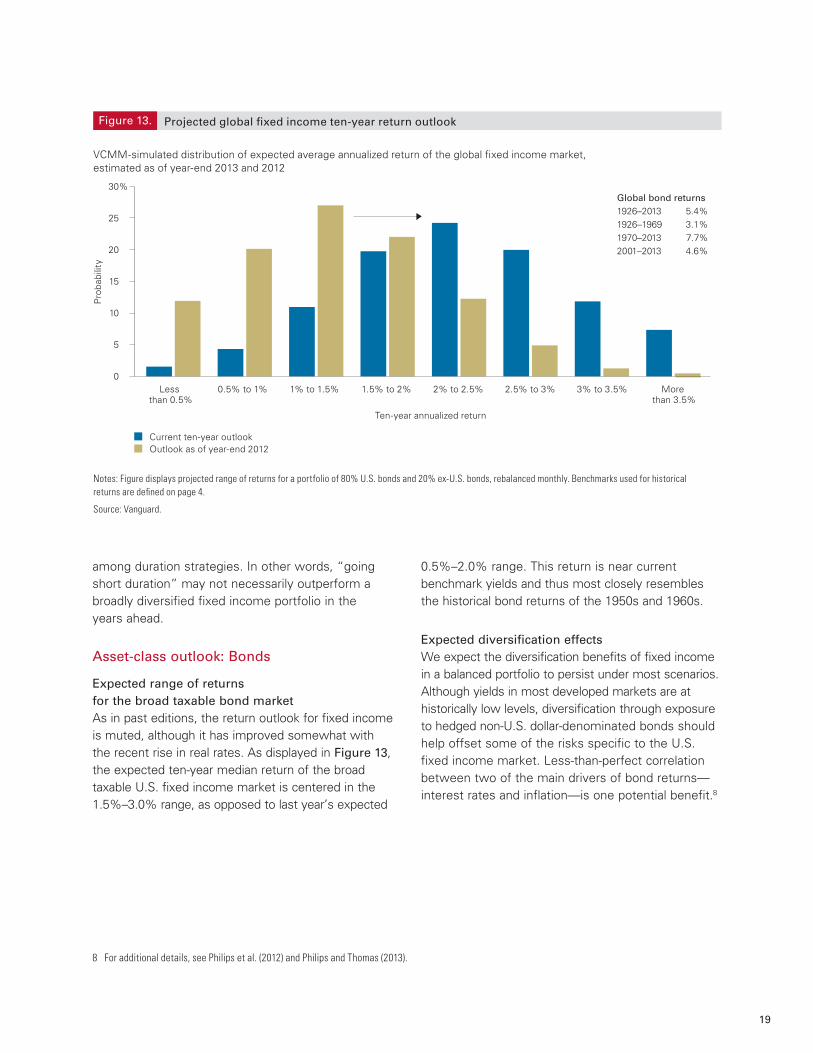
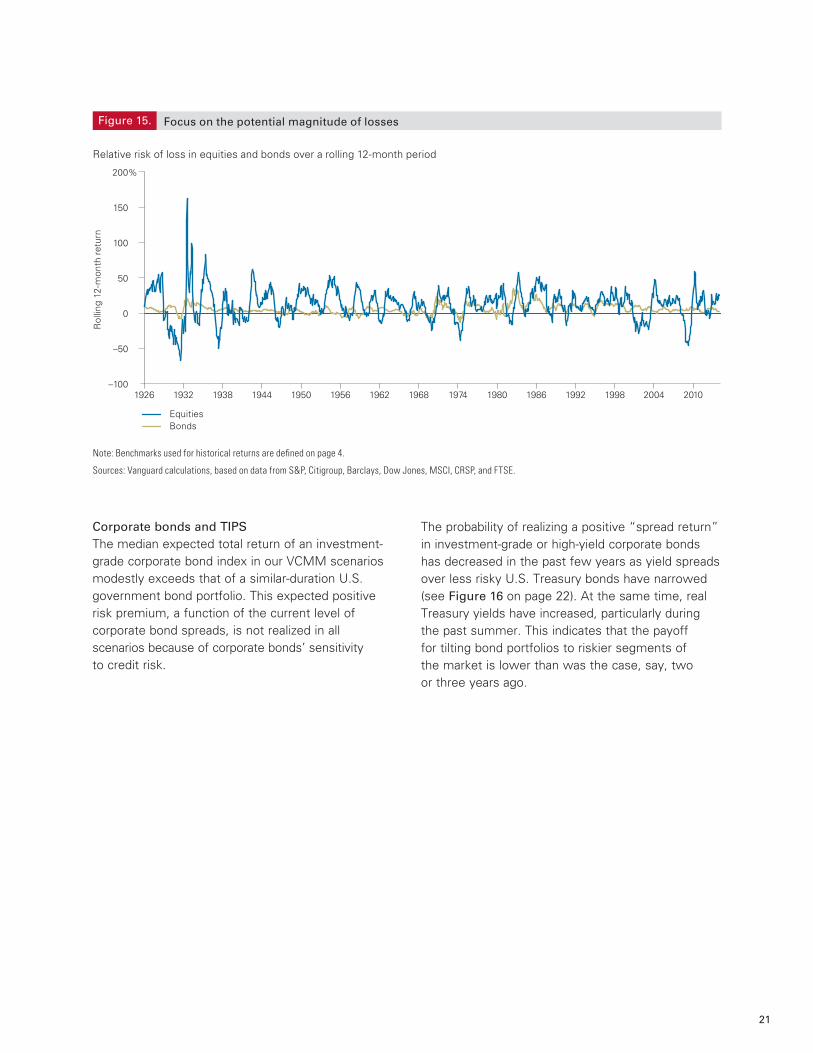
Global bond market. Asinpasteditions,thereturnoutlookforfixedincomeismuted,althoughithasimprovedsomewhatwiththerecentriseinrealrates.Theexpectedten-yearmediannominalreturnofabroad,globallydiversifiedfixedincomeinvestmentiscenteredinthe1.5%–3.0%range,versuslastyear’sexpectedrangeof0.5%–2.0%.Itisimportanttonotethatweexpectthediversificationbenefitsoffixedincomeinabalancedportfoliotopersistundermostscenarios.Webelievethattheprospectsoflosses inbondportfoliosshouldbeweighedagainstthemagnitudeofpotentiallossesinequityportfolios,becausethelatterhavetendedtoexhibitmuchlargerswingsinreturns.
3
Global equity market. Afterseveralyearsofsuggestingthatstrongequityreturnswerepossibledespite aprolongedperiodofsubpareconomicgrowth,ouroutlookforglobalequitieshasbecomemoreguarded.Theexpectedten-yearmediannominalreturnisbelowhistoricalaveragesandhasshiftedtowardthebottomofthe6%–9%rangecomparedwiththistimelastyear,areflectionoflessconstructivemarketvaluations(i.e.,price/earningsratios)intheUnitedStatesandsomeotherdevelopedmarkets.Anotablywiderangeofoutcomesispossible,evenoverlonghorizons,makingushard-pressedtoidentifymarket“bubbles.”However,weareuneasyaboutsignsoffrothincertainsegmentsoftheglobalequitymarket.Becausethepremiumcompensatingincreasedequityriskappearstohavecomedownrecently,wewouldencourageinvestorstoexercisecautioninmakingstrategicortacticalportfoliochangesthatincreasethisrisk.
IMPORTANT: The projections or other information generated by the VCMM regarding the likelihood of various investment outcomes are hypothetical in nature, do not reflect actual investment results, and are not guarantees of future results. Distribution of return outcomes from VCMM, derived from 10,000 simulations for U.S. equity returns and fixed income returns. Simulations as of November 30, 2013. Results from the model may vary with each use and over time. For more information, please see the appendix on page 30.
All investing is subject to risk, including the possible loss of the money you invest. Past performance is no guarantee of future returns. Investments in bond funds are subject to interest rate, credit, and inflation risk. Foreign investing involves additional risks, including currency fluctuations and political uncertainty. Diversification does not ensure a profit or protect against a loss in a declining market. There is no guarantee that any particular asset allocation or mix of funds will meet your investment objectives or provide you with a given level of income. The performance of an index is not an exact representation of any particular investment, as you cannot invest directly in an index.
Stocks of companies in emerging markets are generally more risky than stocks of companies in developed countries. U.S. government backing of Treasury or agency securities applies only to the underlying securities and does not prevent price fluctuations. Investments that concentrate on a relatively narrow market sector face the risk of higher price volatility.
4
1 Fiscal drag occurs when government spending cuts, tax increases, or both reduce the pace of overall spending and GDP growth.
a. A cyclical upturn in a world of lower trend growth
Annualized growth of the global economy
Global trend growth has been heading down
Notes: World GDP is shown at market exchange rates, in constant U.S. dollars. Data are from World Bank for 1960 through 1969 and International Monetary Fund’s World Economic Outlook (WEO), October 2013, for subsequent years. Projected growth is from the IMF.
Sources: Vanguard calculations, based on IMF and World Bank data.
Notes: Percentage of world economy is based on IMF estimates of nominal GDP. Pre-recession trend is based on average annualized real GDP growth from the IMF. Long-run potential for the United States is de�ned as the average growth in 2018 of the Congressional Budget Of�ce’s real potential GDP estimate; for other regions, it is de�ned as the 2018 growth rate from the IMF’s October 2013 WEO.
Sources: Vanguard calculations, based on IMF and CBO data.
0
1
2
3
4
5
6%
1960s 1970s 1990s 2000s 2010–2013
2014–2016
(projected)
Ave
rage
ann
ualiz
ed g
row
th
1980s
b. Trend growth is lower across most large markets
Historical and future trend growth in the world’s ten largest economies
5.5%
3.9%
3.1%2.7%
2.5%
3.0%3.4%
Percentage Pre-recession Long-run of world trend growth potential economy (1995–2007) growth
22.8% 3.2% 2.5%
17.3% 2.3% 1.6%
12.2% 10.0% 7.0%
6.8% 1.2% 1.1%
3.4% 3.3% 2.3%
3.0% 3.0% 3.5%
2.9% 3.9% 3.5%
2.5% 3.1% 2.2%
2.4% 6.9% 6.7%
United States
Eurozone
China
Japan
United Kingdom
Brazil
Russia
Canada
India
Australia 2.0% 3.7% 3.0%
6
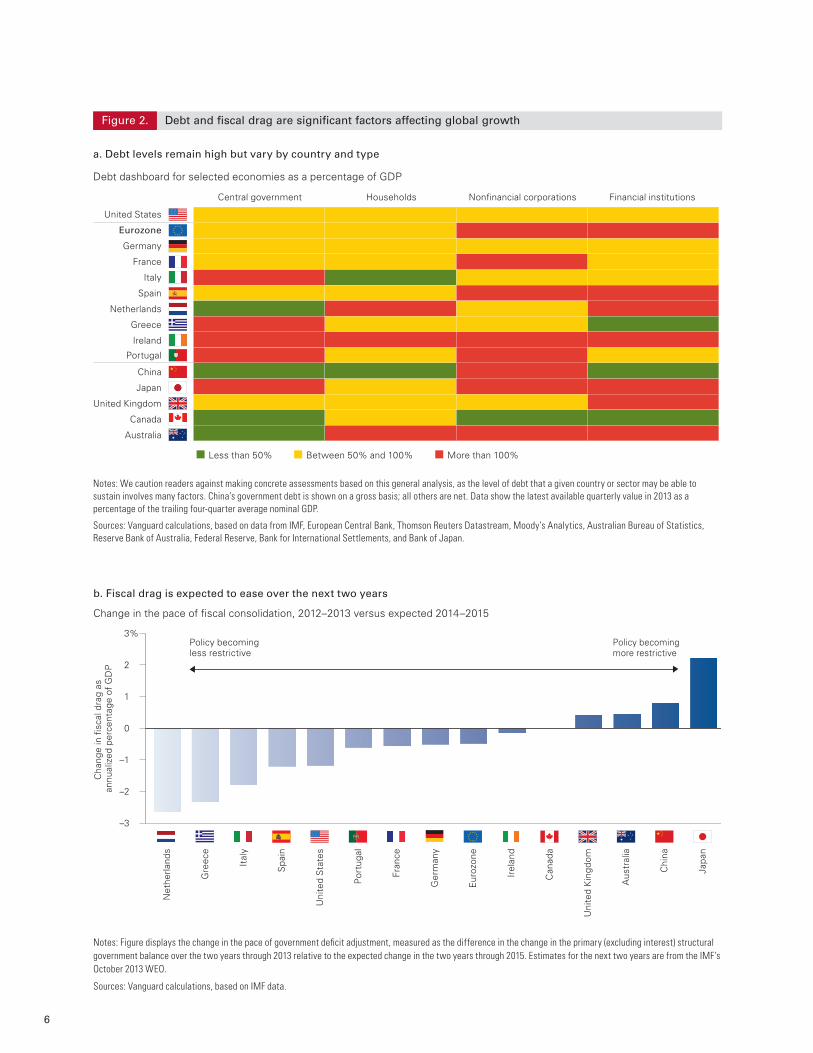
Debt and fiscal drag are significant factors affecting global growth Figure 2.
Notes: We caution readers against making concrete assessments based on this general analysis, as the level of debt that a given country or sector may be able to sustain involves many factors. China’s government debt is shown on a gross basis; all others are net. Data show the latest available quarterly value in 2013 as a percentage of the trailing four-quarter average nominal GDP.
Sources: Vanguard calculations, based on data from IMF, European Central Bank, Thomson Reuters Datastream, Moody’s Analytics, Australian Bureau of Statistics, Reserve Bank of Australia, Federal Reserve, Bank for International Settlements, and Bank of Japan.
b. Fiscal drag is expected to ease over the next two years
Cha
nge
in �
scal
dra
g as
an
nual
ized
per
cent
age
of G
DP
Notes: Figure displays the change in the pace of government de�cit adjustment, measured as the difference in the change in the primary (excluding interest) structural government balance over the two years through 2013 relative to the expected change in the two years through 2015. Estimates for the next two years are from the IMF’s October 2013 WEO.
Sources: Vanguard calculations, based on IMF data.
–3
–2
–1
0
1
2
3%Policy becoming less restrictive
Policy becoming more restrictive
Uni
ted
Sta
tes
Eur
ozon
e
Chi
na
Japa
n
Uni
ted
Kin
gdom
Can
ada
Aus
tral
ia
Irel
and
Ger
man
y
Fran
ce
Gre
ece
Net
herla
nds
Ital
y
Por
tuga
l
Spa
in
Change in the pace of �scal consolidation, 2012–2013 versus expected 2014–2015
7
AsiaChinaislikelytogrowata7%paceoverthe nexttwotothreeyears,inlinewithmarketexpectationsbutnotablyslowerthanitsprevioustrend.Policymakersareattemptingthroughstructuralsupply-sidereformstostrategicallyalterthecountry’sgrowthmodel,whichheretoforehasreliedoninvestmentandexportsasitssoledrivers.AsillustratedinFigure 4a onpage8,investmentcurrentlyrepresentsanotablyhighshareofChineseGDP.However,capital-to-laborratiosarefairlylow,meaningthatalthoughinvestmentisrunningatahigh rate,thecountryisstartingfromalow base initscapitalstock.Withcapitalperpersonatless thanone-fifththatoftheUnitedStates,much moreinvestmentisstillneeded.
Notes: “Core” is de�ned as the GDP-weighted average of changes in unit labor costs in Germany, France, and the Netherlands. “Periphery” is de�ned as the GDP-weighted average of changes in unit labor costs in Italy, Spain, Greece, Portugal, and Ireland. CEPR refers to the Centre for Economic Policy Research.
Sources: Vanguard calculations, based on data from Moody’s DataBuffet.com, Thomson Reuters Datastream, France’s National Institute of Statistics and Economic Studies (INSEE), Deutsche Bundesbank, Statistics Netherlands, Ireland’s Central Statistics Of�ce (CSO), Italian National Institute of Statistics (ISTAT), Hellenic Statistical Authority (ELSTAT), Instituto Nacional de Estatística–Portugal (Statistics Portugal), and European Commission: Eurostat.
Figure 3. In Europe, growth is expected to remain lackluster and divergent as imbalances slowly correct
b. Unit labor costs in the Eurozone
Cum
ulat
ive
chan
ge r
elat
ive
to E
uroz
one
aver
age
sinc
e Q
4 20
00
–10
–5
0
5
10
15%
2013201120092007200520032001
8
Figure 4.
Investment as percentage of GDPCapital-to-labor ratio
a. China’s investment spending: An unsustainable rate, but unlikely to soon collapse
Investment as percentage of GDP and capital-to-labor ratios for selected countries and time periods
In Asia, China needs rebalancing as Japan attempts re�ation
Notes: Investment as a percentage of GDP is from the IMF’s October 2013 WEO and April 2002 WEO for the stated time periods. “Today” is de�ned as the average for 2013. Asia Tigers comprise South Korea, Hong Kong, Taiwan, and Singapore when each was at China’s 2013 real per capita GDP level ($6,500 in 2013 U.S. dollars). The 15 largest economies are de�ned using 2013 GDP. Capital-to-labor ratio is from the Penn World Tables, in 2005 U.S. dollars, with “today” de�ned as the average for 2011.
Sources: Vanguard calculations, using data from the IMF and Penn World Tables.
Inve
stm
ent
as p
erce
ntag
e of
GD
P
0
10
20
30
40
50%
0
50,000
100,000
150,000
200,000
250,000
$300,000
China today China averagepast decade
Asia Tigers atChina’s currentincome levels
15 largesteconomies
average today
United States today
Cap
ital-t
o-la
bor
ratio
, con
stan
t 20
05 d
olla
rs
b. “Abenomics” in Japan: More re�ation than real growth
Japan’s historical and Abenomics real GDP growth and in�ation
0
1
2
3
4
5%
Ave
rage
ann
ual r
ate
In�ationReal GDP growth
Notes: Figure assumes that Abenomics achieves its goals of 2% in�ation and 3% nominal GDP per capita growth by 2015. Transition assumes IMF’s WEO October 2013 baseline is realized in 2013–2014.
Sources: Vanguard calculations, based on data from Thomson Reuters Datastream and IMF.
2 Japanese Prime Minister Shinzo Abe has announced targets of 3% growth of nominal income per capita and 2% inflation by 2015. 3 For more on the prospects for U.S. growth over the next decade, see Davis (2012) on a potential ”third industrial revolution.” In that presentation, we
discuss how the factors that could contribute to better-than-expected growth may be driven by marked increases in capital investment. This could be sparked by the widespread adoption of cost-saving technologies, increased housing and infrastructure spending after a prolonged period of depressed activity, substantial U.S. energy independence from rising domestic production, and a lower trade deficit.
4 See Summers (2013) and Gordon (2012) for in-depth discussions supporting the view of secular stagnation.
10
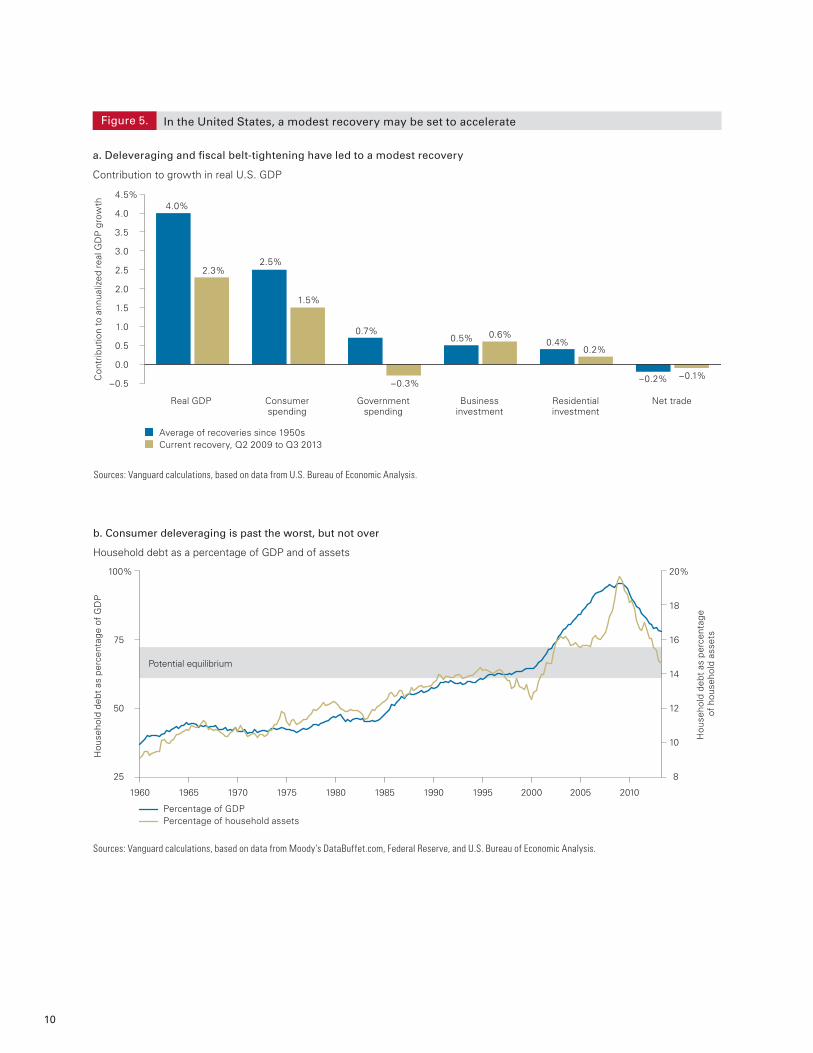
Figure 5.
a. Deleveraging and �scal belt-tightening have led to a modest recovery
Contribution to growth in real U.S. GDP
In the United States, a modest recovery may be set to accelerate
Average of recoveries since 1950sCurrent recovery, Q2 2009 to Q3 2013
Sources: Vanguard calculations, based on data from U.S. Bureau of Economic Analysis.
Con
trib
utio
n to
ann
ualiz
ed r
eal G
DP
gro
wth
–0.5
0.0
0.5
1.0
1.5
2.0
2.5
3.0
3.5
4.0
4.5%4.0%
2.3%2.5%
1.5%
0.7%
–0.3%
0.5% 0.6%0.4%
0.2%
–0.2% –0.1%
Real GDP Consumerspending
Governmentspending
Businessinvestment
Residentialinvestment
Net trade
Sources: Vanguard calculations, based on data from Moody’s DataBuffet.com, Federal Reserve, and U.S. Bureau of Economic Analysis.
Percentage of GDP Percentage of household assets
Hou
seho
ld d
ebt
as p
erce
ntag
e of
GD
P
25
50
75
100%
8
10
12
14
16
18
20%
Potential equilibrium
Hou
seho
ld d
ebt
as p
erce
ntag
e of
hou
seho
ld a
sset
s
Household debt as a percentage of GDP and of assets
b. Consumer deleveraging is past the worst, but not over
20102005200019951990198519801975197019651960
11
c. Businesses are positioned to expand and hire . . .
Corporate pro�ts and cash balances
d. . . . as long as uncertainty doesn’t crimp con�dence
Policy Uncertainty Index and business investment as a percentage of GDP
Note: For additional information on the Policy Uncertainty Index, including the methodology behind its construction, see Baker, Bloom, and Davis (2012).
Sources: Vanguard calculations, based on data from Moody's DataBuffet.com, U.S. Bureau of Economic Analysis, National Bureau of Economic Research, and Baker, Bloom, and Davis (2012).
Pol
icy
Unc
erta
inty
Inde
x, 1
2-m
onth
mov
ing
aver
age
Policy Uncertainty Index Fixed business investment
Fixe
d bu
sine
ss in
vest
men
t as
per
cent
age
of G
DP
50
75
100
125
150
175
200
10
11
12
13
14
15%
20061994 2000
Figure 5. In the United States, a modest recovery may be set to accelerate continued
Sources: Vanguard calculations, based on data from Moody’s DataBuffet.com, Federal Reserve, U.S. Bureau of Economic Analysis, and National Bureau of Economic Research.
Cor
pora
te a
fter
-tax
pro
�ts
as p
erce
ntag
e of
GD
P
Corporate after-tax pro�ts as percentage of GDP Corporate cash holdings as percentage of total assets
Cor
pora
te c
ash
hold
ings
as
per
cent
age
of t
otal
cor
pora
te a
sset
s
2
2.5
3
3.5
4
4.5
5
5.5%
4
5
6
7
8
9
10
11%
1985 1991 1997 20031988 20122009
201020052000199519901985198019751970
2014 U.S. economic outlook: improving odds of above 2% growth
a. Vanguard’s dashboard of leading economic indicators b. Vanguard’s 2014 U.S. economic growth outlook
Estimated distribution of growth outcomes
Odds favor an acceleration in U.S. growth in 2014
Sources: Vanguard calculations, based on data from Moody’s DataBuffet.com.
0
25
50
75
100%
Sha
re o
f in
dica
tors
abo
ve/b
elow
tre
nd
Notes: Distribution of growth outcomes generated by bootstrapping the residualsfrom a regression based on a proprietary set of leading economic indicators and historical data, estimated from 1960 to 2013 and adjusting for the time-varyingtrend growth rate. The 2014 consensus is from the Federal Reserve Bank of Philadelphia’s Q4 2013 Survey of Professional Forecasters.
Sources: Vanguard calculations, based on data from U.S. Bureau of EconomicAnalysis and Federal Reserve.
Pro
babi
lity
0
5
10
15
20
25
30
35%
Odds of a slowdown
27%
Odds of an acceleration
48%
11%
16%
Trailingthree-year
growth
2.2%
25% 25%
16%
7%
Recession: Less than 0.5%Stagnation: 0.5% to 1.5%Status quo: 1.5% to 2.5%Cyclical rebound: 2.5% to 3.5%Robust above-trend growth: 3.5% to 4.5%Overheating: Above 4.5%
Historical real GDP growth
1926–2013 3.3%
2000–2013 1.8%
Past three years 2.2%
2014 consensus 2.8%
20122009200620032000
Above-trend growthHousingFinancial conditionsStock marketReal ratesManufacturing Below trend but positive momentumGlobal tradeBusiness loansBelow trend and negative momentumCon�denceLending demandExcess capacityGovernment
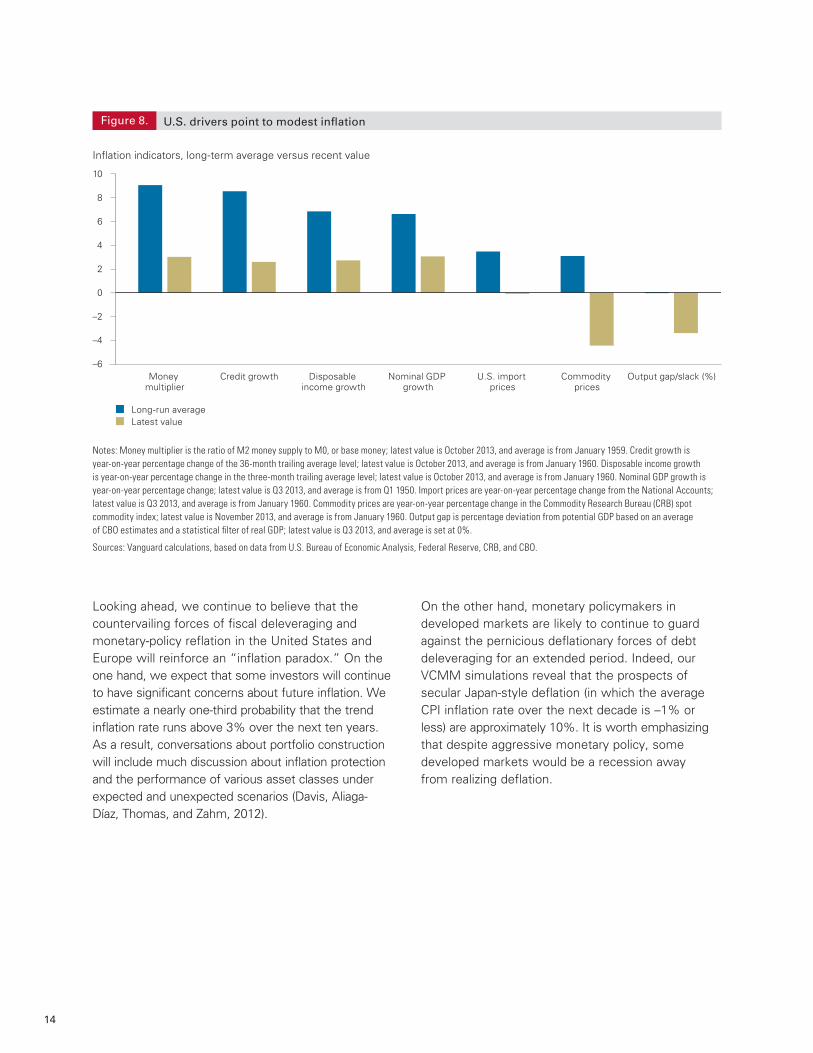
Ofnote,Vanguard’smediansecularinflationexpectationisapproximately1%lowerthantheaverageU.S.CPIinflationrateobservedsince1950.All else being equal, this implies that nominal asset-class returns may be 1% lower than historical long- run averages, even if their expected average real (inflation-adjusted) returns are identical. Wediscussthispointfurtherinthesectiononstocks,bonds,andassetallocationstrategies.
Federal Reserve
Bank of England
European Central BankBank of Japan
Note: Total assets for each central bank are shown as a percentage of that country’s or region’s 2008 GDP.
Sources: Vanguard calculations, based on data from Federal Reserve, Bank of England, European Central Bank, Bank of Japan, and IMF.
Tota
l ass
ets
(per
cent
age
of 2
008
GD
P)
Year
-on
-yea
r pe
rcen
tage
cha
nge
Onset of global �nancial crisis
0
10
20
30
40
50%
United States Japan United Kingdom Eurozone
Figure 7.
a. Global central bank assets as a percentage of a region’s 2008 GDP
Monetary policy of unprecedented size and scope to avert the prospect of global de�ation
b. Core in�ation across key central bank markets, 2001–2013
Note: Figure displays the year-on-year percentage change in each country’s or region’s core (excluding food and energy) consumer price index.
Sources: Vanguard calculations, based on data from U.S. Bureau of Labor Statistics, Statistics Bureau of Japan, U.K. Of�ce for National Statistics, and Eurostat.
In�ation indicators, long-term average versus recent value
U.S. drivers point to modest in�ation
Notes: Money multiplier is the ratio of M2 money supply to M0, or base money; latest value is October 2013, and average is from January 1959. Credit growth is year-on-year percentage change of the 36-month trailing average level; latest value is October 2013, and average is from January 1960. Disposable income growth is year-on-year percentage change in the three-month trailing average level; latest value is October 2013, and average is from January 1960. Nominal GDP growth is year-on-year percentage change; latest value is Q3 2013, and average is from Q1 1950. Import prices are year-on-year percentage change from the National Accounts; latest value is Q3 2013, and average is from January 1960. Commodity prices are year-on-year percentage change in the Commodity Research Bureau (CRB) spot commodity index; latest value is November 2013, and average is from January 1960. Output gap is percentage deviation from potential GDP based on an average of CBO estimates and a statistical �lter of real GDP; latest value is Q3 2013, and average is set at 0%.
Sources: Vanguard calculations, based on data from U.S. Bureau of Economic Analysis, Federal Reserve, CRB, and CBO.
–6
–4
–2
0
2
4
6
8
10
Money multiplier
Credit growth Nominal GDP growth
U.S. import prices
Commodity prices
Disposable income growth
Output gap/slack (%)
Long-run averageLatest value
15
Outlook for U.S. monetary policy and interest rates
5 Balance sheet expansion in most large central banks has occurred through quantitative easing—the purchase of longer-term securities, typically government bonds, financed by creating bank reserves. This policy is intended to influence longer-term interest rates when the traditional short-term policy rate is near 0%. The European Central Bank is an exception—its balance sheet expansion occurred through policies designed to promote liquidity in the banking system, referred to as long-term refinancing operations, or LTROs.
VCMM-simulated distribution of annualized expected average
Figure 9. Projected U.S. CPI in�ation rate, current and 2012 ten-year outlooks
–6.00
–4.00
–2.00
0
2.00
4.00
6.00
8.00
10.00
Pro
babi
lity
Less than 0%
0% to 1% 3% to 4% Greater than 4%
1% to 3%0
10
20
30
40%
15%17%
14% 14%
38%38%
15%14%
17%16%
Sources: Vanguard calculations, based on data from U.S. Bureau of Labor Statistics.
Current ten-year outlookTen-year outlook as of year-end 2012
Median in�ation 1950–2013 3.0%
Median in�ation 2000–2013 2.5%
10-year TIPS break-evenin�ation as of November 29, 2013 2.1%
Ten-year annualized CPI in�ation rate
16
When will the Fed raise rates?Thetimingdependsontwocriticallabor-marketissues:(1)howquicklytheactualunemploymentratefalls,and(2)whyitfalls.
Figure 10. Questions about structural unemployment are a wild card for the Fed’s exit
Unemployment rate under hypothetical scenarios for labor force participation
Change in labor force participation rates across demographic groups, 2007–2013
a. Demographics and structural change cast doubt on the headline unemployment rate
b. Labor force participation has fallen, but will it improve as the recovery continues?
Une
mpl
oym
ent
rate
2010200920082007
4
5
6
7
8
9
10
11
12
13%
201320122011
Note: Figure displays change in the labor force participation rate from December 2007 to November 2013 for the stated age groups.
Sources: Vanguard calculations, based on data from U.S. Bureau of Labor Statistics.
Cha
nge
in la
bor
forc
e pa
rtic
ipat
ion
rate
sinc
e D
ecem
ber
2007
–5
–4
–3
–2
–1
0
1
2%
–3.0%
–4.6%
–2.2%
1.1%
Overall 16–24 25–54 55+
AgesActual unemploymentAssuming labor force participation rate constant at December 2007 levelsConstant labor force participation, adjustedfor aging population
Notes: Figure displays actual unemployment rate along with two adjusted measures. The �rst assumes the labor force participation rate stays constant at the December 2007 level of 66%, with any labor force dropouts being added to the unemployment rate calculation. The second assumes labor force participation is held at December 2007 levels but controls for the impact of demographics, with workers shifting to and from age groups with different participation rates.
Sources: Vanguard calculations, based on data from U.S. Bureau of Labor Statistics and Census Bureau.
U.S. Treasury yield curveThebondmarketcontinuestoexpectTreasuryyieldstorise,withabiastowardasteepercurveuntiltheFederalReserveraisesshort-termrates.Comparedwithlastyear’soutlook,ourestimatesofthefairvaluerangeforthe10-yearTreasurybondhaverisen,withthecurrentmacroeconomicenvironmentjustifyinga10-yearyieldintherangeof2.75%to3.75%(seeFigure 12aonpage18).BasedonourestimatesofthefundamentaldriversofTreasurybondyields,wearehardpressedtofindabubble inTreasurysecurities.Withtherecentriseinlong-terminterestratessincesummer2013,wefind thatbondyieldsaretowardthemiddleoftherange ofourfair-valueestimates.
6 Broad measures of wage growth currently are near 2%; growth above 3% would imply that the amount of slack in the economy is overestimated (i.e., the nonaccelerating inflation rate of unemployment [NAIRU] is higher).
Figure 11. Handicapping Fed tightening and the end of �nancial repression
Note: Figure displays VCMM-projected probability that the 3-month Treasury bill yield will be less than 0.5%, or less than the 12-month trailing in�ation rate at the end of the stated year.
Source: Vanguard.
Pro
babi
lity
0
10
20
30
40
50
60
70
80
90
100%
Probability of T-bill rate near 0%Probability of T-bill rate below in�ation
One year out Two years out Three years out Four years out Five years out
51.8%
75.8%
40.1%
65.4%
31.7%
57.5%
25.3%
50.2%
21.2%
44.4%
VCMM-simulated probabilities of the level of nominal and real 3-month Treasury bill yields
18
7 For further detail on the forward curve and the implications of the bond market pricing forward interest rate expectations, see Davis et al. (2010).
a. Fair value factors suggest that long-term Treasury yields are reasonable, with the market already pricing an increase
Vanguard’s fair value model of the 10-year Treasury yield, with forward-inferred and VCMM-simulated projections
Difference in yield between a broad-market and a short-duration U.S. bond investment
Think twice before adjusting duration to avoid a bubble in Treasuries
Notes: Historical fair value is based on a model derived from Warnock and Warnock (2009) and includes expected in�ation, expected real GDP growth, expectations regarding monetary and �scal policy, and domestic and foreign capital �ows. Range re�ects standard error margin of plus or minus 0.5 percentage points. Forward curve is derived from the Federal Reserve data set provided by Gürkaynak, Sack, and Wright (2006). VCMM projections re�ect data through November 2013.
Sources: Vanguard calculations, based on data from the Federal Reserve.
10-y
ear
Trea
sury
bill
yie
ld
0
2
4
6
8
10
12%
1990 1995 2000 2005 2010 2015
Fair value rangeActualForward curve (November 2013)VCMM 50th percentileVCMM 25th/75th percentile
Note: Figure displays the difference in yield to worst between the Barclays U.S. Aggregate Bond Index and the Barclays U.S. Aggregate 1–3 Year Index.
Sources: Vanguard calculations, based on data from Barclays.
Dif
fere
nce
in y
ield
,br
oad
bond
mar
ket
vers
us s
hort
-dur
atio
n bo
nds
20130
0.5
1.0
1.5
2.0
2.5%
1995 1998 2001 2004 2007 2010
b. Short-duration tilts involve giving up signi�cant income
Expected range of returns for the broad taxable bond marketAsinpasteditions,thereturnoutlookforfixedincomeismuted,althoughithasimprovedsomewhatwiththerecentriseinrealrates.AsdisplayedinFigure 13,theexpectedten-yearmedianreturnofthebroadtaxableU.S.fixedincomemarketiscenteredinthe1.5%–3.0%range,asopposedtolastyear’sexpected
8 For additional details, see Philips et al. (2012) and Philips and Thomas (2013).
Global bond returns1926–2013 5.4%1926–1969 3.1%1970–2013 7.7%2001–2013 4.6%
Figure 13.
VCMM-simulated distribution of expected average annualized return of the global �xed income market, estimated as of year-end 2013 and 2012
Projected global �xed income ten-year return outlook
Notes: Figure displays projected range of returns for a portfolio of 80% U.S. bonds and 20% ex-U.S. bonds, rebalanced monthly. Benchmarks used for historical returns are de�ned on page 4.
Source: Vanguard.
Pro
babi
lity
Ten-year annualized return
Less than 0.5%
0.5% to 1% 1.5% to 2% 2% to 2.5% 3% to 3.5%1% to 1.5% More than 3.5%
Current ten-year outlookOutlook as of year-end 2012
0
5
10
15
20
25
30%
2.5% to 3%
20
9 We define high-grade or investment-grade bonds as those fixed income securities rated Baa3 and above by Moody’s. 10 For additional details, see Kinniry and Scott (2013). 11 For additional details, see Davis (2013b).
Median return of various asset classes during the worst decile of monthly equity returns, 1988–2012
Bonds can provide ballast in an equity bear market
Notes: U.S. stocks, U.S. bonds, and international bonds represented by indexes listed on page 4. Emerging-market stocks represented by FTSE Emerging Index andemerging-market bonds by Barclays Emerging Markets Tradable USD Sovereign Bond Index. REITs represented by FTSE NAREIT Equity REIT Index, dividend stocks by Dow Jones U.S. Select Dividend Total Return Index, commodities by S&P GSCI Commodity Index, high-yield bonds by Barclays U.S. Corporate High Yield Index, hedge funds by median hedge fund-of-funds return as identi�ed by Morningstar, Inc., corporate bonds by Barclays U.S. Corporate Investment Grade Index, and Treasury bonds by Barclays U.S. Treasury Index.
Sources: Vanguard calculations, based on data from S&P, Citigroup, Barclays, Dow Jones, MSCI, CRSP, and FTSE.
Med
ian
retu
rn
–10
–8
–6
–4
–2
0
2%
U.S.stocks
Emerging-marketstocks
REITs Dividendstocks
Commod-ities
High-yieldbonds
Emerging-marketbonds
Hedgefunds
Corporatebonds
Treasurybonds
Inter-nationalbonds
(unhedged)
Inter-nationalbonds
(hedged)
21
Corporate bonds and TIPSThemedianexpectedtotalreturnofaninvestment-gradecorporatebondindexinourVCMMscenariosmodestlyexceedsthatofasimilar-durationU.S.governmentbondportfolio.Thisexpectedpositiveriskpremium,afunctionofthecurrentlevelofcorporatebondspreads,isnotrealizedinallscenariosbecauseofcorporatebonds’sensitivity tocreditrisk.
Figure 16. Treasury yields are up, and corporate spreads have compressed
Notes: Real yield is de�ned as the yield of the active 10-year TIPS bond. Break-even in�ation is the difference between the active 10-year nominal Treasury and the 10-year TIPS bond. Investment-grade corporate spread is the option-adjusted spread (OAS) of the Barclays U.S. Investment-Grade Corporate Index. High-yield corporate spread is the difference between the OAS of the Barclays U.S. High Yield Corporate Index and the Barclays U.S. Investment-Grade Corporate Index. “Current” is as of November 2013.
Sources: Vanguard calculations, based on data from Federal Reserve and Barclays.
Yie
ld
0
2
4
6
8
10
12
14
16%
0.6%
2.8%
1.3%
2.2%
Current
2.5%
1.0%
2.4%
2.0%
Prerecession2004–2007 average
6.6%
3.4%
1.7%
1.7%
Recession2008–2009 average
0.4%
4.2%
2.2%
1.7%
Recovery2010–2012 average
Low risk premiums
High risk premiums
Falling risk premiums
Real yieldBreak-even in�ationInvestment-grade corporate spreadHigh-yield corporate spread
Treasury and corporate bond yields for selected time periods
VCMM-simulated distribution of expected average annualized return of the global equity market, estimated as of year-end 2013 and 2012
Projected global equity ten-year return outlook
Notes: Figure displays the projected range of returns for a 70% U.S., 30% ex-U.S. equity portfolio, rebalanced monthly. Benchmarks used for historical returns are de�ned on page 4.
Source: Vanguard.
Pro
babi
lity
Less than 0% 0% to 3% 3% to 6% 6% to 9%
Ten-year annualized return
Shift in distribution of outcomes relative to last year
9% to 12% 12% to 15% 15% to 18% More than 18%
Current ten-year outlookOutlook as of year-end 2012
0
5
10
15
20
25%
Historical global equity returns
1926–2013 10.2%
1926–1969 9.7%
1970–2013 10.6%
2001–2013 5.6%
24
Ofnote,theprojecteddistributionofannualized ten-yearglobalequityreturnsshowninFigure17onpage23displayswide and fattails.AsdiscussedinDavis,Aliaga-Díaz,andThomas(2012),valuationsarethemostusefulmetricinestimatingforward-lookingexpectedreturnsofequitymarkets.However,theystillleavemorethanhalfthevolatilityoflong-runreturnsunexplained.Althoughweemphasizeafocusonthewidedistribution,wenotethatthecentraltendencyofourprojectedreturnshascomedown
a. Most developed-market valuation metrics are above long-term averages
Valuation metrics for the U.S. equity market relative to historical average value
Some differences exist across metrics and regions, but valuations are generally elevated
Notes: Figure displays valuation metrics standardized to have a long-term average of 0.0 and a standard deviation of 1.0. Broad market price/earnings displays the market value of domestic corporations from the Federal Reserve Flow of Funds database relative to the trailing four-quarter average of after-tax corporate pro�ts from the BEA’s national accounts. Broad market price/sales displays the market value of domestic corporations from the Flow of Funds database relative to the Gross Value Added of Corporate Business from the BEA’s national accounts. Broad market price/book displays the market value of domestic corporations relative to the net worth at historical cost of Non�nancial Corporate Business, both from the Flow of Funds database. Shiller CAPE (10-year) is the ten-year cyclically adjusted price/earnings ratio as de�ned in Shiller (2000). Shiller CAPE (3-year) is Shiller’s measure, adjusted to smooth earnings over a trailing 36-month period.
Sources: Vanguard calculations, based on data from Federal Reserve, U.S. Bureau of Economic Analysis, and Robert Shiller’s website,aida.wss.yale.edu/~shiller/data.htm.
Sta
ndar
d de
viat
ions
fro
m lo
ng-t
erm
mea
n
b. Regional valuations are more similar today than in the middle of the previous decade
Price over 36-month trailing earnings for selected global equity indexes
Notes: Figure displays the price/earnings ratio with 36-month trailing average earnings. United States is de�ned as the FTSE United States Index, developed markets ex-U.S. are de�ned as the FTSE All-World Developed ex US Index, and emerging markets are de�ned as the FTSE All-World Emerging Markets Index.
Sources: Vanguard calculations, based on data from FTSE.
Figure 19. Today’s valuation levels have been associated with modest average returns but a wide range of possible outcomes
Notes: Figure displays the initial valuation quintile of the S&P 500 Index, de�ned as the ten-year cyclically adjusted price/earnings ratio (CAPE) as de�ned by Shiller (2000), with the 5th/25th/50th/75th/95th percentile range of subsequent realized ten-year real returns on the U.S. equity market. Data represent January 1926–September 2013. U.S. equities are de�ned as on page 4, de�ated by U.S. consumer price in�ation.
Sources: Vanguard calculations, based on data from Robert Shiller’s website, aida.wss.yale.edu/~shiller/data.htm; S&P; Dow Jones; MSCI; and U.S. Bureau of Labor Statistics.
Dis
trib
utio
n of
fut
ure
ten
-yea
r re
al e
quit
y re
turn
s
–5
0
5
10
15
20%
Top 2nd Middle 4th Bottom
Quintile ranking of initial Shiller CAPE (10-year)
8%
Percentiles:
Key
5th
95th
Median
75th
25th
14%
16% 16%
19%
5%
3%
0%
–2%
–4%
4%
–2%
0%
8%
1%
5%
12%
3%
8%
14%
8%
10%
12%
9%10%
U.S. average real return = 7%
Initial cyclically adjusted price/earnings ratio and subsequent range of ten-year real U.S. equity returns, 1926–2013
Currentvaluation
levels
26
12 See the Appendix for the range of returns in nominal terms before adjusting for inflation.
Modest outlook for long-run real returnsAmidwidespreadconcernoverthecurrentlow levelofdividendandlong-termU.S.Treasuryyields,Figure21’sreallong-runreturnprofileforbalancedportfoliosmayseembetterthanexpected.However,Vanguardbelievesit’simportantforinvestorstoconsiderreal-returnexpectationswhenconstructingportfoliosbecausetoday’slowdividendandTreasuryyieldsare,inpart,associatedwithlowerexpectedinflationthanthoseof20or30yearsago.
Notes: Figure displays the backward-looking return components of the S&P 500 Index. Dividend yield is the average trailing dividend yield of the S&P 500 Index, taking an average of each monthly observation of 12-month trailing yield in each ten-year time period. Earnings growth is the average annualized growth of the ten-year smoothed real earnings for the S&P 500 Index constituents. Valuation adjustment return is the annualized percentage change of the cyclically adjusted price/earnings ratio, as de�ned in Shiller (2000).
Sources: Vanguard calculations, based on data from Robert Shiller’s website,aida.wss.yale.edu/~shiller/data.htm.
Com
pone
nts
of t
en-y
ear
real
U.S
. eq
uity
ret
urns
Figure 20. Valuation movement is the largest component of returns, but predicting this is extremely dif�cult
Average dividend yieldEarnings growthValuation adjustment return
–15
–10
–5
0
5
10
15%
2013200019871974196119481935
27
Principles of portfolio construction are intactContrarytosuggestionsthatthisdecadewarrantssomeradicallynewinvestmentstrategy,Figure21revealsthatthesimulatedrangesofexpectedreturnsareupward sloping.Simplyput,higherriskaccompanieshigher(expected)return.Moreaggressiveallocationshaveahigher—andwider—rangeofexpectedreturns,withgreaterdownsideriskiftheequityriskpremiumisnotrealizedoverthenextdecade.13Toputthisincontext,theriskpremiumoverbondsmaybelowerthanithasbeeninthepastfewyears,butitisstillpositive.Indeed,theexpectedrisk-returntrade-offsamongstocksandbondsshowwhytheprinciplesofportfolioconstructionremainunchanged,inour view,evenifexpectedreturnsarelower.
Theupward-slopingandwider-tailedpatternin Figure21reaffirmsthebeneficialrolethatbondsshouldbeexpectedtoplayinabroadlydiversifiedportfolio,despite their currently low yields and regardless of the future direction of interest rates. Althoughourscenariosgenerateslim,below-averagenominalreturnsforabroadtaxablebondindexforthenexttenyears—acentraltendencyof1.5%–3.0%annually,onaverage—bondsshouldbeexpectedtomoderatethevolatilityinequityportfoliosintheyearsahead.
13 Although the downside tails may appear somewhat similar across the portfolios, we note that these are ten-year distributions. The downside risk for a more equity-oriented portfolio increases substantially over a shorter horizon, as demonstrated in Figure 15 on page 21.
Figure 21. Projected ten-year real return outlook for balanced portfolios
VCMM-simulated distribution of expected average annualized in�ation-adjusted return of balanced global equity and global �xed income portfolios, estimated as of year-end 2013
Key
History, 1926−2013
95th percentile
5th percentile
25th−75thpercentile
History, 2000−2013
Notes: Figure displays the 5th/25th/75th/95th percentile range of VCMM-projected returns for balanced portfolios. Historical returns are computed using the indexes de�ned on page 4.
Davis,JosephH.,RogerAliaga-Díaz,CharlesJ.Thomas,andRaviG.Tolani,2013.The Outlook for Emerging Market Stocks in a Lower-Growth World. ValleyForge,Pa.:TheVanguardGroup.
Davis,JosephH.,2013a.Look Back Before Looking Ahead. Vanguardblogposting;available atvanguardblog.com.
Davis,JosephH.,2013b.Bond Risk—A Theory of Relativity.Vanguardblogposting;availableatvanguardblog.com.
Davis,JosephH.,andRogerAliaga-Díaz,2012.Vanguard’s Economic and Investment Outlook. ValleyForge,Pa.:TheVanguardGroup.
Davis,JosephH.,RogerAliaga-Díaz,andCharlesJ.Thomas,2012.Forecasting Stock Returns: What Signals Matter, and What Do They Say Now?ValleyForge,Pa.:TheVanguardGroup.
Davis,JosephH.,RogerAliaga-Díaz,CharlesJ.Thomas,andNathanZahm,2012.The Long and Short of TIPS.ValleyForge,Pa.:TheVanguardGroup.
Davis,JosephH.,RogerAliaga-Díaz,andAndrewJ.Patterson,2011.Asset Allocation in a Low-Yield and Volatile Environment.ValleyForge,Pa.:TheVanguardGroup.
Davis,JosephH.,RogerAliaga-Díaz,DonaldG.Bennyhoff,AndrewJ.Patterson,andYanZilbering,2010.Deficits, the Fed, and Rising Interest Rates: Implications and Considerations for Bond Investors. ValleyForge,Pa.:TheVanguardGroup.
Davis,JosephH.,RogerAliaga-Díaz,JulieannShanahan,andCharlesJ.Thomas,2009.Which Path Will the U.S. Economy Follow? Lessons From the 1990s Financial Crises of Japan and Sweden. ValleyForge,Pa.:TheVanguardGroup.
Gordon,RobertJ.,2012.Is U.S. Economic Growth Over? Faltering Innovation Confronts the Six Headwinds.WorkingPaper.Cambridge,Mass.:NationalBureauofEconomicResearch;available atnber.org/papers/w18315.
Gürkaynak,RefetS.,BrianSack,andJonathanH.Wright,2006.The U.S. Treasury Yield Curve: 1961 to the Present. Washington,D.C.:FederalReserveBoard,DivisionsofResearch&StatisticsandMonetaryAffairs,FinanceandEconomicsDiscussionSeries;availableatfederalreserve.gov.
KinniryJr.,FrancisM.,2013.Same As It Ever Was.Vanguardblogposting;availableatvanguardblog.com.
KinniryJr.,FrancisM.,andBrianJ.Scott,2013.Reducing Bonds? Proceed With Caution,ValleyForge,Pa.:TheVanguardGroup.
Philips,ChristopherB.,andCharlesJ.Thomas,2013.Fearful of Rising Interest Rates? Consider a More Global Bond Portfolio.ValleyForge,Pa.:TheVanguardGroup.
Philips,ChristopherB.,FrancisM.KinniryJr.,Brian J.Scott,MichaelA.DiJoseph,andDavidJ.Walker,2013.Risk of Loss: Should the Prospect of Rising Rates Push Investors From High-Quality Bonds? ValleyForge,Pa.:TheVanguardGroup.
Philips,ChristopherB.,JosephDavis,AndrewJ.Patterson,andCharlesJ.Thomas,2012.Global Fixed Income: Considerations for U.S. Investors,ValleyForge,Pa.:TheVanguardGroup.
Summers,LawrenceH.,2013.Economic Forum: Policy Responses to Crises,InternationalMonetaryFundvideo;availableatimf.org.
Warnock,FrancisE.andVeronicaCacdacWarnock,2009.InternationalCapitalFlowsandU.S.InterestRates.Journal of International Money and Finance 28:903–919.
30
Appendix: Vanguard Capital Markets Model
IMPORTANT: The projections or other information generated by the Vanguard Capital Markets Model regarding the likelihood of various investment outcomes are hypothetical in nature, do not reflect actual investment results, and are not guarantees of future results. VCMM results will vary with each use and over time.
Figure A-1. Projected ten-year nominal return outlook for balanced portfolios
VCMM-simulated distribution of expected average annualized return on balanced global equity and global �xed income portfolios, estimated as of year-end 2013
Notes: Figure displays the 5th/25th/75th/95th percentile range of VCMM-projected returns for balanced portfolios. Historical returns are computed using the indexes de�ned on page 4.
For more information about Vanguard funds, visit vanguard.com or call 800-662-2739 to obtain a prospectus. Investment objectives, risks, charges, expenses, and other important information about a fund are contained in the prospectus; read and consider it carefully before investing.


![Journal of Molecular Graphics and Modellinglsec.cc.ac.cn/~lubz/Publication/VCMM.pdf · VCMM contains a tool developed by our group, TMSmesh [21,22], for surface meshing on a molecular](https://static.documents.pub/doc/80x56/60622b0b1409d36b6b076cf7/journal-of-molecular-graphics-and-lubzpublicationvcmmpdf-vcmm-contains-a-tool.jpg)


