Variability of aerosol optical depth and their impact on cloud properties in Pakistan Khan Alam a,n , Rehana Khan a , Thomas Blaschke b , Azam Mukhtiar c a Institute of Physics and Electronics, University of Peshawar, Khyber Pakhtunkhwa, Pakistan b Department of Geography and Geology, University of Salzburg, Hellbrunnerstrasse 34, Salzburg 5020, Austria c Department of Chemistry, University of Education, Okara Campus, Lahore, Pakistan article info Article history: Received 8 August 2013 Accepted 25 November 2013 Available online 3 December 2013 Keywords: Aerosol Cloud Cloud fraction Liquid water path Pakistan abstract This study analyzes seasonal and temporal variations in aerosol optical depth (AOD), and the impact of these variations on the properties of clouds over five cities in Pakistan, using Moderate Resolution Imaging Spectroradiometer (MODIS) data, obtained from the Terra satellite during the period (2001–2011). The obtained results indicated seasonal variation in AOD, with a high value of 2.3, in summer and low values of 0.2, in winter for the costal part of the region. The relationship between AOD and other cloud parameters, namely water vapor (WV), cloud fraction (CF), cloud optical thickness (COT), cloud liquid water path (CLWP), cloud top temperature (CTT), and cloud top pressure (CTP) were analyzed. On a temporal scale, latitudinal variations of both WV and AOD produce high correlations ( 40.6) in some regions, and moderate correlations (0.4–0.6) in the other regions. An increasing trend in CF with AOD was found over urban regions in the period of observations. The CF values were higher for Lahore than the other selected regions during the whole period. During autumn and winter seasons the correlation was found to be positive between AOD and CLWP, while negative correlation was observed during the other seasons for all the selected regions. COT showed negative correlation with AOD at all locations except Karachi during spring and summer seasons. AOD showed a positive correlation with CTP and CTT for the spring season and a negative correlation was observed for summer for all investigated regions. Furthermore, in warm clouds AOD and CTP were negatively correlated for all regions except Peshawar, whereas, AOD and CTT were positively correlated for all regions except Karachi. In cold clouds the relationships between AOD and CTP, and AOD and CTT were negative, except Karachi. Thus meteorological parameters, geographical conditions, as well as warm and cold clouds are the causative factors for AOD and CTP, and AOD and CTT variations. & 2013 Elsevier Ltd. All rights reserved. 1. Introduction Interactions between aerosols and clouds are a subject of sub- stantial scientific research, due to the importance of clouds in controlling climate. Aerosols and clouds play a vital role in determin- ing the climatic conditions of the Earth's atmosphere system. Cloud interactions with aerosols are hypothesized to be critical to under- standing climate change, since clouds play such a pivotal role in controlling incoming and outgoing radiation (Houghton et al., 2001). Aerosols are known to impact the formation and life cycle of clouds. A wide range of studies have shown that anthropogenic aerosols can change clouds and their optical properties. (e.g. Alam et al., 2010; Ackerman et al., 2000; Andreae et al., 2004; Kaufman et al., 2005; Kim et al., 2003; Koren et al., 2004, 2005; Penner et al., 2004; Ramanathan et al., 2001; Rosenfeld, 2000; Rosenfeld et al., 2002; Schwartz et al., 2002). Aerosols in nature play a significant role in the climatic conditions by interacting the cloud development. They affect cloud development by absorption and scattering of solar radiation. Several processes contribute to aerosol induced forcing, both directly, through effects on cloud albedo, and indirectly, through effects on the lifetime of rain or water vapors. Increasing concen- trations of anthropogenic aerosol particles have an effect on the amount, as well as on the spatial and temporal distribution of clouds and precipitation, affecting the hydrological cycle (Forest et al., 2002). However, in spite of the progress, aerosols are the dominant uncertainty in radiative forcing. The indirect effect of aerosols on water clouds, whereby aerosol particles change the cloud's optical properties, is caused by aerosol-induced changes of the size and number of cloud droplets (Lohmann., 2002). This affects the lifetime of the water clouds and their shortwave radiative properties as well. Interactions between aerosols and clouds have become the subject of scientific research because of the importance of clouds in controlling climate (Mahowald and Kiehl, 2003). The aerosol–cloud interactions play a significant role in global climate, however, there are large uncertainties in the Contents lists available at ScienceDirect journal homepage: www.elsevier.com/locate/jastp Journal of Atmospheric and Solar-Terrestrial Physics 1364-6826/$ - see front matter & 2013 Elsevier Ltd. All rights reserved. http://dx.doi.org/10.1016/j.jastp.2013.11.012 n Corresponding author. Tel.: þ92 300 2514177. E-mail addresses: [email protected], [email protected] (K. Alam). Journal of Atmospheric and Solar-Terrestrial Physics 107 (2014) 104–112
Transcript
Variability of aerosol optical depth and their impacton cloud properties in Pakistan
Khan Alam a,n, Rehana Khan a, Thomas Blaschke b, Azam Mukhtiar c
a Institute of Physics and Electronics, University of Peshawar, Khyber Pakhtunkhwa, Pakistanb Department of Geography and Geology, University of Salzburg, Hellbrunnerstrasse 34, Salzburg 5020, Austriac Department of Chemistry, University of Education, Okara Campus, Lahore, Pakistan
a r t i c l e i n f o
Article history:Received 8 August 2013Accepted 25 November 2013Available online 3 December 2013
Keywords:AerosolCloudCloud fractionLiquid water pathPakistan
a b s t r a c t
This study analyzes seasonal and temporal variations in aerosol optical depth (AOD), and the impact of thesevariations on the properties of clouds over five cities in Pakistan, using Moderate Resolution ImagingSpectroradiometer (MODIS) data, obtained from the Terra satellite during the period (2001–2011). Theobtained results indicated seasonal variation in AOD, with a high value of 2.3, in summer and low values of 0.2,in winter for the costal part of the region. The relationship between AOD and other cloud parameters, namelywater vapor (WV), cloud fraction (CF), cloud optical thickness (COT), cloud liquid water path (CLWP), cloud toptemperature (CTT), and cloud top pressure (CTP) were analyzed. On a temporal scale, latitudinal variations ofboth WV and AOD produce high correlations (40.6) in some regions, and moderate correlations (0.4–0.6) inthe other regions. An increasing trend in CF with AOD was found over urban regions in the period ofobservations. The CF values were higher for Lahore than the other selected regions during the whole period.During autumn and winter seasons the correlation was found to be positive between AOD and CLWP, whilenegative correlation was observed during the other seasons for all the selected regions. COT showed negativecorrelation with AOD at all locations except Karachi during spring and summer seasons.
AOD showed a positive correlation with CTP and CTT for the spring season and a negative correlation wasobserved for summer for all investigated regions. Furthermore, in warm clouds AOD and CTP were negativelycorrelated for all regions except Peshawar, whereas, AOD and CTT were positively correlated for all regionsexcept Karachi. In cold clouds the relationships between AOD and CTP, and AOD and CTT were negative, exceptKarachi. Thus meteorological parameters, geographical conditions, as well as warm and cold clouds are thecausative factors for AOD and CTP, and AOD and CTT variations.
& 2013 Elsevier Ltd. All rights reserved.
1. Introduction
Interactions between aerosols and clouds are a subject of sub-stantial scientific research, due to the importance of clouds incontrolling climate. Aerosols and clouds play a vital role in determin-ing the climatic conditions of the Earth's atmosphere system. Cloudinteractions with aerosols are hypothesized to be critical to under-standing climate change, since clouds play such a pivotal role incontrolling incoming and outgoing radiation (Houghton et al., 2001).Aerosols are known to impact the formation and life cycle of clouds. Awide range of studies have shown that anthropogenic aerosols canchange clouds and their optical properties. (e.g. Alam et al., 2010;Ackerman et al., 2000; Andreae et al., 2004; Kaufman et al., 2005; Kimet al., 2003; Koren et al., 2004, 2005; Penner et al., 2004; Ramanathanet al., 2001; Rosenfeld, 2000; Rosenfeld et al., 2002; Schwartz et al.,2002).
Aerosols in nature play a significant role in the climaticconditions by interacting the cloud development. They affect clouddevelopment by absorption and scattering of solar radiation.Several processes contribute to aerosol induced forcing, bothdirectly, through effects on cloud albedo, and indirectly, througheffects on the lifetime of rain or water vapors. Increasing concen-trations of anthropogenic aerosol particles have an effect on theamount, as well as on the spatial and temporal distribution ofclouds and precipitation, affecting the hydrological cycle (Forestet al., 2002). However, in spite of the progress, aerosols are thedominant uncertainty in radiative forcing. The indirect effect ofaerosols on water clouds, whereby aerosol particles change thecloud's optical properties, is caused by aerosol-induced changes ofthe size and number of cloud droplets (Lohmann., 2002). Thisaffects the lifetime of the water clouds and their shortwaveradiative properties as well. Interactions between aerosols andclouds have become the subject of scientific research because ofthe importance of clouds in controlling climate (Mahowald andKiehl, 2003). The aerosol–cloud interactions play a significant rolein global climate, however, there are large uncertainties in the
Contents lists available at ScienceDirect
journal homepage: www.elsevier.com/locate/jastp
Journal of Atmospheric and Solar-Terrestrial Physics
1364-6826/$ - see front matter & 2013 Elsevier Ltd. All rights reserved.http://dx.doi.org/10.1016/j.jastp.2013.11.012
magnitude of the forcing (Charlson et al., 1992). Therefore, aero-sols, clouds, and their interaction with climate is still the mostindistinct area of climate change.
Myhre et al. (2007) found that several possibilities exist foraerosols and clouds to be interlinked through processes, ratherthan through physical aerosol–cloud interactions. One such possi-bility is the meteorological condition where low altitude cloudsinfluence the AOD. Due to the large spatial and temporal extent ofaerosols (desert dust, pollution, etc.) in the atmosphere, theinteractions between aerosols and clouds can have substantialclimatic impacts (Alam et al., 2010). To assess the regional andglobal climate change caused by aerosols in South Asia, detailedinformation is required on the atmospheric concentrations ofaerosol in the region (Dutkiewicz et al., 2009).
A number of studies have been conducted to address the spatialand temporal variability of aerosols and clouds (Kumar, 2013;Balakrishnaiah et al., 2012; Alam et al., 2010). Balakrishnaiah et al.(2012) have investigated the spatial, temporal, and seasonalvariation in aerosol properties and their relationship to variouscloud parameters over major cities of southern India and noticed ahigh mean AOD in almost all regions in the summer season,whereas at Pune, Visakhapatnam and Hyderabad, the sameobservation was noticed during the monsoon season. Alam et al.(2010) recently analyzed the effect of aerosols on clouds. Theyshowed that both smoke and pollution enhance the cloud forma-tion over the regions Karachi and Lahore. High AOD values werefound during the summer (June–August) season, due to dustactivities in the southern parts of Pakistan. Kumar (2013) analyzedthat AOD and cloud fraction correlation increases for those regionswhich have more particulate particles due to dust, biomass,industrial and domestic activities. Yi et al. (2012) have recentlyreported the relationship between aerosol and cloud precipitation.They found an increasing trend in cloud fraction with the increaseof aerosol optical depth (AOD) over ocean regions under observa-tion, while the reverse result was noticed in the model simulation.Kaufman et al. (2005a) and Koren et al.(2005) have analyzed theregional effect of aerosol on clouds. They reported that over theAtlantic Ocean from June to August, dust, smoke, or pollution eachenhances the cloud formation and the cloud top height. In thepresent study, the investigation is carried out for warm and coldclouds' properties, as there is a lack of knowledge about theaerosol impacts on the properties of warm and cold clouds in thisregion. Both cold and warm clouds play important roles in thechemical quality of precipitation and eventually in the composi-tion of the atmosphere. The major effect these clouds have onclimate change is that they both cool and heat the planet (Allan,2011), even as their own properties are determined by the coolingand heating of the atmosphere. Cold clouds have a net coolingeffect, because they have a high albedo, and emit nearly as muchinfrared radiation to space as the surface would under clear skies(Nowicki and Merchant, 2004). Warm clouds almost form in thelower atmosphere by condensation onto aerosol particles com-posed of diverse compounds.
The present study investigates the spatio-temopral variationsof aerosol and cloud properties and the relationship between AODand cloud parameters. In this study we have used MODIS data toanalyze the aerosol/cloud optical properties in terms of aerosoloptical depth (AOD), water vapor (WV), cloud fraction (CF), cloudoptical thickness (COT), cloud liquid water path (CLWP), cloud toptemperature (CTT), and cloud top pressure (CTP).
2. Site description
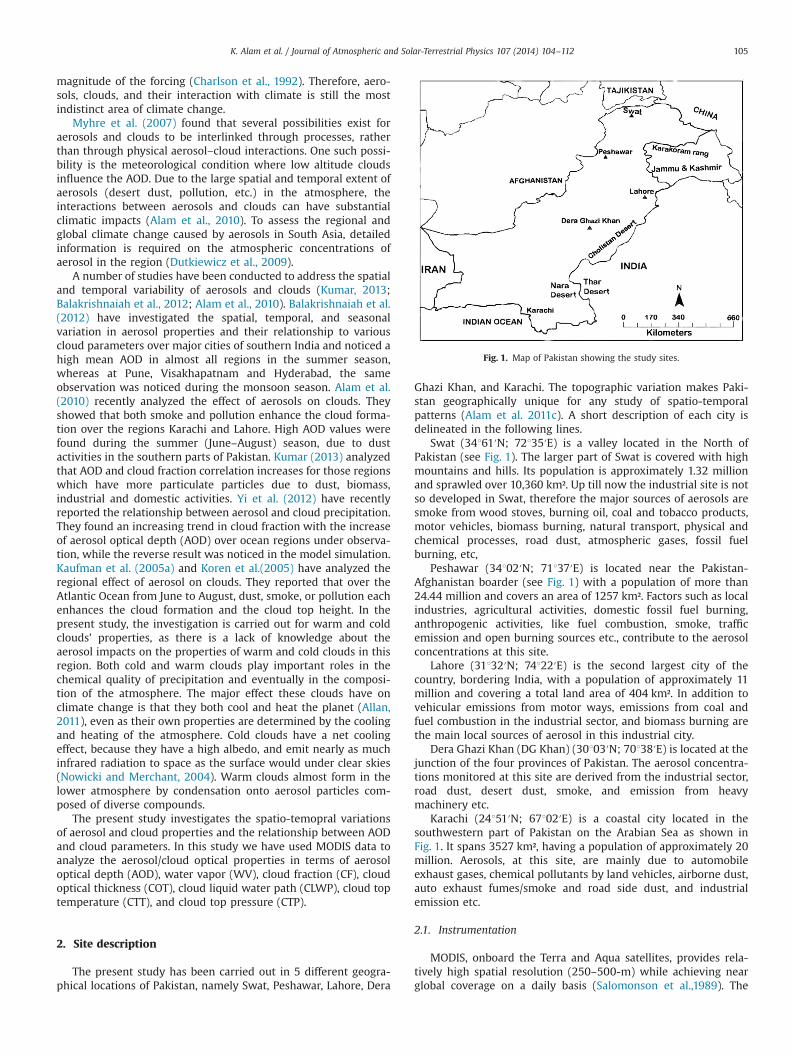
The present study has been carried out in 5 different geogra-phical locations of Pakistan, namely Swat, Peshawar, Lahore, Dera
Ghazi Khan, and Karachi. The topographic variation makes Paki-stan geographically unique for any study of spatio-temporalpatterns (Alam et al. 2011c). A short description of each city isdelineated in the following lines.
Swat (34161′N; 72135′E) is a valley located in the North ofPakistan (see Fig. 1). The larger part of Swat is covered with highmountains and hills. Its population is approximately 1.32 millionand sprawled over 10,360 km². Up till now the industrial site is notso developed in Swat, therefore the major sources of aerosols aresmoke from wood stoves, burning oil, coal and tobacco products,motor vehicles, biomass burning, natural transport, physical andchemical processes, road dust, atmospheric gases, fossil fuelburning, etc,
Peshawar (34102′N; 71137′E) is located near the Pakistan-Afghanistan boarder (see Fig. 1) with a population of more than24.44 million and covers an area of 1257 km². Factors such as localindustries, agricultural activities, domestic fossil fuel burning,anthropogenic activities, like fuel combustion, smoke, trafficemission and open burning sources etc., contribute to the aerosolconcentrations at this site.
Lahore (31132′N; 74122′E) is the second largest city of thecountry, bordering India, with a population of approximately 11million and covering a total land area of 404 km². In addition tovehicular emissions from motor ways, emissions from coal andfuel combustion in the industrial sector, and biomass burning arethe main local sources of aerosol in this industrial city.
Dera Ghazi Khan (DG Khan) (30103′N; 70138′E) is located at thejunction of the four provinces of Pakistan. The aerosol concentra-tions monitored at this site are derived from the industrial sector,road dust, desert dust, smoke, and emission from heavymachinery etc.
Karachi (24151′N; 67102′E) is a coastal city located in thesouthwestern part of Pakistan on the Arabian Sea as shown inFig. 1. It spans 3527 km², having a population of approximately 20million. Aerosols, at this site, are mainly due to automobileexhaust gases, chemical pollutants by land vehicles, airborne dust,auto exhaust fumes/smoke and road side dust, and industrialemission etc.
2.1. Instrumentation
MODIS, onboard the Terra and Aqua satellites, provides rela-tively high spatial resolution (250–500-m) while achieving nearglobal coverage on a daily basis (Salomonson et al.,1989). The
Fig. 1. Map of Pakistan showing the study sites.
K. Alam et al. / Journal of Atmospheric and Solar-Terrestrial Physics 107 (2014) 104–112 105
daytime Aqua overpass (13:30 LT) is chosen over the Terra over-pass (10:30 LT) since clouds are more likely to be developed in theafternoon than the morning. The MODIS instrument provides highradiometric sensitivity (12 bit) in 36 spectral bands, ranging inwavelength from 0.41 mm to 14.4 mm. Out of 36 bands, two areimaged at a nominal resolution of 250 m at nadir, with five bandsat 500 m, and the remaining 29 bands at 1 km. A 7551 scanningpattern at the EOS (Earth Observation Sensor) orbit of 705 kmachieves a 2, 330-km swath and provides global coverage every 1to 2 days. The spatial resolution of the MODIS instrument varieswith spectral band, and ranges from 250 m to 1 km at nadir. TheseMODIS instruments offer an unprecedented look at terrestrial,atmospheric, and ocean phenomenology for a wide and diversecommunity of users throughout the world. Furthermore, theyallow scientists the opportunity to study many of the Earth'sterrestrial and oceanic characteristics such as ocean pollution,changes in landscape, amount of bound carbon, and others witha single instrument. MODIS data are useful for collecting variousstatistics on aerosol concentrations and the impacts that aerosolshave on clouds formation (Alam et al., 2011c). For water vapor, theretrieval for the near-infrared region is adopted. MODIS uses aninfrared band to determine the physical properties of clouds inrelation to cloud top pressure and temperature. Visible and near-infrared bands are used to determine optical and microphysicalcloud properties (Jin and Shepherd., 2008; Alam et al., 2010). Inthis study we have used a MODIS Terra Level-2 monthly AOD andcloud parameter data (MOD04_L2. in HDF format) at a spatialresolution of 10�10 Km and 5�5 Km, respectively. More detailedinformation on algorithms for the retrieval of aerosol and differentcloud parameters is available at http://modis-atmos.gsfc.nasa.gov.The present study analyzes the seasonal variability of AOD, and theaerosol impact on different properties of clouds using MODIS TerraAOD and cloud parameter data from 2001 to 2011.
3. Results and discussion
3.1. Seasonal variations in AOD
Seasonal variations in AOD using MODIS data over a period ofeleven years are shown in Fig. 2. The annual mean AOD at 550 nmwas calculated for the period 2001–2011. The results from Fig. 2show that aerosols have a marked impact on five cities in Pakistan,Swat, Peshawar, Lahore, DG Khan, and Karachi. These regionscomprise major urban centers of Pakistan, with generally densepopulations and variable distribution patterns of residential,industrial and commercial land use areas. These cities wereincluded in this research because of their industrial sector,anthropogenic activities, and due to the extreme variations intheir geo-strategic locations, which results in different weatherpatterns that, in turn, affect the aerosol load in each area(Alam et al., 2011c). High annual mean AOD values were observedin almost all regions during the summer season, whereas in Lahoreand Karachi, high AOD values were also noticed during the winterseason. Fig. 2 presents the AOD mean values, revealing a seasonalpattern with a higher AOD level during the spring and summermonths, and comparatively lower AOD levels during the autumnand winter months. Data from Karachi, Lahore and DG Khanreveals very high mean AOD values over the whole period(2001–2011) as compared to the other cities investigated, of whichthe maximum values were found in summer (2.3, 1.8 and 1.5,respectively), whereas the minimum values (0.55, 0.66 and 0.61,respectively) were recorded during the winter season. This abruptvariation can be attributed to the fact that these are urban,industrial, and coastal areas. DG khan is an urban region whichcarries large AOD values during the summer and winter seasons
(see Fig. 2) due to its close proximity to the Cholistan Desert,which leads to an increased persistence of dust aerosols, alongwith local vehicular emission. Alam et al. (2011a) found that AODincreases and higher AOD levels persist for longer periods of timeover industrial and densely populated cities in Pakistan, as a resultof anthropogenic activities (like urbanization, land use changeetc.),. Ranjan et al. (2007) and Alam et al. (2010) concluded thatwater vapor (precipitate) and AOD are directly related to eachother, and hence a higher concentration of water vapor in summerleads to a higher AOD. In addition, higher air temperatures tend tohold more vapors that feed aerosol to grow (Masmoudi et al.,2003), which might be the other reason causing the higher AODlevels in the summer time.
Another reason for a higher level of AOD values during summeris the dust storms occurring during that season. Similar increasesin AOD during summer have previously been reported for theregion of Pakistan situated between 22–251N and 60–751E (Alamet al., 2010). In the present study, even the lowest AODs were veryhigh (Z0.3) at all the investigated locations, even during the yearsshowing insignificant deviation. High AOD values (1.5 and 0.6,respectively) were observed over Peshawar and Swat duringsummer, while low AOD values (0.35 and 0.34, respectively) werenoticed during the winter (Fig. 2). There was a large variation inAOD values between low values in winter and high values insummer, whereas, the pattern of AOD values in spring and autumnwere quite similar to each other. The results indicate that anaerosol concentration increases with increased anthropogenicactivities. The AOD values for Karachi, Lahore and DG Khan werehigher than those of Peshawar and Swat, due to the enhancementin urbanization and industrialization, dust storms, and salt parti-cles blowing from the sea (Alam et al., 2012).
3.2. Relationship between AOD and cloud parameters
The MODIS data consists of an enormous amount of data whichis valuable for understanding how aerosols influence clouds(Myhre et al., 2007; Alam et al., 2010). This section deals withthe temporal and spatial correlation between AOD and cloudparameters for the five selected cities across Pakistan for theperiod 2001–2011. We used AOD as a substitute for aerosolconcentration and calculated the correlation coefficient for eachset of parameters on a seasonal, as well as on an annual basis,throughout the observation period (2001–2011). The relationshipbetween AOD and WV, and AOD and CF were examined using timeseries plots. Furthermore, COT, CLWP, CTP and CTT relationshipswith AOD were also investigated. The discussion of each ofthese relationships is presented individually in the followingsub-sections.
3.2.1. Relationship between AOD and water vaporThe MODIS retrieval data provides separate columns of WV
data for clear skies, as well as data above the clouds. In the presentstudy MODIS data was used for WV in the clear sky for the period2001–2011. The correlations between AOD and WV (Table 1)reveal that AOD and WV have a strong positive correlation(40.6) in some regions and moderate correlation (0.4–0.6) atother investigated regions during the spring, summer and autumnseasons. There was no significant relationship between AOD andWV during the winter season, since the dust aerosols were lesscommon or even absent during winter, consequently, less WV wasobserved (Alam et al., 2010, 2011a). Low AOD values in winter, aglobal feature, is attributed to the removal of aerosols due tomonsoon rains and decreased aerosol input due to a colder groundsurface. Additionally, less hygroscopic growth of aerosols dueto low WV content may lead to relatively lower AOD values
K. Alam et al. / Journal of Atmospheric and Solar-Terrestrial Physics 107 (2014) 104–112106
(Ranjan et al., 2007). Monthly variations of mean AOD and WVdata for the period 2001–2011 are shown in Fig. 3(a–e). Thepresent analysis showed that the coastal region widely experi-enced an elevated WV level (ranging from 1.0 to 5.89 cm) asshown in Fig. 3e, probably due to the fact that all the areas wereeither urban, industrial, or coastal. Alam et al. (2011c) have foundthat, as a result of anthropogenic activities (like urbanization, landuse change etc.), AOD is increased and relatively higher AOD levelspersisted for longer periods of time over industrial and denselypopulated cities in Pakistan. High mean AOD values i.e. 2.3 and1.6 were observed over Karachi and Lahore, with correspondingWV values of 5.89 and 6.5, respectively (see Fig. 3(c and e)). Ranjanet al. (2007) have attributed the high AOD values observed duringsummer to an increase in the aerosol input, due to increasedsurface heating and resultant vertical mixing, dry surface condi-tions, and windblown dust. Fig. 3(a–e) shows a simultaneousincrease and decrease in AOD and WV, a result in accordancewith the findings of (Ranjan et al., 2007; EL-Askary and Kafatos,2008; Alam et al., 2010; Balakrishnaiah et al., 2012). The relationbetween Aerosol and WV has an implication for the radiativeforcing directly and indirectly (Tegen et al., 1996; Houghton et al.,2001; Hsu et al., 2003). EL-Askary and Kafatos, 2008 have foundthat aerosols cause a reduction in cloud droplet size and hencelead to suppression in precipitation. The direct effect results inradiation scattering due to an increase in aerosol particle size,
accompanied by the uptake of WV. The black cloud episode iscomprised mainly of anthropogenic pollutants acting as cloudcondensation nuclei, leading to the formation of WV cover. Thehigh AOD values over Lahore may be due to the irregularcontinuous emission, coupled with the stable meteorologicalconditions by weak wind currents (EL-Askary and Kafatos, 2008)as well as almost neutral stratification, which may result in highvalues of WV. Xin et al. (2007) found that due to high AOD valuesassociated with slowly moving air masses are generally accom-panied by higher perceptible WV. The present analysis demon-strates that high WV will be regionally observed over locationswhere high AOD will be also observed. The AOD value varied forDG Khan from (1.0–5.5) (see Fig. 3d) with a mean AOD of 1.8, dueto the fact that during the transient seasons, mainly spring, thetransported desert dust is a major contributor to AOD.
3.2.2. Relationship between AOD and cloud fractionThe relationship between AOD and CF has been plotted for
various selected cities of Pakistan over the time period 2001–2011(see Fig. 4(a–e)). Correlation of AOD with CF has also beencalculated for the selected time period of eleven years, bothseasonally (see Table 1), and annually (not shown here). Thecorrelation between AOD and CF was found to be comparativelylower for urban regions and higher at coastal and desert stations.
Fig. 2. Seasonal variations in AOD during (2000–2011) over different cities of Pakistan.
K. Alam et al. / Journal of Atmospheric and Solar-Terrestrial Physics 107 (2014) 104–112 107
Time series plots of AOD and CF (Fig. 4(a–e)) show that CFincreased with AOD from April to mid-September at all locationsthroughout the whole period (2001–2011), but in November themean AOD values go on decreasing to reach the lowest value inFebruary to mid-March, and thereafter an increasing trend wasobserved. Conversely, the CF values started increasing fromNovember and attained the highest value in March. From Aprilto September, there was an increasing trend in AOD as well as inCF, thus AOD and CF were positively correlated during this period.In contrast, from November to mid-March, there was a decreasingtrend in AOD as well as in CF. Therefore, during this period, AODand CF were negatively correlated. The negative trend betweenAOD and CF was occurred only when the AOD value had fallenbelow 0.4, an outcome in good agreement with the findings ofAlam et al. (2010) and Hoeve et al. (2011). In winter (December,January and February), relatively lower AOD values were observeddue to less precipitation because of the dry climate of the region,resulting in lower AOD values. Walcek, (1994) have reported agood correlation between cloud cover, relative humidity (RH), andvertical velocity. The cloud cover decreases exponentially ashumidity falls below 100%. The cloud cover also exhibits a weaknegative correlation with the potential temperature lapse rate, andvertical shear of the horizontal wind in the middle atmosphere(Walcek, 1994).
The annual correlation between AOD and CF was greater than 0.6,0.42 and 0.37 in Karachi Lahore and DG Khan, respectively. Noobvious correlations were found between AOD and CF for Peshawarand Swat regions. These values were significantly different from thevalues recorded seasonally. For example, the correlation coefficientbetween AOD and CF was less than 0.4 for Lahore, and DG Khan,whereas for Karachi it was greater than 0.5 during summer (seeTable 1). Among the five locations analyzed in this study, Swatrecorded the lowest mean AOD values in the range of 0.1–0.6, becausethis place is far from any industrial or urban centers, leading tominimal local production of aerosols (see Fig. 4a). Albrecht et al.(1989) and Kaufman and Fraser (1997) found that in environmentshighly laden with water vapor, exhibiting low cloud condensationnuclei, additional aerosols may increase cloud fraction to a greaterextent than in environments laden with less water vapor, due to theimpact of a stronger updraft on the lifetime effect. It can be concludedthat both large-scale meteorological factors, traced by seasonallyvarying WV and aerosol loading, may contribute to changes in warmCF in the investigated regions. It is also important to mention themarked increase in the correlation between AOD and CF. Alam et al.(2010) found that the correlation between AOD and CF was high overthe ocean and slightly lower over the north, but always positivetowards the border with Afghanistan. This increase may be due to thecomplexity of the domain, the type of land surface (albedo), thechoice (classification) of aerosol mixtures applied in the MODISretrieval for that particular area, the impact of meteorology on aerosoltransport, and the aerosol chemistry.
3.2.3. Relationship between AOD and cloud optical thicknessCOT showed a negative co-relation with AOD at all locations
except Karachi during the spring and summer seasons (Table 1), aswell as during the whole period of observation (2001–2011). Thehighest negative correlation (4�0.4) was found for Lahore,whereas the highest positive correlation (40.2) was found forKarachi during summer. This may be attributed to the fact thatKarachi is located in the vicinity of the Arabian Sea and issubjected to a component of sea and land breezes, as well aswet deposition, which contribute to a speedy clean-up of theatmosphere. Furthermore, Karachi being a coastal region experi-ences a high value of moisture as well, which ultimately results inan increased COT, as it depends highly on the moisture density andTa
ble
1Se
ason
alco
rrelationbe
twee
nAOD
vs.C
loudparam
eters.
Reg
ion
AOD
vs.
CF
CTP
CTT
WV
COT
CLW
P
WSP
SUAU
WSP
SUAU
WSP
SUAU
WSP
SUAU
WSP
SUAU
WSP
SUAU
Swat
0.2
�0.02
0.3
�0.1
�0.1
0.03
0.12
0.01
�0.2
0.04
0.24
0.36
�0.06
0.25
0.34
0.52
�0.12
�0.35
�0.11
�0.01
�0.2
�0.3
0.01
0.03
Pesh
awar
0.08
�0.2
0.61
�0.1
0.01
0.17
�0.09
0.23
�0.09
0.25
�0.1
0.59
0.03
0.35
0.6
0.66
0.12
�0.46
�0.02
�0.01
0.07
�0.5
0.06
0.05
Lahore
0.23
0.19
0.39
0.03
0.4
0.67
�0.15
0.29
0.46
0.75
�0.15
0.14
0.07
0.69
0.3
�0.23
0.27
�0.48
�0.09
�0.21
0.11
�0.5
�0.22
�0.25
DG
Khan
�0.39
�0.37
0.31
0.31
0.48
0.23
0.12
�0.3
0.44
0.52
0.24
�0.08
�0.09
0.55
0.34
0.32
�0.19
�0.29
�0.16
0.19
�0.2
�0.4
�0.17
0.15
Karachi
0.15
0.55
0.21
0.57
�0.2
0.03
�0.06
�0.5
�0.2
0.15
0.01
�0.32
�0.06
0.53
�0.2
0.58
0.11
0.22
0.08
0.06
0.13
�0.2
�0.03
0.02
W¼W
inter,SP
¼Sp
ring,
SU¼Su
mmer,A
U¼Autumn.
K. Alam et al. / Journal of Atmospheric and Solar-Terrestrial Physics 107 (2014) 104–112108
vertical depth of the cloud; subsequently, a positive correlationbetween the two parameters has been found. One of the reasonsfor the observed decrease in COT was the presence of absorbingaerosol, which causes cloud droplets to evaporate making cloudstoo thin (decreased COT), which is a legitimate physical process.On the other hand, the dark aerosol in and above the cloud mayalso decrease the cloud reflectance observed by the satellite,which the satellite retrieval interprets as a decrease in COT. It isconcluded that the large decreasing trend in COT with AOD maybe due to the radiative effect and retrieval artifacts as well. Thepresent analysis showed a strong negative correlation betweenAOD and COT for Peshawar and Lahore in spring (see Table 1).Furthermore, COT is strongly dependent on cloud moisture sinceas the density of moisture increases, the value of COT increases orvice versa. One of the reasons for high COT is the presence ofhygroscopic aerosol in the region. Alam et al. (2010, 2011b) found
that hygroscopic aerosols increased the AOD over the southerncoastal areas of Pakistan during the humid summer season, henceresulting in a high COT value in this region not only in summerbut in spring and autumn as well, discussed in section 3.1.1.Several studies, for example, Hoeve et al. ( 2011) and Platnicket al. ( 2003) have reported that, apart from some regions of lowAOD, COT was decreased in most of the cities with an increasingvalue of AOD. This might have resulted from the inhabitation ofclouds development by absorbing aerosols (radiative effect/semi-direct effect). Hoeve et al. (2011) found that this variation may bedue to a possible retrieval artifact, in which the measuredreflectance in the visible is less than expected from a cloud top,either from the darkening of clouds through the addition ofcarbonaceous biomass burning aerosols within or above theclouds, or sub pixel dark surface contamination in the measuredcloud reflectance.
Fig. 3. (a–e) Spatial and temporal variation of AOD and Water Vapor during (2001–2011) in various cities of Pakistan. (a) SWAT. (b) PESHAWAR, (c) LAHORE, (d) D G KHANand (e) KARACHI.
K. Alam et al. / Journal of Atmospheric and Solar-Terrestrial Physics 107 (2014) 104–112 109
3.2.4. Relationship between AOD and cloud top pressureThe correlation coefficients between AOD and CTP for various
cities in Pakistan over the period 2001–2011 are shown in Table 1.There was a positive correlation between AOD and CTP for thePeshawar region during the period 2001–2011, whereas the data forKarachi showed a negative correlation for the same parameters.Furthermore, positive correlation was observed between AOD andCTP for the entire region in the spring season. Lahore appeared with astrong positive correlation (correlation coefficient¼0.67) in spring.Several studies, for example, Myhre et al. (2007), Kaufman et al.(2005) and Alam et al. (2010) have reported that except for someregions of low AOD, CTP decreased in most of the cities (higher cloudaltitude) as AOD increased. This might have resulted from thesuppression of the precipitation by increasing cloud lifetime and thus
also affecting the cloud albedo and changing the cloud top pressure.Alam et al. (2010) investigated that at lower latitudes, there wasa significant decrease in CTP in relation to AOD (i.e. a negativecorrelation), while at mid-latitudes this decrease was only moderate.Our analysis indicated a positive correlation for AOD with CTP andCTT in the northern regions of Pakistan and a negative correlationin the southern regions, which is in close agreement with thevalues reported by Alam et al. (2010) for the Pakistani regions. Thisco-variation of AOD with CTP and CTT may be attributed to large-scale meteorological variations.
The vertical wind velocity is the most important meteorologicalparameter influencing the cloud properties (Koren et al., 2005;Tripathi et al., 2007). Koren et al. (2005) reported that thecorrelation between vertical winds at 500 mb to the CTP and CF
Fig. 4. (a–e) Spatial and temporal variation of AOD and Cloud Fraction during (2001–2011) in various cities of Pakistan. (a) SWAT. (b) PESHAWAR, (c) LAHORE, (d) D G KHANand (e) KARACHI.
K. Alam et al. / Journal of Atmospheric and Solar-Terrestrial Physics 107 (2014) 104–112110
is larger than 0.90 for all the investigated regions. On the otherhand, the correlation between the vertical winds and AOD is0.6 for some regions and negative �0.7 for other regions,suggesting different associations between meteorology andaerosol in these regions. Tripathi et al. (2007) analyzed the relation-ship between vertical winds and CTP in winter, pre-monsoon,monsoon, and post-monsoon seasons and the correspondingcorrelations coefficients are 0.26, 0.41, 0.63, and 0.6, respectively.The analysis suggests that during winter the relationship is lessinfluenced by meteorology due to reduced updraft, whereas, duringthe monsoon season the aerosol effect is facilitated by favorablemeteorological condition, due to strong updraft.
3.2.5. Relationship between AOD and cloud top temperatureThe correlation between AOD and CTT for the selected sites
during the studied period (2001–2011) is shown in Table 1. Thepresent study shows a positive correlation between AOD and CTTfor all regions, which is in agreement with the current under-standing of aerosol–cloud interactions. However, the highestcorrelation coefficients between AOD and CTT were found to be0.71 for Peshawar and 0.55 for Swat region, a result in accordancewith the values reported by Alam et al. (2010). Furthermore, anoverall negative correlation between AOD and CTT was observedin the winter season, except for Lahore and DG Khan. AOD and CTTis positively correlated both in winter and spring seasons overLahore and DG Khan, with a strong positive correlation overLahore (40.6) and moderate correlation over DG Khan (correla-tion coefficient�0.5). On the other hand, a negative correlationwas noticed between AOD and CTT for Karachi, indicating aconsistent negative correlation at lower latitudes. One of thereasons for this observation may be the fine mode aerosols, whichconstitute the majority of the haze during autumn and are foundto be significantly coupled within the water column, subsequentlyresulting in a substantial decrease in CTT. In the higher latituderegions, e.g. northern areas, a positive correlation between AODand CTT was observed. The observed relationship between AODand CF, the co-variation of AOD with CTP, CTT and WV may beattributed to the large-scale meteorological variation.
Interesting variations were observed in AOD, CTP and CTTwhen the clouds were separated into two types of clouds on thebasis of CTT, i.e. cold clouds (when CTTo273 K) and warm clouds(when CTT4273 K). In the warm clouds, AOD and CTP werenegatively correlated in all regions except Peshawar, whereasAOD and CTT were positively correlated in all regions exceptKarachi (Table 2). On the other hand, AOD and CTP, and AOD andCTT were negatively correlated for the cold clouds except forKarachi. Thus meteorological parameters, geographical conditions,as well as warm and cold clouds are the causative factors for AODand CTP, and AOD and CTT variations.
3.2.6. Relationship between AOD and cloud liquid water pathThe present observations show a negative correlation between
AOD and CLWP in all the selected regions during the period2001–2011. Table 1 shows a negative correlation between AOD andCLWP for the entire region during the spring season. The correlationcoefficients were �0.47 and �0.5 for Peshawar and Lahore respec-tively. During winter, there was a low positive correlation betweenAOD and CLWP for Lahore and Karachi. Over all, there was amoderate negative relationship between AOD and CLWP for theregions of Swat, Peshawar and DG Khan, and a low positive relation-ship for the Lahore and Karachi regions during the observationperiod (2001–2011), however, this can not be interpreted as an effectof aerosol–cloud interaction alone, as meteorological conditions alsoplay an important role. Chmura (2004) reported a strong negativecorrelation between AOD and CLWP for polluted clouds, whichcontradicted the indirect aerosol effect. Storelvmo et al. (2006)noticed that water soluble aerosols grow due to humidity swelling,and this growth is an increasing function of relative humidity. Asaerosols grow due to water uptake, they become optically thicker.Relative humidity is assumed to be particularly high in the vicinity ofclouds. Humid areas typically correspond to areas with high cloudwater content. This mechanism would lead to a positive correlationbetween AOD and CLWP and between AOD and COT as well, andthus depends strongly on the height and thickness of the cloud.
4. Conclusion
The present study analyzes the variation of aerosols and cloudsusing MODIS data, in order to develop an understanding of theimpact of aerosols on cloud properties over various cities ofPakistan. Cloud parameters were selected here to represent MODISinformation partly because of their critical role to atmosphereenergy and water budgets, and partly because such informationhas rarely been studied in an integral fashion for atmosphereconditions over this region. It was observed that the WV and AODwere strongly correlated at almost all of the investigated locations.CF was found to increase with AOD in those regions dominated bybiomass and dust aerosols. The correlation between AOD and CFwas found to be comparatively lower at urban regions and higherat the coastal and desert stations. We analyzed that negativecorrelation between AOD and CF was found only when the AODfell below 0.4. COT and AOD showed negative correlation at alllocations except Karachi. Negative correlation was observedbetween AOD and CLWP in Swat, Peshawar and DG Khan, whereaspositive correlation was observed for Lahore and Karachi. CTP andAOD showed a negative correlation at higher latitudes, except in afew cities. CTT showed a positive correlation with AOD for desertand northern regions of Pakistan, but a negative correlation for thesouthern region of the country. AOD and CTT are positivelycorrelated for warm clouds in almost all the regions exceptKarachi, whereas AOD and CTT are negatively correlated for coldclouds in almost all the regions except Karachi.
Acknowledgments
We are grateful to the MODIS (http://modis.gsfc.nasa.gov) teamat NASA for the provision of satellite data. We specially thank Prof.Dr. Yaseen Iqbal (Institute of Physics and Electronics) for hiscomments and suggestions on earlier versions of this manuscript.
References
Ackerman, A.S., Toon, O.B., Stevens, D.E., Heymsfield, A.J., Ramanathan, V., 2000.Reduction of tropical cloudiness by soot. Science 288 (5468), 1042–1047.
Table 2Correlation between AOD vs. warm and cold clouds parameters.
Alam, K., Blaschke, T., Madl, P., Mukhtar, A., Hussain, M., Trautmann, T., Rahman, S.,2011b. Aerosol size distribution and mass concentration measurements invarious cities of Pakistan. J. Environ. Monit. 13, 1944–1952.
Alam, K., Iqbal, M.J., Blaschke, T., Qureshi, S., Khan, G., 2010. Monitoring spatio-temporal variations in aerosols and aerosol cloud interaction over Pakistanusing MODIS data. Adv. Space Res. 46, 1162–1176.
Alam, K., Qureshi, S., Blaschke, T., 2011c. Monitoring spatio-temporal aerosolpatterns over Pakistan based on MODIS, TOMS and MISR satellite data and aHYSPLIT model. Atmos. Environ. 45, 4641–4651.
Alam, K., Trautmann, T., Blaschke, T., 2011a. Aerosol optical properties and radiativeforcing over mega city Karachi. Atmos. Res. 101, 773–782.
Alam, K., Trautmann, T., Blaschke, T., Majid, H., 2012. Aerosol optical and radiativeproperties during summer and winter seasons over Lahore and Karachi. Atmos.Environ. 50, 234–245.
Allan, R.P., 2011. Combining satellite data and models to estimate cloud radiativeeffect at the surface and in the atmosphere. Meteorol. Appl. 18, 324–333, http://dx.doi.org/10.1002/met.285.
Dutkiewicz, V.A., Alvi, S., Ghauri, B.M., Choudhary, M.I., Husain, L., 2009. Blackcarbon aerosols in urban air in South Asia. Atmos. Environ 43, 1737–1744.
EL-Askary, H., Kafatos, M., 2008. Dust storm and black cloud influence on aerosoloptical properties over Cairo and the great delta region Egypt. Int. J. RemoteSensing 29, 7199–7211.
Forest, C.E., Stone, P.H., Sokolov, A.P., Allen, M.R., Webster, M.D., 2002. Quantifyinguncertainties in climate system properties with the use of recent climateobservations. Science 295 (5552), 113–117.
Hoeve, J.E.T., Remer, L.A., Jacobson, M.Z., 2011. Microphysical and radioactive effectof aerosols on warm clouds during the Amazon biomass burning season asobserved by MODIS: impact of water vapor and land cover. Atmos. Chem. Phys.11, 3021–3036.
Houghton, J.T., Ding, Y., Griggs, D.J., Noguer, M., 2001. Climate change 2001. Thescientific basis, Contribution of Working Group I to the Third AssessmentReport of the Intergovernmental Panel on Climate Change.
Hsu, N.C., Herman, J.R., Tsay, S.C., 2003. Radiative impacts from biomass burning inthe presence of clouds during boreal spring in southeast Asia. Geophys. Res.Lett. 30, 1224.
Jin, M., Shepherd, J.M., 2008. Aerosol relationships to warm season clouds andrainfall at monthly scales over east China: Urban land versus ocean. J. Geophys.Res. 113, D24S90, http://dx.doi.org/10.1029/2008JD010276.
Kaufman, Y.J., Boucher, O., Tanre, D., Chin, M., Remer, L.A., Takemura, T., 2005.Aerosol anthropogenic component estimated from satellite data. Geophys. Res.Lett. 32, L17804.
Kaufman, Y.J., Fraser, R.S., 1997. The effect of smoke particles on clouds and climateforcing. Science 277 (5332), 1636–1639.
Kaufman, Y.J., Koren, I., Remer, L.A., Rosenfeld, D., Rudich, Y., 2005a. The effect ofsmoke, dust, and pollution aerosol on shallow cloud development over theAtlantic Ocean. Proc. Natl. Acad. Sci. 102 (32), 11 207–11 212.
Kim, B.G., Schwartz, S.E., Miller, M.A., Min, Q.L., 2003. Effective radius of clouddroplets by ground-based remote sensing: Relationship to aerosol. J. Geophys.Res. 108 (D23), 4740, http://dx.doi.org/10.1029/2003JD003721.
Koren, I., Kaufman, Y.J., Remer, L.A., Martins, J.V., 2004. Measurement of the effect ofAmazon smoke on inhibition of cloud formation. Science 303 (5662), 1342–1345.
Koren, I., Kaufman, Y.J., Rosenfeld, D., Remer, L.A., Rudich, Y., 2005. Aerosolinvigoration and restructuring of Atlantic convective clouds. J. Geophys. Res.Lett. 32 (14), L14828, http://dx.doi.org/10.1029/2005GL023187.
Kumar, A., 2013. Variability of aerosol optical depth and cloud parameters overNorth Eastern regions of India retrieved from MODIS satellite data. J. Atmos.Sol-Terr. Phys. 100–101 (2013), 34–49.
Lohmann., U., 2002. Possible Aerosol Effects on Ice Clouds via Contact Nucleation. J.Atmos. Sci. 59, 647–656.
Mahowald, N.M., Kiehl, L.M., 2003. Mineral aerosol and cloud interactions.Geophys. Res. Lett. 30 (No. 9), 1475, http://dx.doi.org/10.1029/2002GL016762.
Masmoudi, M., Chaabane, M., Tanré, D., Gouloup, P., Blarel, L., Elleuch, F., 2003.Spatial and temporal variability of aerosol: size distribution and opticalproperties. Atmos. Res. 66, 1–19.
Myhre, G., Stordal, F., Johnsrud, M., Kaufman, Y., Rosenfeld, D., Storelvmo, T.,Isaksen, I., 2007. Aerosol-cloud interaction inferred from MODIS satellite dataand global aerosol models. Atmos. Chem. Phys. 7 (12), 3081–3101.
Nowicki, S.M.J., Merchant, C.J., 2004. Observations of diurnal and spatial variabilityof radiative forcing by equatorial deep convective clouds. J. Geophys. Res. 109,http://dx.doi.org/10.1029/2003JD0044176.
Penner, J.E., Dong, X.Q., Chen, Y., 2004. Observational evidence of a change inradiative forcing due to the indirect aerosol effect. Nature 427 (6971), 231–234.
Platnick, S., King, M.D., Ackerman, S.A., Menzel, W.P., Baum, B.A., 2003. The MODIScloud products: algorithms and examples from Terra, IEEE Trans. Geosci.Remote Sensing 41 (2), 459–473.
Ramanathan, V., Crutzen, P.J., Kiehl, J.T., Rosenfeld, D., 2001. Atmosphere—aerosols,climate, and the hydrological cycle. Science 294 (5549), 2119–2124.
Ranjan, R.R., Joshi, H.P., Iyer, K.N., 2007. Spectral variation of total column aerosoloptical depth over Rajkot: a tropical semi-arid Indian station. Aerosol Air. QualRes 7 (1), 33–45.
Rosenfeld, D., 2000. Suppression of rain and snow by urban and industrial airpollution. Science 287 (5459), 1793–1796.
Rosenfeld, D., Lahav, R., Khain, A., Pinsky, M., 2002. The role of sea spray incleansing air pollution over ocean via cloud processes. Science 297 (5587),1667–1670.
Salomonson, V.V., Barnes, W.L., Maymon, P.W., Montgomery, H.E., Ostrow, H., 1989.MODIS—advanced facility instrument for studies of the Earth as a system. IEEETrans. Geosci. Remote 27 (2), 145–153.
Schwartz, S.E., Harshvardhan, Benkovitz, C.M., 2002. Influence of anthropogenicaerosol on cloud optical depth and albedo shown by satellite measurementsand chemical transport modeling. Proc. Natl. Acad. Sci. USA 99 (4), 1784–1789.
Storelvmo, T., Kristjansson, J.E., Myhre, G., Johnsrud, M., Stordal, F., 2006. Combinedobservational and modeling based study of the aerosol indirect effect. Atmos.Chem. Phys. 6, 3583–3601.
Tegen, I.A., Lacis, A.A., Fung, I., 1996. The influence on climate forcing of mineralaerosols from distributed soils. Nature 380, 419–422.
Tripathi, S.N., Pattnaik, A., Dey, S., 2007. Aerosol indirect effect over Indo-Gangeticplain. Atmos. Environ. 41, 7037–7047.
Walcek, C.J., 1994. Cloud cover and its relationship to relative-humidity during aspringtime midlatitude cyclone. Am. Meteor. Soc. 122, 1021–1035.
Xin, L., Ern, T.W., Khoo, R., Yong, A.K., Chew, B.N., Salinas, S.V., Liew, S.C., 2007.Characterization of Aerosol Optical Depth and Angstrom Exponent AcrossSingapore from Sun Photometer Measurements. CRISP, Singapore.
Yi, B., Yang, P., Bowman, K.P., Liu, X., 2012. Aerosol–Cloud-precipitation relation-ships from satellite observations and global climate model simulations. J. Appl.Remote Sensing 6, 063503, http://dx.doi.org/10.1117/1.JRS.6.063503.
K. Alam et al. / Journal of Atmospheric and Solar-Terrestrial Physics 107 (2014) 104–112112