Variability of Chlorate Levels in Sodium Hypochlorite Feedstock and Finished Drinking Water in New Jersey R. Lee Lippincott * , NJDEP Division of Science and Research, C.N. 409, 401 East State Street, 1 st floor, Trenton, N.J. 08625 1-(609) 984-4699 FAX 1-(609) 292-7340 Bernard Bubnis, Novatek, A Division of EBB, Inc., Oxford, OH Gilbert Gordon, Miami University, Oxford OH
Transcript
Variability of Chlorate Levels in Sodium Hypochlorite
Feedstock and Finished Drinking Water in New Jersey
R. Lee Lippincott*, NJDEP Division of Science and Research,C.N. 409, 401 East State Street, 1st floor, Trenton, N.J. 08625
1-(609) 984-4699FAX 1-(609) 292-7340
Bernard Bubnis, Novatek, A Division of EBB, Inc., Oxford, OH
Gilbert Gordon, Miami University, Oxford OH
ABSTRACT
The common oxidation chemicals used to disinfect drinking water include chlorine
dioxide, chloramines, and ozone. Because chlorine gas costs are increasing and new safety
regulations placed on its transportation, storage, and use are proposed, many utilities are
converting their treatment processes to use liquid bleach. During the storage of liquid
bleach, hypochlorite ion decomposes to form chlorate ion (at pH >10, rate = k[OCl!]2).
Because chlorate ion is planned for future regulation, the variability of chlorate ion levels
in commercially available liquid bleach and finished drinking water in New Jersey was
investigated as part of the State's effort to comply with the federally promulgated
Disinfection By-product Rule (DBP).
INTRODUCTION
Recent and proposed legislation1 is forcing water suppliers to comply with
regulations enacted to reduce the concentration of inorganic disinfection by-products
(chlorite, chlorate, and bromate ions) in the public water supply. Studies1,2 have clearly
shown that chlorate ion (ClO3-) concentrations ranging from 0.1 to 0.5 mg/L (ppm) can
be found in finished water treated with liquid bleach (hypochlorite ion, liquid
hypochlorite). The objective of this research was to assess various New Jersey utilities that
apply liquid bleach for chlorate ion in their raw water, the bleach stock solutions, and their
finished water distribution samples.
Because the finished water product produced at drinking water utilities is to be
consumed by the general public, chemicals used for treatment should be at a minimum,
"food grade" purity. In practice, an American National Standards Institute (ANSI)/
American Water Works Association (AWWA) standard1 does exist, however
ANSI/AWWA B300-92 for hypochlorite purity, falls short of controlling the level of
chlorate ion that is present in the bleach delivered to drinking water purveyors. Section
1.4 of the standard specifies that the burden of product purity is the responsibility of the
"purchaser's test". Because section 3 of this standard does not specify a chlorate ion
declaration, the chlorate ion concentration in the bleach is not specified and in general not
measured. The standard does specify a minimum trade percentage of chlorine strength
(Sec 2.3.3) and that the bleach solution "shall be a clear liquid containing not more than
0.15 percent insoluble matter by weight" (Sec 2.2.4). However, in the field, these
standards are commonly found to be ignored.
Our data indicates that an expansion is needed to section 2.4 (Impurities) to include
language regarding a maximum chlorate ion concentration. This adjustment offers a
drinking water purveyor the option of signing an Affidavit of Compliance (Section 1.3)
with the bleach manufacturer, and thus control the purchased bleach quality and strength.
This research investigated the residual chlorate ion problem on two levels:
A. An assessment was made to understand the awareness of New Jersey utility
operators with respect to liquid bleach purchase, storage, and application. A 10
minute survey similar to that used in a recent American Water Works Association
Research Foundation (AWWARF) was developed and distributed to participating
drinking water purveyors. The survey also provided some information about liquid
bleach suppliers operating in the state of New Jersey.
B. A biannual sample collection and analysis effort was initiated for nine New Jersey
drinking water systems. Five of the drinking water purveyors use groundwater
(GW) sources: GW1, GW2, GWUI1, GW3, and GWUI2. Of these, two
groundwater systems were classified as under the influence (GWUI) of surface
water (GWUI1 and GWUI2). Two consecutive systems (CS) participated in this
study; one bulk purchasing consecutive system uses all of their water from the
supplier and further disinfects the finished water with liquid bleach (CS1), and one
bulk purchasing consecutive system which receives only some of their water from
the supplier and further disinfects the finished water with liquid bleach (CS2).
Two surface supplied (SW) drinking water purveyors also participated in this
study, one with multiple open reservoirs where post chlorination occurs before
entry into the distribution system (SW1), and one with a conventional treatment
system and two separate surface water intake locations (SW2).
MATERIALS AND METHODS
Measurements
Potentiometric titration was used to determine the FAC concentration in
concentrated NaOCl1. The NaOCl solutions were analyzed directly for ClO2! and ClO3
!
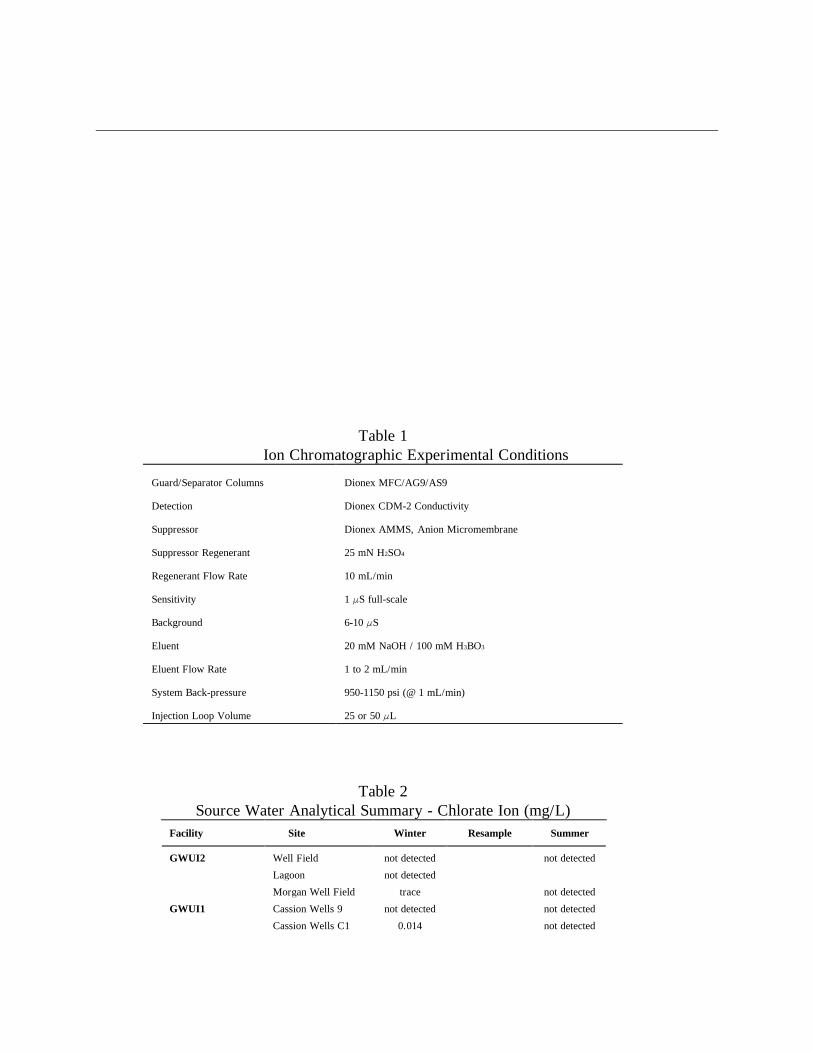
by ion chromatography2 using a Dionex Dx-100 system. The chromatographic conditions
are listed in Table 1.
Following preparation, the sample was injected directly onto the chromatographic
column either the same day or within 48 hours. The standard curves for ClO2! and ClO3
!
had a minimum correlation coefficient of 0.9990. To insure the integrity of the calibration
curves as a function of analysis time, a quality control (QC) standard containing both ions
was analyzed at a minimum every ten sample injections. The relative chromatographic
areas for these QC standards deviates less than " 3%.
Quality Assurance
The quality of the results obtained during this study was ensured at all stages of the
experimental and data handling protocols, including collecting raw water samples, storing
samples, performing the experiments, analyzing samples, entering data, verifying data and
reporting data.
Sampling
The raw water samples should were collected before the addition of any chemicals
either at the treatment plant influent or at other locations upstream of the plant. If plant
sampling taps were used, the standing water in the pipes was bled for several minutes
before sample collection. Liquid hypochlorite samples were drawn from storage vessels
that were to be used within one week.
Sample Preservation and Storage
A sampling instruction sheet and a chain-of-custody document was provided to
NJDEP. After filling the sampling container, the samples were immediately packed into
a cooler containing frozen blue ice and shipped via overnight delivery to Novatek in
Oxford, Ohio. Upon arrival at Novatek, each sample was identified and a file created on
the Novatek data base. Sample preservatives and holding times conformed to official
USEPA protocols.
Sample Analysis. QA/QC procedures for the analytical methodology involved daily
standardization of reagents, calibration of analytical instruments, replicate and control
experiments, use of reagent blanks, cross checking between analytical methods, and
protocols for calculating reporting levels and control limits.
Survey
The survey took approximately 10 minutes to complete. If a district operated
multiple systems, we asked that the questionnaire be completed for either each system or
one or two typical systems. The questions focused on gathering information outlined
below.
General Information
How many systems does your district operate?What type of source water is treated by your system?What volume of water is typically treated by your system each day?What is your typical total applied chlorine dosage?
Do you use liquid or solid hypochlorite ion?What is the method of hypochlorite production used by your supplier?Do you generate hypochlorite on-site?
Hypochlorite Storage
What is the labeled % active ingredient of your hypochlorite stock when purchased?Do you dilute your hypochlorite stock prior to storage? If yes, by what dilution factor?How often do you measure the concentration of your hypochlorite stock solution?What is the temperature of the your storage facility?What is your typical time of storage before using purchased hypochlorite stock?If you dilute your hypochlorite, what type of dilution water is used?Are different hypochlorite shipments routinely mixed?
Hypochlorite Application
Do you calculate the % active ingredient in order to determine the daily applied dosage?Do you apply hypochlorite at the raw water source?Do you currently analyze for chlorate ion (ClO3
!) in your finished water
Sample Collection
All raw water and finished water samples were collected in 40 mL glass vials with
teflon lined caps. Duplicate samples were collected at each sampling location to address
the method precision and verify the validity of the sample collection and analysis process.
All raw water samples were collected without preservatives with the following exceptions;
! where a chlorine residual was detected in the raw water,
! when a consecutive system chlorinates at the point of entry into the
distribution system, and
! when a purveyor has open storage/balancing reservoirs with post
chlorination at the point of entry into the distribution system.
In the USEPA draft DBP/ICR Analytical Methods Guidance Manual3, method
performance criteria were published for the determination of inorganic disinfection
byproducts by USEPA Method 300.0. These criteria were used as data quality objectives
in this study. They include:
! The response must be within ten percent of the predicted response for check
standards at a batch rate of 10% for each 8 hour shift.
! The method blank must be less than 10 µg/L for a single analyte at one per
batch.
RESULTS
Utility Survey
The initial focus of this contract was to develop a questionnaire that could be used
to gather specific information about the facilities in New Jersey using liquid bleach. A
prerequisite of this document was that it be similar to that used in the AWWARF contract
so that comparisons could be made between New Jersey facilities and facilities located
throughout the United States. The New Jersey questionnaire contains all of the elements
of the AWWARF survey in addition to asking specific questions regarding the bleach
supplier, bleach specifications, and hypochlorination points.
The compiled responses to the questionnaire indicate that the respondent New
Jersey utilities closely resemble other utilities across the country in terms of bleach
purchase, storage, and application.
In general, the chlorate ion issue has not been addressed. The most effective
approach to minimizing chlorate ion in finished water is to limit its formation in the stock
liquid bleach. It is recommended that a set of minimum liquid bleach specifications be
developed to help utilities purchase bleach having the proper pH, and a low initial
concentration of chlorate ion and transition metal ions (i.e. at the time of delivery). This
means that measurements need to be made by the manufacturers, storage conditions must
be controlled prior to delivery, and the utilities should receive freshly made product within
1 week of manufacture.
Upon receipt of a liquid bleach shipment, utilities should at least measure the FAC
content, the pH, and the chlorate ion concentration. If temperature is a problem, dilution
strategies should be implemented for storage.
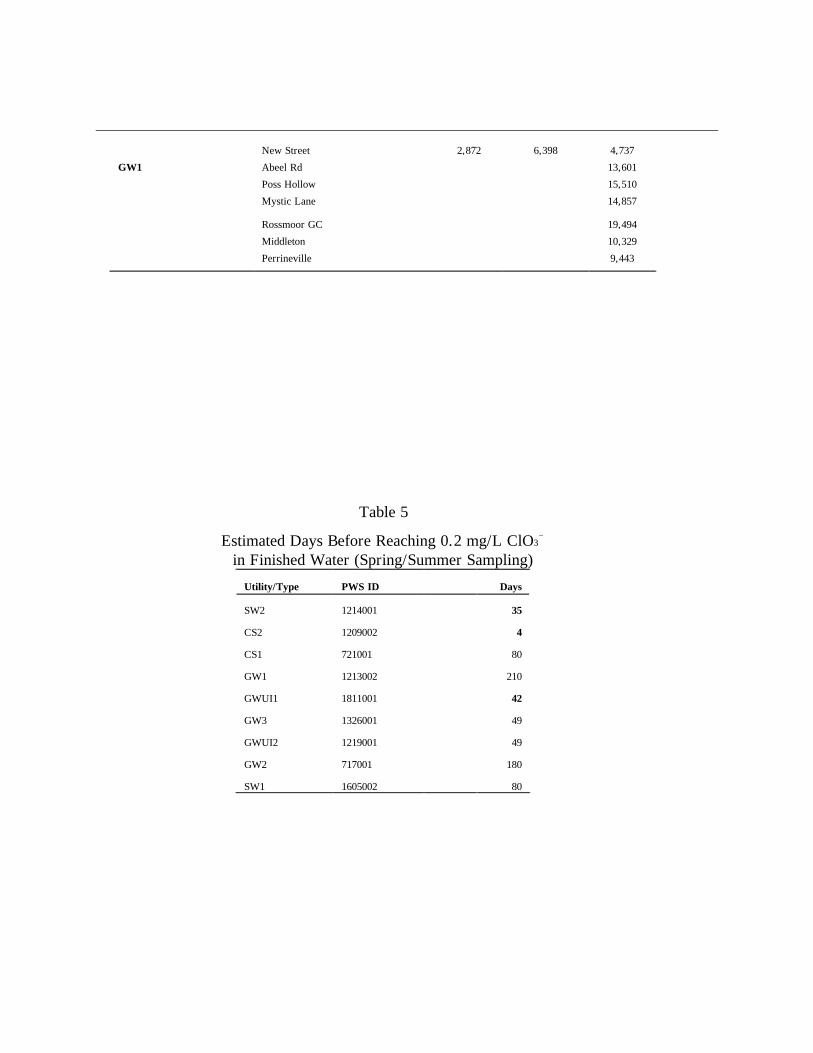
The Gordon/Adam Predictive Model developed at Miami University was used to
predict the number of days that the individual utility liquid bleach stock solutions could be
used before reaching the nominal 0.2 mg/L maximum contaminant level goal (MCLG).
Groundwater Systems
GW2
An initial sampling from the GW2 system included: 1 source water, 3 bleach stock
solutions, and 1 finished water. Chlorate ion was not detected in the source water. The
average measured chlorate ion concentration in the finished water was 24 Fg/L.
An end of summer analysis indicated that the source water for the GW2 systems
contains a chlorate ion residual in the Gist system prior to chlorination. The liquid bleach
analysis shows a increase in chlorate ion and less FAC strength compared to the liquid
bleach analysis for the Park system in the spring.
GW3
An initial sampling from the GW3 system included: 1 source water, 1 bleach stock
solution, and 1 finished water. Chlorate ion was detected in the source water (average =
11 Fg/L). The average measured chlorate ion in the finished water was 67 Fg/L. The
source water contained a small amount of chlorate ion that contributes to the residual
chlorate ion found in the finished water.
An end of summer analysis indicated that the source water for the GW3 system did
not contain a chlorate ion residual prior to chlorination. The liquid bleach analysis shows
a bleach stock that contains more chlorate ion and less FAC strength compared to the
liquid bleach analysis in the spring. The chlorate ion residual found in the finished water
is 3 times that found in the earlier analysis but still below the "proposed" chlorate ion
action level of 0.2 mg/L.
Systems Using Groundwater Under the Influence of Surface Water
GWUI1
An initial sampling included 4 samples: 2 source waters, 1 bleach stock solution,
and 1 finished water. Chlorate ion was not detected in one source water and was measured
to be an average of 14 Fg/L in the second sample. The average measured chlorate ion in
the finished water was 33 Fg/L. The source water contained a small amount of chlorate
ion that probably contributes to the residual chlorate ion found in the finished water
product.
An end of summer analysis indicated that the source water did not contain a
chlorate ion residual prior to chlorination. The liquid bleach analysis showed a bleach
stock that contained significantly more chlorate ion and less FAC strength compared to the
liquid bleach analysis in the spring. The chlorate ion residual found in the finished water
is 2 times that found in the earlier analysis but still below the "proposed" chlorate ion
action level of 0.2 mg/L.
Sayreville
An initial sampling from the Sayreville system included: 3 source waters, 2 bleach
stock solutions, and 2 finished waters. Chlorate ion was not detected two of the source
waters, however the third showed a trace of chlorate ion. The average measured chlorate
ion concentrations in the finished water were 70 and 102 Fg/L respectively.
An end of summer analysis indicate that the source water for the Sayreville system
do not contain a chlorate ion residual prior to chlorination. The liquid bleach analysis
showed a bleach stock that contains more chlorate ion and less FAC strength compared to
the liquid bleach analysis in the spring. The chlorate ion residual found in the finished
water is to 5 times found in the earlier analysis.
Consecutive Water Systems
CS1
An initial sampling from the CS1 system included: 1 source water, 1 bleach stock
solution, and 1 finished water. A resample was undertaken and 1 source water, 2 bleach
stocks and 1 finished water were also analyzed. Chlorate ion was detected in both the
initial and the resampling of this source water (average #1 = 35 Fg/L, average #2 = 30
Fg/L). The average measured chlorate ion in the finished water was 65 Fg/L in the
original and 34 Fg/L in the resampling. The source water contained chlorate ion that
contributes to the residual chlorate ion found in the finished water.
An end of summer analysis indicates that the source water for the system contained
a chlorate ion residual prior to chlorination. The chlorate ion residual found in the
finished water was comparable to our initial measurements.
CS2
An initial sampling from the CS2 system included: 3 source waters, 3 bleach stock
solutions, and 3 finished waters. Chlorate ion was not detected in 2 of the source waters.
Chlorate ion was detected in the purchased source water (average = 16 Fg/L). The
average measured chlorate ion in one of the finished waters was 349 Fg/L. This level is
considered high and is most likely a result of the 5 mg/L chlorine dose that is applied at
this treatment point per the survey. The average measured chlorate ion in the second
finished water was 33 Fg/L. The third finished water had an average measured chlorate
ion concentration of 36 Fg/L.
An end of summer analysis indicated that the source water for the CS2 system did
not contain a chlorate ion residual prior to chlorination in two of three facilities. The third
analysis showed that the each of the systems bleach stock contained more chlorate ion and
less FAC compared to the analysis in the spring. The chlorate ion residual found in the
finished water increased in each of the 3 systems.
Surface Supply Systems
SW1
An initial sampling from the SW1 system included: 6 source waters, 8 bleach
stock solutions, and 11 finished waters. Chlorate ion was detected in each of the source
waters in both the original sampling and the resampling ranging from a concentration of
21 to 236 Fg/L.
An end of summer analysis indicated that the source water for the SW1 systems
contained a chlorate ion residual prior to chlorination with the exception of a single
system. The liquid bleach analysis shows the chlorate ion and FAC strength to be similar
to those analyzed previously.
SW2
An initial sampling from the SW2 system included: 2 source waters, 1 bleach stock
solution, and 1 finished water. A trace of chlorate ion was detected in both the source
waters. The average measured chlorate ion in the finished water was 33 Fg/L.
An end of summer analysis indicated that the source water did not contain a
chlorate ion residual prior to chlorination. The liquid bleach analysis shows a bleach stock
that contains more chlorate ion and less FAC strength compared to the liquid bleach
analysis in the spring. The chlorate ion residual found in the finished water is 3 times that
found in the earlier analysis but still below the "proposed" chlorate ion action level of 0.2
mg/L.
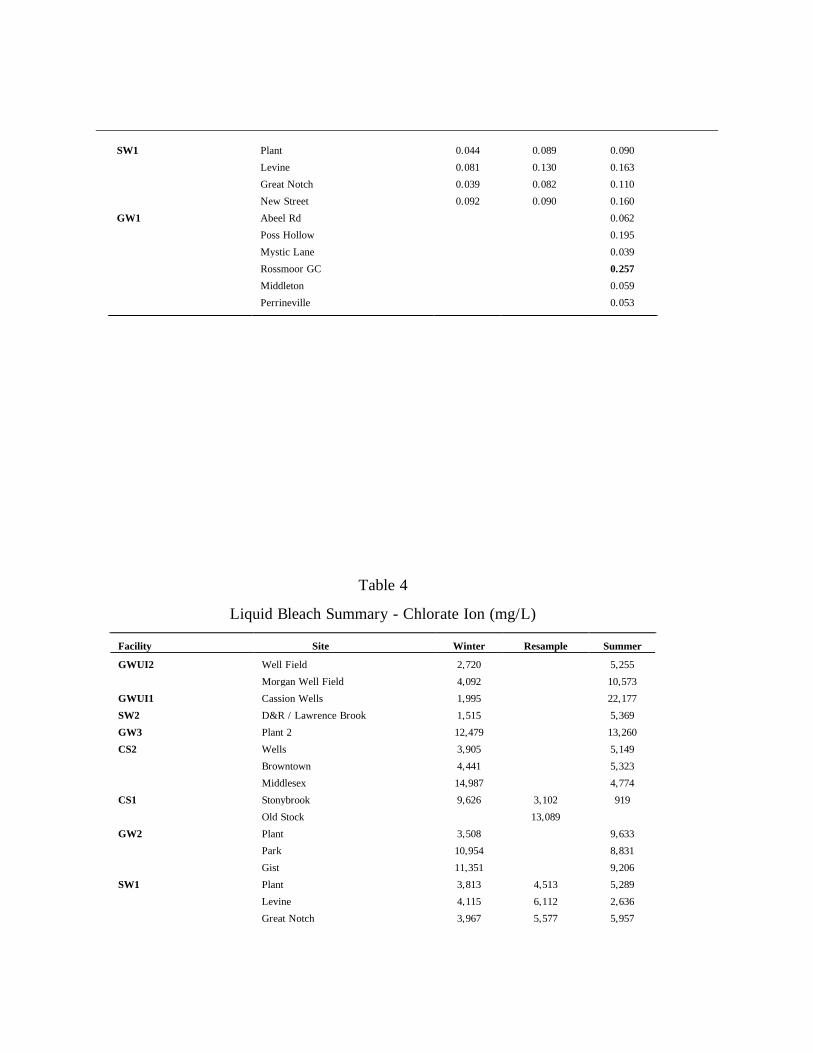
Summary
Table 2 presents the source water analyses that were made for chlorate ion. The
initial analysis showed a typical low level chlorate ion residual that can be as high as 0.050
mg/L. The final analysis performed at the end of the summer did not show a significant
change overall. In many of the utility source waters chlorate ion could not be detected
(ND). The SW1 samples continued to show a slightly high chlorate ion residual in the
source water.
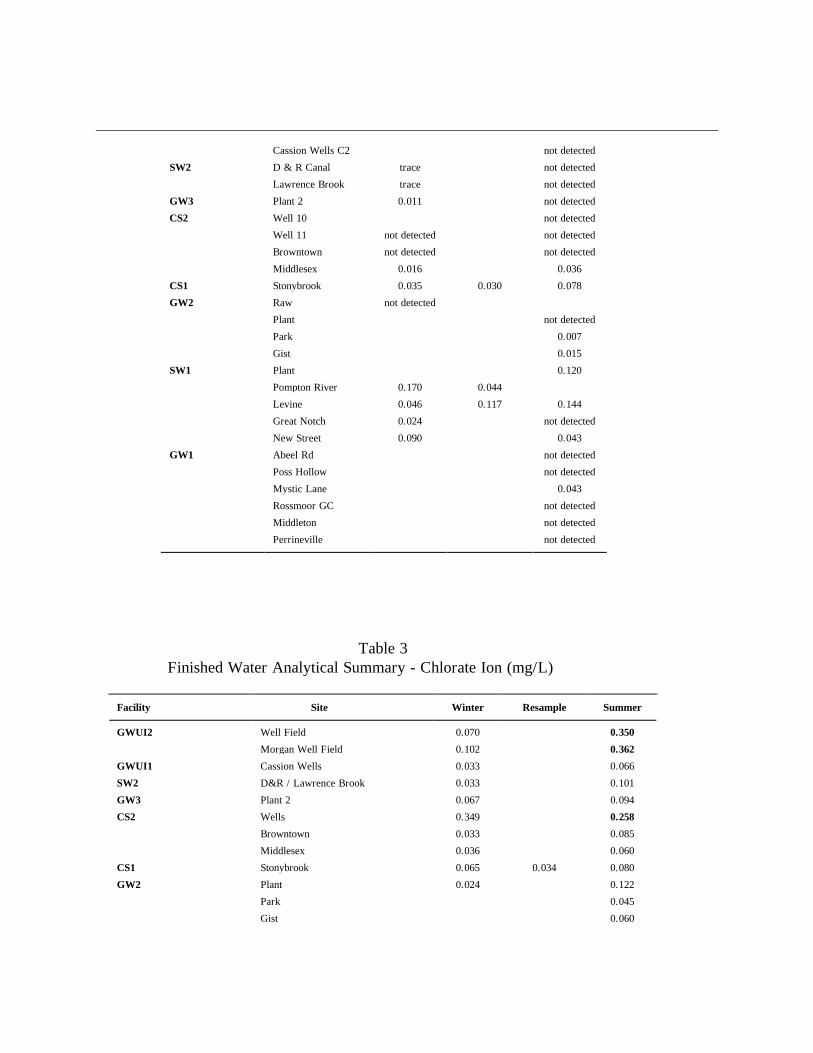
The bleach decomposition data clearly shows an increase in the bleach stock
chlorate ion concentration for most of the utilities submitting samples. This fact is
supported by the increase in finished water chlorate ion concentration measured in the final
sampling shown in Table 3.
Stock Solution Variability
The analytical results of the bleach stock solutions give an indication of possible
causes of low, delivered bleach, FAC concentrations. If a bleach stock solution is
expected to contain 15% FAC (wt) but the analysis indicates a lower concentration, either
the bleach has decomposed (indicated by a high concentration of chlorate ion) or the
delivered bleach did not meet the FAC specification.
To properly assess the impact of the stock chlorate ion concentration, these data
must be evaluated knowing the bleach stock FAC content. For example, if the stock has
a high chlorate ion concentration (>8,000 mg/L) but also has a high FAC concentration,
the amount of stock needed to maintain the desired FAC residual is less and thus, less
chlorate ion is added to the finished water. Conversely, if a bleach stock contains a
relatively low FAC and some chlorate ion concentration, more FAC must be add to
maintain the FAC residual. Thus, increased amounts of chlorate ion can be unknowingly
added to the finished water and exceed the proposed action level of 0.2 mg/L. For this
reason, the Gordon/Adam computer model was used to evaluate each utility stock solution.
Table 4 presents the liquid bleach analyses that were made for chlorate ion. The
initial analysis showed a number of utility stock solutions containing greater than 10,000
mg/L chlorate ion and clearly show an increase over time (indicating bleach
decomposition) in the stock chlorate ion concentration for most of the utilities submitting
samples.
Temperature Effect TO BE COMPLETED
(I have plotted a 3-D surface projection from the NY and VA data, we may need to
mention or include consultant as coauthor???) Include the analysis and description of
GWUI2 storage facility as an example.
Worst Case Summer Sampling - TO BE COMPLETED
GW1
Model Projections
The predictive model is based on long-term bleach decomposition and chlorate ion
formation results gathered for numerous commercial bleach products from various
manufacturers. The important parameters evaluated by the model are: FAC
concentration, pH, temperature, initial chlorate ion concentration, and chloride ion
concentration. The predictive model is constructed so that estimates of chlorate ion
concentration, liquid bleach specific gravity, and chloride ion concentrations can be made
and used if actual measurements are not available.
Many of the utilities state the pH of the liquid bleach stock to be 10. At pH levelsbelow 11, decomposition by the much faster acid catalysis pathway becomes aconcern and the half-life of the stored liquid bleach is greatly decreased. Thismeans that utilities storing bleach at pH <11 will experience a faster bleachdecomposition and more chlorate ion formation than shown in Table 5.
An average temperature of 80EF was used in many cases where temperature wasnot specified. This assumption does not take into account the warmer summermonths when the temperature of storage facilities can easily reach 90EF or more. This means that in the summer months, bleach decomposition and chlorate ionformation can be expected to be greater. Thus, the lifetime of the bleach is lessthan that presented in the table.
The estimate was made based on a single set of conditions and does not take into
account any cumulative effect that may exist due to hypochlorination at multiple
points.
DISCUSSION - TO BE COMPLETED
CONCLUSIONS - TO BE COMPLETED
RECOMMENDATIONS
The results of this project indicate that New Jersey utilities need to become more aware
of the strategies and practices that help to minimize chlorate ion in finished water. The most
effective approach to minimizing chlorate ion is to prevent its formation in the stock liquid bleach.
It is recommended that a set of minimum liquid bleach specifications be developed to help
utilities purchase bleach having the proper pH, and a low initial concentration of chlorate ion and
minimum transition metal ion levels at the time of delivery. This means that measurements need
to be made by the manufacturers, storage conditions must be controlled prior to delivery, and the
utilities should receive freshly made product within 1 week of manufacture.
Upon receipt of a liquid bleach shipment, utilities should at least measure the FAC
content, the pH, and the chlorate ion concentration. If temperature is a problem, dilution
strategies should be implemented for storage.
Additional precautions can be taken to reduce liquid bleach chlorate ion concentrations
including seasonal or periodic cleaning of the liquid bleach holding tanks, regular calibration of
the liquid bleach injection pumps, and the requirement that bleach manufacturers provide a
certificate of analysis for each bleach stock delivered to a New Jersey utility.
ACKNOWLEDGEMENTS
The authors would like to thank the following organizations for contributing to this
research: New Jersey Department of Environmental Protection, American Water Works
Association Research Foundation, Miami University, and Malcolm-Pirnie Engineering, Inc.


![Sodium chlorate - Krishna districtkrishna.nic.in/PDFfiles/MSME/Chemical/SODIUM CHLORATE[1].pdf · effluent from the bleaching plant. Sodium chlorate, ... (solution of common salt](https://static.documents.pub/doc/80x56/5a9372b07f8b9a8b5d8c39da/sodium-chlorate-krishna-chlorate1pdfeffluent-from-the-bleaching-plant-sodium.jpg)

