MARINE ECOLOGY PROGRESS SERIES Mar. Ecol. Prog. Ser. 1 Published February 9 Variability of deep chlorophyll maximum characteristics in the Northwestern Mediterranean Marta Estradal, Celia Marrase1,Mike1 ~atasa', Elisa ~erdalet', Maximino Delgadol, Tecla ~ iera~ 'Institut de Ciencies del Mar, P. Nacional. E-08039 Barcelona, Spain 'Facultat de Biologia, Universitat de Barcelona. Diagonal 645, E-08028 Barcelona, Spain ABSTRACT: A well-developed deep chlorophyll maximum (DCM) is a prominent feature of the Northwestern Mediterranean during a large part of the year. Data from 7 oceanographic surveys car- ried out across the Catalano-Balearic Sea, between 1982 and 1987, have been used to analyze short- term (within cruises) and seasonal+interannual (between cruises) variation of several parameters (such as surface and DCM chlorophyll concentration, integrated chlorophyll, DCM, nitracline and nitrite maximum depths). S~gnificant positlve correlations (p < 0.01) were found between the depths of the DCM, of the nitracline and of the nitrite maximum. Surface chlorophyll concentrations and average chlorophyll values for the upper 110 m of the water column were signicantly correlated for only 2 of the 7 cruises. The relationship between integrated primary production and surface or integrated chloro- phyll concentrations presented considerable scatter due, in part, to physiological variability of the sam- pled communities. After exclusion of 1 statistically outlying point, apparently corresponding to a sedl- menting bloom, a multiple linear regression model of integrated primary production (mg C m-' h-') on integrated chlorophyll, euphotic zone depth and a stability parameter explained 74 D/o of the data vari- ance. However, the presence of such 'outliers' limits the usefulness of these models and stresses the need of physiological informat~on for a rellable prediction of primary product~vity. INTRODUCTION Deep chlorophyll maxima are ubiquitous in oligo- trophic situations such as those found in the major oceanic gyres of the Atlantic and the Pacific and in temperate areas in summer. In general, the water col- umn of these regions presents a series of common properties, which have been characterized as the 'Typical Tropical Structure' or TTS by Herbland & Voituriez (1979). In the TTS, the upper layers of the eu- photic zone are nutrient-depleted, the lower levels are light-limited, and a deep chlorophyll maximum (DCM) occurs within the layer of density stratification, in close association with the nutricline. Based on the relation- ships between hydrographical and biological features described by Herbland & Voituriez (1979), the TTS can be considered as a continuum of pattern controlled by the input of nutrients from below (Cullen 1982). The oligotrophic extreme of this continuum presents a deep DCM and nitracline, low chlorophyll concentrations and low primary production. More productive situa- tions, with relatively high chlorophyll concentrations and primary production, are characterized by a shal- low DCM and nitracline. A well-developed deep chlorophyll maximum asso- ciated with increased phytoplankton biomass, is a prominent feature of the Mediterranean Sea during a large part of the year (Estrada 1985~1, Berman et al. 1984).The presence of a DCM plays an important role in the way the trophic food web of the pelagic ecosys- tem is organized (Fairbanks & Wiebe 1980, Laws et al. 1987).In the Catalano-Balearic Sea (Fig. l), the contri- bution of the DCM (assuming it to be 15 m wide) to summer primary production has been estimated to range from 12 to 30 % of the total (Estrada 1985a).The accumulation of phytoplankton biomass at the DCM, O Inter-Research 1993
Transcript
MARINE ECOLOGY PROGRESS SERIES Mar. Ecol. Prog. Ser.
1 Published February 9
Variability of deep chlorophyll maximum characteristics in the Northwestern
Mediterranean
Marta Estradal, Celia Marrase1, Mike1 ~atasa' , Elisa ~erdalet ' , Maximino Delgadol, Tecla ~ i e r a ~
'Institut d e Ciencies del Mar, P. Nacional. E-08039 Barcelona, Spain 'Facultat de Biologia, Universitat d e Barcelona. Diagonal 645, E-08028 Barcelona, Spain
ABSTRACT: A well-developed deep chlorophyll maximum (DCM) is a prominent feature of the Northwestern Mediterranean during a large part of the year. Data from 7 oceanographic surveys car- ried out across the Catalano-Balearic Sea, between 1982 and 1987, have been used to analyze short- term (within cruises) and seasonal+interannual (between cruises) variation of several parameters (such as surface and DCM chlorophyll concentration, integrated chlorophyll, DCM, nitracline and nitrite maximum depths). S~gnificant positlve correlations (p < 0.01) were found between the depths of the DCM, of the nitracline and of the nitrite maximum. Surface chlorophyll concentrations and average chlorophyll values for the upper 110 m of the water column were signicantly correlated for only 2 of the 7 cruises. The relationship between integrated primary production and surface or integrated chloro- phyll concentrations presented considerable scatter due, in part, to physiological variability of the sam- pled communities. After exclusion of 1 statistically outlying point, apparently corresponding to a sedl- menting bloom, a multiple linear regression model of integrated primary production (mg C m-' h- ') on integrated chlorophyll, euphotic zone depth and a stability parameter explained 74 D/o of the data vari- ance. However, the presence of such 'outliers' limits the usefulness of these models and stresses the need of physiological informat~on for a rellable prediction of primary product~vity.
INTRODUCTION
Deep chlorophyll maxima are ubiquitous in oligo- trophic situations such as those found in the major oceanic gyres of the Atlantic and the Pacific and in temperate areas in summer. In general, the water col- umn of these regions presents a series of common properties, which have been characterized as the 'Typical Tropical Structure' or TTS by Herbland & Voituriez (1979). In the TTS, the upper layers of the eu- photic zone are nutrient-depleted, the lower levels are light-limited, and a deep chlorophyll maximum (DCM) occurs within the layer of density stratification, in close association with the nutricline. Based on the relation- ships between hydrographical and biological features described by Herbland & Voituriez (1979), the TTS can be considered as a continuum of pattern controlled by the input of nutrients from below (Cullen 1982). The
oligotrophic extreme of this continuum presents a deep DCM and nitracline, low chlorophyll concentrations and low primary production. More productive situa- tions, with relatively high chlorophyll concentrations and primary production, are characterized by a shal- low DCM and nitracline.
A well-developed deep chlorophyll maximum asso- ciated with increased phytoplankton biomass, is a prominent feature of the Mediterranean Sea during a large part of the year (Estrada 1985~1, Berman et al. 1984). The presence of a DCM plays an important role in the way the trophic food web of the pelagic ecosys- tem is organized (Fairbanks & Wiebe 1980, Laws et al. 1987). In the Catalano-Balearic Sea (Fig. l ) , the contri- bution of the DCM (assuming it to be 15 m wide) to summer primary production has been estimated to range from 12 to 30 % of the total (Estrada 1985a). The accumulation of phytoplankton biomass at the DCM,
O Inter-Research 1993
290 Mar. Ecol. Prog. Ser. 92: 289-300, 1993
Fig. 1 Study area in the Catalano-Balearic Sea. Line indicates the transect sampled during the different cruises. Numbers indicate the position of the biological stations from which the primary production data were obtained. Symbols indicate the
cruises
together with fertilization events related to oceano- graphic features such as the Catalan and the Balearic frontal systems (Estrada & Margalef 1988), may help to explain the relatively high production estimated for upper trophic levels in the Mediterranean (Sournia 1973).
The Western Mediterranean DCM appears to be closely associated with the nitracline (Estrada 1985a, b, Lohrenz et al. 1988) and has been compared to the TTS of Herbland & Voituriez (1979). However, while a num- ber of publications deal with the characteristics of the DCM in areas of the Atlantic and Pacific oceans (Anderson 1969, Venrick et al. 1973, Kiefer et al. 1976, Cullen & Eppley 1981, Cox et al. 1982, Herbland et al. 1983, Napp 1987, Eppley et al. 1988) information on the variability of the Mediterranean DCM is scarce.
In this paper, we attempt to compare seasonal and short-term changes in several hydrographic variables concerning the DCM in the Catalan Sea, and examine the relationships between primary production and sev- eral characteristics of the distribution of biological and physical variables in the water column. The goal of the present work was to gain insight into the ecological significance of the observed distributions and to assess
the usefulness of these relationships for predictive pur- poses and as a basis for remote sensing applications (Platt & Sathyendranath 1988, Banse & Yong 1990, Balch et al. 1992). The data were obtained in a series of oceanographic cruises carried out across the Catalan front, along a transect from Barcelona to the channel between Mallorca and Menorca. The large extension of the marine regions in which phytoplankton biomass and production accumulate at subsurface levels stresses the importance of finding regularities in the physical and biological features of these areas. In this context, it can be expected that studies carried out in a limited, but well-characterized, zone can offer infor- mation of general ecological interest.
MATERIAL AND METHODS
The oceanographic cruises discussed in this work took place between .iuiy 1982 and June 1987 (Tab!e l ) . Details of the sampling strategy and basic data from all cruises are given in PEPS (1986) and Maso & PEPS (1988). Information concerning chlorophyll a distribu- tion and primary production values during the PEP 82, PEP 83 and-PEP 84 cruises can be found in Estrada (1985a, b) and Estrada & Margalef (1988). PEP stands for 'Produccio Estival Profunda' ('Deep Summer Production' in the Catalan language). Aspects of the phytoplankton composition during some of the cruises have been discussed in Estrada (1985a, b, 1991), Margalef (1985). Margalef & Estrada (1987) and Estrada & Salat (1989).
Sampling was conducted mainly along a transect between Barcelona and the Mallorca-Menorca chan- nel (Fig. 1). Each cruise consisted of series of 'standard' and 'biological' stations. In general, at each 'standard' station, water samples were taken with 5 1 Nishn bot- tles at 10 m intervals between surface and 110 m, and at larger intervals from this depth down to at least 400 m. Several stations could be occupied each day, so that a transect was completed in 2 to 3 d (see Table 1). The 'biological' stations lasted 24 h and consisted of an
Table 1 Cruise dates. Code (month/year) is the abbreviation used in Figs. 1, 7, 8 & 9
Cruise Date Code
PEP 82 12-20 Jul 1982 7/1982 PEP 83 8-14 Jul 1983 7/1983 PEP 84 16-27 May 1984 U1984 PEP 85 1-6 Jun 1985 6/1985 PEP 86 13-24 Jun 1986 6/1986 FRONTS 11/86 7-12 NOV 1986 11/1986 PEP 87 23-30 May 1987 511987
Estrada e t al.: Mediterranean deep chlorophyll maximum 291
initial hydrographical cast similar to that of the 'stand- ard' stations, followed by repeated casts ('production' casts) at selected depths to obtain water for several bi- ological determinations, including I4C uptake expen- ments. The stations were classified into those belong- ing to the Catalan coast (coastal, depths < 1000 m), central zone (depths > 1000 m), Balearic sill (depths < 1000 m) and east of the Balearic Islands. Previous in- spection of the data had shown that there were differ- ences in the degree of stratification of the water col- umn and other oceanographic parameters among these groups. As most of the stations of our data set be- longed to the central zone, we considered only these in the statistical calculations.
In cruises PEP 82 and PEP 83, temperature readings were obtained with a Neil Brown CTD probe. In the re- maining cruises, temperature was measured with re- versing thermometers and salinity with an induction salinometer (PEPS 1986, Mash & PEPS 1988). The dif- ference between the u,values at the DCM depth and at surface, divided by the DCM depth and multiplied by 100(D,,g,), was used as an index of stability of the upper water column (see definitions in Table 2). Chlorophyll a was determined by fluorirnetry of acetone extracts (Yentsch & Menzel 1963). Seawater volumes from 25 to 200 cm3 were filtered through GF/C glass fiber filters (nominal pore size 1.2 pm) in PEP 82, PEP 83 and PEP 84, and through GF/F filters (nominal pore size 0.7 pm) in the following cruises. The filters were subsequently homogenized in 90 % acetone, and the suspension was
cleared by centrifugation. The fluorescence of the chlorophyll extracts was determined by means of a Turner l11 in cruises PEP 82, PEP 83 and PEP 84, and a Turner Designs fluorometer in the following cruises. Nutrients were determined using Technicon autoana- lyzers, as described in PEPS (1986) and Mas6 & PEPS (1988). Underwater irradiance was measured at the biological stations with a 2n, LI-COR underwater quantum sensor.
The use of GF/C filters during the first 3 cruises may have resulted in an underestimation of the chlorophyll a concentration (Phinney & Yentsch 1983). However, both GF/C (nominal pore size 1.2 pm) and GF/F (nom- inal pore size 0.7 pm) filters retain a higher proportion of small particles than could be expected from their nominal pore sizes (Sheldon 1972, Venrick et al. 1987). In a study carried out in coastal and oligotrophic open sea areas of the North Pacific, Venrick et al. (1987) found that GF/C filters passed, on average, from 4.4 to 8.9 % of total chlorophyll (retained by 0.45 pm Milli- pore filters). Parallel measurements using GF/C and 0.4 pm Nuclepore filters were carried out at 1 station of PEP 82 and PEP 83 and 2 stations of PEP 84, for sam- ples from 0 to 90 m depth. No significant differences were detected using the signed rank test. Although these results cannot be extended to all the situations encountered and comparisons of chlorophyll concen- trations among cruises must be made with caution, they suggest that the bias resulting from the change of filter type is Likely to have been fairly small.
iable 2. Abbreviations employed in the text. For clarity, capital letters without subindices have been used in the figures (e.g. Chl,, = CHLMAX)
Abbreviation Definition Units
Chl,,~ Chlorophyll a concentrahon at the DCM mg m-3 Chlrnmn Average chlorophyll a between 0 and 110 m depth mg m-3 Chltot Total chlorophyll a between 0 and 110 m depth nlg m-3 Chloro Surface chlorophyll a mg m-3 Chlorin, Integrated chlorophyll a down to the 1 O/O light level mg m-2 DCM Deep chlorophyll maximum - Dslgt (q at the DCM - uc at 0 m) X 100/ZDCM -
P'DCM Productivity index a t the DCM mg C (mg chl a)- ' h-' PBmax Maximum productivity index in the water column mg C (mg chl a) - ' h-' Prodday Daily integrated primary production down to the 1 % light level my C m-* d-I Prodmt Hourly integrated primary production down to the 1 O/O Light level, a t mid-day mg C m-2 h-'
(8:30 to 15:15 h GMT) P/B Ratio between Prod,,, and Chlorin, mg C (mg chl a)-' h-' Tempo Surface temperature "C zcc Depth of the centroid of the chlorophyll distribution m Zeu Depth of the 1 % light level m ZDCM DCM depth m ZNO~ Depth of the nitrite maximum m z~03 Nitracline depth m VS1 Vertical stratification index (see methods) -
292 Mar. Ecol. Prog. Ser. 92: 289-300, 1993
For the hydrographical casts, vertically integrated chlorophyll (Chl,,,) or mean chlorophyll concentration (Chl,,,,) between 0 and Z, m depth was calculated from:
Chl,,, = (Ckl + C,) (Zi+l - Zl)/2.
and Chl,,,, = Chl,,,/Z,,
where C, = the concentration in the ith sample, Zi = depth of the ith sample and n = no. of samples. The Z, value used for the calculations was 110 m. This was the deepest level sampled at 10 m intervals, because it was located well below the DCM. While Chl,,, is only slightly underestimated by this choice (see Figs. 2 & 3), it has to be taken into account that the range of Chl,,,, is dependent on the reference level.
The depth centroid of the vertical distribution of chlorophyll (Zcc) was calculated according to the for- mula (Herman 1989):
The Zcc was included as a descnptor of the chloro- phyll profile because it is less subject to sampling vari- ability than the DCM depth. We found that its value at a particular location tended to vary little within the du- ration of a cruise (data not shown).
The vertical stratification index (VSI; Cullen & Eppley 1981, Napp 1987) was chosen to characterize the degree of heterogeneity of the vertical chlorophyll a profiles. The formula used was:
n - l
VS1 = I o o ( C I C ; + , - ~ ~ I ) / ( ~ ~ x C h l , ~ t ) I = ]
Phytoplankton abundances were determined for samples from the initial cast of the biological stations of PEP 86 and the hydrographical stations of the other cruises. Additional samples were taken from some of the production casts of the biological stations. The samples for phytoplankton enumeration consisted of 120 m1 of water which were enclosed in Pyrex bottles and fixed with Lugol's solution (without acetic acid). A subsample (100 ml) was sedimented in a composite chamber and observed with an inverted microscope. This methodology is not adequate for picoplankton and for many naked flagellates which deteriorate in fixed samples. More technical details are given in Estrada (1985a).
Primary production determinations using the 14C up- take technique were carried out in all cruises except FRONTS 11/86. The position of the corresponding sta-
tions is given in Fig. 1 (on 4 occasions. 2 experiments were carried out at the same station). The methodology was basically as described in Estrada (1985b). Two clear and 1 opaque 125 m1 Pyrex bottles were filled with water from 6 selected depths (3 of them covering the DCM) and inoculated with 5 pCi of NaHI4CO3-. The bottles were kept for 2 to 3 h in simulated in situ incubators, placed on deck of the ship, and cooled with circulating surface water. The incubators were cov- ered with stainless steel screens to simulate the irradi- ance at the depths of origin of the samples. One prob- lem with this system is that deep samples were incubated at surface temperatures and were exposed to light of a different spectral composition than that found in situ; the combined effect of these conditions on the corresponding C fixation rates (Lohrenz et al. 1992) is uncertain because, although higher tempera- tures might cause an overestimation, other factors, such as the temperature change or the differences in light quality, could tend to reduce carboii uptake. Measurements of the productivity indices of DCM samples exposed to increased irradiances, carried out during July 1983 (cruise PEP 83), suggested that ad- verse effects of the incubation temperature could not have been too important (Estrada 1985b). After incuba- tion, the content of the bottles was filtered through Millipore HAWP membrane filters (0.45 pm nominal pore size), which were dried and exposed to HCl fumes. Radioactivity was measured using a LKB liquid scintillation counter. Dark uptake values were low and no correction was applied. Only data from incubations performed between 8:30 and 15:15 h GMT were re- tained. Hourly production rates per m2 (Prod,,,) were calculated by integrating the I4C uptake rates corre- sponding to the different depths, down to the 1 % light level. Chlorophyll concentrations were also integrated down to the 1 % light level (Chlorin,). Although the compensation depth may have been deeper, it is un- likely that a significant underestimation of Prodi,, oc- curred, given the low C fixation rates recorded at 1 % of the surface irradiance and the low chlorophyll con- centrations generally found below the corresponding depth. An approximate figure for daily primary pro- duction was obtained by multiplying the hourly mid- day rates by 9, which was the average ratio (range 8.7 to 9.3) between total daily irradiance and the mean hourly irradiance at mid-day for the months of May to July in the Barcelona area (Coronas et al. 1982). That factor was not very different from the slope (= 8, p < 0.01) of the regression (with zero-intercept) of daily production estimates versus hourly mid-day values for a total of 5 stations of PEP 82, PEP 83 and PEP 84, for which successive incubations during the same day were available (Estrada 1985b). However, the assump- tion of a linear relationship between surface irradiance
Estrada et al.: Mediterranean deep chlorophyll maximum 293
and production of the water column at a given location (Minas & Coste 1964) and the application of a single factor should be considered as an approximation.
An approximation to the ratio (Pr~d,,,~/Chlor,) between daily integrated production (Prodd,,) and near-surface chlorophyll, as defined by Eppley et al. (1985), was obtained by extrapolating Prod,,, to daily production and dividing by the chlorophyll concentra- tion at surface (Chlor,,, taken as representative of near- surface pigments, given that chlorophyll concentra- tions were fairly homogeneous in the upper 10 to 20 m of the euphotic zone).
RESULTS
Seasonal variability of the DCM and environmental factors
A representative late spring (PEP 86, June 1986) dis- tribution of temperature, salinity and chlorophyll con- centration along the studied transect is shown in Fig. 2. Typical vertical profiles of chlorophyll concentration and several hydrographic parameters at one of the central stations are presented in Fig. 3. Outside the
PEP 86 Stations m 1 2 3 4 5 6 7 8 9 10
Fig. 2. Distributions of temperature, salinity and chlorophyll a concentration in the first transect of PEP 86
Temperature ("C)
Chlorophyll (rnglrn J,
Fig. 3. Representatwe vertical profiles of temperature, chloro- phyll a and nitrate concentration in the central zone (Stn 28,
Fig. 1) of the studied transect, during the cruise PEP 86
winter or early spring period, the surface signature of the Catalan front is only appreciable in the salinity dis- tribution, as happened during PEP 86. The chlorophyll distribution patterns over the shelf are very variable, due to more intense mixing and to the influence of sur- face tongues of low-salinity and chlorophyll-rich coastal waters (Estrada & Salat 1989), such as that seen
r E
50. 7 0 - 90 -
ZN03 30 - 50 - 70 -
ZDCM 30 - 50 -
4 ZDCM
0
ZCC
Julian day
Fig. 4. Seasonal changes of the nitracline depth (ZN03) , the chlorophyll maximum depth (ZDCM), and the depth of the centroid of the chlorophyll distribution (ZCC). Each point cor- responds to the average for the different stations of each cruise. Vertical bars indicate the standard error of the mean.
Horizontal bars indicate the duration of each cruise
294 Mar. Ecol. Prog. Ser. 92: 289-300, 1993
Julian day
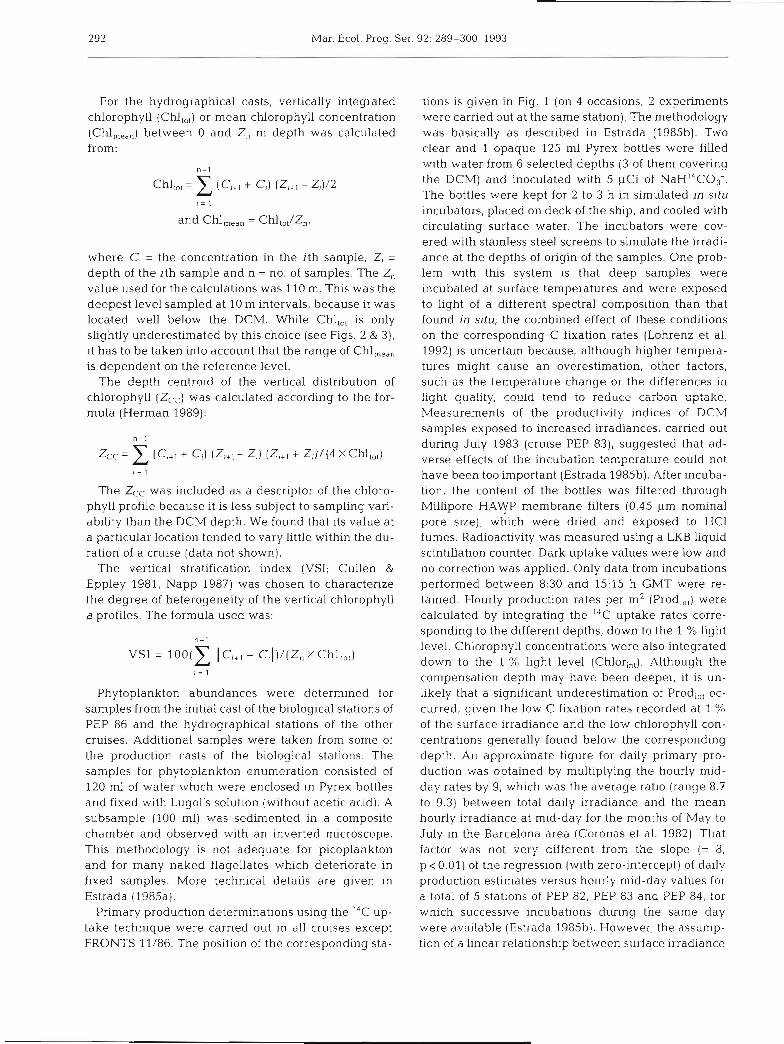
Fig. 5. Seasonal changes of surface chlorophyll a concentra- tion, average chlorophyll a concentration in a layer of 0 to 110 m depth, and concentration of chlorophyll a at the deep max- imum. Each point corresponds to the mean for the stations of
each cruise. Vertical and horizontal bars as in Fig. 4
in Fig. 2; these tongues are subject to rapid displace- ment in a southwest direction, with production of meanders and eddies. The doming of the isolines off- shore of the Catalan front, approximately mid-way between Barcelona and the Balearic Islands (Fig. 2) is a consistent feature during all the cruises (data not shown) and contributes to increased nutrient inputs into the upper layers of the euphotic zone. Its signifi- cance has been discussed in previous papers (Estrada & Margalef 1988).
The variation of the within-cruise averages of Chlor, (surface chlorophyll concentration, mg m-3), Chl,,, (chlorophyll concentration at the DCM, mg m-3). Chl,,,, (mean chlorophyll in a water column of 0 to 110 m, mg m-3) and other parameters, for the central stations (deeper than 1000 m) of the studied transect, is summarized in Figs. 4 to 6. The depths of the DCM
0 - 1 . . l . , . 8 . CO L 0 120 160 200 240 280 320
Julian day
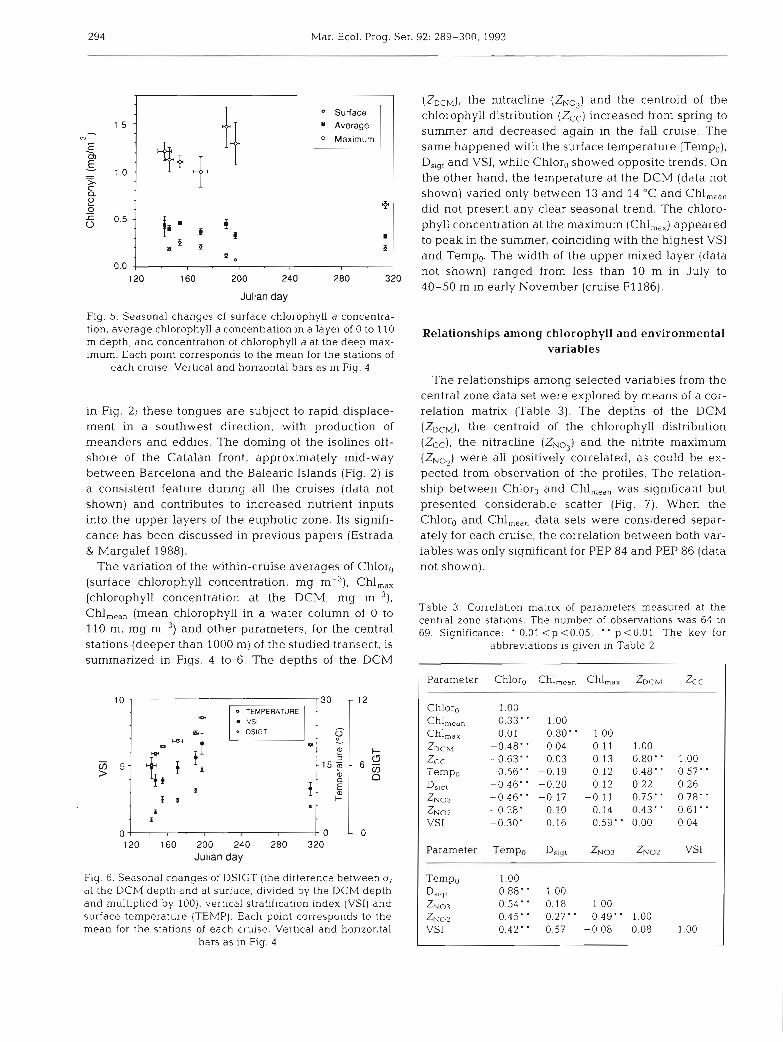
Fig. 6. Seasonal changes of DSIGT (the difference between U,
at the DCM depth and at surface, divided by the DCM depth and multiplied by loo), vertical stratification index (VSI) and surface temperature (TEMP). Each point corresponds to the mean for the stations of each cruise. Vertical and horizontal
bars as In Fig. 4
(ZDCM), the nitracline (ZN03) and the centroid of the chlorophyll distribution (Zcc) increased from spring to summer and decreased again in the fall cruise. The same happened with the surface temperature (Tempo), Dsigt and VSI, while Chlor, showed opposite trends. On the other hand, the temperature at the DCM (data not shown) varied only between 13 and 14 "C and Chl,,,, did not present any clear seasonal trend. The chloro- phyll concentration at the maximum (Chl,,,) appeared to peak in the summer, coinciding with the highest VS1 and Temp,. The width of the upper mixed layer (data not shown) ranged from less than 10 m in July to 40-50 m in early November (cruise F1 186).
Relationships among chlorophyll and environmental variables
The relationships among selected variables from the central zone data set were expiorea by medrls of a cor- relation matrix (Table 3). The depths of the DCM (ZDCM), the centroid of the chlorophyll distribution (Zcc), the nitracline (ZNo,) and the nitrite maximum (ZNOp) were all positively correlated, as could be ex- pected from observation of the profiles. The relation- ship between Chlor, and Chl,,,, was significant but presented considerable scatter (Fig. 7) . When the Chlor, and Chl,,,, data sets were considered separ- ately for each cruise, the correlation between both var- iables was only significant for PEP 84 and PEP 86 (data not shown).
Table 3. Correlation matrix of parameters measured at the central zone stations. The number of observations was 64 to 69. Significance: ' 0.01 < p <0.05; p <0.01 The key for
Estrada et al.: Med~terranean deep chlorophyll maximum 295
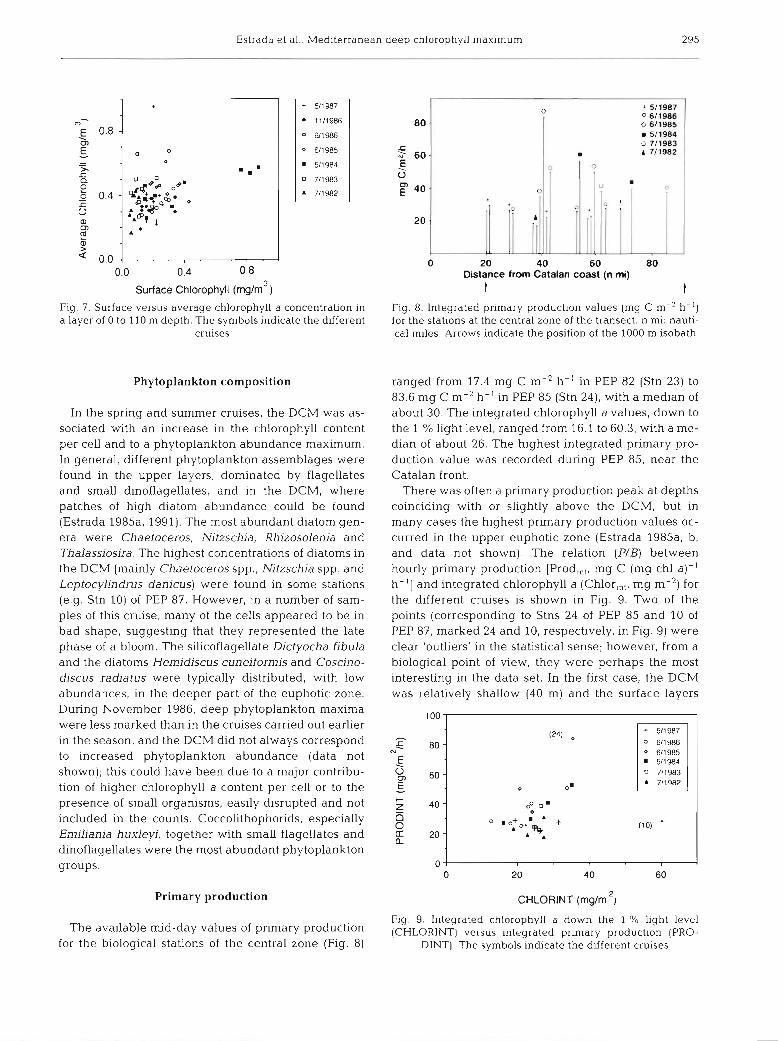
Surface Chlorophyll (rnglm3) Fig. 7. Surface versus average chlorophyll a concentration in a layer of 0 to 110 m depth. The symbols indicate the different
cruises
Phytoplankton composition
In the spring and summer cruises, the DCM was as- sociated with an increase in the chlorophyll content per cell and to a phytoplankton abundance maximum. In general, different phytoplankton assemblages were found in the upper layers, dominated by flagellates and small dinoflagellates, and in the DCM, where patches of high diatom abundance could be found (Estrada 1985a, 1991). The most abundant diatom gen- era were Chaetoceros, Nitzschia, Rhizosolenia and Thalassiosira. The highest concentrations of diatoms in the DCM (mainly Chaetoceros spp., Nitzschia spp. and Leptocylindrus danicus) were found in some stations (e.g. Stn 10) of PEP 87. However, in a number of sam- ples of this cruise, many of the cells appeared to be in bad shape, suggesting that they represented the late phase of a bloom. The silicoflagellate Dictyocha fibula and the diatoms Hemidiscus cuneiformis and Coscino- discus radiatus were typically distributed, with low abundances, in the deeper part of the euphotic zone. During November 1986, deep phytoplankton maxima were less marked than in the cruises carried out earlier in the season, and the DCM did not always correspond to increased phytoplankton abundance (data not shown); this could have been due to a major contribu- tion of higher chlorophyll a content per cell or to the presence of small organisms, easily disrupted and not included in the counts. Coccolithophorids, especially Emiliania huxleyi, together with small flagellates and dinoflagellates were the most abundant phytoplankton groups.
Primary production
The available mid-day values of primary production for the biological stations of the central zone (Fig. 8)
0 20 40 60 80 Distance from Catalan coast (n mi)
t t Fig. 8. Integrated primary production values (mg C m-2 h-') for the stations at the central zone of the transect. n mi: nauti- cal miles. Arrows indicate the position of the 1000 m isobath
ranged from 17.4 mg C m-2 h-' in PEP 82 (Stn 23) to 83.6 mg C m-2 h-' in PEP 85 (Stn 24), with a median of about 30. The integrated chlorophyll a values, down to the 1 % light level, ranged from 16.1 to 60.3, with a me- dian of about 26. The highest integrated primary pro- duction value was recorded during PEP 85, near the Catalan front.
There was often a primary production peak at depths coinciding with or slightly above the DCM, but in many cases the highest primary production values oc- curred in the upper euphotic zone (Estrada 1985a, b, and data not shown). The relation (PIB) between hourly primary production [Prod,,,, mg C (mg chl a)- ' h-'] and integrated chlorophyll a (Chlor,,,, mg m-') for the different cruises is shown in Fig. 9. Two of the points (corresponding to Stns 24 of PEP 85 and 10 of PEP 87, marked 24 and 10, respectively, in Fig. 9) were clear 'outliers' in the statistical sense; however, from a biological point of view, they were perhaps the most interesting in the data set. In the first case, the DCM was relatively shallow (40 m) and the surface layers
Fig. 9. Integrated chlorophyll a down the 1 % light level (CHLORINT) versus integrated prlmary production (PRO-
DINT). The symbols indicate the different cruises
296 Mar. Ecol. Prog. Ser. 92: 289-300, 1993
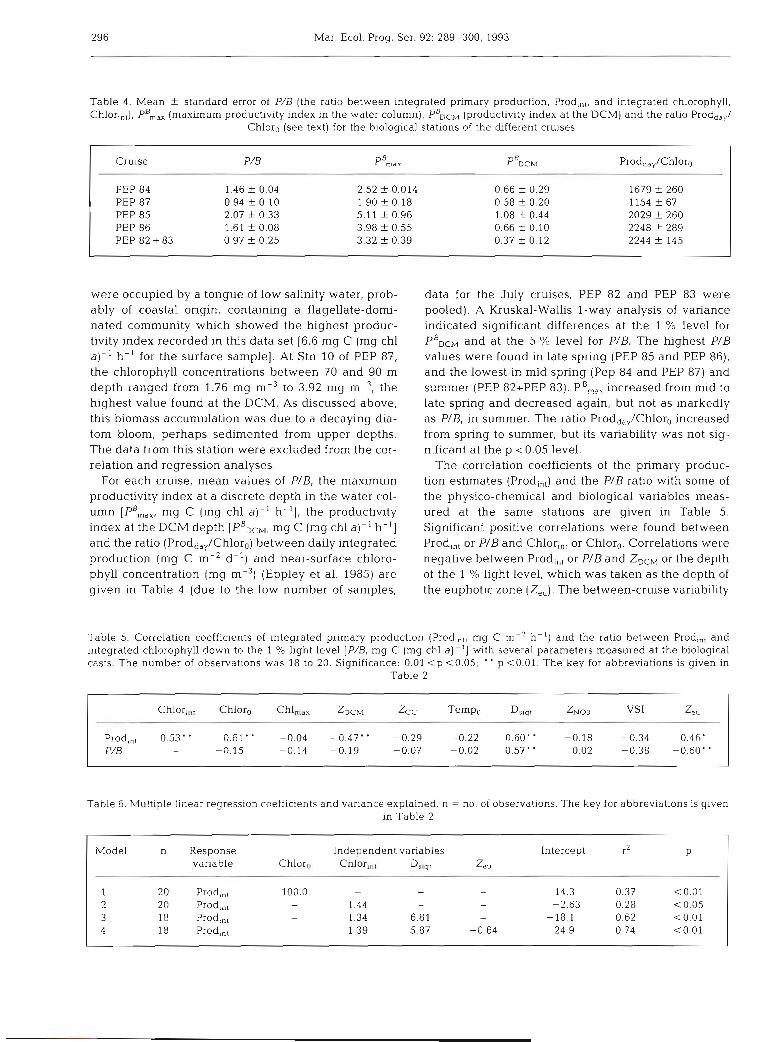
Table 4. Chlor,,,),
Mean f standard error of P/B (the ratio between integrated primary production, Prod,,,, and integrated chlorophyll, , pB,, (maximum producbvity index in the water column), PRDCM (productivity index at the DCM) and the ratio Prodd,,,/
Chloro (see text) for the biological stations of the different cruises
Cruise P/B p",,, ~ " D C M ProddaY/Chloro
PEP 84 1.46 f 0.04 2.52 f 0.014 0.66 f 0.29 1679 t 260 PEP 87 0.94 f 0.10 1.90 -t 0.18 0.58 -t 0.20 1154 f 67 PEP 85 2.07 f 0.33 5.11 f 0.96 1.08 t 0.44 2029 t 260 PEP 86 1.61 f 0.08 3.98 f 0.55 0.66 f 0.10 2248 t 289 PEP 82 + 83 0.97 + 0.25 3.32 t 0 39 0.37 + 0 12 2244 t 145
were occupied by a tongue of low salinity water, prob- ably of coastal origin, containing a flagellate-dorni- nated community which showed the highest produc- tivity index recorded in this data set (6.6 mg C (mg chl a)-' h- ' for the surface sample]. At Stn 10 of PEP 87, the chlorophyll concentrations between 70 and 90 m depth ranged from 1.76 mg m-3 to 3.92 my m-', the highest value found at the DCM. As discussed above, this biomass accumulation was due to a decaying dia- tom bloom, perhaps sedimented from upper depths. The data trom this station were excliided from the cor- relation and regression analyses.
For each cruise, mean values of P/B, the maximum productivity index at a discrete depth in the water col- umn [PB,,,, mg C (mg chl a)- ' h- ' ] , the productivity index at the DCM depth [PBDCM, mg C (mg chl a)- ' h- ' ] and the ratio (Prodday/Chlor0) between daily integrated production (mg C m-2 d-') and near-surface chloro- phyll concentration (mg m-3) (Eppley et al. 1985) are given in Table 4 (due to the low number of samples,
data for the July cruises, PEP 82 and PEP 83 were pooled). A Kruskal-Wallis l-way analysis of variance indicated significant differences at the 1 % level for PBDCM and at the 5 % level for P/B. The highest P/B values were found in late spring (PEP 85 and PEP 86), and the lowest in mid spring (Pep 84 and PEP 87) and summer (PEP 82+PEP 83). PB,,, increased from mid to late spring and decreased again, but not as markedly as PIB, in summer. The ratio Prodd,,/Chloro increased from spring to summer, but its variability was not sig- nificant at the p < 0.05 level.
The correlation coefficients of the primary produc- tion estimates (Prodi,,) and the P/B ratio with some of the physico-chemical and biological variables meas- ured at the same stations are given in Table 5. Significant positive correlations were found between Prod,,, or PIB and Chlor,,, or Chlor,. Correlations were negative between Prod,,, or PIB and ZDCM or the depth of the 1 % light level, which was taken as the depth of the euphotic zone (Z,,). The between-cruise variability
Table 5. Correlation coefficients of integrated primary production (Prod,,,, mg C m-' h-') and the ratio between Prodin1 and integrated chlorophyll down to the 1 % light level [P/& mg C (mg chl a ) - ' ] with several parameters measured at the biological casts. The number of observations was 18 to 20. Significance: 0.01 < p <0.05; ' ' p i 0 . 0 1 . The key for abbreviations is given in
Estrada et al.: Mediterranean deep chlorophyll maximum 297
discussed in the previous paragraph was reflected in a relatively low correlation between Prod,,, and Chlor,,, when the pooled data set was considered. The ratio PIB was negatively correlated with Z,,. Exclusion of the data corresponding to Stn 24 of PEP 85 made non- significant (but still positive) the correlation between Prod,,, and PIB with D ,,,,.
Several descriptive regression models were formu- lated with Prodin, as the response variable and one or more of the variables of Table 5 as independent vari- ables. Some of them are given in Table 6. Models 1 and 2, with Chloro or Chlor,,, as independent variables ex- plained respectively 37 and 28 % of the variance. Addition of Tempo as independent variable did not im- prove the regression fit of Models 1 or 2. Model 3, with Chlorin, and D ,,,,, and Model 4, with these and Z,, as dependent variables explained, respectively, 62 and 74 % of the variance. Exclusion of the high Prodint value of Stn 24 of PEP 85 resulted in a lower percent- age of the data variance explained by the regression equations (36 and 61 % for Models 3 and 4, respec- tively).
DISCUSSION
In spite of interannual variability, which was particu- larly apparent in the two May cruises (Figs. 4 to 6 ) , the DCM-related parameters showed trends which fit well into the generally accepted picture of the seasonal cycle in the Northwestern Mediterranean (Margalef & Castellvi 1967). The spring to fall deepening of Z,,, with respect to ZDcM and Zcc suggests a seasonal decrease of nitrate supply to the DCM community. Presumably, this observation can also be applied to the supply of phosphate, another major nutrient likely to be limiting in Mediterranean waters. The phosphate data were too fragmentary to be included here, but the available profiles showed that generally the depth of the phosphate nutricline coincided or was close to that of the nitracline. Assuming that the nitrate distribution is representative of nitrogen supply conditions at the DCM, a progressive reduction of new production from spring to fall could be expected. This may not be reflected in the primary production estimates derived from I4C experiments, which are likely to include a strong component of regenerated production.
Significant relationships for DCM-related parame- ters, comparable to those given in Table 3, have been found in other areas, including the Southwestern Mediterranean (Herbland & Voituriez 1979, Cullen & Eppley 1981, Cox et al. 1982, Lohrenz et al. 1988). In these studies, ZDcM was strongly correlated with ZN03, suggesting the importance of the upward nutrient flux in influencing the vertical chlorophyll distribution. In contrast with the results of Herbland & Voituriez (1979)
for the tropical Atlantic Ocean, our data did not show a significant correlation between Chl,,, and ZDCh4. This finding may be related to the relative importance of growth versus loss factors on the build-up of chloro- phyll concentration at the DCM. In situations of rela- tively intense growth at the DCM (such as would occur in the equatorial upwelling, with a relatively shallow DCM), Chl,,, would show a negative correlation with ZDCM, as found by Herbland & Voituriez (1979). Under conditions of relatively slow growth, reduced losses (lower turbulent dispersion rates) would be relatively more important in maintaining a high Chl,,, and this variable would show positive or non-significant corre- lation with ZDCM, because ZDCM tends to become deeper when stratification increases. This would be the case of our observations and those of Cox e t al. (1982) for Sargasso waters. The negative (but non-sig- nificant) correlation betwen ZDCM and Chl,,, found by Lohrenz et al. (1988) for the Southwestern Medi- terranean would indicate a n intermediate situation. Of course, other factors, such as grazing pressure could modify this oversimplified scenario.
Interaction of light availability and nutrient supply within a layer of reduced turbulence appears to play a leading role in the formation and location of the DCM in the Western Mediterranean (Estrada 1985a, Lohrenz et al. 1988). Chlorophyll patchiness within the DCM could be explained by variability in physical forcing. Shoaling of the DCM due to wind events, instabilities or upwelling phenomena at the front would result in intermittent increases of nutrient flux into the euphotic zone and enhancement of in situ growth which would be difficult to detect with conventional sampling strat- egies (Estrada 1985a, Dandonneau & Lemasson 1987, Eppley et al. 1988, Lohrenz et al. 1988, Strass 1992).
The primary production rates estimated in this study fall within the ranges reported in Sournia (1973) for the Northwestern Mediterranean. Our range (after extra- polation to daily values) of 0.16 to 0.76 g C m-' d - ' is similar to that (0.33 to 0.60 g C m-2 d- l ) given by Lohrenz et al. (1988) for Mediterranean Waters north of the Algerian Current front (Southwestern Medi- terranean). However, given the differences in spatial and temporal coverage, it is difficult to establish de- tailed comparisons with previously reported data sets.
The between-cruise differences of the photosyn- thetic parameters listed in Table 4 are likely to reflect a combination of seasonal trends and smaller scale (both temporal and spatial) variability in the taxonomic and physiological characteristics of the autotrophic plank- ton community. Lower mean values of P',,, in the mid spring (May) cruises could be related to shade adapta- tion of the cells, due to a higher degree of mixing of the water column early in the season (Lewis et al. 1984, Gallegos & Platt 1985). Increased stability of the upper
298 Mar. Ecol. Prog. Ser.
euphotic zone of the June and July cruises could have contributed to higher photosynthetic capacities of the resident flagellate-dominated populations (Demers &
Legendre 1982, Perissinotto et al. 1990). The increase in P",,, from mid to late spring would tend to raise the Prodd,,/Chloro ratios, but effects on total production and P/B could be offset later on (summer) by factors such as a deeper position of the DCM and the nutri- cline, which would tend to decrease the relative pro- portion of total incident light available for the auto- trophs (Lorenzen 1971). Our findings agree with the observations of Eppley et al. (1985) and Eppley et al. (1987) in the Southern California Bight and the Eastern Tropical Pacific Ocean. These authors recorded that highest values of Prodd,,,/Chloro were found in oligo- trophic or stratified (summer) waters and lowest values in nutrient-rich or mixed (winter) waters.
Among the possible explanations for the finding of weak or non-significant relationships between chloro- phyll, primary production and vertical nutrient distri- butions are the effects of patchiness and the input of nutrients by advection, isopycnal mixing, or other pro- cesses not directly dependent on diffusion across the nutricline (Ohman et al. 1982, Hayward 1987). Both ex- planations may apply to our study area, which is likely to be affected by instabilities of the neighbouring fron- tal zones. In a strict sense, our results do not fit all the characteristics given by Herbland & Voituriez (1979) for the TTS, although the basic mechanisms of DCM formation are likely to be the same. It should be noted also that the data of Herbland & Voituriez (1979) cov- ered a range of situations going from nitracline depths of about 20 to 90 m, wider than that found in our work; this may have been another cause for the lower corre- lations obtained with our data.
As can be seen in Table 6, some combinations of in- dependent variables (e.g. Models 3 and 4 ) provided satisfactory fit to the integrated production data, with or without the high production point of Stn 24 of PEP 85. It needs to be investigated whether future data will support the usefulness of these or similar regression models. It is interesting to note that, when taken alone, Chlor" was a better predictor of production than Chlor,,,; however, when other variables were consid- ered, use of Chlor,,, instead of Chloro resulted in greater variance explained. The positive effect of DSig, reflects the finding, d.iscussed above, of higher assimi- lation numbers of upper euphotic zone communities with increased stability. The euphotic zone depth (Z,,) presented a negative relationship with production, as found in previous studies (Lafontaine & Peters 1986). A limitation of our data set is the lack of adequate meas- urements of incident irradiance during the incuba- t ion~ . However, most incubation experiments were carried out on sunny days and radiation conditions for
the studied zone vary little between May and July (Coronas et al. 1982). Thus, it could be expected that incident irradiance per se would be of little predictive value, as discussed by Harrison & Platt (1980), Lafontaine & Peters (1986) and Banse & Yong (1990).
The study of regional differences and relationships among parameters describing photosynthetic charac- teristics and vertical distribution of autotrophic bio- mass is of interest for large scale estimation of primary production. Available data suggest that such parame- ters show some seasonal and geographical trends and could be useful for the broad characterization of ma- rine regions in the remote sensing context (Eppley et al. 1985, Platt & Sathyendranath 1988). Often, how- ever, as found in the present work and in other studies of regions with deep chlorophyll maxima (Hayward & Venrick 1982, Ohman et al. 1982, Hayward 1987, Banse & Yong 1990), only relatively low variance can be explained by the regression of primary production on chlorophyll, or on variables which might be readily determined by remote sensing. It is likely that statisti- cal 'outliers' will continue to be a problem in such re- gressions, emphasizing the need to consider the com- position and physiological variability of the autoirophic populations, in order to make accurate predictions of primary production. This implies a limitation for cur- rent remote sensing applications, as noted by Banse & Yong (1990); however, in a general context, although disturbing when trying to summarize results, the pres- ence of 'outliers' may provide interesting information that should not be overlooked.
Acknow1egdements. We thank the crew of the RV 'Garcia del Cld' and the other participants in the cruises for their help during sampling. M. Alcaraz and R. Margalef made valuable comments on the manucript. A. Cruz, J. Biosca, P. Sacristan and M. Velez provided technical assistance. This work was supported by the Consejo Superior de lnvestigaciones Cientificas, by grant nos. 231 1308 and PR84-0067 of the CAI- CYT and by grant no. CCA8411054 of the Comit6 Conjunto Hispano-norteamericano para la Cooperaci6n Cientifica y Tecnologica.
LITERATURE CITED
Anderson. G. C. (1969). Subsurface chlorophyll maximum in the Northeast Pacific Ocean. Limnol. Oceanogr. 14. 386-391
Balch. W., Evans, J., Brown. J.. Feldman, G., McClain, C., Esaias, W. (1992). The remote sensing of ocean primary prod.uctivity: use of a new data comp~lation to test satellite algorithms. J . geophys. Res. 97 C: 2279-2293
Banse, K., Yong, M. (1990). Sources of variability in satellite- derived estimates of phytoplankton production in the Eastern Tropical Pacific. J . geophys. Res. 95C. 7201-7215
Berman. T.. Townsend, D. W., El-Sayed, S. Z., Trees, C. C.. Azov, Y (1984). Optical transparency, chlorophyll and pri-
Estrada et al.: Mediterranean deep chlorophyll maximum 299
mary productivity in the Eastern Mediterranean near the Israeli coast. Oceanol. Acta 7: 367-372
Coronas, A., Llorens, M,, Villarrubia, M. (1982). Energ~a solar a Catalunya: Radlacio solar i insolacio. Universitat de Barcelona, Publicacions i Edicions. Barcelona
Cox, J. L., Wiebe, P. H., Ortner, P-, Boyd, S. (1982). Seasonal development of subsurface chlorophyll maxima in Slope Water and Northern Sargasso Sea of the Northwestern Atlantic Ocean. Biol. Oceanogr 1 271-285
Cullen, J. .I. (1982) The deep chlorophyll maximum compar- ing vertical profiles of chlorophyll a. Can. J. Fish. Aquat. Sci. 39: 791-803
Cullen, J. J., Eppley, R. W. (1981). Chlorophyll maximum layers of the Southern California Bight and possible mech- anisms of their formation and maintenance. Oceanol. Acta 4: 23-32
Dandonneau, Y., Lemasson, L. (1987). Water-column chloro- phyll in an oligotrophic environment: corection for the sampling depths and variations of the vertical structure of density, and observation of the growth period. J. Plankton Res. 9: 215-234
Demers, S . , Legendre, L. (1982). Water column stability and photosynthet~c capacity of estuarine phytoplankton: long- term relationsh~ps. Mar. Ecol. Prog. Ser. 7: 337-340
Eppley, R. W., Stewart, E., Abbott, M. R., Heyman, U. (1985). Estimating ocean primary production from satellite chlo- rophyll. Introduction to regional differences and statistics for the Southern California Blght. J . Plankton Res. 7: 57-70
Eppley, R. W., Stewart, E., Abbott, M. R., Owen, R. W. (1987). Estimating ocean production from satellite-derived chlo- rophyll: insights from the Eastropac data set. Oceanol. Acta Special Issue 6: 109- 113
Eppley, R. W., Swift, E., Redalje, D. G . , Landry, M. R., Haas, L. W. (1988). Subsurface chlorophyll maxin~unl in August-September 1985 in the CLIMAX area of the North Pacific. Mar. Ecol. Prog. Ser. 42: 289-301
Estrada, M. (1985a). Deep phytoplankton and chlorophyll maxima in the Western Mediterranean. In: Moraitou- Apostolopoulou, M,, Kiortsis, V. (eds.) Mediterranean marine ecosystems. Plenum Press, New York. p. 247-277
Estrada, M. (198513). Primary production at the deep chloro- phyll maximum in the Western Mediterranean. In: Gibbs, P. E. (ed.) Proc. 19th Eur. Mar. Biol. Symp. Cambridge University Press, Cambridge, p. 109-121
Estrada, M. (1991). Phytoplankton assemblages across a NW Mediterranean front: changes from winter mixing to spring stratification. In: Ros, J D., Prat, N. (eds.) Homage to Ramon Margalef; or, Why there is such pleasure in stud- ying nature. Oecologia Aquatica 10: 157-185
Estrada, M., Margalef, R. (1988). Supply of nutrients to the Mediterranean photic zone across a persistent front. Oceanol. Acta Special Issue 9: 133-142
Estrada, M., Salat, J . (1989). Phytoplankton assemblages of deep and surface water layers in a Mediterranean frontal zone. Scientia Marina 53: 203-214
Fairbanks, R. G.. Wiebe, P. H. (1980). Foraminiferan and chlo- rophyll maximum: vertical distribution, seasonal succes- sion, and paleoceanographic significance. Science 209: 1524-1529
Gallegos. C. L., Platt, T (1985). Vertical advection of phyto- plankton and productivity estimates: a dimensional analy- sis. Mar. Ecol. Prog. Ser. 26: 125-134
Harrison, W. G., Platt, T. (1980). Variations in assimilation number of coastal marine phytoplankton: effects of envi- ronmental CO-variates. J. Plankton Res. 2: 249-260
Hayward, T. L. (1987). The nutrient distribution and primary
production in the central North Pacific. Deep Sea Res. 34: 1593-1627
Haywai-d, T L. , Venl-ick, E. L. (1982). Relation between sur- face chlorophyll, integrated chlorophyll and integrated primarv production. Mar. Biol. 69: 247-252
Herbland, .A., Le Borgne. R., Le Bouteiller, A., Voituriez, B. (1983). Structure hydrologique et production primaire dans 1'Atlantique tropical oriental Oceanogr Trop. 17: 15-25
Herbland, A., Voitur~ez, B. (1979). Hydrological structure analysis for estimating the primary production in the trop- ical Atlantic Ocean. J. mar. Res. 37: 87-101
Herman, A. W. (1989). Vertical relationships between chloro- phyll, production and copepods in the eastern tropical Pacific. J . Plankton Res. 11: 243-261
l e f e r , D. A., Olson, R. J . , Holm-Hansen, 0. (1976) Another look at the nitrite and chlorophyll maxima in the central North Pacific. Deep Sea Res. 23: 1199-1208
Lafontaine, Y., Peters, R. H. (1986). Empirical relationship for marine primary production: the effect of environmental variables. Oceanol. Acta 9: 65-72
Laws. E. A., DiTullio, G . R., Redalje, D. G. (1987). High phyto- plankton growth and production rates in the North Pacific subtropical gyre. Limnol. Oceanogr. 34: 905-918
Lewis, M. R.. Cullen, J. J.. Platt, T (1984). Relationships between vertical mixing and photoadaptation of phyto- plankton: similarity criteria. Mar. Ecol. Prog. Ser 15: 141-149
Lohrenz, S. E., Wiesenburg, D. A . DePalma, I. P., Johnson, K. S . , Gustafson, D. E. (1988). Interrelationships among primary production, chlorophyll, and environmental con- ditions in frontal regions of the western Mediterranean Sea. Deep Sea Res. 35: 793-810
Lohrenz, S. E., Mriesenburg, D. A., Rein, C. R., Arnone, R. A., Taylor, C. D., Knauer, G . A., Knap, A. H. (1992) A compar- ison of in situ and simulated in situ methods for estimating oceanic primary production. J. Plankton Res. 14: 201-221
Lorenzen, C. J. (1971). Extinction of light in the ocean by phy- toplankton. J. Cons. int. Explor. Mer 34: 262-267
Margalef, R. (1985). Environmental control of the mesoscale distribution of primary producers and its bearing to pri- mary production in the Western Mediterranean. In: Moraitou-Apostolopoulou, M., Kiortsis, V. (eds ) Medi- terranean marine ecosystems. Plenum Press, New York, p. 213-229
Margalef, R., Castellvi, J. (1967). Fitoplancton y production primaria de la costa catalana, de julio de 1966 a julio de 1967. Investigacion pesq. 31. 491-502
Margalef, R. , Estrada, M. (1987). Synoptic distr~bution of sum- mer phytoplankton (Algae and Protozoa) across the princi- pal front in the Western Mediterranean. Investigacion pesq. 51: 121-140
Maso, M., Grup PEPS (1988). Datos oceanograficos basicos de las campanas FRONTS-3-85, FRONTS-6-85, PEP 86, FRONTS-11-86 y PEP 87 en eI mar Catalan. Datos Informativos 24: 1-83
Minas, H. J.. Coste, B. (1964) ~ t u d e de la structure hydrolo- gique et de quelques aspects de la productivite de la zone euphotique en fin d'ete au niveau d'une station fixe (bouee-laboratoire de COMEXO) et rade de Villefranche s/mer. Recueil des Travaux de la Station marine d'Endoume, Faculte des Sciences de Marseille 34: 133-255
Napp, J. M. (1987). Primary productivity maxima in the Southern California Bight: distribution, predicted depth and nutritional content. Oceanol. Acta 10: 329-337
Ohman, M., Anderson, G. C., Ozturgut, E. (1982). A multivar-
Mar. Ecol. Prog. Ser. 92: 289-300, 1993
iate analysis of planktonic interactions in the eastern trop- ical North Pacific. Deep Sea Res. 29: 1451-1469
PEPS, Grup (1986). Datos oceanograf~cos basicos de las camparias PEP-82, PEP-83 y PEP-84 en el mar Catalan Datos Inforrnativos 19. 1-52
Perissinotto, R., Duncornbe Rae. C. M., Boden. B. P,, Allanson. B. R. (1990). Vertical stability as a controlling factor of the marine phytoplankton production at the Prince Edward Archipelago (Southern Ocean). Mar. Ecol. Prog. Ser. 60: 205-209
Phinney, D. A., Yentsch, C. S. (1983). A novel phytoplankton chlorophyll technique: toward automated analysis. J . Plankton Res. 7: 633-642
Platt. T., Sathyendranath, S. (1988). Oceanic primary produc- tion: estimation by remote sensing at local and regional scales. Science 24 1: 1613-1620
Sheldon, R . W. (1972). Size separation of marine seston by
This article was submitted to the editor
membrane and glass-fiber filters. Lirnnol. Oceanogr. 17: 494-498
Sournia, A. (1973) La production primaire planctonique en Mediterranee. Essai de rnise a jour. Bull. e t . Comm. Medit. Special Issue 5 1-128
Strass, V. H. (1992). Chlorophyll patchiness caused by meso- scale upwelling at fronts. Deep Sea Res. 39: 75-96
Venrick, E. L., Cummings, S. L., Kemper, C. A. (1987). Picoplankton and the resulting bias in chlorophyll re- tained by traditional glass-fiber filters. Deep Sea Res. 34: 1951-1956
Venrick, E. L. , McGowan, J. A., Mantyla, A. W. (1973). Deep maxima of photosynthetic chlorophyll in the Pacific Ocean. Fish. Bull. U.S. 71: 41-52
Yentsch, C. S., Menzel, D. W. (1963). A method for the deter- mination of phytoplankton chlorophyll and phaeophytin by fluorescence. Deep Sea Res. 10: 221-231
Manuscript first received: June 11, 1992 Revised version accepted: December 14, 1992