Page 1
Atmos. Chem. Phys., 15, 2445–2461, 2015
www.atmos-chem-phys.net/15/2445/2015/
doi:10.5194/acp-15-2445-2015
© Author(s) 2015. CC Attribution 3.0 License.
Variability of mixed-phase clouds in the Arctic with a focus
on the Svalbard region: a study based on spaceborne
active remote sensing
G. Mioche1,2, O. Jourdan1,2, M. Ceccaldi3, and J. Delanoë3
1Université Clermont Auvergne, Université Blaise Pascal, OPGC, Laboratoire de Météorologie Physique,
BP 10448, 63000 Clermont-Ferrand, France2CNRS, UMR 6016, LaMP/OPGC, BP80026, 63177 Aubière, France3Laboratoire Atmosphère, Milieux et Observations Spatiales, UVSQ/CNRS/UPMC-IPSL, 78035,
Guyancourt, France
Correspondence to: O. Jourdan ([email protected] )
Received: 16 July 2014 – Published in Atmos. Chem. Phys. Discuss.: 11 September 2014
Revised: 13 January 2015 – Accepted: 9 February 2015 – Published: 5 March 2015
Abstract. The Arctic region is known to be very sensitive to
climate change. Clouds and in particular mixed-phase clouds
(MPCs) remain one of the greatest sources of uncertainties in
the modelling of the Arctic response to climate change due
to an inaccurate representation of their variability and their
quantification. In this study, we present a characterisation of
the vertical, spatial and seasonal variability of Arctic clouds
and MPCs over the entire Arctic region based on satellite
active remote sensing observations. MPC properties in the
region of the Svalbard archipelago (78◦ N, 15◦ E) are also in-
vestigated. The occurrence frequency of clouds and MPCs
are determined from CALIPSO/CLOUDSAT measurements
processed with the DARDAR retrieval algorithm, which al-
low for a reliable cloud thermodynamic phase classification
(warm liquid, supercooled liquid, ice, mixing of ice and su-
percooled liquid). Significant differences are observed be-
tween MPC properties over the entire Arctic region and over
the Svalbard region. Results show that MPCs are encoun-
tered all year long, with a minimum occurrence of 30 % in
winter and 50 % during the rest of the year on average over
the entire Arctic. Over the Svalbard region, MPC occurrence
is more constant with time with larger values (55 %) com-
pared to the average observed in the Arctic. MPCs are es-
pecially located at low altitudes, below 3000 m, where their
frequency of occurrence reaches 90 %, particularly during
winter, spring and autumn. Moreover, results highlight that
MPCs are statistically more frequent above open sea than
land or sea ice. The temporal and spatial distribution of
MPCs over the Svalbard region seems to be linked to the
supply of moister air and warmer water from the North At-
lantic Ocean, which contribute to the initiation of the liquid
water phase. Over the whole Arctic, and particularly in west-
ern regions, the increase of MPC occurrence from spring to
autumn could be connected to the sea ice melting. During
this period, the open water transports some of the warm wa-
ter from the North Atlantic Ocean to the rest of the Arctic
region. This facilitates the vertical transfer of moisture and
thus the persistence of the liquid phase. Particular attention
is also paid to the measurement uncertainties and how they
could affect our conclusions.
1 Introduction
It is now well established that the Arctic region is more sen-
sitive to climate change than any other regions of the world
(Sanderson et al., 2011; Serreze et al., 2009; Solomon et al.,
2007). Solar elevation or surface albedo, for instance, are re-
sponsible for strong feedback mechanisms leading to the so-
called Arctic amplification. Clouds are one of the main com-
ponents driving the Arctic climate system as they play a key
role in the radiation budget (Curry, 1995; Curry et al., 1996;
Garrett et al., 2009). They interact with shortwave and long-
wave radiations, cooling or warming the surface and the at-
Published by Copernicus Publications on behalf of the European Geosciences Union.
Page 2
2446 G. Mioche et al.: Variability of mixed-phase clouds in the Arctic with a focus on the Svalbard region
mosphere depending on their macrophysical and microphys-
ical properties. The low sun elevation in summer and the lack
of solar radiation during the winter polar night are responsi-
ble for the predominant longwave radiative effect in the Arc-
tic (Lubin and Vogelmann, 2006), tending to a regional net
warming effect.
However, our sparse knowledge of cloud-radiation inter-
actions and cloud properties at high latitudes remains one of
the main source of uncertainties in predicting future climate
by numerical simulations (Solomon et al., 2007; Stephens,
2005). In particular, the determination of the cloud thermo-
dynamic phase is crucial for assessing the cloud radiative im-
pact and hence, its influence on the radiation budget and cli-
mate feedbacks (Choi et al., 2014; Komurcu et al., 2014).
In addition, the Arctic is known for the frequent occur-
rence of mixed-phase clouds (hereafter referred to as MPCs)
especially near the surface, wherein liquid droplets and ice
crystals coexist (Curry et al., 2000; Korolev and Isaac, 2003;
Shupe, 2011). In particular, these clouds exert a large in-
fluence on the surface radiation budget Shupe and Intrieri,
2004). However, the inter-annual spatial variability of Arc-
tic MPC properties has been poorly quantified at a large
scale. An assessment of the annual variability of MPCs was
performed during the Surface Heat Budget of the Arctic
Ocean experiment (SHEBA, Uttal et al., 2002), showing
that MPC and liquid-containing clouds are prevalent over
the Western Arctic Ocean. The SHEBA experiment high-
lighted that liquid-containing clouds (i.e. including super-
cooled and warm liquid clouds) over the Beaufort sea repre-
sent about 40 % of the clouds during winter and reach more
than 90 % in summer (Intrieri et al., 2002). Additionally,
Shupe et al. (2006) showed that nearly 60 % of the clouds
in the Arctic are MPCs.
Even though numerous observations, as well as numerical
modelling focused on MPCs for several years (Verlinde et al.,
2007; de Boer et al., 2009; Gayet et al., 2009; Jourdan et al.,
2010; McFarquhar et al., 2011, among others), results still
suffer from large uncertainties and important discrepancies
are observed between observations and simulations (Cher-
nokulsky and Mokhov, 2012; Klein et al., 2009; Morrison et
al., 2009; Thomas et al., 2004).
This implies that our understanding of all steps of the MPC
life cycle needs to be improved. Indeed, formation, devel-
opment, persistence and dissipation of MPCs are governed
by a combination of local and large-scale processes (Morri-
son et al., 2012). At the small scale, the Wegener–Bergeron–
Findeisen (WBF) process is one of the main mechanisms
responsible for ice crystals growth at the expense of super-
cooled water droplets (Bergeron, 1935; Findeisen, 1938; We-
gener, 1911). Such a mechanism leads to a rapid glaciation
of the MPCs. On the other hand, dynamical processes, such
as turbulence or entrainment may facilitate the formation of
new supercooled water droplets. For example, resupply of
water vapour from the surface or from entrainment of mois-
ture above the clouds may contribute to the continuous for-
mation of liquid droplets within MPC. The coupling of such
various processes is, thus, necessary to maintain the unstable
equilibrium between liquid droplets and ice crystals within
MPCs. This may explain the longevity of MPCs, which can
last up to several days or weeks as has been frequently ob-
served (Shupe, 2011; Verlinde et al., 2007; Morrison et al.,
2012). Previous studies from Korolev et al. (2003), Korolev
and Isaac, (2003) and Korolev (2007) also point out that the
lifetime of MPCs could not be simply reduced to the WBF
process, but also depends on numerous parameters such as
local thermodynamical conditions or is linked to cloud dy-
namics. Local and long-range dynamic processes are also in-
volved in aerosol, heat and moisture transport, which have a
significant impact on Arctic MPC formation and properties
(Cesana et al., 2012; Morrison et al., 2012; Shupe and Intri-
eri, 2004). It remains, therefore, difficult to fully understand
the complexity of interactions between all these processes
and to assert which of them play a key role in the MPC evo-
lution (Harrington et al., 1999; Morrison et al., 2012).
The characterisation of the Arctic cloud mixed-phase state
at both global and local scales is not yet accurately described,
since the remote and extreme conditions encountered in this
region of the world remain particularly challenging. For these
reasons observations remain very sparse. Ice crystals and liq-
uid droplets exhibit significantly different microphysical and
optical properties (number, size, shape), leading to differ-
ent interactions with radiation. The impact of mixed-phase
clouds on the energy budget and climate is thus strongly
dependent on the ice/liquid partitioning. Moreover, the de-
termination of separate properties of ice crystals and liq-
uid droplets within the same sample volume remains chal-
lenging due to instrument limitations in both remote sens-
ing and in situ measurements. Moreover, the definition of
the “mixed-phase” state depends strongly on the observation
scale (Baumgardner et al., 2012).
Multi and single-layer clouds are the two main MPC types
frequently observed in the Arctic. Multi-layer MPCs consist
of several supercooled liquid layers embedded in ice clouds
at different altitude levels. Ice crystals precipitate from upper
layers, feeding underneath layers or evaporating during sedi-
mentation, leading to very complex interactions between ice
crystals and droplets (Hobbs and Rangno, 1998; Luo et al.,
2008). On the other hand, the typical single-layer MPC struc-
ture is characterised by the presence of a single supercooled
liquid layer at cloud top and ice crystals below, precipitating
down to the surface (Curry et al., 1997; Shupe et al., 2005;
Verlinde et al., 2007; Gayet et al., 2009). These particular
clouds have been frequently observed in situ in the Arctic at
a smaller scale for several years in previous airborne experi-
ments, such as:
– in 1994, the Beaufort and Arctic Storms Experiment
(BASE, Curry et al. (1997);
Atmos. Chem. Phys., 15, 2445–2461, 2015 www.atmos-chem-phys.net/15/2445/2015/
Page 3
G. Mioche et al.: Variability of mixed-phase clouds in the Arctic with a focus on the Svalbard region 2447
– in 1998, the First International Satellite Cloud Clima-
tology Project (ISCCP) Regional Experiment Arctic
Clouds Experiment (FIRE-ACE, Curry et al., 2000);
– in 2004, the Mixed-Phase Arctic Cloud Experiment (M-
PACE, Verlinde et al., 2007);
– in 2004 and 2007, the Arctic Study of Tropospheric
cloud, Aerosol and Radiation (ASTAR, Gayet et al.,
2009; Jourdan et al., 2010);
– in 2008, the Polar Study using Aircraft, Remote Sensing
Surface Measurements and Models of Climate, Chem-
istry, Aerosols and Transport (POLARCAT, Delanoë et
al. (2013) and the Indirect and Semi-Direct Aerosol
Campaign (ISDAC, McFarquhar et al., 2011);
– in 2010, the Solar Radiation and Phase Discrimination
of Arctic Clouds experiment (SORPIC, Bierwirth et al.,
2013);
– in 2012, the study on the Vertical Distribution of Ice in
Arctic clouds (VERDI, Klingebiel et al., 2015);
– in 2014, the Radiation-Aerosol-Cloud Experiment in
the Arctic Circle (RACEPAC).
However, in situ measurements are by essence localised in
time and space. It is therefore of great importance to know in
which regional framework such observations are performed.
So, a description of Arctic MPCs at regional scale is of ut-
most importance.
Although taking cloud measurements still remains chal-
lenging in this region, important progresses have been made
over several years. In particular, several ground-based obser-
vation sites are now well equipped for cloud observations,
such as Barrow (71◦ N), Eureka (80◦ N), Summit (72◦ N)
or Ny-Ålesund (78◦ N) observatories. However, the instru-
ments of each ground observatory may differ significantly
from one site to another. Indeed, climatologies based on dif-
ferent instruments can be biased by the sensitivity of the in-
struments and their capability to operate in extreme condi-
tions. For instance, it is quite difficult to compare results de-
rived from a lidar and from a cloud radar as they will not be
sensitive to the same hydrometeors. During the past decade,
the emergence of spaceborne observation platforms has pro-
vided a large amount of cloud-related data (Advanced Very
High Resolution radiometer (AVHRR); International Satel-
lite Cloud Climatology Project (ISCCP); Moderate Resolu-
tion Imaging Spectroradiometer (MODIS), A-Train). Unlike
ground-based sites, they present the great advantage to in-
volve a uniform measurement technique with a very large
coverage.
Observations based on passive remote sensing measure-
ments performed by instruments such as AVHRR, ISCCP,
MODIS (Frey et al., 2008; Key and Barry, 1989; Rossow
and Garder, 1993) have well-known limitations in the Arctic
region. Previous studies, based on comparisons with ground-
based observations or spaceborne active remote sensing mea-
surements, highlighted that passive remote sensing observa-
tions might drive to an underestimation of the cloud fraction
by up to 35 % Schweiger and Key, 1992), in particular at low-
level altitudes (Chan and Comiso, 2013). These limitations
are mostly due to the low contrast between clouds and the
underlying surface.
Spaceborne active remote sensing is a recent alternative
measurement technique that aims to reduce these limitations.
This is the case for the new generation of spaceborne in-
strumentation onboard CALIPSO (Winker et al., 2003) and
CLOUDSAT (Stephens et al., 2002) satellites. Since 2006,
they perform lidar (532 nm and 1064 nm) and radar (94 GHz)
measurements, and provide an unprecedented data set of the
vertical structure of clouds, continuously in time and space
(up to latitude 82◦ N), even if these instruments have serious
limitations regarding low clouds and multi-layered clouds, as
it will be discussed below.
The aim of this study is to characterise the vertical, spatial
and seasonal variability of Arctic MPCs at a regional scale
from space remote sensing. A focus on MPC properties in the
area around the Svalbard archipelago (78◦ N, 15◦ E), which
benefits from distinctive meteorological conditions due to the
proximity of the North Atlantic Ocean compared to the rest
of the Arctic, will also be performed. This will enable us
to evaluate to which extent MPCs in this region are repre-
sentative of their counterparts over the entire Arctic. In ad-
dition, this work will give an insight into the representativ-
ity of the numerous airborne cloud measurements made in
this region for several years (ASTAR, POLARCAT, SORPIC
among others).
This work is based on the lidar–radar spaceborne mea-
surements synergy of CALIPSO/CLOUDSAT observations.
Cloud thermodynamic phase and distribution are determined
from DARDAR retrieval products (Delanoë and Hogan,
2008, 2010, and recently Ceccaldi et al., 2013). Then proper-
ties over the Svalbard region are investigated and compared
to those at the regional scale. Section 2 describes the DAR-
DAR retrieval algorithm and presents the data set used and
the method applied to detect MPC and determine cloud oc-
currences. In this section, uncertainties and limitations of
DARDAR retrievals are analysed. In Sect. 3, total cloud oc-
currence determined from DARDAR products is first com-
pared to previous works in order to validate the methodol-
ogy. Then Sect. 4 focuses on mixed-phase clouds variability
at regional scale and over the region of Svalbard. In Sect. 5,
regional and local MPC properties are compared and differ-
ences observed between the whole Arctic and the Svalbard
region are discussed.
www.atmos-chem-phys.net/15/2445/2015/ Atmos. Chem. Phys., 15, 2445–2461, 2015
Page 4
2448 G. Mioche et al.: Variability of mixed-phase clouds in the Arctic with a focus on the Svalbard region
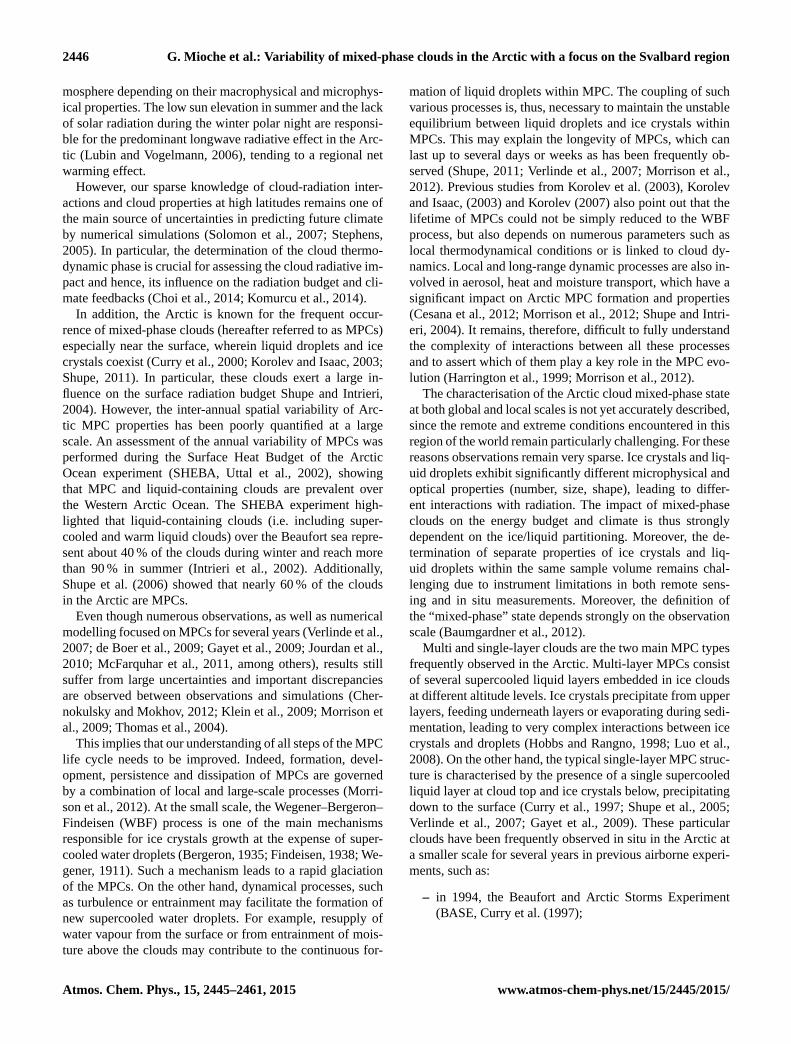
Table 1. DARDAR classes used in V1 version.
Class number Definition
−9 Unknown
−1 Surface and subsurface
0 Clear sky
1 Ice only
2 Ice + supercooled water
3 Warm liquid
4 Supercooled water only
5 Rain or drizzle
6 Aerosols
7 Possibly insects
8 Stratospheric features
2 Data and method
Cloud thermodynamic phase distributions over the Arctic re-
gion are studied using CALIPSO and CLOUDSAT measure-
ments. Active remote sensing observations are expected to
provide a detailed characterisation of the cloud vertical struc-
ture in the Arctic. Indeed, compared to passive instruments,
active remote sensing techniques are less disturbed by the
important Arctic ice cover throughout the year or the lack of
sunlight during the polar night (Chan and Comiso, 2013; Liu
et al., 2010; Wang and Key, 2005).
2.1 DARDAR retrieval algorithm
The present study is based on the operational DARDAR (for
raDAR/liDAR) retrieval products. The DARDAR algorithm
(Delanoë and Hogan, 2008, 2010) exploits the synergy of
CALIPSO and CLOUDSAT observations to retrieve vertical
profiles of cloud thermodynamic phase (DARDAR-MASK
product) and ice cloud properties (DARDAR-CLOUD prod-
uct). These products are now widely used for cloud stud-
ies (Delanoë et al., 2013; Huang et al., 2012; Jouan et al.,
2012, 2014). DARDAR-MASK algorithm uses Level 1B
CALIPSO 532 nm lidar backscatter coefficient profiles, “2B-
GEOPROF” CLOUDSAT 94 GHz radar reflectivity, as well
as thermodynamic variables (pressure, temperature, humid-
ity) from “ECMWF-AUX” products. It presents the great
advantage of being able to merge all of these data on the
same resolution grid and to allow the cloud phase discrimina-
tion. Pixel size along the track is 60 m vertically and 1.7 km
horizontally. The combination of both lidar and radar cloud
masks is used to classify the cloud hydrometeors phase. The
main steps of the algorithm for cloud thermodynamic phase
retrieval are summarised in Fig. 1 and all DARDAR retrieval
classes are summarised in Table 1. This includes surface and
clear sky detection (class−1 and 0 respectively), cloudy pix-
els with ice only (class 1), mixing of ice and supercooled
water (class 2), warm liquid cloud (class 3), supercooled liq-
uid (class 4), rain (class 5) as well as stratospheric features
33
1
2
Figure 1. Representation of the DARDAR algorithm retrieval steps for cloud thermodynamic phase. 3 Figure 1. Representation of the DARDAR algorithm retrieval steps
for cloud thermodynamic phase.
(class 8), and aerosols and insects detection (class 6 and 7
respectively). In particular, a cloud layer is classified as su-
percooled water if its lidar backscatter signal, β, is higher
than 2.10−5 m−1 sr−1 and if it strongly (at least 10 times)
and rapidly (in the next 480 m) attenuates the lidar signal.
Note that the lidar is very sensitive to small drops in high
concentration and therefore the backscattered signal, in pres-
ence of liquid drops, is very high and a strong attenuation
is expected below the backscattering peak. Moreover, to be
classified as supercooled water, a cloud layer needs to be lo-
cated in the temperature range from 0 to −40 ◦C (temper-
ature of homogenous nucleation) and to have a penetration
depth (detected by the lidar) thinner than 300 m. When su-
percooled water is detected, confident detection of cloud fea-
tures by radar (i.e. when CLOUDSAT cloud mask values are
greater than 30, according to Mace (2007)) determines if ice
is present or not in the same sample volume. All cloud fea-
tures with a temperature less than −40 ◦C are considered as
ice. This retrieval technique only works when the lidar is op-
erational.
A complete description of DARDAR algorithm is pre-
sented in Delanoë and Hogan (2008, 2010) and in Cecca-
ldi et al. (2013). Version 1 of DARDAR-MASK (v. 1.1.4),
distributed by the French data centre ICARE, is used in this
study and provides a categorisation of pixels according to the
classes summarised in Table 1.
2.2 Data set and methodology
In this study, mixed-phase clouds are defined based on DAR-
DAR classification. All DARDAR pixels satisfying one of
the following two conditions are assumed to belong to MPCs:
Atmos. Chem. Phys., 15, 2445–2461, 2015 www.atmos-chem-phys.net/15/2445/2015/
Page 5
G. Mioche et al.: Variability of mixed-phase clouds in the Arctic with a focus on the Svalbard region 2449
– they are classified as a mixing of ice and supercooled
water (class 2, see Table 1);
– they are classified as supercooled only (class 4, see Ta-
ble 1) associated with the presence of ice or ice and
supercooled water mixing in the three vertical adjacent
pixels.
Note that “isolated” supercooled water pixels are not classi-
fied as mixed-phase clouds.
The annual and seasonal variability of the total cloud frac-
tion and MPC is investigated using CALIPSO/CLOUDSAT
measurements performed continuously from 2007 to 2010.
In this study the Arctic region is defined by all latitudes
between 60◦ N (Liu et al., 2012) and 82◦ N (upper limit of
CALIPSO/CLOUDSAT measurements) and the Svalbard re-
gion is defined as the area between 0◦ and 30◦ E of longitude
and 75◦ and 80◦ N of latitude.
The spatial frequency of occurrence and vertical distribu-
tions are determined for both total cloud and MPC. The spa-
tial distribution of clouds is studied for altitudes spanning
from 500 m up to 12 km (according to the study of Liu et
al., 2012) as well as for low-level altitudes ranging between
500 m and 3 km (according to Zygmuntowska et al., 2012).
A minimum altitude of 500 m is chosen to avoid surface con-
tamination in the CLOUDSAT data (Marchand et al., 2008)
and also to avoid false water detection (due to the lidar high
backscattered signal from the ground) in the DARDAR al-
gorithm. These instrument shortcomings will be discussed
further in Sect. 2.3. The seasonal occurrence is calculated
for March-April-May (MAM for spring), June-July-August
(JJA for summer), September-October-November (SON for
autumn) and December-January-February (DJF for winter).
The horizontal spatial resolution of cloud occurrence is 5◦
in longitude and 2◦ in latitude and the vertical resolution is
60 m for the profiles.
For each season (or month), cloud and MPC spatial occur-
rences (hereafter FCLOUD and FMPC) in each box of 2◦ lati-
tude (1lat) by 5◦ longitude (1long), are computed accord-
ing to Eq. (1) and (2), where (i,j ) are the latitudes and lon-
gitudes of the CALIPSO/CLOUDSAT granules falling into
the box (1lat width by 1long length). Nfootprints is the total
number of footprints in the box.
FCLOUD(1lat,1long)=
∑i,j
NCLOUD(i,j)
Nfootprints
(1)
FMPC(1lat,1long)=
∑i,j
NMPC(i,j)∑i, j
NCLOUD(i,j)(2)
NCLOUD (i, j) (and NMPC (i, j)) is the occurrence of all clouds
(and MPCs) in the atmospheric column at latitude i and lon-
gitude j , and is defined according to Eq. (3), where zmin and
zmax are the altitude boundaries for occurrence calculation.
zmin = 500 m and zmax = 12 km or 3 km depending on the
altitude range taken into account (all-level or low-level do-
main respectively). nCLOUD (i, j,z) (and nMPC (i, j,z)) refers
to the detection of clouds (and MPCs) at altitude z and coor-
dinates (i,j ). It is equal to 1 if cloud (or MPC) is present, and
0 if not. The presence of cloud (and MPC) is detected in each
atmospheric column if at least three consecutive pixels (i.e.
minimum thickness of 180 m) are classified as cloud (MPC)
by DARDAR.
NCLOUD or MPC(i,j)= 1 if
zmax∑zmin
nCLOUD or MPC(i,j,z)≥ 3
= 0 if
zmax∑zmin
nCLOUD or MPC(i,j,z) < 3
(3)
The vertical distribution of MPC occurrence (hereafter
FMPC(z)) is computed at each altitude level z, according to
Eq. (4) where i and j are the latitudes and longitudes of the
CALIPSO/CLOUDSAT granules falling into the considered
domain, i.e. the Svalbard region (75–80◦ N, 0–30◦ E) or the
whole Arctic region (area between 60◦ N and 82◦ N).
FMPC(z)=
∑i,j
NMPC(i,j,z)∑i,j
NCLOUD(i,j,z)(4)
From Eqs. (1), (2), (3) and (4) on can note that FCLOUD refers
to time and FMPC and FMPC(z) refer to time where cloud
occurs.
2.3 Uncertainties and limitations
Before deriving a climatology of the MPC occurrence, we
first have to keep in mind that our analysis of CALIPSO and
CLOUDSAT observations and therefore DARDAR retrieval
products suffer from uncertainties due to both measurement
technique and the retrieval method. In the following we will
discuss these limitations and their potential impact on the re-
sults presented in this study.
2.3.1 Limitations of observations near the surface
Space remote sensing has inherent and well-known short-
comings near the ground. For example, if the radar clutter
is not properly removed, CLOUDSAT radar ground echoes
lead to an overestimation of low-level cloud amount (Marc-
hand et al., 2008). On the other hand, the probability of total
or partial attenuation of lidar laser beam by upper cloud layer
increases when approaching ground level and could induce
an underestimation of the low-level cloud amount assessed
by the lidar. The difficulty for the DARDAR algorithm to dis-
tinguish ground lidar attenuated backscattering signal from
an overlaying liquid layer is another shortcoming in the re-
trieval method, which can lead to a cloud misclassification.
www.atmos-chem-phys.net/15/2445/2015/ Atmos. Chem. Phys., 15, 2445–2461, 2015
Page 6
2450 G. Mioche et al.: Variability of mixed-phase clouds in the Arctic with a focus on the Svalbard region
The final impact (overestimation or underestimation) of these
different issues on low-level cloud occurrence remains uncer-
tain.
Ground contamination on CLOUDSAT data
As described in Sect. 2.2., a minimum altitude threshold
of 500 m is chosen to compute cloud occurrence. However,
ground contamination could also affect CLOUDSAT cloud
detection measurements above an altitude of 500 m.
We recall that the DARDAR MASK algorithm is based
on the CLOUDSAT cloud mask (and also the CALIPSO li-
dar mask) to classify pixels as clouds (Delanoë and Hogan,
2010). Regarding CLOUDSAT measurements, a pixel is con-
sidered as cloud if its radar mask reports a value of 30 or
greater (indicating a high confidence in the cloud detection,
according to Mace, 2007). Values smaller than this thresh-
old are considered inaccurate and possibly contaminated by
ground echoes. Therefore, DARDAR MASK algorithm ex-
cludes data contaminated by ground. This implies that the
data set is reduced between 500 m and 1000 m. The fraction
of reliable data (clear sky or atmospheric features) has been
determined and represents about 40 % of the total data in this
altitude range. The remaining 60 % correspond to data as-
signed either to ground contamination on radar data (70 %)
or to lidar total attenuation (30 %). This result gives an in-
sight on how ground contamination affects the observations
and reduces the data set in the 500 m–1 km altitude range.
Moreover, in previous studies, Kay and Gettelman (2009)
used a detection altitude limit of 720 m to prevent false de-
tection. On the other hand, Huang et al. (2012) showed that
DARDAR data between 700 m and 1000 m were reliable for
cloud occurrence determination. In the present study, a short
sensitivity test is made by computing cloud occurrences with
a threshold of 1000 m in order to check differences with the
occurrences obtained with a 500 m altitude threshold. As ex-
pected, the use of a 1000 m threshold leads to a decrease of
the cloud occurrences compared to a 500 m threshold. Differ-
ences lie between 4 % and 18 % depending on the cloud type
and the altitude domain considered. These results are consis-
tent with similar tests made on CALIPSO/CLOUDSAT stan-
dard NASA products by Zygmuntowska et al. (2012), show-
ing that FCLOUD derived with a 1000 m minimum altitude
threshold is smaller than the FCLOUD derived with a 500 m
minimum altitude threshold by up to 26 %.
Comparisons with ground-based observations
The unique way to accurately assess and quantify the limita-
tions of DARDAR products in the low-level altitude domain
is to compare them with collocated ground-based measure-
ments. Such a work has been recently done by Blanchard
et al. (2014). They directly compared ground-based obser-
vations at the Eureka Arctic station, located in the Canadian
archipelago (80.2◦ N, 86.2◦W, Nunavut, Canada), with col-
34
1
2
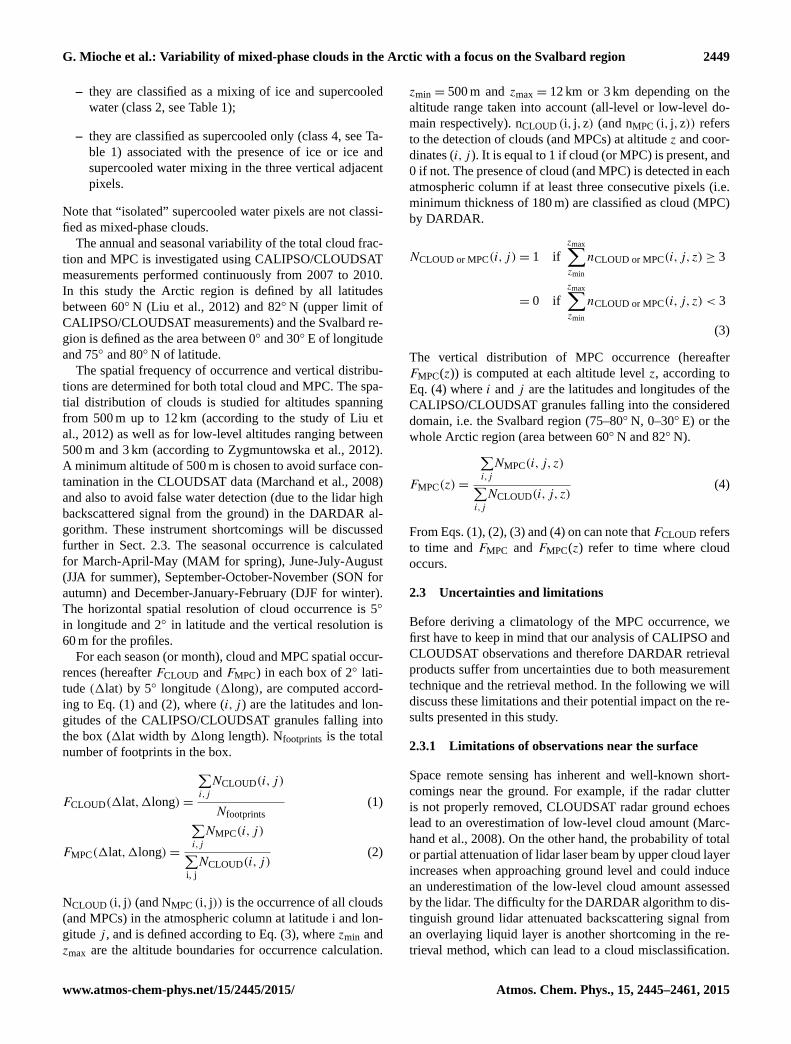
Figure 2. Vertical profiles of cloud occurrences over the Ny-Alesund station during March and 3
April 2007. The black line refers to ground based lidar observations at 1 km vertical resolution 4
(Hoffmann et al., 2009) and coloured lines refer to a DARDAR product according to different 5
configurations and settings. DARDAR retrievals have a vertical resolution of 6 0m on the left panel 6
and 1 km on the right panel. 7
Figure 2. Vertical profiles of cloud occurrences over the Ny-
Ålesund station during March and April 2007. The black line refers
to ground-based lidar observations at 1 km vertical resolution (Hoff-
mann et al., 2009) and the coloured lines refer to a DARDAR prod-
uct, according to different configurations and settings. DARDAR
retrievals have a vertical resolution of 60 m on the left panel and
1 km on the right panel.
located A-Train observations and DARDAR products (V1
version). They performed a detailed study on cloud fraction
and vertical distribution over the Eureka station, identifying
and quantifying uncertainties and limitations of A-Train ob-
servations and DARDAR products. The largest differences
occur below 2 km of altitude. The cloud fraction derived from
spaceborne observations is lower than the one obtained from
ground-based observations by 10 % in the 500–1000 m alti-
tude domain and by up to 25 % at the 0–500 m altitude do-
main (see Fig. 5 from Blanchard et al., 2014). These differ-
ences are mainly attributed to undetected low-level clouds
due to sensitivity loss of CALIOP lidar and surface proxim-
ity for CLOUDSAT radar, but also to the distance between
satellites tracks and the ground station. Moreover, near the
surface, ground-based measurements may be affected by lo-
cal effects and cloud fraction may be overestimated by the
presence of ice crystals or diamond dust close to the ground
that are classified as clouds, as confirmed by in Shupe (2011)
and Bourdages et al. (2009).
To complement the study of Blanchard et al. (2014) a
short comparison is made between the occurrence of low-
level clouds using the DARDAR product and the one derived
from ground-based locations available in previous studies.
Figure 2 shows the comparison of the vertical profile of
cloud occurrence from the DARDAR product (with various
configurations and different settings, cf. legend of the fig-
ure) with that from Ny-Ålesund ground-based observations
(Micro Pulse Lidar (MPL) measurements during March and
Atmos. Chem. Phys., 15, 2445–2461, 2015 www.atmos-chem-phys.net/15/2445/2015/
Page 7
G. Mioche et al.: Variability of mixed-phase clouds in the Arctic with a focus on the Svalbard region 2451
35
1
Figure 3. Seasonal occurrence of MPCs over the Eureka station from June 2006 to December 2007 2
from ground based observations (blue line from De Boer et al., (2009)) and from DARDAR product 3
(green and red lines). 4
5
6
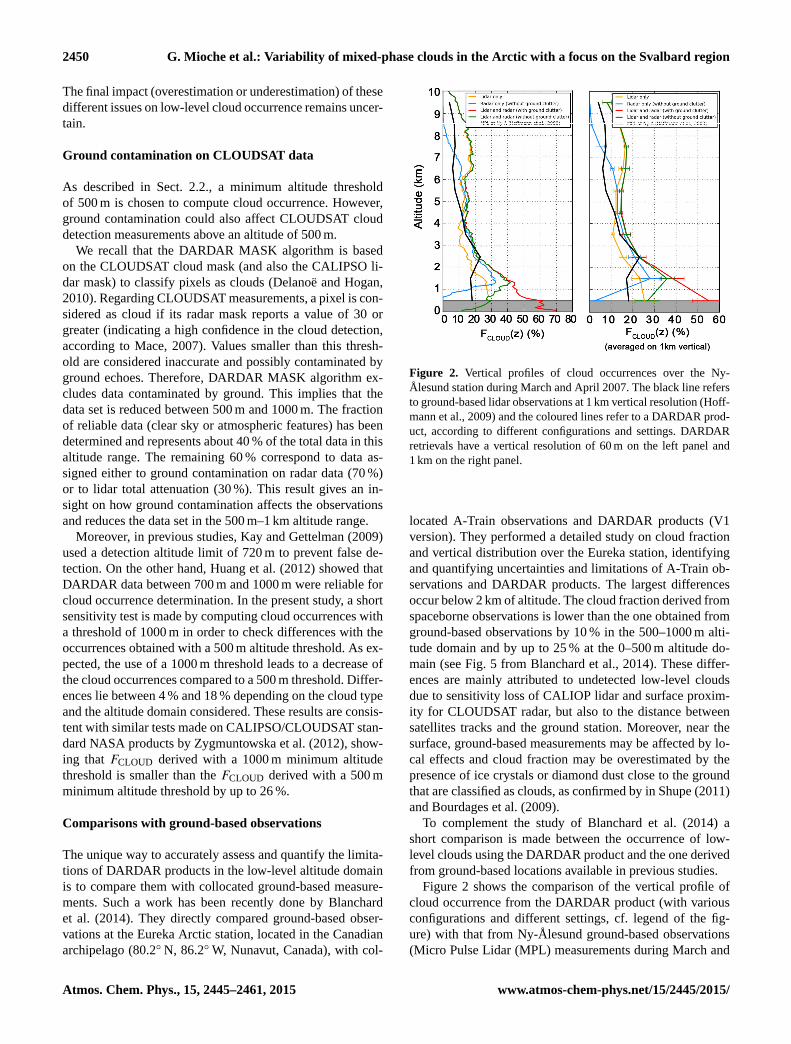
Figure 3. Seasonal occurrence of MPCs over the Eureka station
from June 2006 to December 2007 from ground-based observations
(blue line from De Boer et al., 2009) and from DARDAR product
(green and red lines).
April 2007, see Hoffmann et al., 2009). Figure 2a displays
DARDAR profiles at the original vertical resolution (60 m).
In Fig. 2b the DARDAR profiles are shown with 1 km verti-
cal resolution, to be consistent with the measurements per-
formed by Hoffmann et al. (2009). Above approximately
5 km, DARDAR detects more cloud than the ground-based
lidar. This is due to the attenuation of the ground-based lidar
signal at high altitude levels. A proportion of high clouds,
probably the optically thin ones, are also missed when con-
sidering radar measurements alone. These results are in
agreement with those presented in Blanchard et al. (2014).
Between 2 and 5 km, space and ground-based observations
agree quite well, as also shown in Blanchard et al. (2014).
Below 2 km, cloud occurrences from space observations are
larger than from ground based by about 20 % between 1 km
and 2 km, and by about 10 % below 1 km. One can also note
that if ground clutter is not removed (red curve), cloud frac-
tion may be greatly overestimated by up to 40 %.
Figure 3 displays ground-based observations of the single-
layer MPC seasonal occurrence over the Eureka station (from
de Boer et al. (2009), blue line) as well as the one derived
from DARDAR products (red and green lines). The results
show that DARDAR and ground-based observations are in
good agreement, in particular regarding the annual variabil-
ity. The maximum discrepancies (5 %) occur in autumn even
though no systematic bias can be identified. One can also
note that the choice of a 500 m or 0 m minimum altitude
threshold on DARDAR data does not significantly impact the
cloud occurrence.
These results show that the variability of FCLOUD or FMPC
determined from space observations agree well with ground-
based observations. However, and in contrast to the results of
Blanchard et al. (2014), our results do not highlight a system-
atic bias in the low-level cloud amount retrieved from space
observations. It may be due to the small data set used for
the comparisons (two months and several seasons), to the
accuracy of the colocalisation in space or also due to the
differences in the cloud and MPC occurrence determination
method. It is obvious that a more detailed study based on
comparisons of space and ground-based observations aiming
to quantify the uncertainties in the low-level cloud amount is
36
1
2
Figure 4. a) Absolute differences in % of occurrence between occurrences computed from V1 and 3
V2 DARDAR products for total cloud, MPC and MPC-IB and b) Mean vertical profiles of clouds, 4
MPC, MPC-IB and ice clouds occurrences computed from V1 (blue lines) and V2 (red lines) 5
DARDAR products for April 2007 over the Svalbard region. Filled areas represent the standard 6
deviation. 7
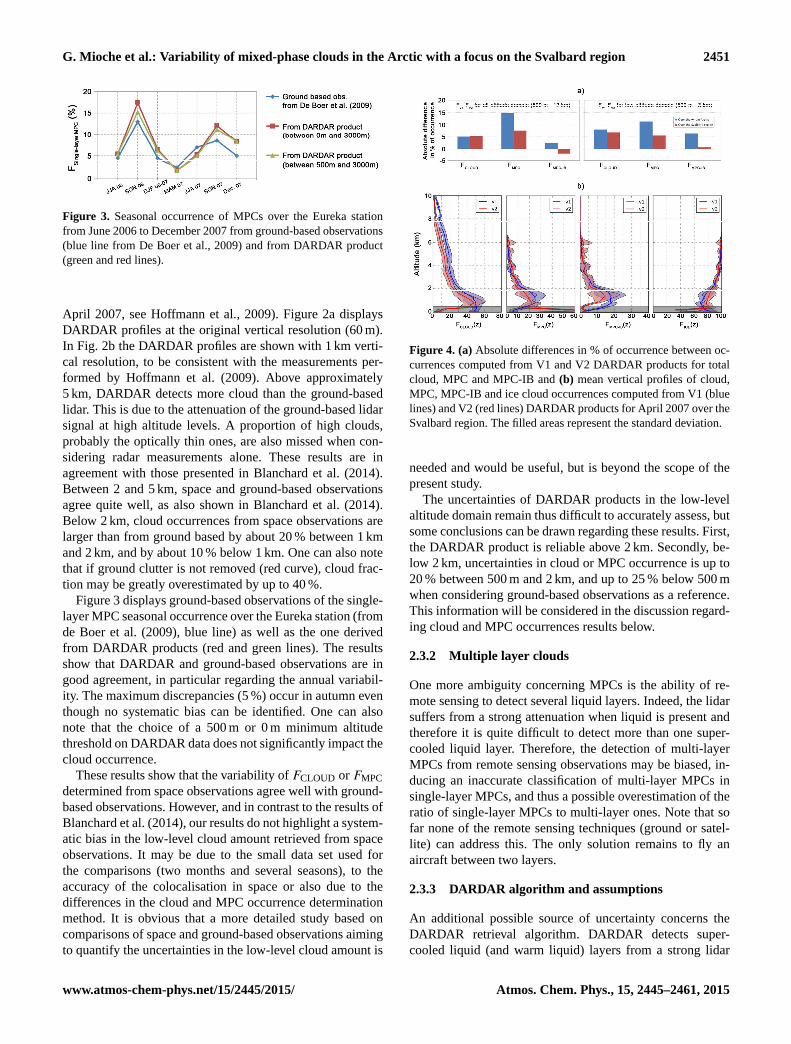
Figure 4. (a) Absolute differences in % of occurrence between oc-
currences computed from V1 and V2 DARDAR products for total
cloud, MPC and MPC-IB and (b) mean vertical profiles of cloud,
MPC, MPC-IB and ice cloud occurrences computed from V1 (blue
lines) and V2 (red lines) DARDAR products for April 2007 over the
Svalbard region. The filled areas represent the standard deviation.
needed and would be useful, but is beyond the scope of the
present study.
The uncertainties of DARDAR products in the low-level
altitude domain remain thus difficult to accurately assess, but
some conclusions can be drawn regarding these results. First,
the DARDAR product is reliable above 2 km. Secondly, be-
low 2 km, uncertainties in cloud or MPC occurrence is up to
20 % between 500 m and 2 km, and up to 25 % below 500 m
when considering ground-based observations as a reference.
This information will be considered in the discussion regard-
ing cloud and MPC occurrences results below.
2.3.2 Multiple layer clouds
One more ambiguity concerning MPCs is the ability of re-
mote sensing to detect several liquid layers. Indeed, the lidar
suffers from a strong attenuation when liquid is present and
therefore it is quite difficult to detect more than one super-
cooled liquid layer. Therefore, the detection of multi-layer
MPCs from remote sensing observations may be biased, in-
ducing an inaccurate classification of multi-layer MPCs in
single-layer MPCs, and thus a possible overestimation of the
ratio of single-layer MPCs to multi-layer ones. Note that so
far none of the remote sensing techniques (ground or satel-
lite) can address this. The only solution remains to fly an
aircraft between two layers.
2.3.3 DARDAR algorithm and assumptions
An additional possible source of uncertainty concerns the
DARDAR retrieval algorithm. DARDAR detects super-
cooled liquid (and warm liquid) layers from a strong lidar
www.atmos-chem-phys.net/15/2445/2015/ Atmos. Chem. Phys., 15, 2445–2461, 2015
Page 8
2452 G. Mioche et al.: Variability of mixed-phase clouds in the Arctic with a focus on the Svalbard region
backscatter signal (see Fig. 1). But some additional pixels
with a strong backscatter signal located above and below the
liquid layer can also be misclassified as liquid. So, these ad-
ditional supercooled pixels may lead to an overestimation
of supercooled liquid water occurrence and supercooled liq-
uid layers thickness. The present study uses version 1 of the
DARDAR products, but a new algorithm (Ceccaldi et al.,
2013) is expected to remove these additional pixels, which
may be currently included in version 1 of DARDAR MASK.
The detailed study by Ceccaldi et al. (2013) showed that ice
fraction will increase by a factor of about 15 % in the future
version 2, associated to a decrease of the supercooled water
fraction (up to 25 %), as compared to version 1. Therefore,
version 1 may overestimate supercooled liquid layers thick-
ness, and thus also the occurrence of mixed-phase clouds.
However, the DARDAR V2 product is currently not avail-
able for the entire CALIPSO/CLOUDSAT data set, and the
results from Ceccaldi et al. (2013) are based on one case
study and 3 months of data only. So, in order to quantify
how these differences can affect the results of the present
study, comparisons are performed between the two product
versions over 1 month of data (April 2007). Figure 4a shows
differences between the two versions in terms of FCLOUD,
FMPC and FMPC-IB for the low-level and the all-level altitude
domains. Differences lie between 3 and 15 % for the whole
Arctic, and between−2 and 8 % on the Svalbard region. Fig-
ure 4b presents the mean vertical profiles extracted from both
data versions. The trends are similar but V2 present smaller
values for clouds and MPC by about 5 % whereas the ice
phase is larger by around 5–10 % in V2.
At last, as shown in Fig. 1, supercooled and mixed-phase
pixels detection from the DARDAR algorithm is dependent
on the a priori threshold considered for variables such as tem-
perature or layer thickness. In particular, temperature is de-
termined based on ECMWF reanalysis, and its accuracy may
be a source of error in supercooled liquid retrieval algorithm.
However, the ECMWF temperature uncertainty is estimated
to 0.6 K (Benedetti, 2005), which is considered to be accept-
able by Delanoë and Hogan (2010).
The Arctic region is considered northward 60◦ N in this
study, as done in several previous studies (Cesana et al.,
2012; Chernokulsky and Mokhov, 2012; Liu et al., 2012
among others). However, no real definition of the Arctic re-
gion is truly established, and some authors use a different
limit, such as 65◦ N (Kay and Gettelman, 2009; Nygård et
al., 2014), 68◦ N (Zygmuntowska et al., 2012) or 70◦ N (de
Boer et al., 2012). These latitude boundaries were tested
(not shown here) and the differences observed on clouds and
MPCs occurrence are not significant since they vary only by
a few percent (by less than 5 % between 60 and 70◦ N limits).
37
1
Figure 5. Monthly total cloud occurrence in the Arctic from ground and spaceborne remote sensing 2
observations: a) over the entire Arctic region and western Arctic ground based sites; b) over the 3
Svalbard region. 4
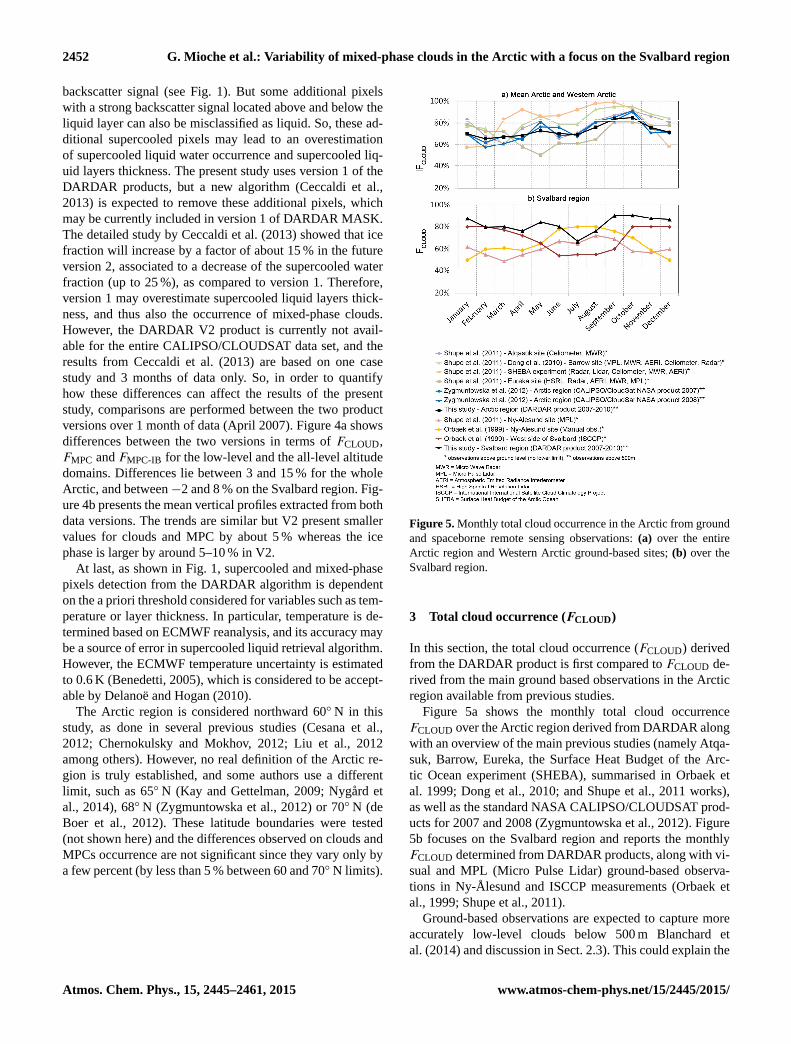
Figure 5. Monthly total cloud occurrence in the Arctic from ground
and spaceborne remote sensing observations: (a) over the entire
Arctic region and Western Arctic ground-based sites; (b) over the
Svalbard region.
3 Total cloud occurrence (FCLOUD)
In this section, the total cloud occurrence (FCLOUD) derived
from the DARDAR product is first compared to FCLOUD de-
rived from the main ground based observations in the Arctic
region available from previous studies.
Figure 5a shows the monthly total cloud occurrence
FCLOUD over the Arctic region derived from DARDAR along
with an overview of the main previous studies (namely Atqa-
suk, Barrow, Eureka, the Surface Heat Budget of the Arc-
tic Ocean experiment (SHEBA), summarised in Orbaek et
al. 1999; Dong et al., 2010; and Shupe et al., 2011 works),
as well as the standard NASA CALIPSO/CLOUDSAT prod-
ucts for 2007 and 2008 (Zygmuntowska et al., 2012). Figure
5b focuses on the Svalbard region and reports the monthly
FCLOUD determined from DARDAR products, along with vi-
sual and MPL (Micro Pulse Lidar) ground-based observa-
tions in Ny-Ålesund and ISCCP measurements (Orbaek et
al., 1999; Shupe et al., 2011).
Ground-based observations are expected to capture more
accurately low-level clouds below 500 m Blanchard et
al. (2014) and discussion in Sect. 2.3). This could explain the
Atmos. Chem. Phys., 15, 2445–2461, 2015 www.atmos-chem-phys.net/15/2445/2015/
Page 9
G. Mioche et al.: Variability of mixed-phase clouds in the Arctic with a focus on the Svalbard region 2453
38
1
2
Figure 6. Stereographic projections of the seasonal occurrence of: a) all clouds (referring to time) 3
and b) MPCs (referring to clouds). Occurrences are computed taking into account the 500m to 4
12000m altitude range. 5
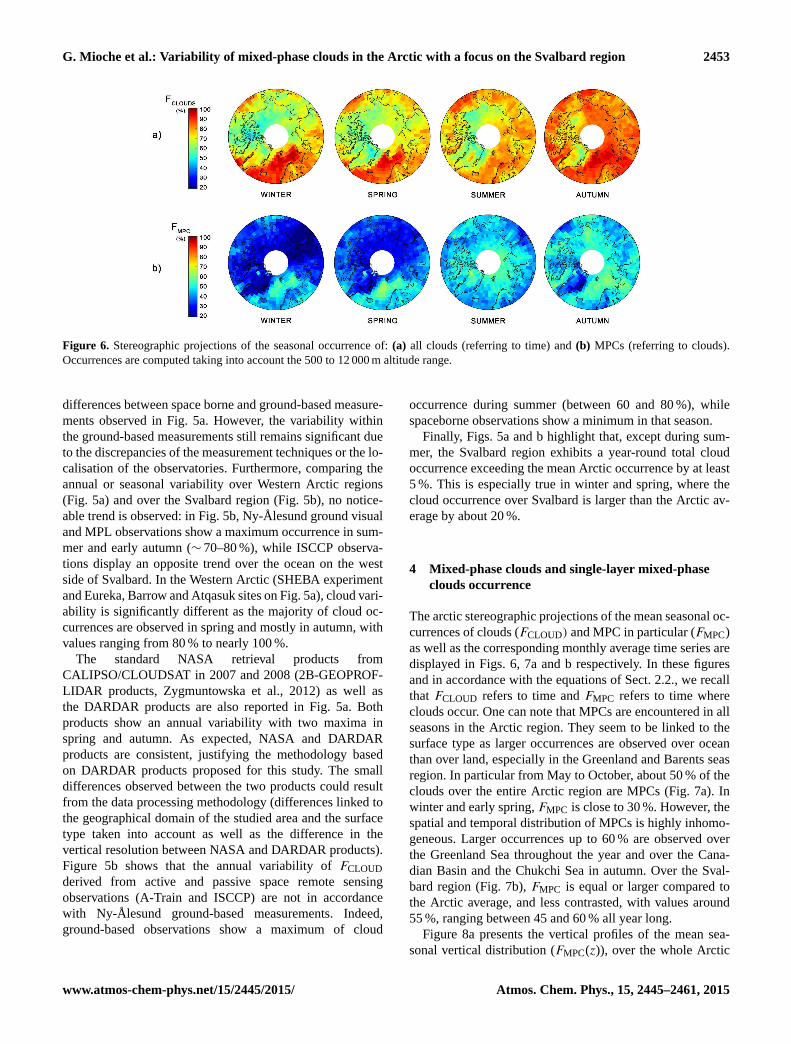
Figure 6. Stereographic projections of the seasonal occurrence of: (a) all clouds (referring to time) and (b) MPCs (referring to clouds).
Occurrences are computed taking into account the 500 to 12 000 m altitude range.
differences between space borne and ground-based measure-
ments observed in Fig. 5a. However, the variability within
the ground-based measurements still remains significant due
to the discrepancies of the measurement techniques or the lo-
calisation of the observatories. Furthermore, comparing the
annual or seasonal variability over Western Arctic regions
(Fig. 5a) and over the Svalbard region (Fig. 5b), no notice-
able trend is observed: in Fig. 5b, Ny-Ålesund ground visual
and MPL observations show a maximum occurrence in sum-
mer and early autumn (∼ 70–80 %), while ISCCP observa-
tions display an opposite trend over the ocean on the west
side of Svalbard. In the Western Arctic (SHEBA experiment
and Eureka, Barrow and Atqasuk sites on Fig. 5a), cloud vari-
ability is significantly different as the majority of cloud oc-
currences are observed in spring and mostly in autumn, with
values ranging from 80 % to nearly 100 %.
The standard NASA retrieval products from
CALIPSO/CLOUDSAT in 2007 and 2008 (2B-GEOPROF-
LIDAR products, Zygmuntowska et al., 2012) as well as
the DARDAR products are also reported in Fig. 5a. Both
products show an annual variability with two maxima in
spring and autumn. As expected, NASA and DARDAR
products are consistent, justifying the methodology based
on DARDAR products proposed for this study. The small
differences observed between the two products could result
from the data processing methodology (differences linked to
the geographical domain of the studied area and the surface
type taken into account as well as the difference in the
vertical resolution between NASA and DARDAR products).
Figure 5b shows that the annual variability of FCLOUD
derived from active and passive space remote sensing
observations (A-Train and ISCCP) are not in accordance
with Ny-Ålesund ground-based measurements. Indeed,
ground-based observations show a maximum of cloud
occurrence during summer (between 60 and 80 %), while
spaceborne observations show a minimum in that season.
Finally, Figs. 5a and b highlight that, except during sum-
mer, the Svalbard region exhibits a year-round total cloud
occurrence exceeding the mean Arctic occurrence by at least
5 %. This is especially true in winter and spring, where the
cloud occurrence over Svalbard is larger than the Arctic av-
erage by about 20 %.
4 Mixed-phase clouds and single-layer mixed-phase
clouds occurrence
The arctic stereographic projections of the mean seasonal oc-
currences of clouds (FCLOUD) and MPC in particular (FMPC)
as well as the corresponding monthly average time series are
displayed in Figs. 6, 7a and b respectively. In these figures
and in accordance with the equations of Sect. 2.2., we recall
that FCLOUD refers to time and FMPC refers to time where
clouds occur. One can note that MPCs are encountered in all
seasons in the Arctic region. They seem to be linked to the
surface type as larger occurrences are observed over ocean
than over land, especially in the Greenland and Barents seas
region. In particular from May to October, about 50 % of the
clouds over the entire Arctic region are MPCs (Fig. 7a). In
winter and early spring, FMPC is close to 30 %. However, the
spatial and temporal distribution of MPCs is highly inhomo-
geneous. Larger occurrences up to 60 % are observed over
the Greenland Sea throughout the year and over the Cana-
dian Basin and the Chukchi Sea in autumn. Over the Sval-
bard region (Fig. 7b), FMPC is equal or larger compared to
the Arctic average, and less contrasted, with values around
55 %, ranging between 45 and 60 % all year long.
Figure 8a presents the vertical profiles of the mean sea-
sonal vertical distribution (FMPC(z)), over the whole Arctic
www.atmos-chem-phys.net/15/2445/2015/ Atmos. Chem. Phys., 15, 2445–2461, 2015
Page 10
2454 G. Mioche et al.: Variability of mixed-phase clouds in the Arctic with a focus on the Svalbard region
39
1
2
3
Figure 7. Monthly total MPC (a and b) and low-level MPC (c and d) occurrence, and ratio of low-4
level MPCs over total MPCs (e and f) over the whole Arctic region (left side panels) and over the 5
Svalbard region (right side panels). 6
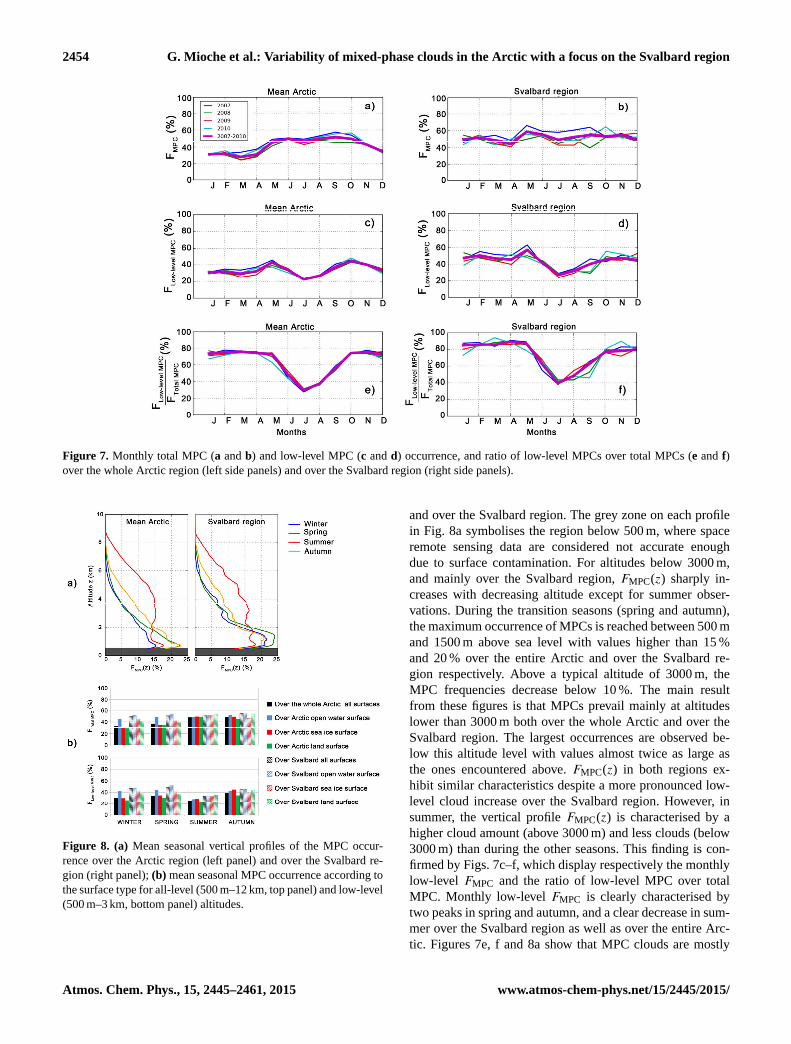
Figure 7. Monthly total MPC (a and b) and low-level MPC (c and d) occurrence, and ratio of low-level MPCs over total MPCs (e and f)
over the whole Arctic region (left side panels) and over the Svalbard region (right side panels).
40
1
Figure 8. a) Mean seasonal vertical profiles of the MPC occurrence over the Arctic region (left 2
panel) and over the Svalbard region (right panel); b) Mean seasonal MPC occurrence according to 3
the surface type for all-level (500m-12km, top panel) and low-level (500m-3km, bottom panel) 4
altitudes. 5
Figure 8. (a) Mean seasonal vertical profiles of the MPC occur-
rence over the Arctic region (left panel) and over the Svalbard re-
gion (right panel); (b) mean seasonal MPC occurrence according to
the surface type for all-level (500 m–12 km, top panel) and low-level
(500 m–3 km, bottom panel) altitudes.
and over the Svalbard region. The grey zone on each profile
in Fig. 8a symbolises the region below 500 m, where space
remote sensing data are considered not accurate enough
due to surface contamination. For altitudes below 3000 m,
and mainly over the Svalbard region, FMPC(z) sharply in-
creases with decreasing altitude except for summer obser-
vations. During the transition seasons (spring and autumn),
the maximum occurrence of MPCs is reached between 500 m
and 1500 m above sea level with values higher than 15 %
and 20 % over the entire Arctic and over the Svalbard re-
gion respectively. Above a typical altitude of 3000 m, the
MPC frequencies decrease below 10 %. The main result
from these figures is that MPCs prevail mainly at altitudes
lower than 3000 m both over the whole Arctic and over the
Svalbard region. The largest occurrences are observed be-
low this altitude level with values almost twice as large as
the ones encountered above. FMPC(z) in both regions ex-
hibit similar characteristics despite a more pronounced low-
level cloud increase over the Svalbard region. However, in
summer, the vertical profile FMPC(z) is characterised by a
higher cloud amount (above 3000 m) and less clouds (below
3000 m) than during the other seasons. This finding is con-
firmed by Figs. 7c–f, which display respectively the monthly
low-level FMPC and the ratio of low-level MPC over total
MPC. Monthly low-level FMPC is clearly characterised by
two peaks in spring and autumn, and a clear decrease in sum-
mer over the Svalbard region as well as over the entire Arc-
tic. Figures 7e, f and 8a show that MPC clouds are mostly
Atmos. Chem. Phys., 15, 2445–2461, 2015 www.atmos-chem-phys.net/15/2445/2015/
Page 11
G. Mioche et al.: Variability of mixed-phase clouds in the Arctic with a focus on the Svalbard region 2455
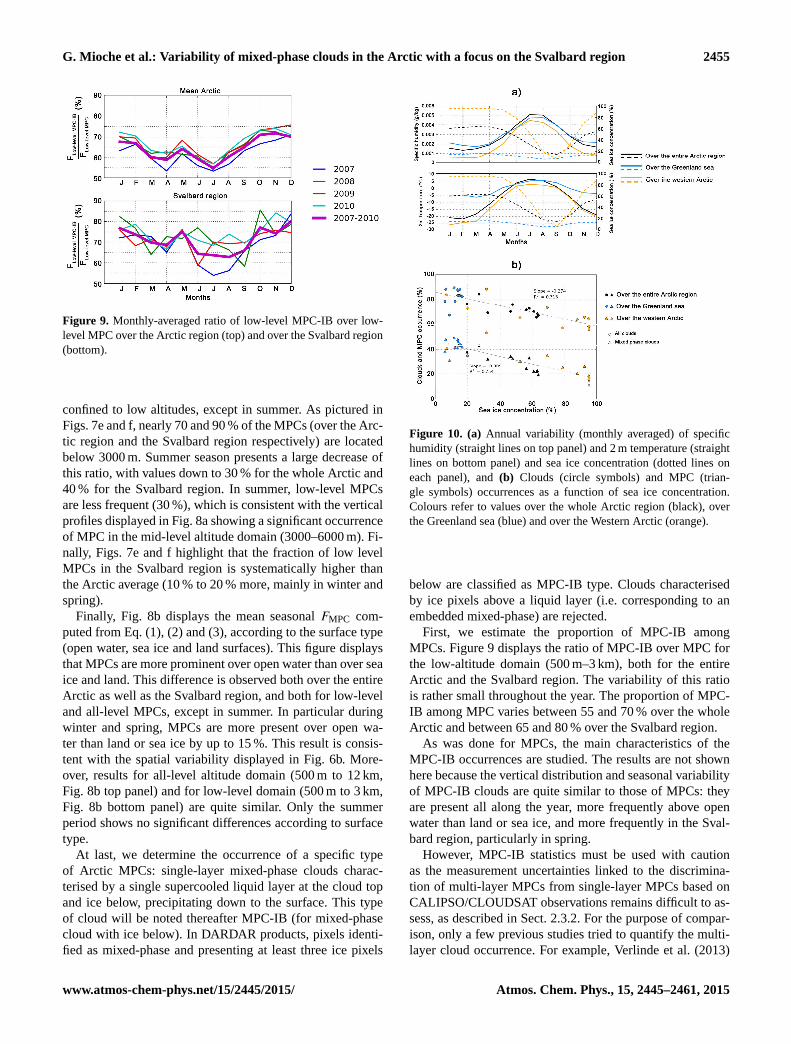
Figure 9. Monthly-averaged ratio of low-level MPC-IB over low-
level MPC over the Arctic region (top) and over the Svalbard region
(bottom).
confined to low altitudes, except in summer. As pictured in
Figs. 7e and f, nearly 70 and 90 % of the MPCs (over the Arc-
tic region and the Svalbard region respectively) are located
below 3000 m. Summer season presents a large decrease of
this ratio, with values down to 30 % for the whole Arctic and
40 % for the Svalbard region. In summer, low-level MPCs
are less frequent (30 %), which is consistent with the vertical
profiles displayed in Fig. 8a showing a significant occurrence
of MPC in the mid-level altitude domain (3000–6000 m). Fi-
nally, Figs. 7e and f highlight that the fraction of low level
MPCs in the Svalbard region is systematically higher than
the Arctic average (10 % to 20 % more, mainly in winter and
spring).
Finally, Fig. 8b displays the mean seasonal FMPC com-
puted from Eq. (1), (2) and (3), according to the surface type
(open water, sea ice and land surfaces). This figure displays
that MPCs are more prominent over open water than over sea
ice and land. This difference is observed both over the entire
Arctic as well as the Svalbard region, and both for low-level
and all-level MPCs, except in summer. In particular during
winter and spring, MPCs are more present over open wa-
ter than land or sea ice by up to 15 %. This result is consis-
tent with the spatial variability displayed in Fig. 6b. More-
over, results for all-level altitude domain (500 m to 12 km,
Fig. 8b top panel) and for low-level domain (500 m to 3 km,
Fig. 8b bottom panel) are quite similar. Only the summer
period shows no significant differences according to surface
type.
At last, we determine the occurrence of a specific type
of Arctic MPCs: single-layer mixed-phase clouds charac-
terised by a single supercooled liquid layer at the cloud top
and ice below, precipitating down to the surface. This type
of cloud will be noted thereafter MPC-IB (for mixed-phase
cloud with ice below). In DARDAR products, pixels identi-
fied as mixed-phase and presenting at least three ice pixels
42
1
Figure 10. a) Annual variability (monthly averaged) of specific humidity (straight lines on top 2
panel) and 2m temperature (straight lines on bottom panel) and sea ice concentration (dotted lines 3
on each panel), and b) Clouds (circle symbols) and MPC (triangle symbols) occurrences as a 4
function of sea ice concentration. Colors refer to values over the whole Arctic region (black), over 5
the Greenland sea (blue) and over the Western Arctic (orange). 6
Figure 10. (a) Annual variability (monthly averaged) of specific
humidity (straight lines on top panel) and 2 m temperature (straight
lines on bottom panel) and sea ice concentration (dotted lines on
each panel), and (b) Clouds (circle symbols) and MPC (trian-
gle symbols) occurrences as a function of sea ice concentration.
Colours refer to values over the whole Arctic region (black), over
the Greenland sea (blue) and over the Western Arctic (orange).
below are classified as MPC-IB type. Clouds characterised
by ice pixels above a liquid layer (i.e. corresponding to an
embedded mixed-phase) are rejected.
First, we estimate the proportion of MPC-IB among
MPCs. Figure 9 displays the ratio of MPC-IB over MPC for
the low-altitude domain (500 m–3 km), both for the entire
Arctic and the Svalbard region. The variability of this ratio
is rather small throughout the year. The proportion of MPC-
IB among MPC varies between 55 and 70 % over the whole
Arctic and between 65 and 80 % over the Svalbard region.
As was done for MPCs, the main characteristics of the
MPC-IB occurrences are studied. The results are not shown
here because the vertical distribution and seasonal variability
of MPC-IB clouds are quite similar to those of MPCs: they
are present all along the year, more frequently above open
water than land or sea ice, and more frequently in the Sval-
bard region, particularly in spring.
However, MPC-IB statistics must be used with caution
as the measurement uncertainties linked to the discrimina-
tion of multi-layer MPCs from single-layer MPCs based on
CALIPSO/CLOUDSAT observations remains difficult to as-
sess, as described in Sect. 2.3.2. For the purpose of compar-
ison, only a few previous studies tried to quantify the multi-
layer cloud occurrence. For example, Verlinde et al. (2013)
www.atmos-chem-phys.net/15/2445/2015/ Atmos. Chem. Phys., 15, 2445–2461, 2015
Page 12
2456 G. Mioche et al.: Variability of mixed-phase clouds in the Arctic with a focus on the Svalbard region
and Intrieri et al. (2002) describe that multi-layer clouds may
be as frequent as single-layer clouds.
5 Discussion
In this study, the spatial and vertical occurrence of Arctic
MPCs at the regional scale has been assessed. The results
highlight that the Arctic, and particularly the Svalbard area,
is a very favourable region for the formation and the evolu-
tion of MPCs and MPC-IB. However, all the processes con-
trolling the MPC life cycle remain difficult to understand.
Indeed, these processes are numerous and occur at different
spatial and temporal scales, leading to complex interactions
between them (Morrison et al., 2012). Additionally, the Arc-
tic region benefits from peculiar meteorological conditions
(Orbaek et al., 1999) and large-scale atmospheric circulation
patterns.
The larger MPC and MPC-IB occurrences observed over
the Svalbard compared to the Arctic average may be linked
to the contribution of the humid air and warmer water trans-
ported from the North Atlantic Ocean. This specific synoptic
regime brings to the Svalbard region (and region of Green-
land sea) more moisture as compared to the rest of the Arc-
tic (Serreze and Barry, 2005). Thus cloud formation and its
development can be amplified, since the supply of moisture
by the North Atlantic Ocean is favourable for the nucleation
of liquid droplets. The initiation of new supercooled liquid
droplets will balance the loss due to the WBF process within
the MPCs, and therefore participate to maintain the equilib-
rium between ice and supercooled droplets. However, mois-
ture is not sufficient by itself to maintain the ice–liquid equi-
librium. As shown in Korolev et al. (2003), Korolev (2007)
and Morrison et al. (2012), it has to be coupled with dynam-
ics processes, such as updraft from cloud base, or turbulence
and entrainment at cloud top. Moreover, winter and transi-
tion seasons are characterised most of the time by stable
atmospheric conditions (Orbaek et al., 1999), coupled with
a temperature range favourable for mixed-phase conditions.
These conditions associated with temperature and eventually
humidity inversions at the cloud top, which frequently occur
in these seasons (Nygård et al., 2014; Sedlar et al., 2012), can
contribute to the containment of Arctic clouds and MPCs at
low altitudes by limiting their vertical extension. The sum-
mer and autumn seasons exhibit large occurrence values for
MPCs in the Western Arctic (Chukchi and Canadian seas,
Fig. 3a). During these seasons, the large open seas enable the
warm water to be transported across the Arctic, resulting in
warm and moist air advection in the Western Arctic. Open
water facilitates the vertical transfer of moisture, responsible
for an increase of cloud formation as compared to sea ice,
which could explain the prevalence of MPCs during this pe-
riod in the Western Arctic.
In an attempt to strengthen this assumption and to bring
perspective to this work, a short analysis of the variability
of sea ice extent is done and its potential link with humid-
ity, temperature and cloud occurrence is investigated. Sea ice
concentration data included in CALIOP Level 1 data from
the National Snow and Ice Data Center (NSIDC) are used.
Two specific areas are selected:
– over the Greenland Sea, between 70◦ and 80◦ N and be-
tween 10◦W and 20◦ E;
– over the Western Arctic (Chukchi and Beaufort seas),
between 70◦ and 80◦ N and between 150 and 180◦W.
Figure 10a displays the annual variability of the specific hu-
midity (top panel) and the 2 m temperature (bottom panel)
in solid lines between 2007 and 2010 for the whole Arctic
region (black), over the Greenland Sea (blue) and over the
Western Arctic (orange). On both figures, dashed lines rep-
resent the sea ice concentration from NSIDC (in %). Humid-
ity and temperature are from ECMWF and are interpolated
onto the DARDAR grid. Specific humidity is averaged over
the 0–500 m altitude range. Note that the accuracy of these
ECMWF retrievals is not discussed here since we use them
only to demonstrate their variability.
From this figure, one can see that sea ice variability is very
pronounced in the Western Arctic with a large decrease from
late spring to late autumn (values larger than 90 % in April
decrease to less than 10 % in September). Over the Greenland
Sea, sea ice variability is rather small, with values between
5 and 20 %. A small decrease is still observed from spring
to autumn. This figure highlights clearly that sea ice concen-
tration is inversely correlated with humidity and temperature.
Moreover, a delay is observed between the sea ice concentra-
tion minimum (September) and the temperature and humid-
ity maxima (July).
Finally, Fig. 10b compares directly the total cloud and
MPC occurrences with sea ice concentration. Cloud and
MPC occurrences clearly decrease when sea ice concentra-
tion increases. This trend is observed both for all clouds and
MPCs (slope around −0.30, with a correlation coefficient of
0.7). Note that the results over the Greenland Sea (blue dots)
do not point out a significant trend due to the small variabil-
ity of the sea ice concentration throughout the year in this re-
gion. This is in agreement with the high cloud occurrence ob-
served year-long in this region. From these results, it seems
that cloud and MPC cover are linked to the sea ice melting.
However, a more detailed investigation is needed to confirm
this assumption, such as the study of cloud and sea ice over
the entire Arctic region, since our study is limited to the re-
gion below 82◦ N.
Therefore, the results of the present study seem to indicate
that sea ice melting and large-scale circulation can have an
important impact on MPC annual variability in the Arctic,
by preventing warm water and moisture advection to the en-
tire Arctic during winter and early spring, and favouring it
the rest of the year (which is consistent with Kay and Get-
telman (2009) and Palm et al., 2010). The decrease of low-
Atmos. Chem. Phys., 15, 2445–2461, 2015 www.atmos-chem-phys.net/15/2445/2015/
Page 13
G. Mioche et al.: Variability of mixed-phase clouds in the Arctic with a focus on the Svalbard region 2457
level clouds and MPCs in summer could be explained by an
increase in air temperature coupled with less stable atmo-
spheric conditions than during the rest of the year, causing
the formation of MPC at higher altitudes (as shown on verti-
cal profiles in Fig. 8a).
At last, it is obvious that numerous other regional and lo-
cal processes are involved in the MPC life cycle and exert
an influence on their spatial and temporal variability. Further
studies are needed to investigate these different processes and
establish a link between them. For example, efforts are cur-
rently focused on the study of local sources or long-range
transported aerosols in the Arctic region and their role to
act as cloud condensation nuclei (CCN) or ice nuclei (IN).
The link between the variations of aerosol concentrations or
compositions and the MPC characteristics should be investi-
gated as it might partially explain some of the variations in
the cloud and MPC occurrences. It would improve our un-
derstanding in the aerosol-cloud interactions in the Arctic,
like the studies performed by Avramov et al., 2011; Jackson
et al., 2012 or Tjernström et al., 2014. Additionally, Orellana
et al., 2011 and Tjernström et al., 2014 highlighted that sea
ice melting during summer produces biogenic aerosol par-
ticles, which could potentially act as CCN or IN for cloud
and MPC formation. The influence of the surface, the turbu-
lence and dynamics effect at small and large temporal and
spatial scales on MPC occurrence also needs to be assessed
more accurately. The most difficult task remains to couple
all these processes and quantify their respective importance
in the Arctic MPC evolution.
6 Conclusions and outlook
This work presents a study of cloud and mixed-phase
cloud occurrences over the Arctic region with a fo-
cus on the Svalbard region. The methodology used is
based on satellite active remote sensing measurements. The
CALIPSO/CLOUDSAT observations are processed with the
DARDAR retrieval algorithm to perform a cloud thermo-
dynamic phase classification. The uncertainties and limita-
tions of this method are first evaluated from comparison with
ground-based observations. The spatial frequencies of occur-
rence and vertical distributions are then determined for total
cloud and MPCs, over the entire Arctic region and over the
Svalbard region. The cloud occurrences are also investigated
and discriminated according to the surface type (open water,
sea ice and land). The main results are summarised below:
– Based on comparisons with ground-based observations,
uncertainties in the determination of cloud and MPC oc-
currence from the DARDAR product below 2 km of al-
titude are estimated to up to 20 % between 500 m and
2 km, and around 25 % below 500 m.
– Clouds are present in the Arctic throughout the year,
with occurrences between 50 % and nearly 100 %, de-
pending on the season and the location. Moreover,
clouds are more frequent in the Svalbard region than in
the rest of the Arctic by around 5–10 %.
– Over the whole Arctic region, MPCs represent around
30 % of the clouds during winter and around 50 % of
the clouds the rest of the year. Over the Svalbard re-
gion, MPC occurrence is almost constant year-round,
with values around 55 %. MPCs are mainly present at
low-altitudes as 70 to 90 % of the MPCs are located
below 3 km (both for the entire Arctic and the Sval-
bard region), especially in winter, spring and autumn.
In summer, the MPC occurrence becomes significant at
mid-level altitudes (3–6 km). During spring, MPCs are
located mainly over the Greenland, Barents and Norwe-
gian seas. In autumn, large occurrences are observed in
the Western Arctic (over the Chukchi and the Canadian
seas). Moreover, MPCs are generally more frequently
encountered over open sea than over land or sea ice.
– The particular Arctic MPCs composed of a single super-
cooled liquid layer at the cloud top and ice in the lower
part of the cloud (MPC-IB) represent between 55 and
70 % of the MPCs over the whole Arctic and between
65 and 80 % of the MPC over the Svalbard region. Spa-
tial, seasonal and vertical variability of this cloud type
have strong similarities with MPCs.
– Differences between MPC seasonality over the Svalbard
region and over the entire Arctic region can be partly
explained by the vicinity of the North Atlantic Ocean
and the particular atmospheric conditions encountered
around the Svalbard archipelago. The mixture of cold
air and warm water from the North Atlantic Ocean
seems to be responsible for the large MPC amount ob-
served during spring over the Svalbard. In the Western
Arctic, the MPC maximum frequency occur later dur-
ing summer and autumn when heat and moisture are
released due to the melting of sea ice. A short analy-
sis based on comparisons of sea ice concentration with
temperature, humidity and clouds and MPC occurrences
seems to establish a link between sea ice and cloud and
MPC occurrences. Evidently, a more detailed study is
needed here, as MPC variability is also dependent on
the regional scale characteristics such as the oceanic cir-
culation, and on more local conditions (such as the pro-
portion of open water/sea ice which exhibits a seasonal
variability).
Space remote sensing observations of Arctic MPCs at
the regional scale highlighted large occurrence frequen-
cies, in particular concerning low-level MPCs. Thus, the
present study contributes to understand in which regional
frame airborne campaigns and ground-based observations
have been performed. However, space remote sensing ob-
servations present well-known uncertainties near the surface,
www.atmos-chem-phys.net/15/2445/2015/ Atmos. Chem. Phys., 15, 2445–2461, 2015
Page 14
2458 G. Mioche et al.: Variability of mixed-phase clouds in the Arctic with a focus on the Svalbard region
which may have an important impact on low-level cloud
amount determination. Therefore, airborne campaigns will
provide a more thorough characterisation of MPC properties
at a small scale. In particular, in situ measurements will help
to understand the microphysical processes involved in MPCs.
As an example, in situ airborne measurements performed
during the ASTAR 2007 and POLARCAT 2008 campaigns,
in spring, over the open water around the Svalbard region
and the Greenland sea, provided data from several boundary
layer mixed-phase clouds with a typical MPC-IB structure
(Gayet et al., 2009). Several ascents and descents in all of
these clouds have been performed between the cloud top and
the sea level. Despite the small amount of data collected and
the fact that they are very localised in time and space, these
in situ measurements can be considered a very useful data set
for studying MPC at small scale.
In particular, the quantification of ice and liquid particle
microphysical and optical properties, and the vertical profiles
of water droplet and ice crystal microphysical properties, will
give an insight into the microphysical processes responsible
for particles growth within MPCs. Accurate profiles of rel-
evant cloud parameters (for example asymmetry parameter,
optical depth, ice/liquid water mass fraction, ice crystal mor-
phology, size and concentration, among others) may also be
provided to contribute to an improvement of cloud represen-
tation in global and meso-scale models and to improve air-
borne and spatial remote sensing retrieval algorithms, such as
those of CALIPSO/CLOUDSAT, or in the near future, Earth-
CARE.
Finally, it would be of great interest to associate the present
work with further studies at various scales, especially at a
small scale. The synergy of in situ and remote sensing obser-
vations will allow the multi-scale study of MPCs and it will
particularly help to resolve some actual unanswered ques-
tions concerning the definition of mixed-phase clouds ac-
cording to the scale of observation. Such a multi-scale ap-
proach will, thus, improve the parameterisation of MPCs in
remote sensing retrieval algorithms and their representation
in models at different resolutions.
Acknowledgements. This work is part of the French scientific
community EECLAT project (Expecting EarthCare, Learning
from A-Train) and is supported by the French Centre National
des Etudes Spatiales (CNES). This research used resources from
the ICARE centre for space remote sensing data processing. This
work was also supported by the French ANR CLIMSLIP project
(Climate Impacts of Short-Lived Pollutants and Methane in the
Arctic). We thank the anonymous reviewers who made important
comments that helped to strengthen the manuscript.
Edited by: M. Krämer
References
Avramov, A., Ackerman, A. S., Fridlind, A. M., van Diedenhoven,
B., Botta, G., Aydin, K., Verlinde, J., Korolev, A. V., Strapp, J.
W., McFarquhar, G. M., Jackson, R., Brooks, S. D., Glen, A.,
and Wolde, M.: Toward ice formation closure in Arctic mixed-
phase boundary layer clouds during ISDAC, J. Geophys. Res.,
116, D00T08, doi:10.1029/2011JD015910, 2011.
Baumgardner, D., Avallone, L., Bansemer, A., Borrmann, S.,
Brown, P., Bundke, U., Chuang, P. Y., Cziczo, D., Field, P., Gal-
lagher, M., Gayet, J.-F., Heymsfield, A., Korolev, A., Krämer,
M., McFarquhar, G., Mertes, S., Möhler, O., Lance, S., Law-
son, P., Petters, M. D., Pratt, K., Roberts, G., Rogers, D., Stetzer,
O., Stith, J., Strapp, W., Twohy, C., and Wendisch, M.: In Situ,
Airborne Instrumentation: Addressing and Solving Measurement
Problems in Ice Clouds, Bull. Am. Meteorol. Soc., 93, ES29–
ES34, doi:10.1175/BAMS-D-11-00123.1, 2012.
Benedetti, A.: CloudSat AN-ECMWF ancillary data interface con-
trol document, technical document, CloudSat Data Process.
Cent., 16th July, 2005.
Bergeron, T.: On the physics of clouds and precipitation, Int. Union
Geod. Geophys., 156–178, 1935.
Bierwirth, E., Ehrlich, A., Wendisch, M., Gayet, J.-F., Gourbeyre,
C., Dupuy, R., Herber, A., Neuber, R., and Lampert, A.: Optical
thickness and effective radius of Arctic boundary-layer clouds
retrieved from airborne nadir and imaging spectrometry, Atmo-
spheric Meas. Tech., 6, 1189–1200, doi:10.5194/amt-6-1189-
2013, 2013.
Blanchard, Y., Pelon, J., Eloranta, E. W., Moran, K. P., Delanoë,
J., and Sèze, G.: A synergistic analysis of cloud cover and verti-
cal distribution from A-Train and ground-based sensors over the
high Arctic station EUREKA from 2006 to 2010, J. Appl. Mete-
orol. Clim., 53, 11, 2553–2570, 2014
De Boer, G., Chapman, W., Kay, J. E., Medeiros, B., Shupe, M.
D., Vavrus, S. and Walsh, J.: A Characterization of the Present-
Day Arctic Atmosphere in CCSM4, J. Climate, 25, 2676–2695,
doi:10.1175/JCLI-D-11-00228.1, 2012.
De Boer, G., Eloranta, E. W., and Shupe, M. D.: Arctic Mixed-Phase
Stratiform Cloud Properties from Multiple Years of Surface-
Based Measurements at Two High-Latitude Locations, J. Atmos.
Sci., 66, 2874–2887, doi:10.1175/2009JAS3029.1, 2009.
Bourdages, L., Duck, T. J., Lesins, G., Drummond, J. R., and Elo-
ranta, E. W.: Physical properties of High Arctic tropospheric
particles during winter, Atmos. Chem. Phys., 9, 6881–6897,
doi:10.5194/acp-9-6881-2009, 2009.
Ceccaldi, M., Delanoë, J., Hogan, R. J., Pounder, N. L., Protat, A.,
and Pelon, J.: From CloudSat-CALIPSO to EarthCare: Evolu-
tion of the DARDAR cloud classification and its comparison to
airborne radar-lidar observations, J. Geophys. Res. Atmos., 118,
1–20, doi:10.1002/jgrd.50579, 2013.
Cesana, G., Kay, J. E., Chepfer, H., English, J. M. and
de Boer, G.: Ubiquitous low-level liquid-containing Arctic
clouds: New observations and climate model constraints from
CALIPSO-GOCCP, Geophys. Res. Lett., 39, L20804, 1–6,
doi:10.1029/2012GL053385, 2012.
Chan, M. A. and Comiso, J. C.: Arctic Cloud Characteristics as
Derived from MODIS, CALIPSO, and CloudSat, J. Climate, 26,
3285–3306, doi:10.1175/JCLI-D-12-00204.1, 2013.
Chernokulsky, A. and Mokhov, I. I.: Climatology of To-
tal Cloudiness in the Arctic: An Intercomparison of Ob-
Atmos. Chem. Phys., 15, 2445–2461, 2015 www.atmos-chem-phys.net/15/2445/2015/
Page 15
G. Mioche et al.: Variability of mixed-phase clouds in the Arctic with a focus on the Svalbard region 2459
servations and Reanalyses, Adv. Meteorol., 2012, 1–15,
doi:10.1155/2012/542093, 2012.
Choi, Y.-S., Ho, C.-H., Park, C.-E., Storelvmo, T., and
Tan, I.: Influence of cloud phase composition on cli-
mate feedbacks, J. Geophys. Res. Atmos., 119, 3687–3700,
doi:10.1002/2013JD020582, 2014.
Curry, J. A.: Interactions among aerosols, clouds, and climate
of the Arctic Ocean, Sci. Tot. Environ., 160–161, 777–791,
doi:10.1016/0048-9697(95)04411-S, 1995.
Curry, J. A., Hobbs, P. V., King, M. D., Randall, D. A.,
Minnis, P., Isaac, G. A., Pinto, J. O., Uttal, T., Bucholtz,
A., Cripe, D. G., Gerber, H., Fairall, C. W., Garrett, T.
J., Hudson, J., Intrieri, J. M., Jakob, C., Jensen, T., Law-
son, P., Marcotte, D., Nguyen, L., Pilewskie, P., Rangno,
A., Rogers, D. C., Strawbridge, K. B., Valero, F. P. J.,
Williams, A. G., and Wylie, D.: FIRE Arctic Clouds Experi-
ment, Bull. Am. Meteorol. Soc., 81, 5–29, doi:10.1175/1520-
0477(2000)081<0005:FACE>2.3.CO;2, 2000.
Curry, J. A., Pinto, J. O., Benner, T., and Tschudi, M.: Evo-
lution of the cloudy boundary layer during the autumnal
freezing of the Beaufort Sea, J. Geophys. Res., 102, 13851,
doi:10.1029/96JD03089, 1997.
Curry, J. A., Schramm, J. L., Rossow, W. B., and Ran-
dall, D.: Overview of Arctic Cloud and Radiation Char-
acteristics, J. Climate, 9, 1731–1764, doi:10.1175/1520-
0442(1996)009<1731:OOACAR>2.0.CO;2, 1996.
Delanoë, J. and Hogan, R. J.: A variational scheme for retrieving
ice cloud properties from combined radar, lidar, and infrared
radiometer, J. Geophys. Res., 113, doi:10.1029/2007JD009000,
2008.
Delanoë, J. and Hogan, R. J.: Combined CloudSat-CALIPSO-
MODIS retrievals of the properties of ice clouds, J. Geophys.
Res., 115, doi:10.1029/2009JD012346, 2010.
Delanoë, J., Protat, A., Jourdan, O., Pelon, J., Papazzoni, M.,
Dupuy, R., Gayet, J.-F., and Jouan, C.: Comparison of Air-
borne In Situ, Airborne Radar–Lidar, and Spaceborne Radar–
Lidar Retrievals of Polar Ice Cloud Properties Sampled during
the POLARCAT Campaign, J. Atmos. Ocean. Techn., 30, 57–73,
doi:10.1175/JTECH-D-11-00200.1, 2013.
Dong, X., Xi, B., Crosby, K., Long, C. N., Stone, R. S., and Shupe,
M. D.: A 10 year climatology of Arctic cloud fraction and radia-
tive forcing at Barrow, Alaska, J. Geophys. Res., 115, D17212,
doi:10.1029/2009JD013489, 2010.
Findeisen, W.: Kolloid-meteorologische vorgange bei
neiderschlags-bildung, Meteorol Z, 55, 121–133, 1938.
Frey, R. A., Ackerman, S. A., Liu, Y., Strabala, K. I.,
Zhang, H., Key, J. R., and Wang, X.: Cloud Detection with
MODIS. Part I: Improvements in the MODIS Cloud Mask
for Collection 5, J. Atmos. Ocean. Tech., 25, 1057–1072,
doi:10.1175/2008JTECHA1052.1, 2008.
Garrett, T. J., Maestas, M. M., Krueger, S. K., and Schmidt, C.
T.: Acceleration by aerosol of a radiative-thermodynamic cloud
feedback influencing Arctic surface warming, Geophys. Res.
Lett., 36, L19804, doi:10.1029/2009GL040195, 2009.
Gayet, J.-F., Mioche, G., Dörnbrack, A., Ehrlich, A., Lampert,
A., and Wendisch, M.: Microphysical and optical properties of
Arctic mixed-phase clouds. The 9 April 2007 case study., At-
mos. Chem. Phys., 9, 6581–6595, doi:10.5194/acp-9-6581-2009,
2009.
Gultepe, I., Isaac, G., Hudak, D., Nissen, R. and Strapp, J. W.:
Dynamical and Microphysical Characteristics of Arctic Clouds
during BASE, J. Climate, 13, 1225–1254, doi:10.1175/1520-
0442(2000)013<1225:DAMCOA>2.0.CO;2, 2000.
Harrington, J. Y., Reisin, T., Cotton, W. R., and Kreidenweis, S. M.:
Cloud resolving simulations of Arctic stratus, Atmos. Res., 51,
45–75, doi:10.1016/S0169-8095(98)00098-2, 1999.
Hobbs, P. V. and Rangno, A. L.: Microstructures of low and middle-
level clouds over the Beaufort Sea, Q. J. R. Meteorol. Soc., 124,
2035–2071, doi:10.1002/qj.49712455012, 1998.
Hoffmann, A., Ritter, C., Stock, M., Shiobara, M., Lampert, A., Ma-
turilli, M., Orgis, T., Neuber, R., and Herber, A.: Ground-based
lidar measurements from Ny-Ålesund during ASTAR 2007, At-
mospheric Chem. Phys., 9, 9059–9081, doi:10.5194/acp-9-9059-
2009, 2009.
Huang, Y., Siems, S. T., Manton, M. J., Protat, A., and Delanoë, J.:
A study on the low-altitude clouds over the Southern Ocean using
the DARDAR-MASK, J. Geophys. Res. Atmos., 117, D18204,
1–15, doi:10.1029/2012JD017800, 2012.
Intrieri, J. M., Shupe, M. D., Uttal, T., and McCarty, B. J.: An annual
cycle of Arctic cloud characteristics observed by radar and lidar
at SHEBA, J. Geophys. Res., 107, doi:10.1029/2000JC000423,
2002.
Jackson, R. C., McFarquhar, G. M., Korolev, A. V., Earle, M. E.,
Liu, P. S. K., Lawson, R. P., Brooks, S., Wolde, M., Laskin,
A., and Freer, M.: The dependence of ice microphysics on
aerosol concentration in arctic mixed-phase stratus clouds dur-
ing ISDAC and M-PACE, J. Geophys. Res., 117, D15207,
doi:10.1029/2012JD017668, 2012.
Jouan, C., Girard, E., Pelon, J., Gultepe, I., Delanoë, J., and
Blanchet, J.-P.: Characterization of Arctic ice cloud proper-
ties observed during ISDAC, J. Geophys. Res., 117, D23207,
doi:10.1029/2012JD017889, 2012.
Jouan, C., Pelon, J., Girard, E., Ancellet, G., Blanchet, J. P., and
Delanoë, J.: On the relationship between Arctic ice clouds and
polluted air masses over the North Slope of Alaska in April 2008,
Atmos. Chem. Phys., 14, 1205–1224, doi:10.5194/acp-14-1205-
2014, 2014.
Jourdan, O., Mioche, G., Garrett, T. J., Schwarzenböck, A., Vidot,
J., Xie, Y., Shcherbakov, V., Yang, P., and Gayet, J.-F.: Coupling
of the microphysical and optical properties of an Arctic nimbo-
stratus cloud during the ASTAR 2004 experiment: Implications
for light-scattering modeling, J. Geophys. Res., 115(D23206),
doi:10.1029/2010JD014016, 2010.
Kay, J. E. and Gettelman, A.: Cloud influence on and response to
seasonal Arctic sea ice loss, J. Geophys. Res., 114, D18204,
doi:10.1029/2009JD011773, 2009.
Key, J. and Barry, R. G.: Cloud cover analysis with Arctic AVHRR
data: 1. Cloud detection, J. Geophys. Res., 94, D15, 18521,
doi:10.1029/JD094iD15p18521, 1989.
Klein, S. A., McCoy, R. B., Morrison, H., Ackerman, A. S.,
Avramov, A., Boer, G. de, Chen, M., Cole, J. N. S., Del Genio,
A. D., Falk, M., Foster, M. J., Fridlind, A., Golaz, J.-C., Hashino,
T., Harrington, J. Y., Hoose, C., Khairoutdinov, M. F., Larson, V.
E., Liu, X., Luo, Y., McFarquhar, G. M., Menon, S., Neggers, R.
A. J., Park, S., Poellot, M. R., Schmidt, J. M., Sednev, I., Ship-
way, B. J., Shupe, M. D., Spangenberg, D. A., Sud, Y. C., Turner,
D. D., Veron, D. E., Salzen, K., von, Walker, G. K., Wang, Z.,
Wolf, A. B., Xie, S., Xu, K.-M., Yang, F., and Zhang, G.: In-
www.atmos-chem-phys.net/15/2445/2015/ Atmos. Chem. Phys., 15, 2445–2461, 2015
Page 16
2460 G. Mioche et al.: Variability of mixed-phase clouds in the Arctic with a focus on the Svalbard region
tercomparison of model simulations of mixed-phase clouds ob-
served during the ARM Mixed-Phase Arctic Cloud Experiment.
I: single-layer cloud, Q. J. R. Meteorol. Soc., 135, 979–1002,
doi:10.1002/qj.416, 2009.
Klingebiel, M., de Lozar, A., Molleker, S., Weigel, R., Roth, A.,
Schmidt, L., Meyer, J., Ehrlich, A., Neuber, R., Wendisch, M.,
and Borrmann, S.: Arctic low-level boundary layer clouds: in
situ measurements and simulations of mono- and bimodal super-
cooled droplet size distributions at the top layer of liquid phase
clouds, Atmos. Chem. Phys., 15, 617–631, doi:10.5194/acp-15-
617-2015, 2015.
Komurcu, M., Storelvmo, T., Tan, I., Lohmann, U., Yun, Y., Penner,
J. E., Wang, Y., Liu, X., and Takemura, T.: INter-comparison of
the cloud water phase among global climate models: cloud wa-
ter phase in GCMs, J. Geophys. Res. Atmos., 119, 3372–3400,
doi:10.1002/2013JD021119, 2014.
Korolev, A.: Limitations of the Wegener–Bergeron–Findeisen
Mechanism in the Evolution of Mixed-Phase Clouds, J. Atmos.
Sci., 64, 3372–3375, doi:10.1175/JAS4035.1, 2007.
Korolev, A. and Isaac, G.: Phase transformation of mixed-
phase clouds, Q. J. R. Meteorol. Soc., 129, 19–38,
doi:10.1256/qj.01.203, 2003.
Korolev, A. V., Isaac, G. A., Cober, S. G., Strapp, J. W., and Hallett,
J.: Microphysical characterization of mixed-phase clouds, Q. J.
R. Meteorol. Soc., 129, 39–65, doi:10.1256/qj.01.204, 2003.
Liu, Y., Ackerman, S. A., Maddux, B. C., Key, J. R., and Frey, R.
A.: Errors in Cloud Detection over the Arctic Using a Satellite
Imager and Implications for Observing Feedback Mechanisms,
J. Climate, 23, 1894–1907, doi:10.1175/2009JCLI3386.1, 2010.
Liu, Y., Key, J. R., Ackerman, S. A., Mace, G. G., and Zhang,
Q.: Arctic cloud macrophysical characteristics from Cloud-
Sat and CALIPSO, Remote Sens. Environ., 124, 159–173,
doi:10.1016/j.rse.2012.05.006, 2012.
Lubin, D. and Vogelmann, A. M.: A climatologically significant
aerosol longwave indirect effect in the Arctic, Nature, 439, 453–
456, doi:10.1038/nature04449, 2006.
Luo, Y., Xu, K.-M., Morrison, H., McFarquhar, G. M., Wang, Z.,
and Zhang, G.: Multi-layer arctic mixed-phase clouds simu-
lated by a cloud-resolving model: Comparison with ARM ob-
servations and sensitivity experiments, J. Geophys. Res., 113,
D12208, doi:10.1029/2007JD009563, 2008.
Mace, G.: Level 2 GEOPROF product process description and in-
terface control document algorithm version 5.3, 44, 2007.
Marchand, R., Mace, G. G., Ackerman, T. and Stephens, G.:
Hydrometeor Detection Using Cloudsat – An Earth-Orbiting
94-GHz Cloud Radar, J. Atmos. Ocean. Tech., 25, 519–533,
doi:10.1175/2007JTECHA1006.1, 2008.
McFarquhar, G. M., Ghan, S., Verlinde, J., Korolev, A., Strapp, J.
W., Schmid, B., Tomlinson, J. M., Wolde, M., Brooks, S. D., Cz-
iczo, D., Dubey, M. K., Fan, J., Flynn, C., Gultepe, I., Hubbe,
J., Gilles, M. K., Laskin, A., Lawson, P., Leaitch, W. R., Liu,
P., Liu, X., Lubin, D., Mazzoleni, C., Macdonald, A.-M., Mof-
fet, R. C., Morrison, H., Ovchinnikov, M., Shupe, M. D., Turner,
D. D., Xie, S., Zelenyuk, A., Bae, K., Freer, M., and Glen, A.:
Indirect and Semi-direct Aerosol Campaign: The Impact of Arc-
tic Aerosols on Clouds, Bull. Am. Meteorol. Soc., 92, 183–201,
doi:10.1175/2010BAMS2935.1, 2011.
Morrison, H., de Boer, G., Feingold, G., Harrington, J., Shupe, M.
D., and Sulia, K.: Resilience of persistent Arctic mixed-phase
clouds, Nat. Geosci., 5, 11–17, doi:10.1038/ngeo1332, 2012.
Morrison, H., McCoy, R. B., Klein, S. A., Xie, S., Luo, Y., Avramov,
A., Chen, M., Cole, J. N. S., Falk, M., Foster, M. J., Del Ge-
nio, A. D., Harrington, J. Y., Hoose, C., Khairoutdinov, M. F.,
Larson, V. E., Liu, X., McFarquhar, G. M., Poellot, M. R., von
Salzen, K., Shipway, B. J., Shupe, M. D., Sud, Y. C., Turner,
D. D., Veron, D. E., Walker, G. K., Wang, Z., Wolf, A. B., Xu,
K.-M., Yang, F., and Zhang, G.: Intercomparison of model simu-
lations of mixed-phase clouds observed during the ARM Mixed-
Phase Arctic Cloud Experiment. II: Multilayer cloud, Q. J. R.
Meteorol. Soc., 135, 1003–1019, doi:10.1002/qj.415, 2009.
Nygård, T., Valkonen, T., and Vihma, T.: Characteristics of Arctic
low-tropospheric humidity inversions based on radio soundings,
Atmos. Chem. Phys., 14, 1959–1971, doi:10.5194/acp-14-1959-
2014, 2014.
Orbaek, J. B., Hisdal, V., and Svaasand, L. E.: Radiation climate
variability in Svalbard: surface and satellite observations, Polar
Res., 18, 127–134, 1999.
Orellana, M. V., Matrai, P. A., Leck, C., Rauschenberg, C. D., Lee,
A. M., and Coz, E.: Marine microgels as a source of cloud con-
densation nuclei in the high Arctic, Proc. Natl. Acad. Sci., 108,
13612–13617, doi:10.1073/pnas.1102457108, 2011.
Palm, S. P., Strey, S. T., Spinhirne, J., and Markus, T.: Influence of
Arctic sea ice extent on polar cloud fraction and vertical struc-
ture and implications for regional climate, J. Geophys. Res., 115,
D21209, doi:10.1029/2010JD013900, 2010.
Rossow, W. B. and Garder, L. C.: Cloud Detection Us-
ing Satellite Measurements of Infrared and Visible Radi-
ances for ISCCP, J. Climate, 6, 2341–2369, doi:10.1175/1520-
0442(1993)006<2341:CDUSMO>2.0.CO;2, 1993.
Sanderson, M. G., Hemming, D. L., and Betts, R. A.: Re-
gional temperature and precipitation changes under high-end
(= 4 ◦C) global warming, Philos. T. Roy. Soc. A, 369, 85–98,
doi:10.1098/rsta.2010.0283, 2011.
Schweiger, A. J. and Key, J. R.: Arctic cloudiness: comparison of
ISCCP-C2 and Nimbus-7 satellite-derived cloud products with
a surface-based cloud climatology, J. Climate, 5, 1514–1527,
doi:10.1175/1520-0442(1992)005<1514:ACCOIC>2.0.CO;2,
1992.
Sedlar, J., Shupe, M. D., and Tjernström, M.: On the relation-
ship between thermodynamic structure and cloud top, and its
climate significance in the Arctic, J. Climate, 25, 2374–2393,
doi:10.1175/JCLI-D-11-00186.1, 2012.
Serreze, M. C. and Barry, R. G.: The Arctic Climate System, Cam-
bridge University Press, Cambridge, UK, 2005.
Serreze, M. C., Barrett, A. P., Stroeve, J. C., Kindig, D. N., and Hol-
land, M. M.: The emergence of surface-based Arctic amplifica-
tion, The Cryosphere, 3, 11–19, doi:10.5194/tc-3-11-2009, 2009.
Shupe, M. D.: Clouds at Arctic Atmospheric Observatories, Part II:
thermodynamic phase characteristics, J. Appl. Meteorol. Clim.,
50, 645–661, doi:10.1175/2010JAMC2468.1, 2011.
Shupe, M. D. and Intrieri, J. M.: Cloud Radiative Forcing of
the Arctic Surface: The Influence of Cloud Properties, Sur-
face Albedo, and Solar Zenith Angle, J. Climate, 17, 616–628,
doi:10.1175/1520-0442(2004)017<0616:crfota>2.0.co;2, 2004.
Shupe, M. D., Uttal, T., and Matrosov, S. Y.: Arctic cloud
microphysics retrievals from surface-based remote sen-
Atmos. Chem. Phys., 15, 2445–2461, 2015 www.atmos-chem-phys.net/15/2445/2015/
Page 17
G. Mioche et al.: Variability of mixed-phase clouds in the Arctic with a focus on the Svalbard region 2461
sors at SHEBA, J. Appl. Meteorol., 44, 1544–1562,
doi:10.1175/JAM2297.1, 2005.
Shupe, M. D., Matrosov, S. Y., and Uttal, T.: Arctic mixed-
phase cloud properties derived from surface-based sensors at
SHEBA, J. Atmos. Sci., 63, 697–711, doi:10.1175/JAS3659.1,
2006.
Shupe, M. D., Walden, V. P., Eloranta, E., Uttal, T., Camp-
bell, J. R., Starkweather, S. M., and Shiobara, M.: Clouds at
Arctic Atmospheric Observatories, Part I: occurrence and macro-
physical properties, J. Appl. Meteorol. Clim., 50, 626–644,
doi:10.1175/2010JAMC2467.1, 2011.
Solomon, S., Qin, D., Manning, M., Chen, Z., Marquis, M., Averyt,
K. B., Tignor, M., and Miller, H. L.: Climate change 2007: the
physical scence basis, Cambridge University Press, Cambridge,
UK., 2007.
Stephens, G. L.: Cloud feedbacks in the climate system: a critical
review, J. Climate, 18, 237–273, 2005.
Stephens, G. L., Vane, D. G., Boain, R. J., Mace, G. G., Sassen, K.,
Wang, Z., Illingworth, A. J., O’Connor, E. J., Rossow, W. B.,
Durden, S. L., Miller, S. D., Austin, R. T., Benedetti, A.,
Mitrescu, C., and CloudSat Science Team: The CloudSat mission
and the A-Train: a new dimension of space-based observations of
clouds and precipitation, B. Am. Meteorol. Soc., 83, 1771–1790,
doi:10.1175/BAMS-83-12-1771, 2002.
Thomas, S. M., Heidinger, A. K., and Pavolonis, M. J.: Comparison
of NOAA’s operational AVHRR-derived cloud amount to other
satellite-derived cloud climatologies, J. Climate, 17, 4805–4822,
2004.
Tjernström, M., Leck, C., Birch, C. E., Bottenheim, J. W.,
Brooks, B. J., Brooks, I. M., Bäcklin, L., Chang, R. Y.-W.,
de Leeuw, G., Di Liberto, L., de la Rosa, S., Granath, E.,
Graus, M., Hansel, A., Heintzenberg, J., Held, A., Hind, A.,
Johnston, P., Knulst, J., Martin, M., Matrai, P. A., Maurit-
sen, T., Müller, M., Norris, S. J., Orellana, M. V., Orsini, D. A.,
Paatero, J., Persson, P. O. G., Gao, Q., Rauschenberg, C., Ris-
tovski, Z., Sedlar, J., Shupe, M. D., Sierau, B., Sirevaag, A.,
Sjogren, S., Stetzer, O., Swietlicki, E., Szczodrak, M., Vaat-
tovaara, P., Wahlberg, N., Westberg, M., and Wheeler, C. R.:
The Arctic Summer Cloud Ocean Study (ASCOS): overview
and experimental design, Atmos. Chem. Phys., 14, 2823–2869,
doi:10.5194/acp-14-2823-2014, 2014.
Uttal, T., Curry, J. A., Mcphee, M. G., Perovich, D. K.,
Moritz, R. E., Maslanik, J. A., Guest, P. S., Stern, H. L.,
Moore, J. A., Turenne, R., Heiberg, A., Serreze, M. C.,
Wylie, D. P., Persson, O. G., Paulson, C. A., Halle, C., Mori-
son, J. H., Wheeler, P. A., Makshtas, A., Welch, H., Shupe, M. D.,
Intrieri, J. M., Stamnes, K., Lindsey, R. W., Pinkel, R., Pe-
gau, W. S., Stanton, T. P., and Grenfeld, T. C.: Surface heat
budget of the Arctic Ocean, B. Am. Meteorol. Soc., 83, 255–275,
doi:10.1175/1520-0477(2002)083<0255:SHBOTA>2.3.CO;2,
2002.
Verlinde, J., Harrington, J. Y., Yannuzzi, V. T., Avramov, A.,
Greenberg, S., Richardson, S. J., Bahrmann, C. P., Mc-
Farquhar, G. M., Zhang, G., Johnson, N., Poellot, M. R.,
Mather, J. H., Turner, D. D., Eloranta, E. W., Tobin, D. C.,
Holz, R., Zak, B. D., Ivey, M. D., Prenni, A. J., DeMott, P. J.,
Daniel, J. S., Kok, G. L., Sassen, K., Spangenberg, D., Minnis, P.,
Tooman, T. P., Shupe, M., Heymsfield, A. J., and Schofield, R.:
The Mixed-Phase Arctic Cloud Experiment, B. Am. Meteorol.
Soc., 88, 205–221, doi:10.1175/BAMS-88-2-205, 2007.
Verlinde, J., Rambukkange, M. P., Clothiaux, E. E., McFar-
quhar, G. M., and Eloranta, E. W.: Arctic multilayered, mixed-
phase cloud processes revealed in millimeter-wave cloud radar
Doppler spectra, J. Geophys. Res.-Atmos., 118, 13199–13213,
doi:10.1002/2013JD020183, 2013.
Wang, X. and Key, J. R.: Arctic surface, cloud, and radiation prop-
erties based on the AVHRR Polar Pathfinder Dataset, Part I:
spatial and temporal characteristics, J. Climate, 18, 2558–2574,
doi:10.1175/JCLI3438.1, 2005.
Wegener, A.: Thermodynamik der Atmosphare, J. A. Barth,
Leipzig, 1911.
Wielicki, B. A., Barkstrom, B. R., Harrison, E. F., Lee, R. B.,
Louis Smith, G., and Cooper, J. E.: Clouds and the Earth’s Radi-
ant Energy System (CERES): an earth observing system exper-
iment, B. Am. Meteorol. Soc., 77, 853–868, doi:10.1175/1520-
0477(1996)077<0853:CATERE>2.0.CO;2, 1996.
Winker, D. M., Pelon, J. R., and McCormick, M. P.: The CALIPSO
Mission: Spaceborne Lidar for Observation of Aerosols and
Clouds, Proceedings of SPIE, 4893, Hangzhou, China, 1–11,
2003.
Zygmuntowska, M., Mauritsen, T., Quaas, J., and Kaleschke, L.:
Arctic Clouds and Surface Radiation – a critical comparison
of satellite retrievals and the ERA-Interim reanalysis, Atmos.
Chem. Phys., 12, 6667–6677, doi:10.5194/acp-12-6667-2012,
2012.
www.atmos-chem-phys.net/15/2445/2015/ Atmos. Chem. Phys., 15, 2445–2461, 2015