Prepared by: C. Douglas Cloud
Professor Emeritus of Accounting
Pepperdine University
© 2011 Cengage Learning. All Rights Reserved. May not be copied, scanned, or duplicated, in whole or in part, except for use as
permitted in a license distributed with a certain product or service or otherwise on a password-protected website for classroom use.
Variable Costing for Management Analysis
Chapter 20
© 2011 Cengage Learning. All Rights Reserved. May not be copied, scanned, or duplicated, in whole or in part, except for use as
permitted in a license distributed with a certain product or service or otherwise on a password-protected website for classroom use.
Learning Objectives
1. Describe and illustrate reporting income from
operations under absorption and variable
costing.
2. Describe and illustrate the effects of absorption
and variable costing on analyzing income
from operations.
3. Describe management’s use of absorption and
variable costing.
4. Use variable costing for analyzing market
segments, including product, territories, and
salespersons segments.
© 2011 Cengage Learning. All Rights Reserved. May not be copied, scanned, or duplicated, in whole or in part, except for use as
permitted in a license distributed with a certain product or service or otherwise on a password-protected website for classroom use.
Learning Objectives
5. Use variable costing for analyzing and
explaining changes in contribution margin as
a result of quantity and price factors.
6. Describe and illustrate the use of variable
costing for service firms.
© 2011 Cengage Learning. All Rights Reserved. May not be copied, scanned, or duplicated, in whole or in part, except for use as
permitted in a license distributed with a certain product or service or otherwise on a password-protected website for classroom use.
Describe and
illustrate reporting
income from
operations under
absorption and
variable costing.
Learning Objective 1
© 2011 Cengage Learning. All Rights Reserved. May not be copied, scanned, or duplicated, in whole or in part, except for use as
permitted in a license distributed with a certain product or service or otherwise on a password-protected website for classroom use.
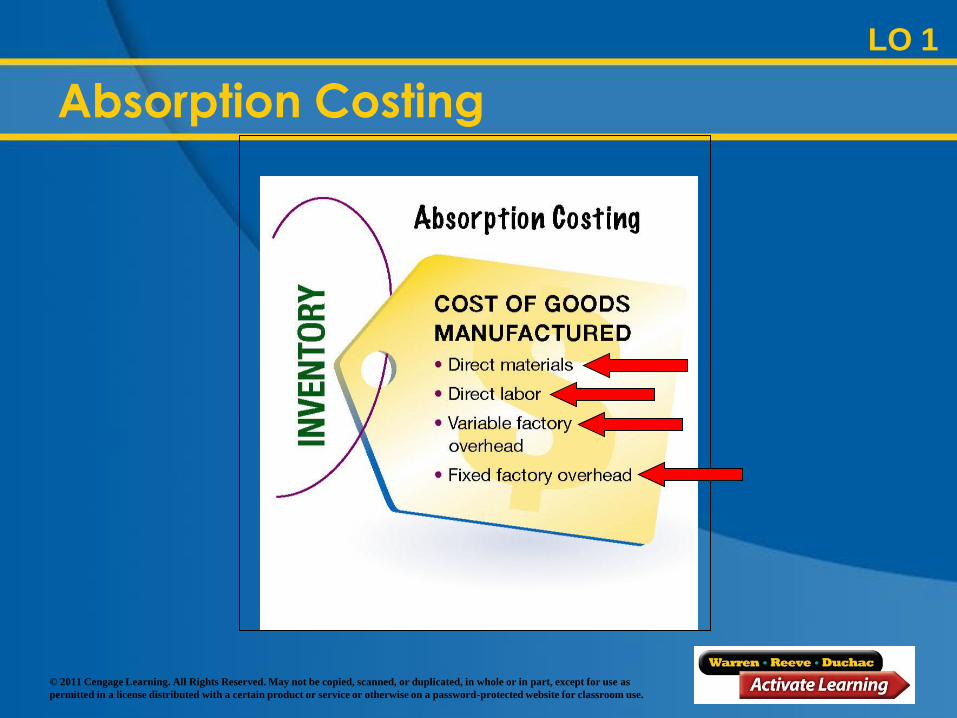
Absorption costing is required under
generally accepted accounting principles
for financial statements distributed to
external users.
Absorption Costing
LO 1
© 2011 Cengage Learning. All Rights Reserved. May not be copied, scanned, or duplicated, in whole or in part, except for use as
permitted in a license distributed with a certain product or service or otherwise on a password-protected website for classroom use.
Absorption Costing
LO 1
© 2011 Cengage Learning. All Rights Reserved. May not be copied, scanned, or duplicated, in whole or in part, except for use as
permitted in a license distributed with a certain product or service or otherwise on a password-protected website for classroom use.
Variable Costing
LO 1
For internal use in decision making,
managers often use variable costing,
sometimes called direct costing.
The cost of goods manufactured includes
only variable manufacturing costs.
© 2011 Cengage Learning. All Rights Reserved. May not be copied, scanned, or duplicated, in whole or in part, except for use as
permitted in a license distributed with a certain product or service or otherwise on a password-protected website for classroom use.
Variable Costing
LO 1
© 2011 Cengage Learning. All Rights Reserved. May not be copied, scanned, or duplicated, in whole or in part, except for use as
permitted in a license distributed with a certain product or service or otherwise on a password-protected website for classroom use.
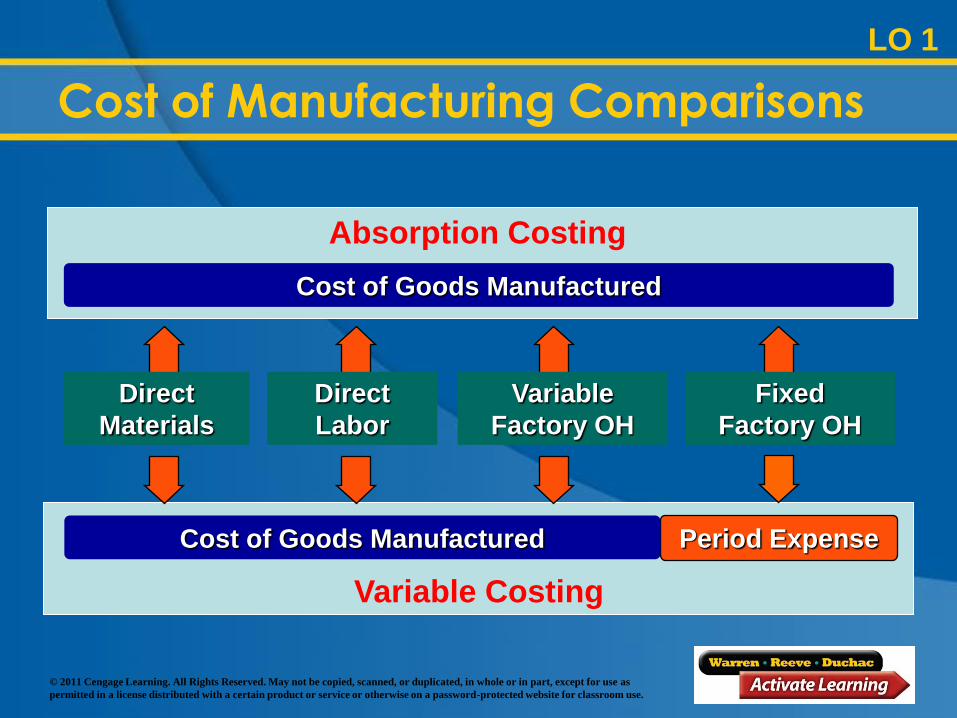
Period Expense
Variable Costing
Absorption Costing
Cost of Goods Manufactured
Cost of Goods Manufactured
Direct
Materials
Direct
Labor
Variable
Factory OH
Fixed
Factory OH
Cost of Manufacturing Comparisons
LO 1
© 2011 Cengage Learning. All Rights Reserved. May not be copied, scanned, or duplicated, in whole or in part, except for use as
permitted in a license distributed with a certain product or service or otherwise on a password-protected website for classroom use.
Variable Costing
LO 1
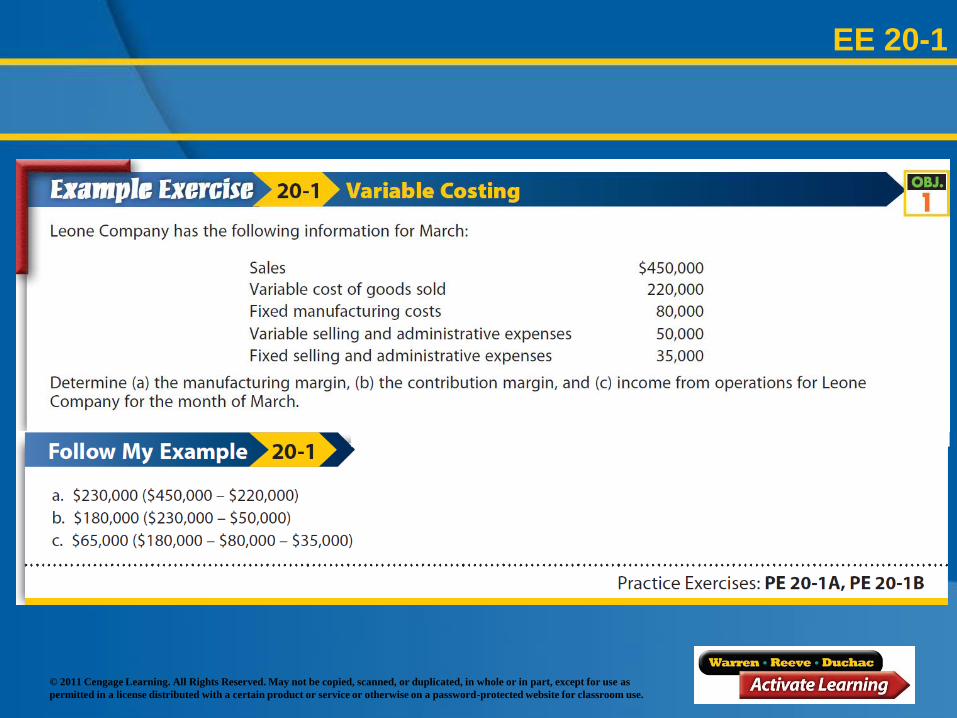
Manufacturing margin is sales less variable
cost of goods sold.
Variable cost of goods sold consists of
direct materials, direct labor, and variable
factory overhead for the units sold.
Contribution margin is manufacturing
margin less variable selling and
administrative expenses.
© 2011 Cengage Learning. All Rights Reserved. May not be copied, scanned, or duplicated, in whole or in part, except for use as
permitted in a license distributed with a certain product or service or otherwise on a password-protected website for classroom use.
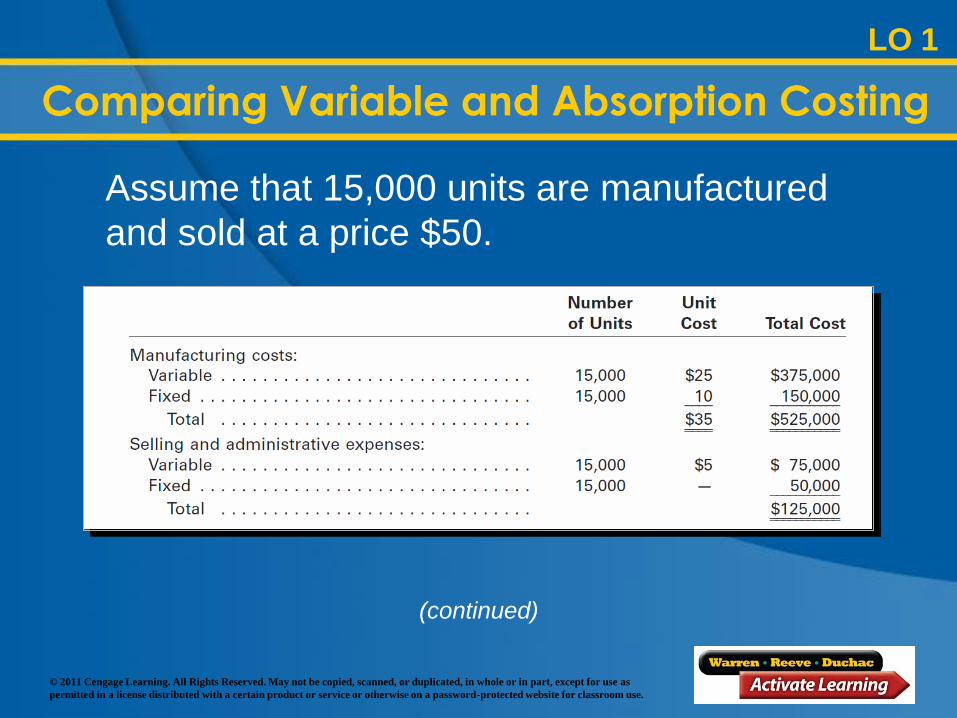
Assume that 15,000 units are manufactured
and sold at a price $50.
Comparing Variable and Absorption Costing
LO 1
(continued)
© 2011 Cengage Learning. All Rights Reserved. May not be copied, scanned, or duplicated, in whole or in part, except for use as
permitted in a license distributed with a certain product or service or otherwise on a password-protected website for classroom use.
Units Manufactured Equal Units Sold
LO 1
© 2011 Cengage Learning. All Rights Reserved. May not be copied, scanned, or duplicated, in whole or in part, except for use as
permitted in a license distributed with a certain product or service or otherwise on a password-protected website for classroom use.
EE 20-1
© 2011 Cengage Learning. All Rights Reserved. May not be copied, scanned, or duplicated, in whole or in part, except for use as
permitted in a license distributed with a certain product or service or otherwise on a password-protected website for classroom use.
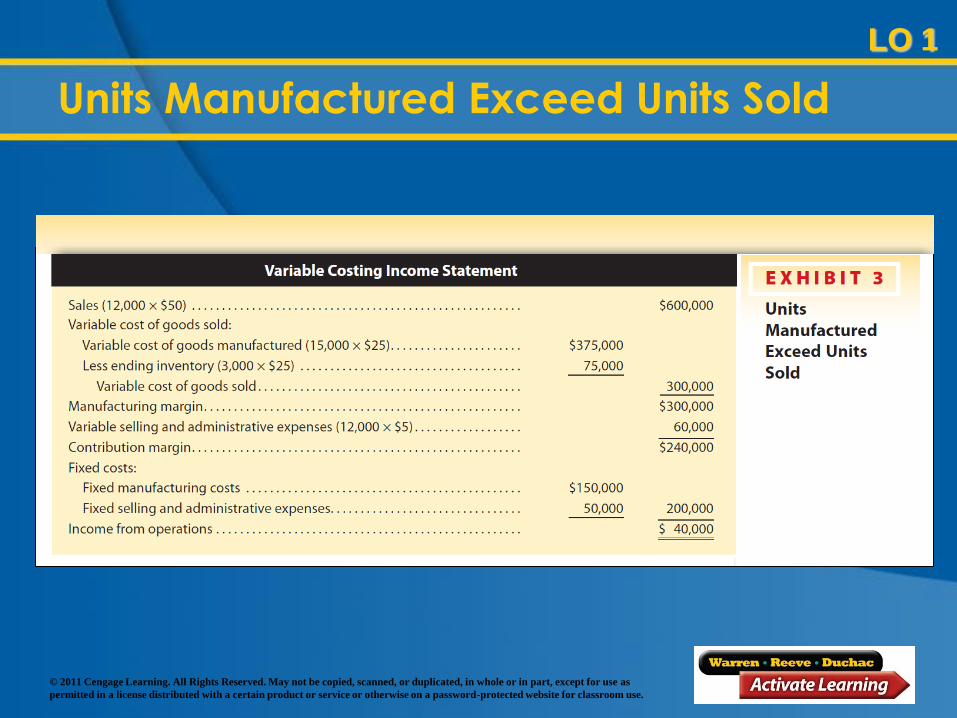
Units Manufactured Exceed Units Sold
Assume that in the preceding example only 12,000
units of the 15,000 units manufactured were sold.
Examine Exhibit 3 (next two slides) and you will
see that income from operations using variable
costing is $40,000, while absorption costing
provides an income from operations of $70,000.
(continued)
LO 1
© 2011 Cengage Learning. All Rights Reserved. May not be copied, scanned, or duplicated, in whole or in part, except for use as
permitted in a license distributed with a certain product or service or otherwise on a password-protected website for classroom use.
(continued)
Units Manufactured Exceed Units Sold
LO 1
© 2011 Cengage Learning. All Rights Reserved. May not be copied, scanned, or duplicated, in whole or in part, except for use as
permitted in a license distributed with a certain product or service or otherwise on a password-protected website for classroom use.
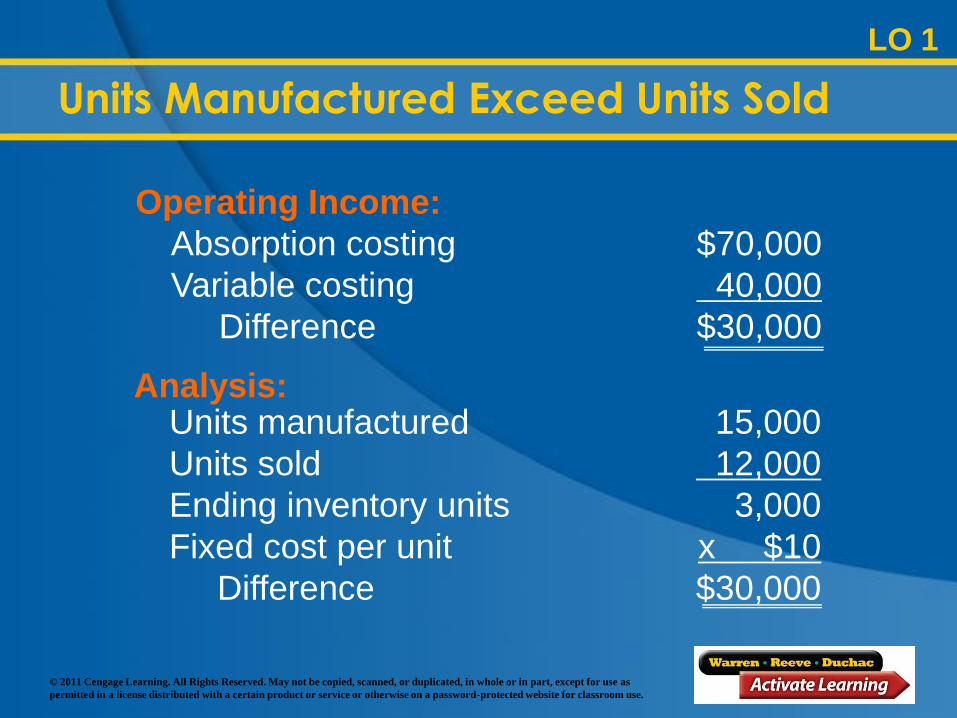
Why is absorption costing income higher when
units manufactured exceed units sold?
Operating Income:
Absorption costing $70,000
Variable costing 40,000
Difference $30,000
Units Manufactured Exceed Units Sold
LO 1
© 2011 Cengage Learning. All Rights Reserved. May not be copied, scanned, or duplicated, in whole or in part, except for use as
permitted in a license distributed with a certain product or service or otherwise on a password-protected website for classroom use.
Analysis: Units manufactured 15,000
Units sold 12,000
Ending inventory units 3,000
Fixed cost per unit x $10
Difference $30,000
Units Manufactured Exceed Units Sold
LO 1
Operating Income:
Absorption costing $70,000
Variable costing 40,000
Difference $30,000
© 2011 Cengage Learning. All Rights Reserved. May not be copied, scanned, or duplicated, in whole or in part, except for use as
permitted in a license distributed with a certain product or service or otherwise on a password-protected website for classroom use.
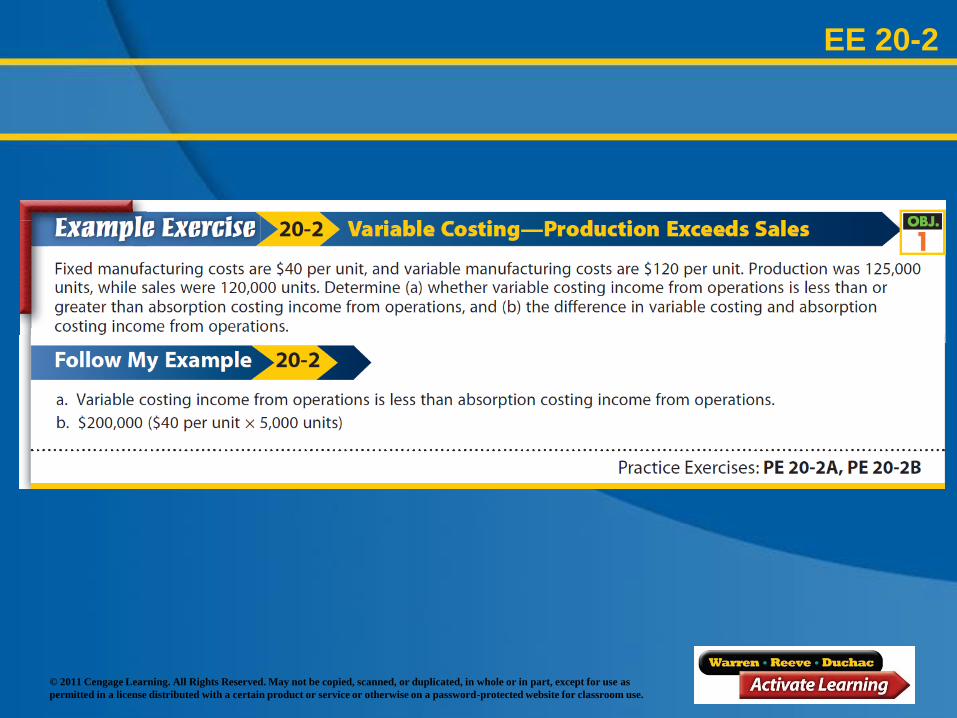
EE 20-2
© 2011 Cengage Learning. All Rights Reserved. May not be copied, scanned, or duplicated, in whole or in part, except for use as
permitted in a license distributed with a certain product or service or otherwise on a password-protected website for classroom use.
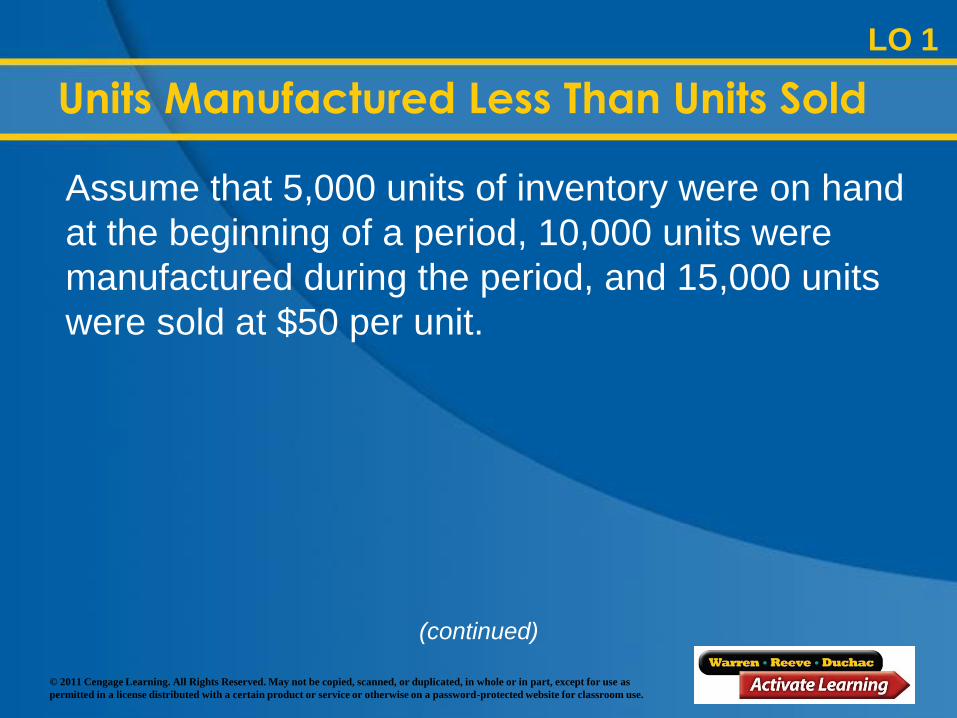
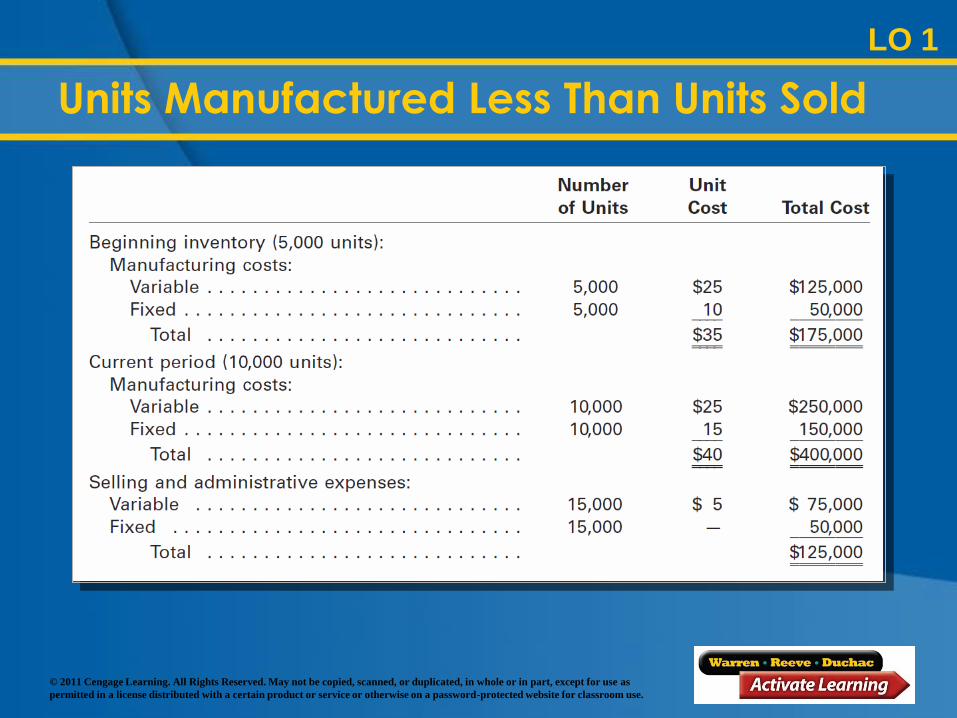
Assume that 5,000 units of inventory were on hand
at the beginning of a period, 10,000 units were
manufactured during the period, and 15,000 units
were sold at $50 per unit.
Units Manufactured Less Than Units Sold
LO 1
(continued)
© 2011 Cengage Learning. All Rights Reserved. May not be copied, scanned, or duplicated, in whole or in part, except for use as
permitted in a license distributed with a certain product or service or otherwise on a password-protected website for classroom use.
Units Manufactured Less Than Units Sold
LO 1
© 2011 Cengage Learning. All Rights Reserved. May not be copied, scanned, or duplicated, in whole or in part, except for use as
permitted in a license distributed with a certain product or service or otherwise on a password-protected website for classroom use.
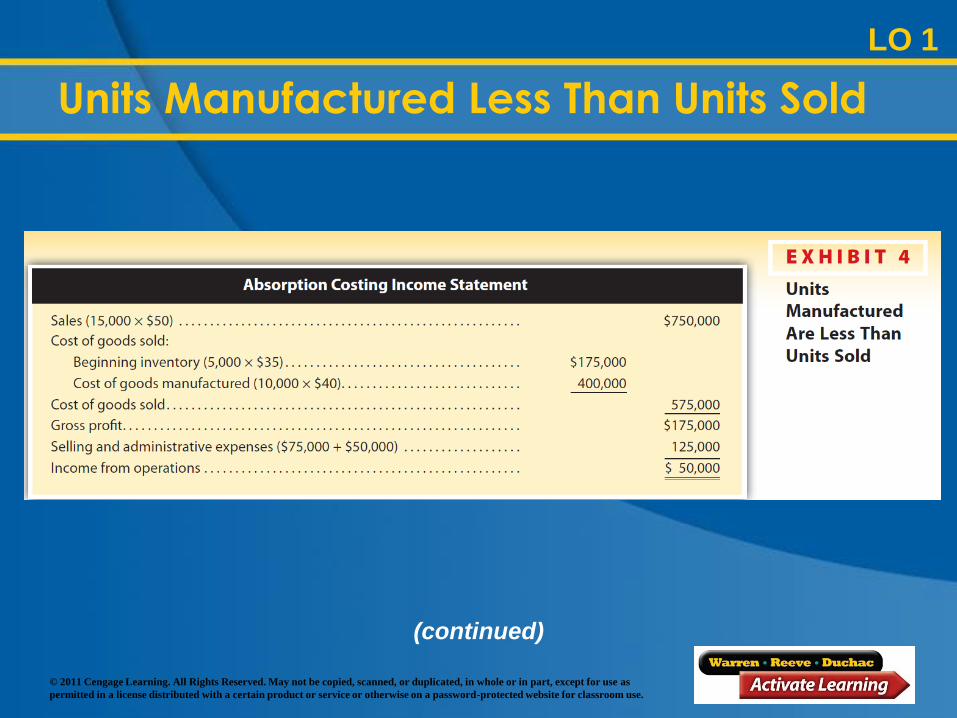
(continued)
Units Manufactured Less Than Units Sold
LO 1
© 2011 Cengage Learning. All Rights Reserved. May not be copied, scanned, or duplicated, in whole or in part, except for use as
permitted in a license distributed with a certain product or service or otherwise on a password-protected website for classroom use.
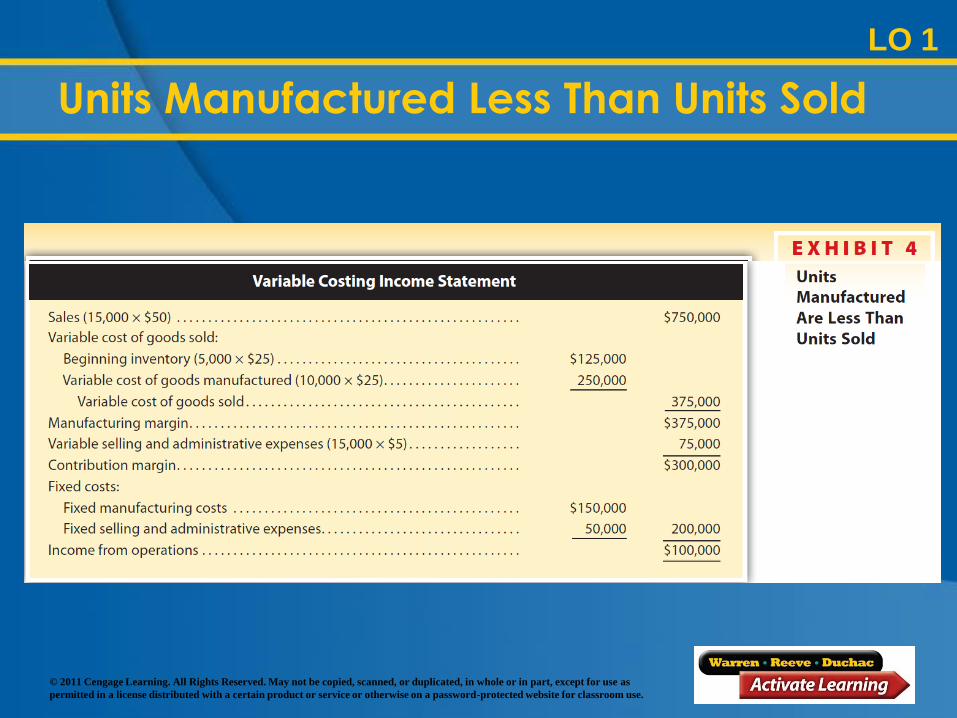
EE 20-3
© 2011 Cengage Learning. All Rights Reserved. May not be copied, scanned, or duplicated, in whole or in part, except for use as
permitted in a license distributed with a certain product or service or otherwise on a password-protected website for classroom use.
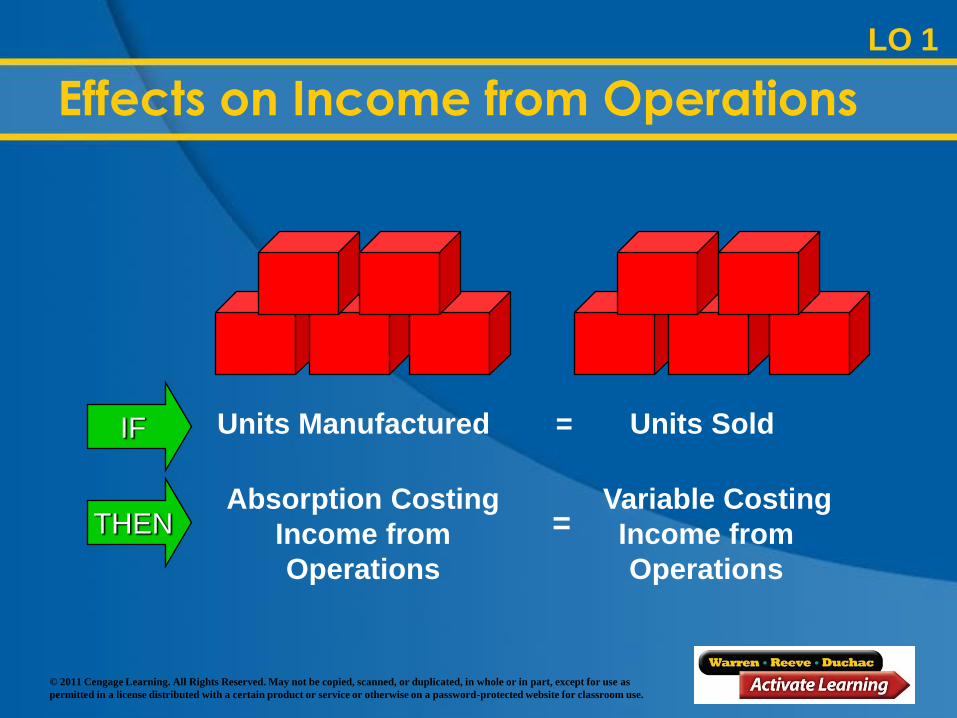
IF Units Manufactured = Units Sold
THEN Absorption Costing
Income from
Operations
Variable Costing
Income from
Operations
=
Effects on Income from Operations
LO 1
© 2011 Cengage Learning. All Rights Reserved. May not be copied, scanned, or duplicated, in whole or in part, except for use as
permitted in a license distributed with a certain product or service or otherwise on a password-protected website for classroom use.
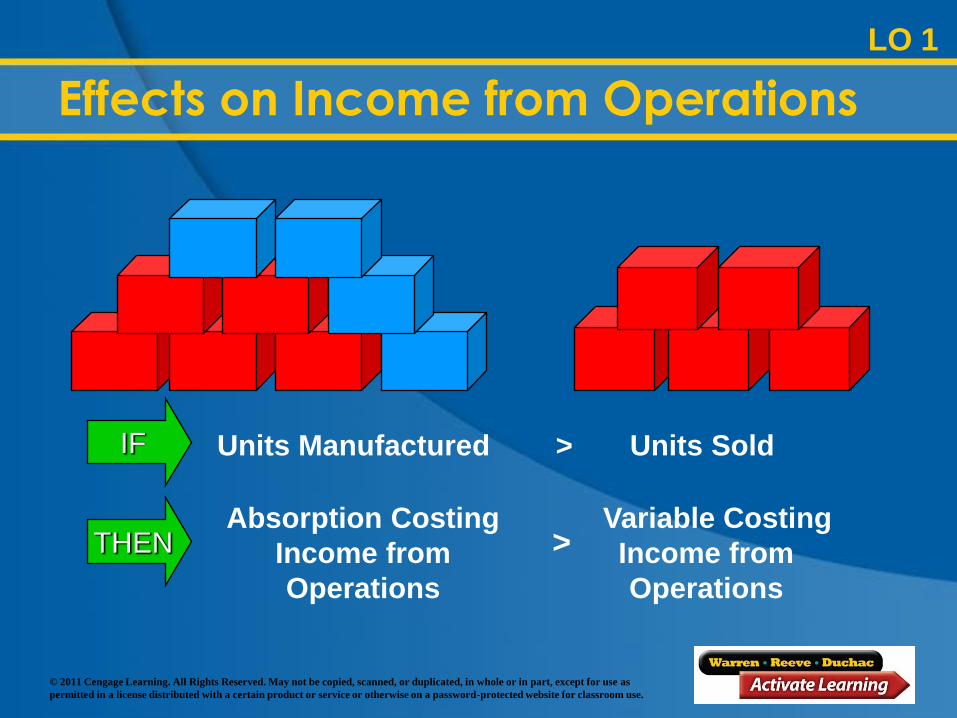
IF Units Manufactured > Units Sold
THEN Absorption Costing
Income from
Operations
Variable Costing
Income from
Operations
>
Effects on Income from Operations
LO 1
© 2011 Cengage Learning. All Rights Reserved. May not be copied, scanned, or duplicated, in whole or in part, except for use as
permitted in a license distributed with a certain product or service or otherwise on a password-protected website for classroom use.
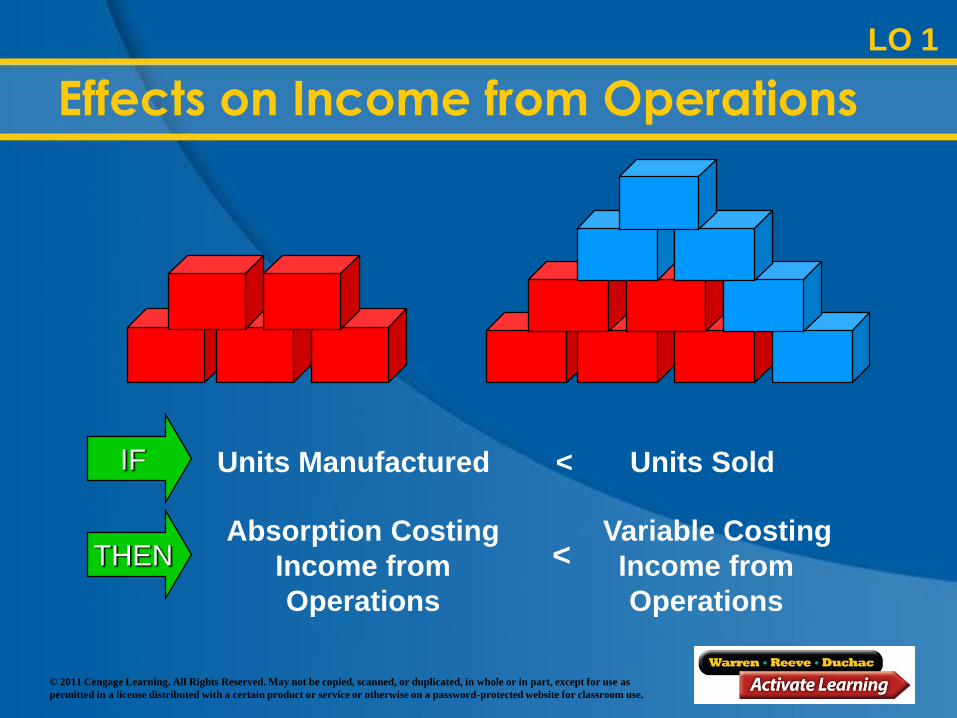
THEN Absorption Costing
Income from
Operations
Variable Costing
Income from
Operations
<
IF Units Manufactured < Units Sold
Effects on Income from Operations
LO 1
© 2011 Cengage Learning. All Rights Reserved. May not be copied, scanned, or duplicated, in whole or in part, except for use as
permitted in a license distributed with a certain product or service or otherwise on a password-protected website for classroom use.
Describe and
illustrate the effects
of absorption and
variable costing on
analyzing income
from operations.
Learning Objective 2
© 2011 Cengage Learning. All Rights Reserved. May not be copied, scanned, or duplicated, in whole or in part, except for use as
permitted in a license distributed with a certain product or service or otherwise on a password-protected website for classroom use.
Frand Manufacturing Company has no beginning
inventory, and sales are estimated to be 20,000
units at $75 per unit, regardless of production
levels.
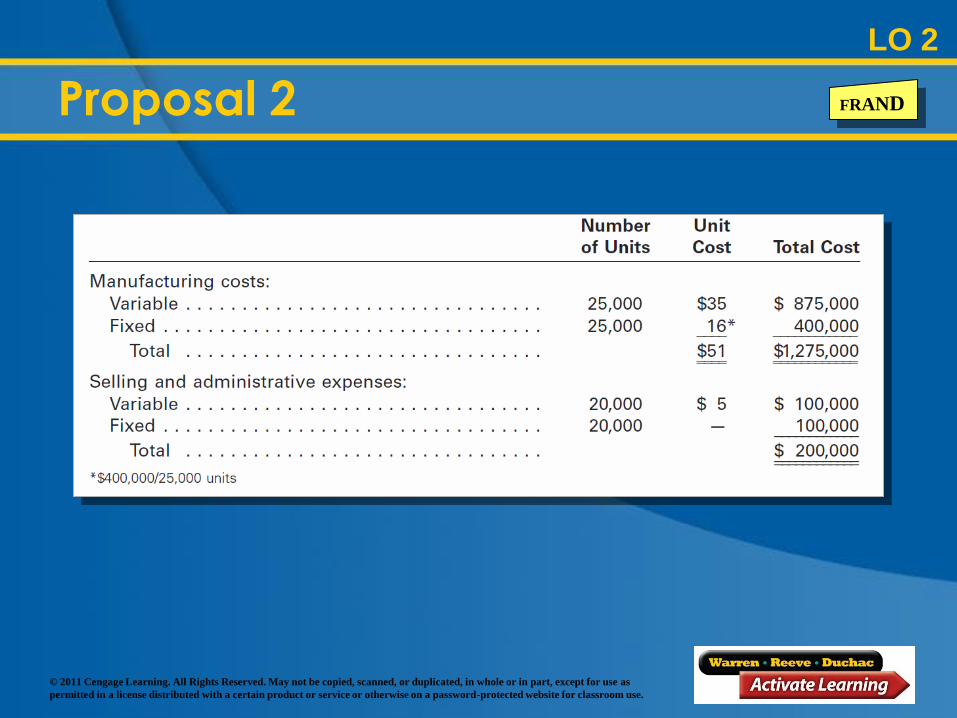
The management of Frand Manufacturing
Company is evaluating whether to manufacture
20,000 units (Proposal 1) or 25,000 units
(Proposal 2).
Frand Manufacturing Company
LO 2
FRAND
© 2011 Cengage Learning. All Rights Reserved. May not be copied, scanned, or duplicated, in whole or in part, except for use as
permitted in a license distributed with a certain product or service or otherwise on a password-protected website for classroom use.
Proposal 1
LO 2
FRAND
© 2011 Cengage Learning. All Rights Reserved. May not be copied, scanned, or duplicated, in whole or in part, except for use as
permitted in a license distributed with a certain product or service or otherwise on a password-protected website for classroom use.
Proposal 2
LO 2
FRAND
© 2011 Cengage Learning. All Rights Reserved. May not be copied, scanned, or duplicated, in whole or in part, except for use as
permitted in a license distributed with a certain product or service or otherwise on a password-protected website for classroom use.
LO 2
Income Analysis Under Absorption
and Variable Costing FRAND
© 2011 Cengage Learning. All Rights Reserved. May not be copied, scanned, or duplicated, in whole or in part, except for use as
permitted in a license distributed with a certain product or service or otherwise on a password-protected website for classroom use.
EE 20-4
© 2011 Cengage Learning. All Rights Reserved. May not be copied, scanned, or duplicated, in whole or in part, except for use as
permitted in a license distributed with a certain product or service or otherwise on a password-protected website for classroom use.
Learning Objective 3
Describe
management’s use of
absorption and
variable costing.
© 2011 Cengage Learning. All Rights Reserved. May not be copied, scanned, or duplicated, in whole or in part, except for use as
permitted in a license distributed with a certain product or service or otherwise on a password-protected website for classroom use.
LO 3
Using Absorption and Variable Costing
© 2011 Cengage Learning. All Rights Reserved. May not be copied, scanned, or duplicated, in whole or in part, except for use as
permitted in a license distributed with a certain product or service or otherwise on a password-protected website for classroom use.
Controlling Costs
For a specific level of management,
controllable costs are costs that can be
influenced by management at that level.
Noncontrollable costs are costs that
another level of management controls.
LO 3
© 2011 Cengage Learning. All Rights Reserved. May not be copied, scanned, or duplicated, in whole or in part, except for use as
permitted in a license distributed with a certain product or service or otherwise on a password-protected website for classroom use.
LO 3
Pricing Products
Many factors enter into determining the
selling price of a product.
The cost of making the product is significant
in all pricing decisions.
In the short run, fixed costs cannot be
avoided.
In the long run, a company must set its
selling price high enough to cover all costs
and expenses and generate income.
© 2011 Cengage Learning. All Rights Reserved. May not be copied, scanned, or duplicated, in whole or in part, except for use as
permitted in a license distributed with a certain product or service or otherwise on a password-protected website for classroom use.
LO 3
Planning Production
In the short run, planning production is
limited to existing capacity.
In the long run, planning production can
consider expanding capacity.
© 2011 Cengage Learning. All Rights Reserved. May not be copied, scanned, or duplicated, in whole or in part, except for use as
permitted in a license distributed with a certain product or service or otherwise on a password-protected website for classroom use.
LO 3
Analyzing Contribution Margins
Managers often plan and control operations
by evaluating the differences between
planned and actual contribution margins.
© 2011 Cengage Learning. All Rights Reserved. May not be copied, scanned, or duplicated, in whole or in part, except for use as
permitted in a license distributed with a certain product or service or otherwise on a password-protected website for classroom use.
LO 3
Analyzing Market Segments
A market segment is a portion of a business
that can be analyzed using sales, costs,
and expenses to determine its profitability.
© 2011 Cengage Learning. All Rights Reserved. May not be copied, scanned, or duplicated, in whole or in part, except for use as
permitted in a license distributed with a certain product or service or otherwise on a password-protected website for classroom use.
Learning Objective 4
Use variable costing for
analyzing market
segments, including
product, territories, and
salespersons segments.
© 2011 Cengage Learning. All Rights Reserved. May not be copied, scanned, or duplicated, in whole or in part, except for use as
permitted in a license distributed with a certain product or service or otherwise on a password-protected website for classroom use.
LO 4
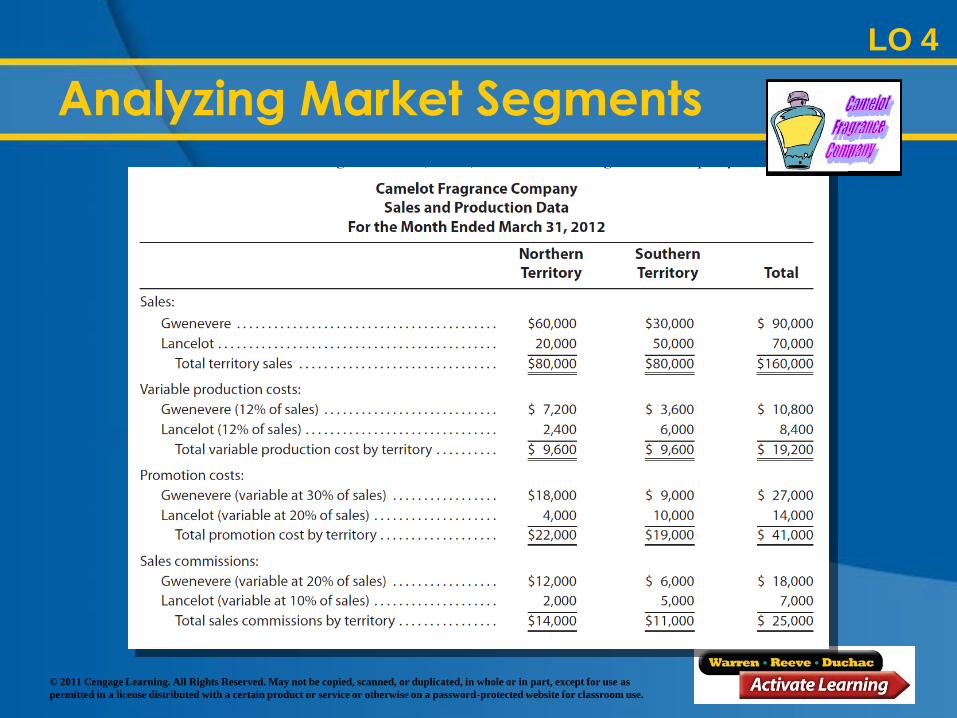
Analyzing Market Segments
Camelot Fragrance Company manufactures and
sells Gwenevere perfume for women and the
Lancelot cologne line for men. The company’s
data for the month ended March 31, 2012, is
shown in the next slide.
© 2011 Cengage Learning. All Rights Reserved. May not be copied, scanned, or duplicated, in whole or in part, except for use as
permitted in a license distributed with a certain product or service or otherwise on a password-protected website for classroom use.
LO 4
Analyzing Market Segments
© 2011 Cengage Learning. All Rights Reserved. May not be copied, scanned, or duplicated, in whole or in part, except for use as
permitted in a license distributed with a certain product or service or otherwise on a password-protected website for classroom use.
LO 4
Sales Territory Profitability Analysis
Sales territory profitability analysis may lead
management to do the following:
Reduce costs in lower-profit sales territories
Increase sales efforts in higher-profit
territories
© 2011 Cengage Learning. All Rights Reserved. May not be copied, scanned, or duplicated, in whole or in part, except for use as
permitted in a license distributed with a certain product or service or otherwise on a password-protected website for classroom use.
LO 4
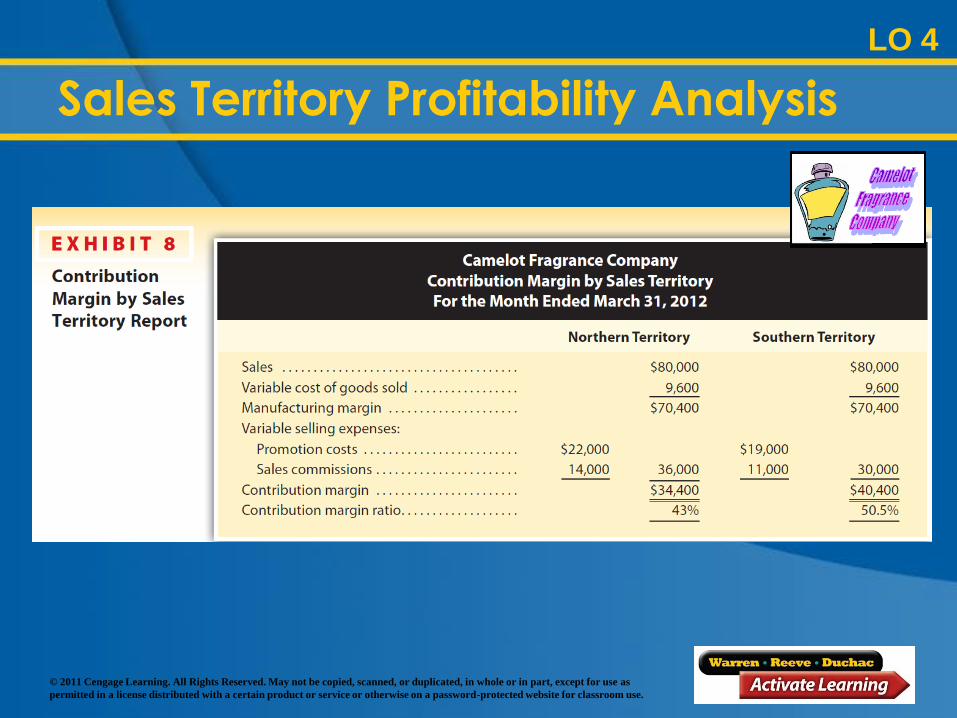
Sales Territory Profitability Analysis
To illustrate the analysis of profit differences by
sales territory, Exhibit 8 shows the variable
costing income statement by sales territories for
Camelot Fragrance Company.
© 2011 Cengage Learning. All Rights Reserved. May not be copied, scanned, or duplicated, in whole or in part, except for use as
permitted in a license distributed with a certain product or service or otherwise on a password-protected website for classroom use.
LO 4
Sales Territory Profitability Analysis
© 2011 Cengage Learning. All Rights Reserved. May not be copied, scanned, or duplicated, in whole or in part, except for use as
permitted in a license distributed with a certain product or service or otherwise on a password-protected website for classroom use.
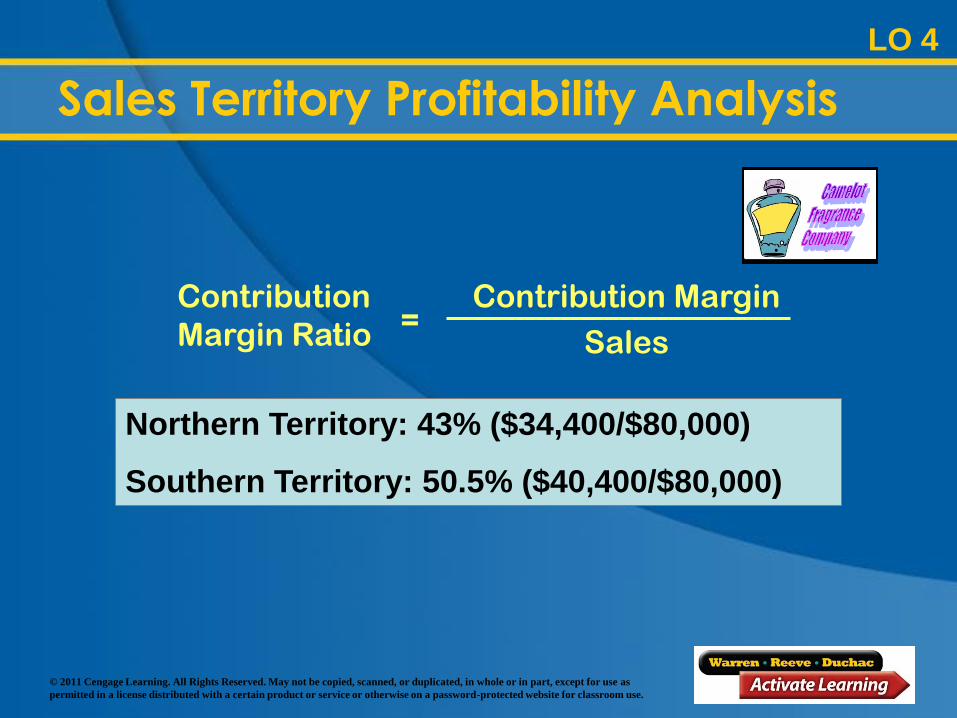
Contribution
Margin Ratio = Contribution Margin
Sales
Northern Territory: 43% ($34,400/$80,000)
Southern Territory: 50.5% ($40,400/$80,000)
LO 4
Sales Territory Profitability Analysis
© 2011 Cengage Learning. All Rights Reserved. May not be copied, scanned, or duplicated, in whole or in part, except for use as
permitted in a license distributed with a certain product or service or otherwise on a password-protected website for classroom use.
LO 4
Sales Territory Profitability Analysis
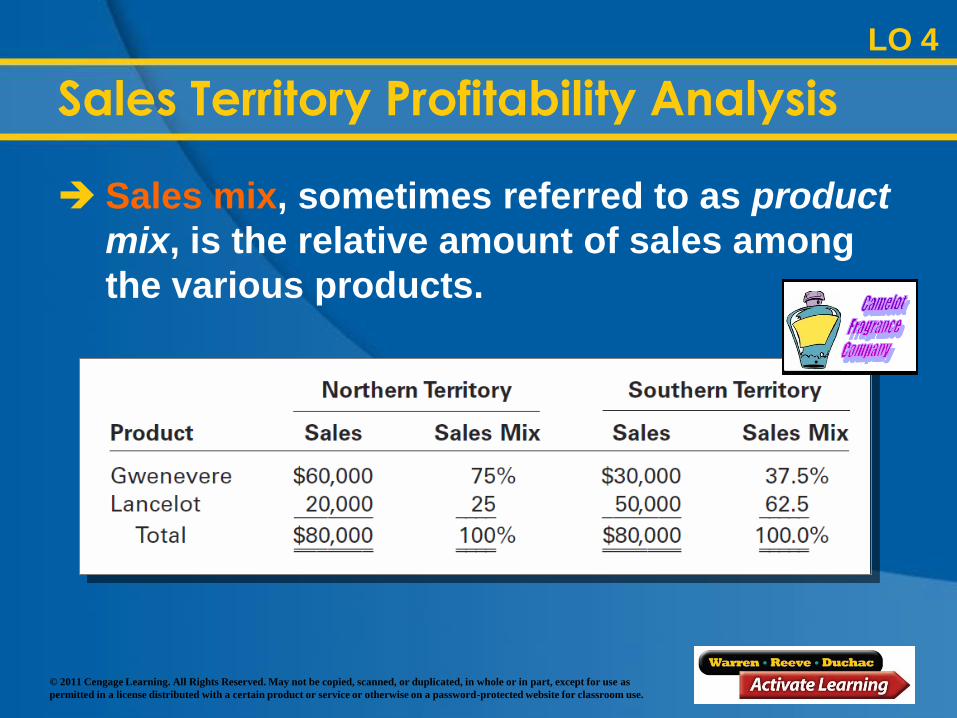
Sales mix, sometimes referred to as product
mix, is the relative amount of sales among
the various products.
© 2011 Cengage Learning. All Rights Reserved. May not be copied, scanned, or duplicated, in whole or in part, except for use as
permitted in a license distributed with a certain product or service or otherwise on a password-protected website for classroom use.
Product Profitability Analysis
A company should focus its sales efforts on
products that will provide the maximum
total contribution margin.
LO 4
© 2011 Cengage Learning. All Rights Reserved. May not be copied, scanned, or duplicated, in whole or in part, except for use as
permitted in a license distributed with a certain product or service or otherwise on a password-protected website for classroom use.
Product Profitability Analysis
LO 4
© 2011 Cengage Learning. All Rights Reserved. May not be copied, scanned, or duplicated, in whole or in part, except for use as
permitted in a license distributed with a certain product or service or otherwise on a password-protected website for classroom use.
A salesperson profitability report is useful
in evaluating sales performance.
Such a report normally includes total sales,
variable cost of goods sold, variable selling
expenses, contribution margin, and
contribution margin ratio for each
salesperson.
Salesperson Profitability Analysis
LO 4
© 2011 Cengage Learning. All Rights Reserved. May not be copied, scanned, or duplicated, in whole or in part, except for use as
permitted in a license distributed with a certain product or service or otherwise on a password-protected website for classroom use.
EE 20-5
© 2011 Cengage Learning. All Rights Reserved. May not be copied, scanned, or duplicated, in whole or in part, except for use as
permitted in a license distributed with a certain product or service or otherwise on a password-protected website for classroom use.
Learning Objective 5
Use variable costing for
analyzing and
explaining changes in
contribution margin as a
result of quantity and
price factors.
© 2011 Cengage Learning. All Rights Reserved. May not be copied, scanned, or duplicated, in whole or in part, except for use as
permitted in a license distributed with a certain product or service or otherwise on a password-protected website for classroom use.
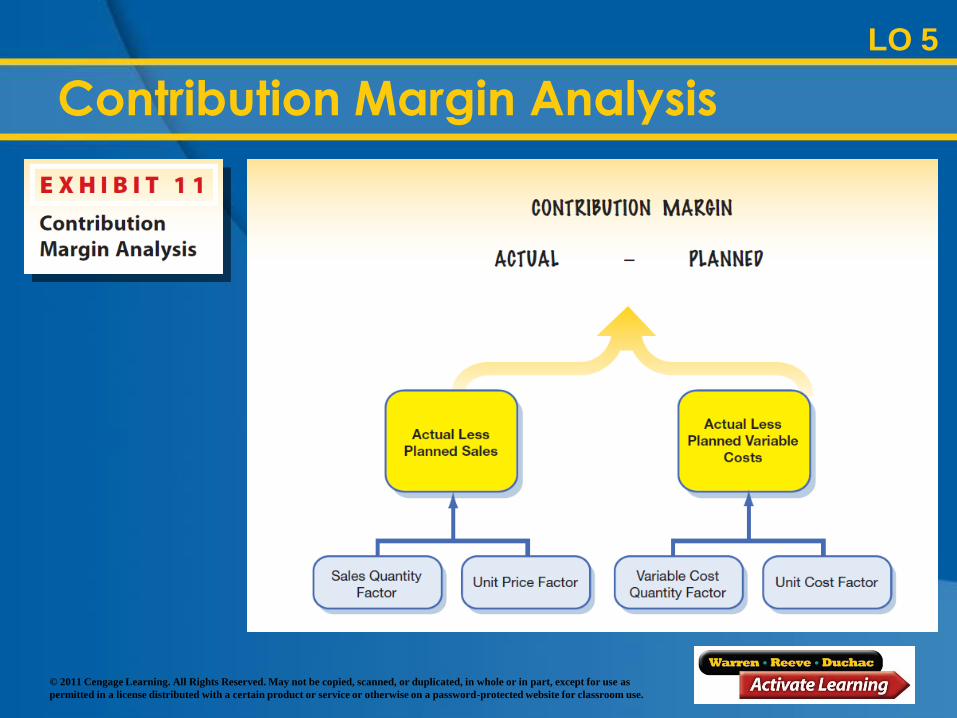
LO 5
Contribution Margin Analysis
Contribution margin analysis focuses on
explaining the differences between
planned and actual contribution margins.
A difference between the planned and
actual contribution margin may be caused
by an increase or a decrease in:
Sales
Variable costs
© 2011 Cengage Learning. All Rights Reserved. May not be copied, scanned, or duplicated, in whole or in part, except for use as
permitted in a license distributed with a certain product or service or otherwise on a password-protected website for classroom use.
LO 5
Contribution Margin Analysis
An increase or a decrease in sales or
variable costs may in turn be due to an
increase or a decrease in the:
Number of units sold
Unit sales price or unit cost
© 2011 Cengage Learning. All Rights Reserved. May not be copied, scanned, or duplicated, in whole or in part, except for use as
permitted in a license distributed with a certain product or service or otherwise on a password-protected website for classroom use.
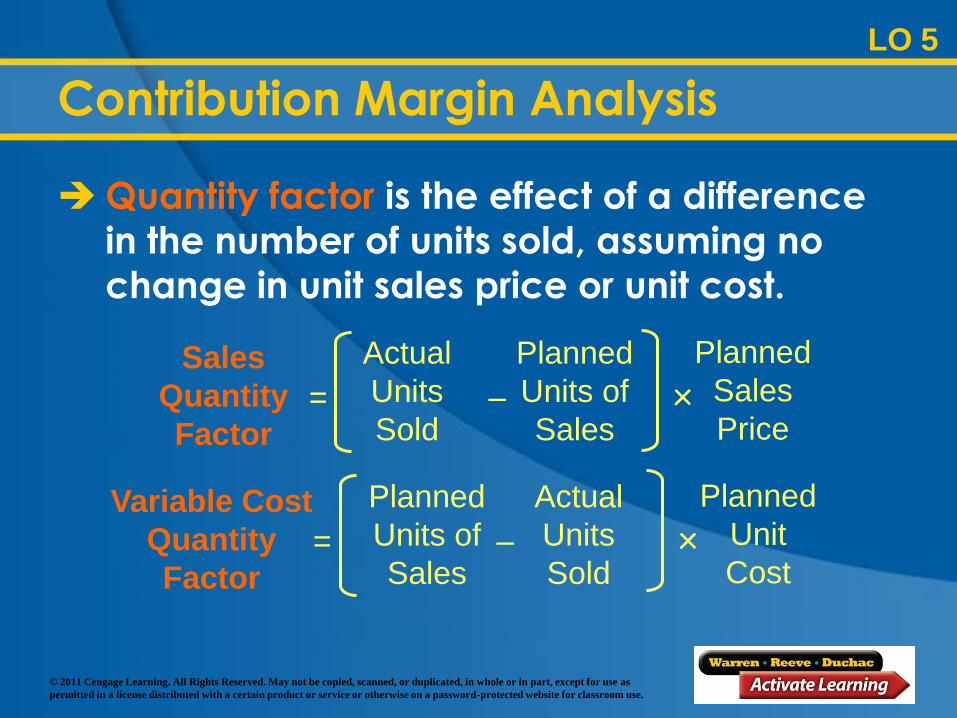
Sales
Quantity
Factor
Actual
Units
Sold
Planned
Units of
Sales
Planned
Sales
Price = – ×
Variable Cost
Quantity
Factor
Planned
Units of
Sales
Actual
Units
Sold
Planned
Unit
Cost = – ×
LO 5
Contribution Margin Analysis
Quantity factor is the effect of a difference
in the number of units sold, assuming no
change in unit sales price or unit cost.
© 2011 Cengage Learning. All Rights Reserved. May not be copied, scanned, or duplicated, in whole or in part, except for use as
permitted in a license distributed with a certain product or service or otherwise on a password-protected website for classroom use.
Unit
Price
Factor
Actual
Selling
Price per
Unit
Planned
Selling
Price per
Unit
Actual
Units
Sold = – ×
Unit
Cost
Factor
Planned
Cost per
Unit
Actual
Cost per
Unit
Actual
Units
Sold = – ×
LO 5
Contribution Margin Analysis
Unit price factor or unit cost factor is the
effect of a difference in unit sales price or
unit cost on the number of units sold.
© 2011 Cengage Learning. All Rights Reserved. May not be copied, scanned, or duplicated, in whole or in part, except for use as
permitted in a license distributed with a certain product or service or otherwise on a password-protected website for classroom use.
LO 5
Contribution Margin Analysis
© 2011 Cengage Learning. All Rights Reserved. May not be copied, scanned, or duplicated, in whole or in part, except for use as
permitted in a license distributed with a certain product or service or otherwise on a password-protected website for classroom use.
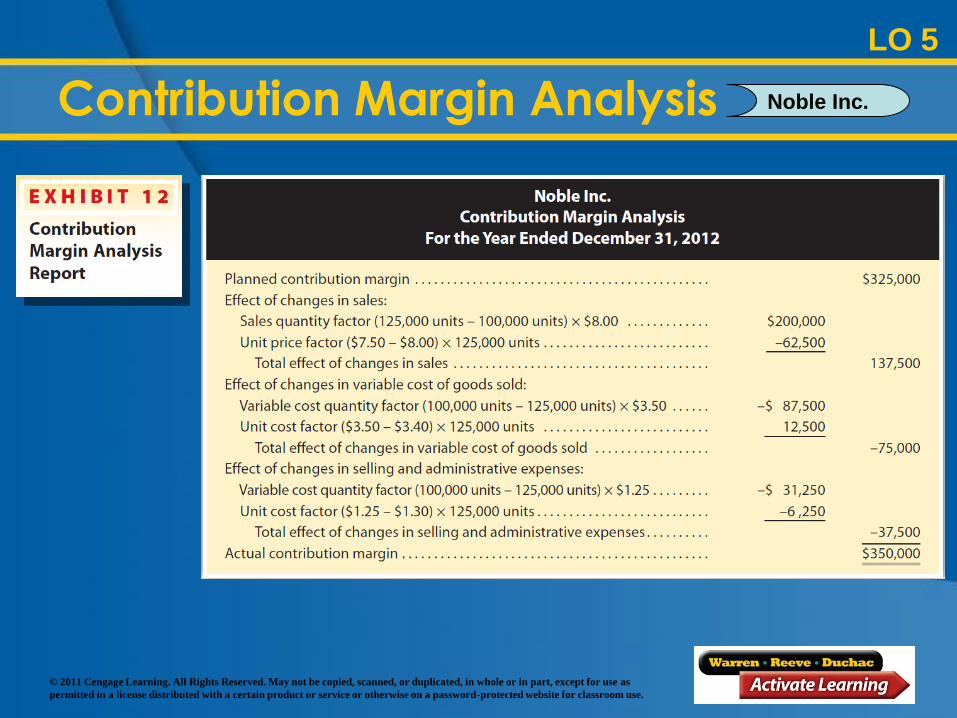
LO 5
Contribution Margin Analysis
Year Ended December 31, 2012
Noble Inc.
© 2011 Cengage Learning. All Rights Reserved. May not be copied, scanned, or duplicated, in whole or in part, except for use as
permitted in a license distributed with a certain product or service or otherwise on a password-protected website for classroom use.
LO 5
Contribution Margin Analysis Noble Inc.
© 2011 Cengage Learning. All Rights Reserved. May not be copied, scanned, or duplicated, in whole or in part, except for use as
permitted in a license distributed with a certain product or service or otherwise on a password-protected website for classroom use.
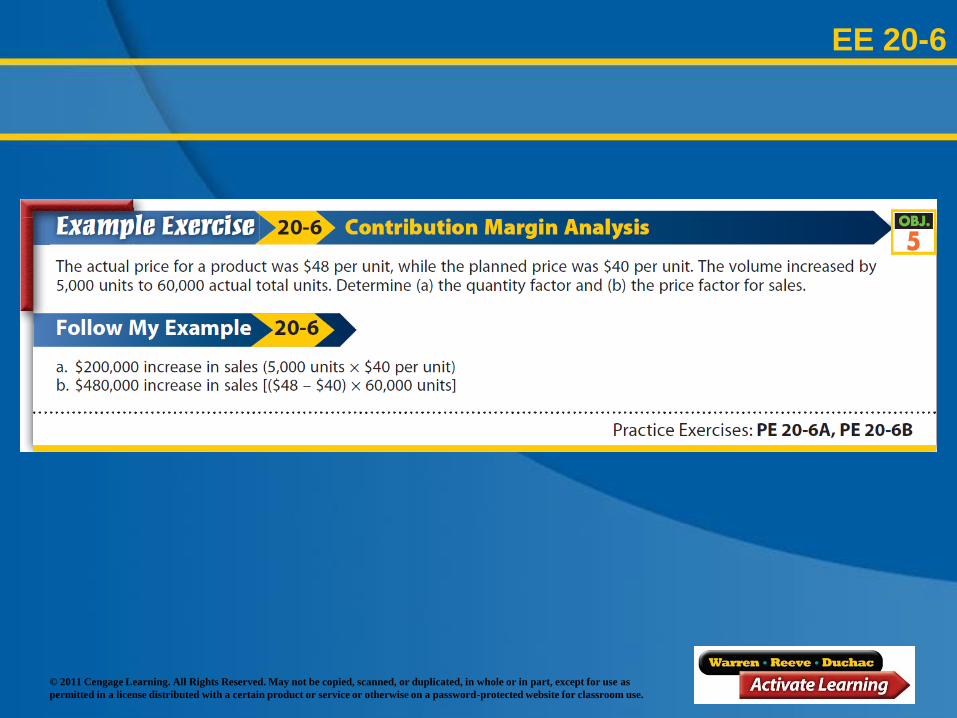
EE 20-6
© 2011 Cengage Learning. All Rights Reserved. May not be copied, scanned, or duplicated, in whole or in part, except for use as
permitted in a license distributed with a certain product or service or otherwise on a password-protected website for classroom use.
Learning Objective 6
Describe and
illustrate the use of
variable costing for
service firms.
© 2011 Cengage Learning. All Rights Reserved. May not be copied, scanned, or duplicated, in whole or in part, except for use as
permitted in a license distributed with a certain product or service or otherwise on a password-protected website for classroom use.
Variable Costing for Service Firms
Unlike a manufacturing company, a service
company does not make or sell a product.
As a result, service companies do not have
inventory and, thus, do not allocate fixed
costs to inventory using absorption costing
concepts.
LO 6
© 2011 Cengage Learning. All Rights Reserved. May not be copied, scanned, or duplicated, in whole or in part, except for use as
permitted in a license distributed with a certain product or service or otherwise on a password-protected website for classroom use.
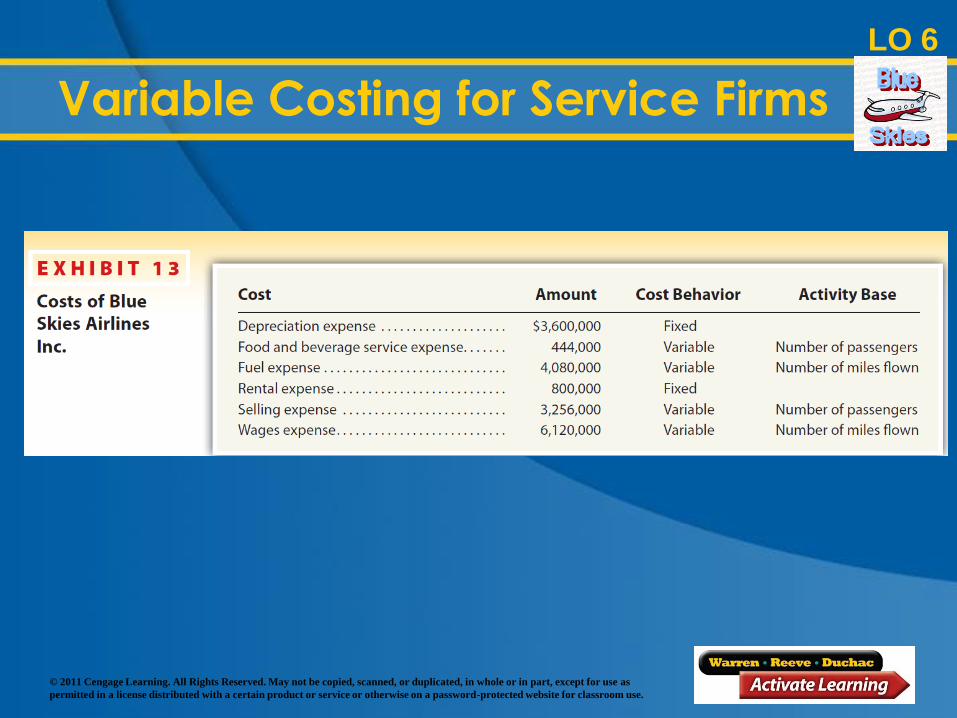
Service firms can report and analyze contribution
margin as the difference between revenues and
variable costs. To analyze a service firm, we will
use Blues Skies Airlines. The fixed and variable
costs associated with operating Blue Skies are
shown in Exhibit 13 (next slide).
Variable Costing for Service Firms
LO 6
© 2011 Cengage Learning. All Rights Reserved. May not be copied, scanned, or duplicated, in whole or in part, except for use as
permitted in a license distributed with a certain product or service or otherwise on a password-protected website for classroom use.
The variable costing income statement for Blue
Skies Airlines is shown in Exhibit 14 (next slide).
Blue Skies Airlines uses the activity base number
of passengers for food and beverage service and
selling expenses. The company uses number of
miles flown for fuel and wages expenses.
Variable Costing for Service Firms
LO 6
© 2011 Cengage Learning. All Rights Reserved. May not be copied, scanned, or duplicated, in whole or in part, except for use as
permitted in a license distributed with a certain product or service or otherwise on a password-protected website for classroom use.
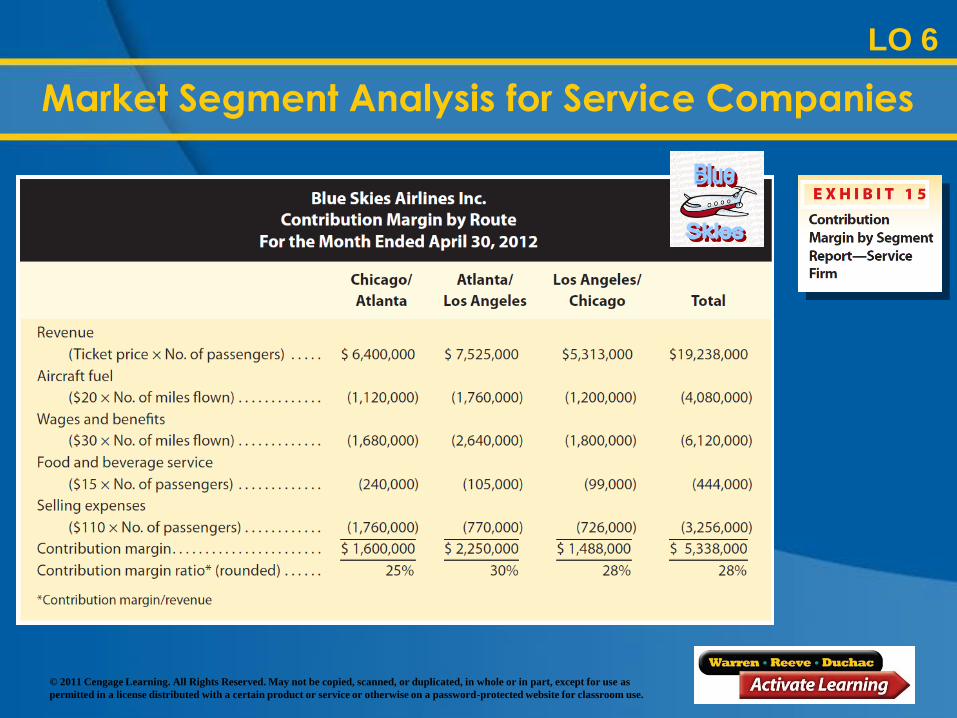
LO 6
Market Segment Analysis for Service Companies
© 2011 Cengage Learning. All Rights Reserved. May not be copied, scanned, or duplicated, in whole or in part, except for use as
permitted in a license distributed with a certain product or service or otherwise on a password-protected website for classroom use.
Blue Skies Airlines
LO 6
Market Segment Analysis for Service Companies
© 2011 Cengage Learning. All Rights Reserved. May not be copied, scanned, or duplicated, in whole or in part, except for use as
permitted in a license distributed with a certain product or service or otherwise on a password-protected website for classroom use.
Market Segment Analysis for Service Companies
LO 6
© 2011 Cengage Learning. All Rights Reserved. May not be copied, scanned, or duplicated, in whole or in part, except for use as
permitted in a license distributed with a certain product or service or otherwise on a password-protected website for classroom use.
Contribution Margin Analysis
LO 6
© 2011 Cengage Learning. All Rights Reserved. May not be copied, scanned, or duplicated, in whole or in part, except for use as
permitted in a license distributed with a certain product or service or otherwise on a password-protected website for classroom use.
Contribution Margin Analysis
LO 6
Prepared by: C. Douglas Cloud
Professor Emeritus of Accounting
Pepperdine University
© 2011 Cengage Learning. All Rights Reserved. May not be copied, scanned, or duplicated, in whole or in part, except for use as
permitted in a license distributed with a certain product or service or otherwise on a password-protected website for classroom use.
Variable Costing for Management Analysis
The End