5-134 Draft HGM Guidebook for South Coast Santa Barbara Streams Variable: SHADE OVER THE STREAM CHANNEL (V SHADE ) Figure 5.15 Measurement protocol for the shade variable (V SHADE ) b. a. calculate the average canopy cover over the active channel and for the average overhang distance. To determine a shade index for the VAA, multiply the average distance measurement of canopy overhang by the average percent canopy coverage (in decimals; i.e., 60% = 0.60)
Transcript
5-134 Draft HGM Guidebook for South Coast Santa Barbara Streams
Variable: SHADE OVER THE STREAM CHANNEL (VSHADE)
Figure 5.15 Measurement protocol for the shade variable (VSHADE)
b.
a.
calculate the average canopy cover over the active channel and for the averageoverhang distance. To determine a shade index for the VAA, multiply theaverage distance measurement of canopy overhang by the average percentcanopy coverage (in decimals; i.e., 60% = 0.60)
Assessment Model 5-135
Located in Appendix B-33 through B-60Data
Variable: SHADE OVER THE STREAM CHANNEL (VSHADE)
Scaling Rationale The Authors scaled VSHADE using a combination of reference data, fieldobservations, and best scientific judgment. To begin, the Authors analyzedreference data for the three subclasses separately. Similarities in shade condi-tions between High and Moderate gradient subclasses led us to group thesesubclasses for scaling purposes. Generally, the Authors assumed that High andModerate gradient stream channels with a significant proportion of overhangingshade represented the reference standard condition (see Table 5.20 below). Forexample, the data indicate that reference standard conditions in the Moderateand High gradient subclasses have a shade index of greater than 30. Thereference standard site in the High gradient reaches of Cold Spring Creek (Site#9) had 95% canopy coverage over the active channel and an overhang ofapproximately 50 ft. Using these data, Site #9 had a shade index of 47.5.
With respect to the Low gradient subclass, the Authors expected significantlyless canopy coverage over the active channel due to the extent of humanactivities in comparison to Moderate and High gradient subclasses (see Table5.21 below). In view of the fact that the Authors did not find a referencestandard site in the Low gradient subclass, the Authors used reference systemdata and best professional judgment to project reference standard conditions.The Authors’ projections indicate that reference standard conditions in theLOW gradient subclass should have a shade index of greater than 15.
Table 5.20 Mean, standard deviation and range of the average canopy overhang andthe percent canopy coverage for High and Moderate gradient subclasses
Land Use Sample Shade Index
Gradient Size (Mean, SD, Range)
Unaltered / Reference Standard 4 18 + 19.9 (5 to 48)
Minimally Altered 10 9.8 + 6.1 (0 to 22)
Moderately Altered 16 9.9 + 10.9 (0 to 30)
Extensively Altered 8 3.2 + 3.5 (0 to 10.5)
Unrecoverable 0 0
5-136 Draft HGM Guidebook for South Coast Santa Barbara Streams
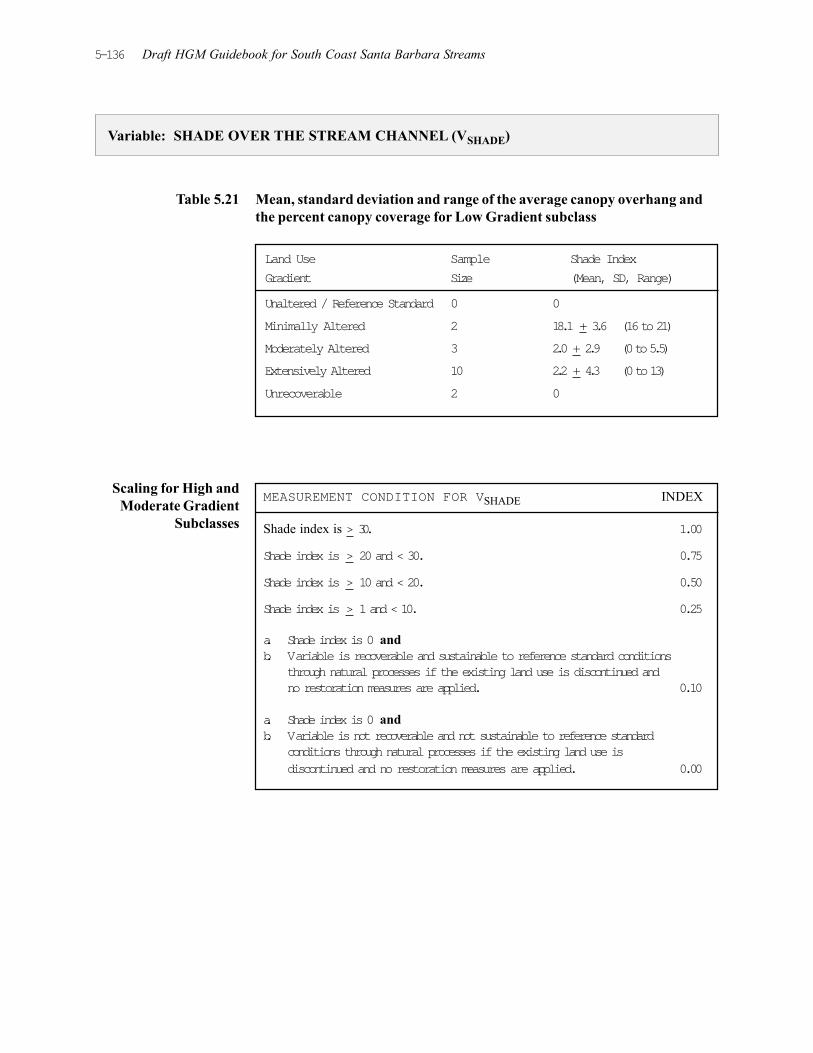
Table 5.21 Mean, standard deviation and range of the average canopy overhang andthe percent canopy coverage for Low Gradient subclass
Land Use Sample Shade Index
Gradient Size (Mean, SD, Range)
Unaltered / Reference Standard 0 0
Minimally Altered 2 18.1 + 3.6 (16 to 21)
Moderately Altered 3 2.0 + 2.9 (0 to 5.5)
Extensively Altered 10 2.2 + 4.3 (0 to 13)
Unrecoverable 2 0
Variable: SHADE OVER THE STREAM CHANNEL (VSHADE)
Scaling for High andModerate Gradient
Subclasses
MEASUREMENT CONDITION FOR VSHADE INDEX
Shade index is > 30. 1.00
Shade index is > 20 and < 30. 0.75
Shade index is > 10 and < 20. 0.50
Shade index is > 1 and < 10. 0.25
a. Shade index is 0 andb. Variable is recoverable and sustainable to reference standard conditions
through natural processes if the existing land use is discontinued andno restoration measures are applied. 0.10
a. Shade index is 0 andb. Variable is not recoverable and not sustainable to reference standard
conditions through natural processes if the existing land use isdiscontinued and no restoration measures are applied. 0.00
Assessment Model 5-137
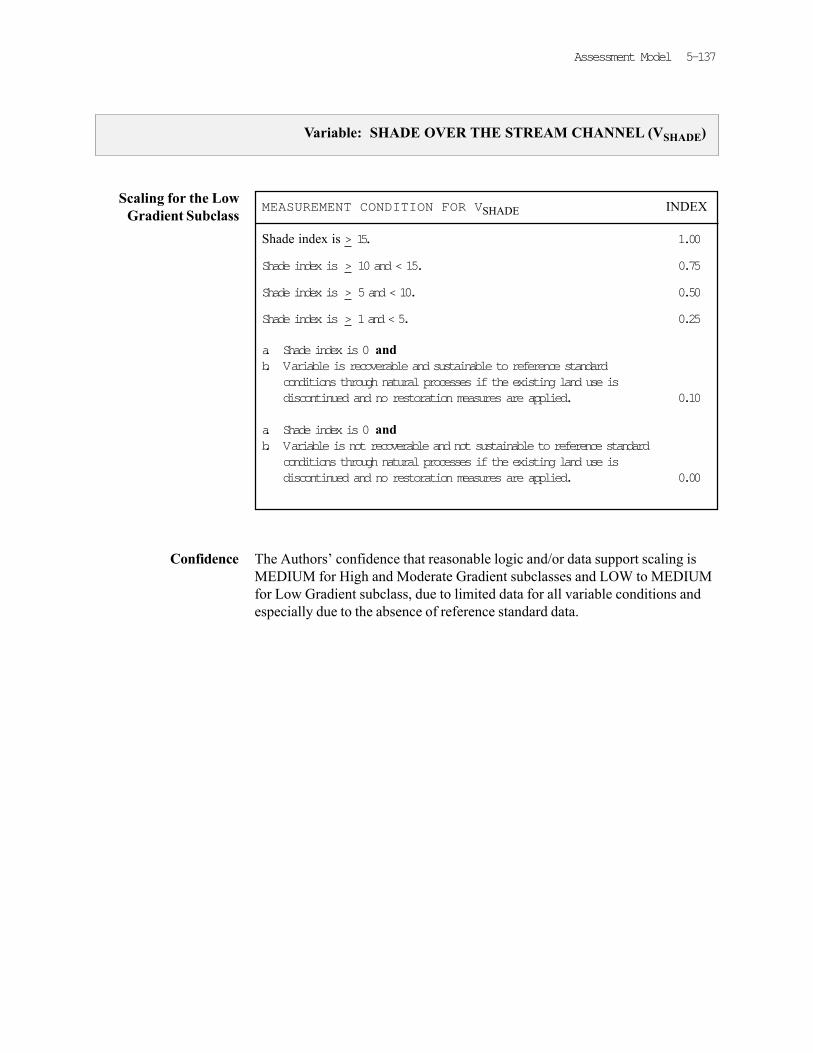
Scaling for the LowGradient Subclass
Variable: SHADE OVER THE STREAM CHANNEL (VSHADE)
MEASUREMENT CONDITION FOR VSHADE INDEX
Shade index is > 15. 1.00
Shade index is > 10 and < 15. 0.75
Shade index is > 5 and < 10. 0.50
Shade index is > 1 and < 5. 0.25
a. Shade index is 0 andb. Variable is recoverable and sustainable to reference standard
conditions through natural processes if the existing land use isdiscontinued and no restoration measures are applied. 0.10
a. Shade index is 0 andb. Variable is not recoverable and not sustainable to reference standard
conditions through natural processes if the existing land use isdiscontinued and no restoration measures are applied. 0.00
Confidence The Authors’ confidence that reasonable logic and/or data support scaling isMEDIUM for High and Moderate Gradient subclasses and LOW to MEDIUMfor Low Gradient subclass, due to limited data for all variable conditions andespecially due to the absence of reference standard data.
5-138 Draft HGM Guidebook for South Coast Santa Barbara Streams
SHRUB CANOPY COVER (VSHRUBCC)
Definition Shrub Canopy Cover is the percent canopy cover of shrubs (multiple stemmedwoody species) within the VAA.
Rationale for Selectionof the Variable
Shrub canopy coverage is one measure of vegetation that indicates maintenanceof native plant community structure and function. As such, shrub canopy covercan be used along with other measures of vegetation cover to indicate thepotential for a site to support characteristic ecosystem processes, such asmaintenance of native and nonnative plant communities, faunal communitiesand faunal support/habitat, etc. The presence of shrubs along with that oftrees, contributes to roughness and topographic variation on floodplain andchannel sites. Roughness provides a mechanism to slow water flows and thusprovides static and dynamic storage of flood flows as well as cover for aquaticand terrestrial fauna. Shrubs, along with trees, maintain channel morphologyby increasing bank shear strength through the production and maintenance offine root biomass. Shrubs also function as structural elements that limit and/orcontrol development and maintenance of channel geometry.
Shrubs provide allochotonous inputs of labile and refractory organic carbon toriverine ecosystems. In addition, the shrub canopies alter micro-climaticconditions in riparian forests (e.g., moisture, nutrients, light, temperature, windspeed etc.). Microclimatic alterations caused by the presence of shrubs isimportant in maintaining several ecosystem functions, such as biomass produc-tion, maintenance of site water balance, nutrient conservation, habitat structure,etc. Furthermore, shrubs, along with trees, are instrumental in soil genesis,elemental cycling, and successional processes (Hooper and Vitousek 1997).These successional processes include the dispersal and establishment of plantpropagules, which support plant and animal species diversity and turnover(Tilman 1982, Huston and Smith 1987, Cohen and Levin 1991, Tilman andPacala 1993).
MeasurementProtocol
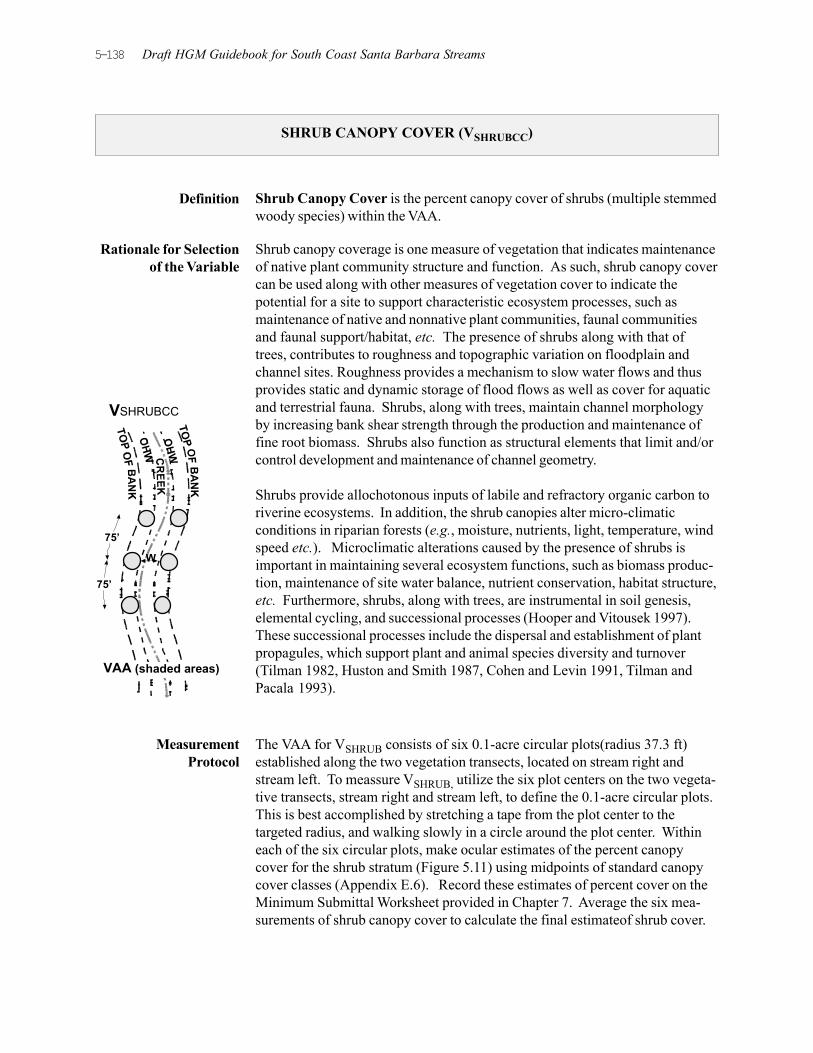
The VAA for VSHRUB consists of six 0.1-acre circular plots(radius 37.3 ft)established along the two vegetation transects, located on stream right andstream left. To meassure VSHRUB, utilize the six plot centers on the two vegeta-tive transects, stream right and stream left, to define the 0.1-acre circular plots.This is best accomplished by stretching a tape from the plot center to thetargeted radius, and walking slowly in a circle around the plot center. Withineach of the six circular plots, make ocular estimates of the percent canopycover for the shrub stratum (Figure 5.11) using midpoints of standard canopycover classes (Appendix E.6). Record these estimates of percent cover on theMinimum Submittal Worksheet provided in Chapter 7. Average the six mea-surements of shrub canopy cover to calculate the final estimateof shrub cover.
VSHRUBCC
W
75’
75’
VAA (shaded areas)
Assessment Model 5-139
Data Located in Appendix B-33 through B-60
Variable: SHRUB CANOPY COVER (VSHRUBCC)
Scaling Rationale The Authors scaled VSHRUBCC using reference data, field observations, and bestscientific judgment. Specifically, reference data for all three subclasses weregrouped according to similarities in plant community structure. Reference datawere analyzed to determine average shrub cover (by cover class midpoint) foreach plot. This provided the Authors with ranges of shrub canopy coveragethat were used to describe the natural range of variation of shrub dominancewithin forested riparian communities of the SCSBC. Canopy coverage valuesfor shrubs exhibited substantial variation within all subclasses, and differencesamong subclasses did not warrant development of individual scales for eachsubclass. In general, sites that were either intact without substantial perturba-tion by humans or late successional, supported comparatively low VSHRUBCCvalues. Early successional sites and/or those impacted by humans tended tosupport higher shrub canopy coverage within the PAA.
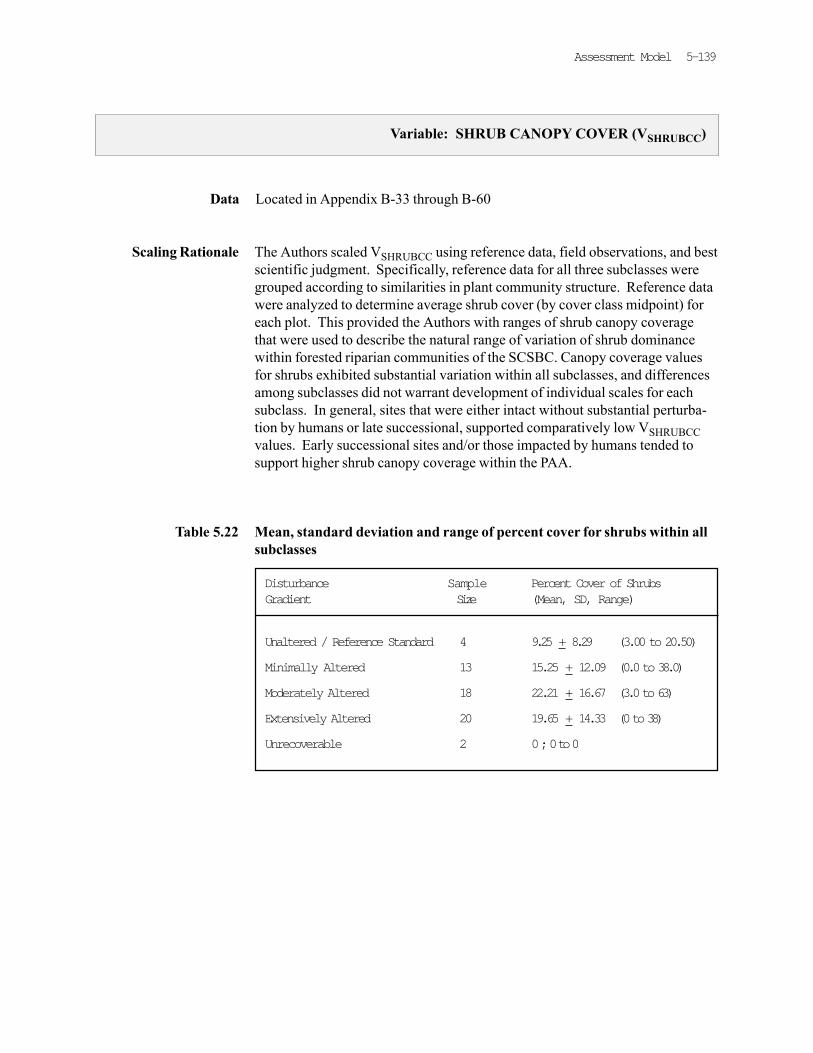
Table 5.22 Mean, standard deviation and range of percent cover for shrubs within allsubclasses
Disturbance Sample Percent Cover of ShrubsGradient Size (Mean, SD, Range)
Unaltered / Reference Standard 4 9.25 + 8.29 (3.00 to 20.50)
Minimally Altered 13 15.25 + 12.09 (0.0 to 38.0)
Moderately Altered 18 22.21 + 16.67 (3.0 to 63)
Extensively Altered 20 19.65 + 14.33 (0 to 38)
Unrecoverable 2 0 ; 0 to 0
5-140 Draft HGM Guidebook for South Coast Santa Barbara Streams
Variable: SHRUB CANOPY COVER (VSHRUBCC)
Scaling for High,Moderate, and Lowgradient subclasses
Confidence The Authors’ confidence that reasonable logic and/or data support scaling isHIGH for all subclasses.
MEASUREMENT CONDITION FOR VSHRUBCC INDEX
a. Average shrub canopy cover > 3% and < 10%, andb. Vegetation is unaltered by human activities. 1.00
a. Average shrub canopy cover > 3% and < 10%, andb. Vegetation below top of bank is altered by human activities
(e.g., partial clearing of the vegetation by grazing of domesticlivestock, parks, urban/suburban development,flood control access, etc.). 0.75
a. Average shrub canopy cover > 10% but < 30%, andb. Vegetation below top of bank is altered by human activities
(e.g., partial clearing of the vegetation by grazing of domesticlivestock, parks, urban/suburban development, flood controlaccess, etc.). 0.50
a. Average shrub canopy cover > 0 and < 3%, andb. Vegetation below top of bank is recently altered (within the last
5 years) by human activities, orc. Average shrub canopy cover > 30%. 0.25
a. Average shrub canopy cover is 0% due to human modifications thatprevent the establishment of vegetation (e.g., concrete trapezoidalchannel, parking lot, box culvert, roads, etc.), and
b. Variable is recoverable and sustainable to reference standardconditions through natural processes if the existing land use isdiscontinued and no restoration measures are applied. 0.10
a. Average shrub canopy cover is 0% due to human modifications thatprevent the establishment of vegetation (e.g., concrete trapezoidalchannel, parking lot, box culvert, roads, etc.) and
b. Variable is neither recoverable nor sustainable to reference standardconditions through natural processes if the existing land use isdiscontinued and no restoration measures are applied. 0.00
Assessment Model 5-141
SNAGS (VSNAG)
Definition Snags refers to the basal area of standing dead trees (snags) > 3” DBH.
Rationale for Selectionof the Variable
Snags provide habitat structure for birds, small mammals, herpetofauna, andseveral other classes of terrestrial and aquatic invertebrates and vertebrates.Additionally, snags contribute refractory organic carbon (detritus) to terrestrialand aquatic ecosystems. This carbon serves as an energy source that providesthe basis for several ecosystem processes, (e.g., decomposition, nutrient cy-cling, energy transfer, etc.).
Within active primary and secondary channels and on flood plains, snags areimportant sources of wood that contribute to the development of channel andflood plain structure, hydraulic complexity, and bank stability.
Measurement Protocol
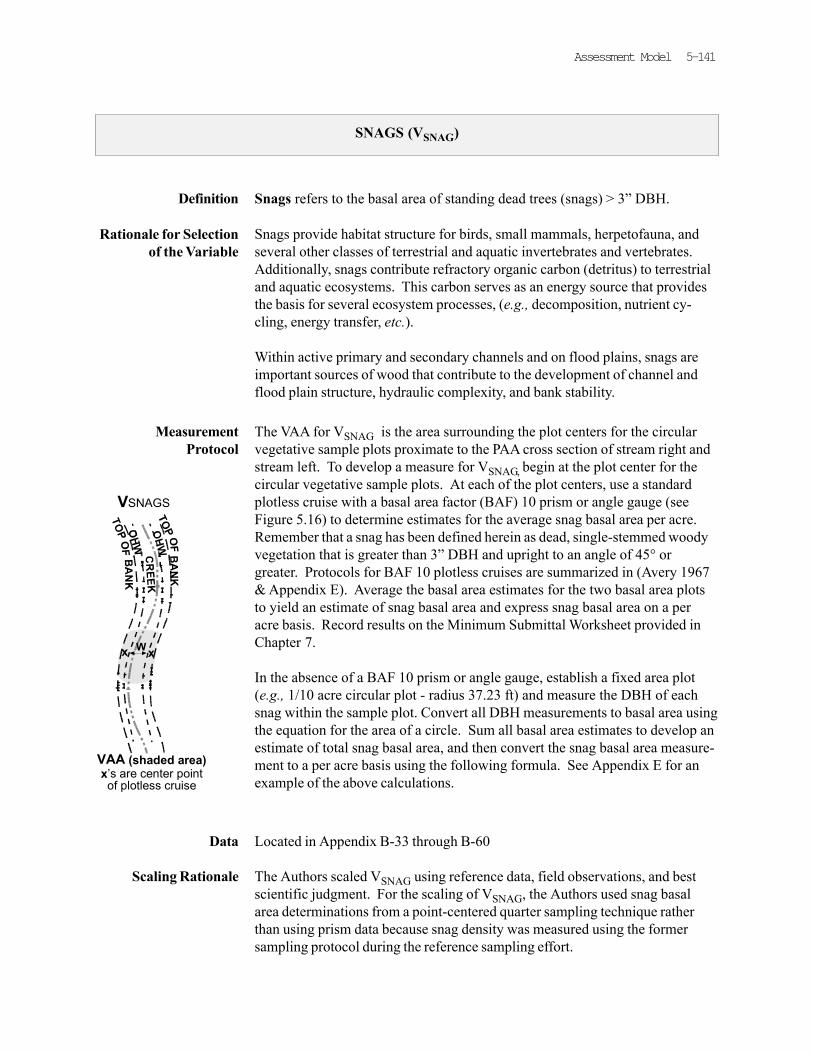
The VAA for VSNAG is the area surrounding the plot centers for the circularvegetative sample plots proximate to the PAA cross section of stream right andstream left. To develop a measure for VSNAG, begin at the plot center for thecircular vegetative sample plots. At each of the plot centers, use a standardplotless cruise with a basal area factor (BAF) 10 prism or angle gauge (seeFigure 5.16) to determine estimates for the average snag basal area per acre.Remember that a snag has been defined herein as dead, single-stemmed woodyvegetation that is greater than 3” DBH and upright to an angle of 45° orgreater. Protocols for BAF 10 plotless cruises are summarized in (Avery 1967& Appendix E). Average the basal area estimates for the two basal area plotsto yield an estimate of snag basal area and express snag basal area on a peracre basis. Record results on the Minimum Submittal Worksheet provided inChapter 7.
In the absence of a BAF 10 prism or angle gauge, establish a fixed area plot(e.g., 1/10 acre circular plot - radius 37.23 ft) and measure the DBH of eachsnag within the sample plot. Convert all DBH measurements to basal area usingthe equation for the area of a circle. Sum all basal area estimates to develop anestimate of total snag basal area, and then convert the snag basal area measure-ment to a per acre basis using the following formula. See Appendix E for anexample of the above calculations.
Data Located in Appendix B-33 through B-60
Scaling Rationale The Authors scaled VSNAG using reference data, field observations, and bestscientific judgment. For the scaling of VSNAG, the Authors used snag basalarea determinations from a point-centered quarter sampling technique ratherthan using prism data because snag density was measured using the formersampling protocol during the reference sampling effort.
VSNAGS
W
VAA (shaded area)x’s are center pointof plotless cruise
x x
5-142 Draft HGM Guidebook for South Coast Santa Barbara Streams
Variable: SNAGS (VSNAG)
The Authors’ confidence that reasonable logic and/or data support scaling isMEDIUM for all subclasses.
Confidence
Snag basal areas were observed to vary considerably within and among sub-classes. Some of the recorded variation appears to be the result of naturalcauses (e.g., cyclical droughts, successional processes, etc.). However, some ofthe higher recorded densities of snags, particularly within the Low gradientsubclass, are likely the result of the invasion of exotic pests or parasites, waterstress due to groundwater extraction, or other anthropogenic sources. Scalingof VSNAG, therefore, is based on a range of basal area values as well as aqualitative statement of conditions in the VAA (see Table 5.23).
Measurement protocol for the basal area of tree and snag variables(VTREEBA) and (VSNAG)
Figure 5.16
Assessment Model 5-143
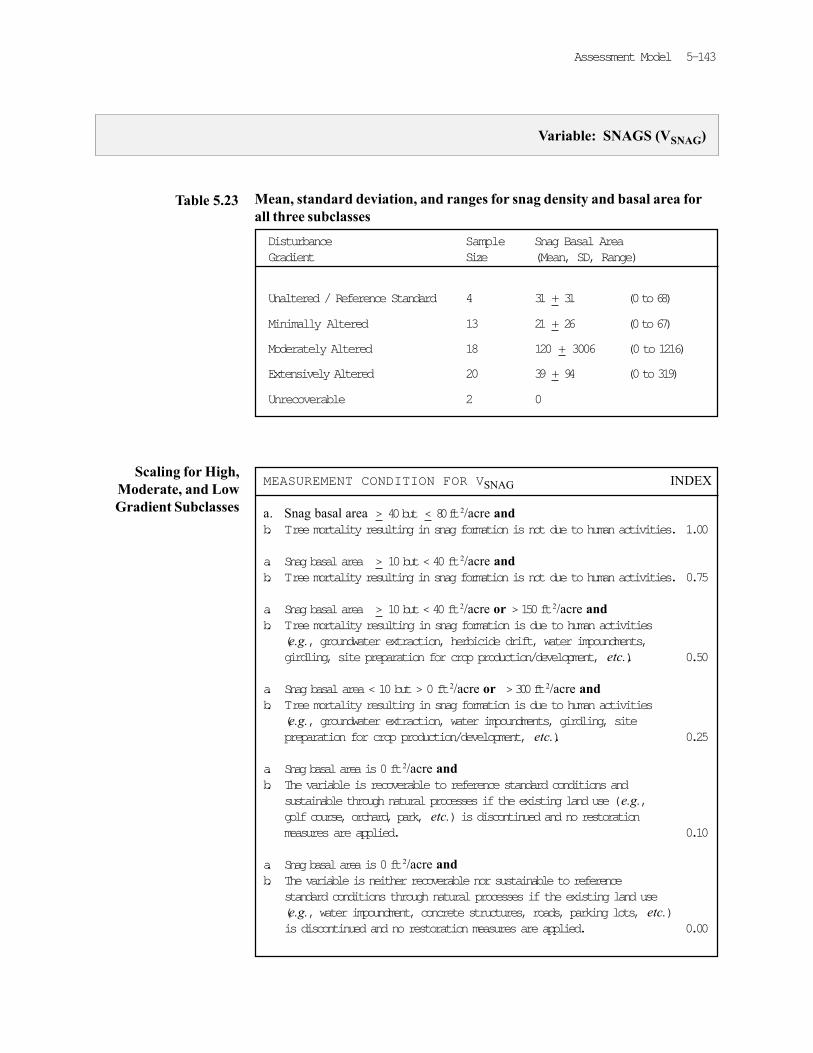
Table 5.23 Mean, standard deviation, and ranges for snag density and basal area forall three subclasses
Scaling for High,Moderate, and LowGradient Subclasses
Variable: SNAGS (VSNAG)
MEASUREMENT CONDITION FOR VSNAG INDEX
a. Snag basal area > 40 but < 80 ft2/acre andb. Tree mortality resulting in snag formation is not due to human activities. 1.00
a. Snag basal area > 10 but < 40 ft2/acre andb. Tree mortality resulting in snag formation is not due to human activities. 0.75
a. Snag basal area > 10 but < 40 ft2/acre or > 150 ft2/acre andb. Tree mortality resulting in snag formation is due to human activities
(e.g., groundwater extraction, herbicide drift, water impoundments,girdling, site preparation for crop production/development, etc.). 0.50
a. Snag basal area < 10 but > 0 ft2/acre or > 300 ft2/acre andb. Tree mortality resulting in snag formation is due to human activities
(e.g., groundwater extraction, water impoundments, girdling, sitepreparation for crop production/development, etc.). 0.25
a. Snag basal area is 0 ft2/acre andb. The variable is recoverable to reference standard conditions and
sustainable through natural processes if the existing land use (e.g.,golf course, orchard, park, etc.) is discontinued and no restorationmeasures are applied. 0.10
a. Snag basal area is 0 ft2/acre andb. The variable is neither recoverable nor sustainable to reference
standard conditions through natural processes if the existing land use(e.g., water impoundment, concrete structures, roads, parking lots, etc.)is discontinued and no restoration measures are applied. 0.00
Unaltered / Reference Standard 4 31 + 31 (0 to 68)
Minimally Altered 13 21 + 26 (0 to 67)
Moderately Altered 18 120 + 3006 (0 to 1216)
Extensively Altered 20 39 + 94 (0 to 319)
Unrecoverable 2 0
5-144 Draft HGM Guidebook for South Coast Santa Barbara Streams
SOIL PROFILE INTEGRITY (VSOILINT)
Definition Soil Profile Integrity is a measure of the presence and condition of representa-tive soil profiles (soil horizons) within the VAA.
Rationale for Selectionof Variable
The integrity of the soil profile, through linkages with site hydrology, exertsstrong control on the ecosystem functions that occur in High, Moderate andLow gradient riverine waters/wetlands in SCSBC. These functions includebiogeochemical processes affecting nutrient cycles and storage, and the estab-lishment and maintenance of plant communities. In particular, finer texturedsoils that occur within the Low gradient subclass are rare, given past andcurrent land uses. Where they occur, they exhibit increased profile develop-ment, structure, and organic carbon accumulation. Thus, when compared to thesandy skeletal soils that are characteristic of the High and Moderate gradientsubclasses, the finer textured soils in Low gradient landscape positions havehigher cation exchange and assimilative capacities.
Maintenance of intact soils in Low gradient riverine waters/wetland is espe-cially important in the SCSBC landscape, because water movement throughLow gradient sites exhibits lower kinetic energy and longer residence time whencompared to High and Moderate gradient subclasses (i.e. diminished infiltrationrates and hydraulic conductivities). Increased time of contact of water with soilmineral particles and organic matter, plant roots, microbes, etc., facilitatesretention and transformation of nutrients, organic matter and contaminants.These soil processes are critically important to the maintenance of waterquality.
MeasurementProtocol
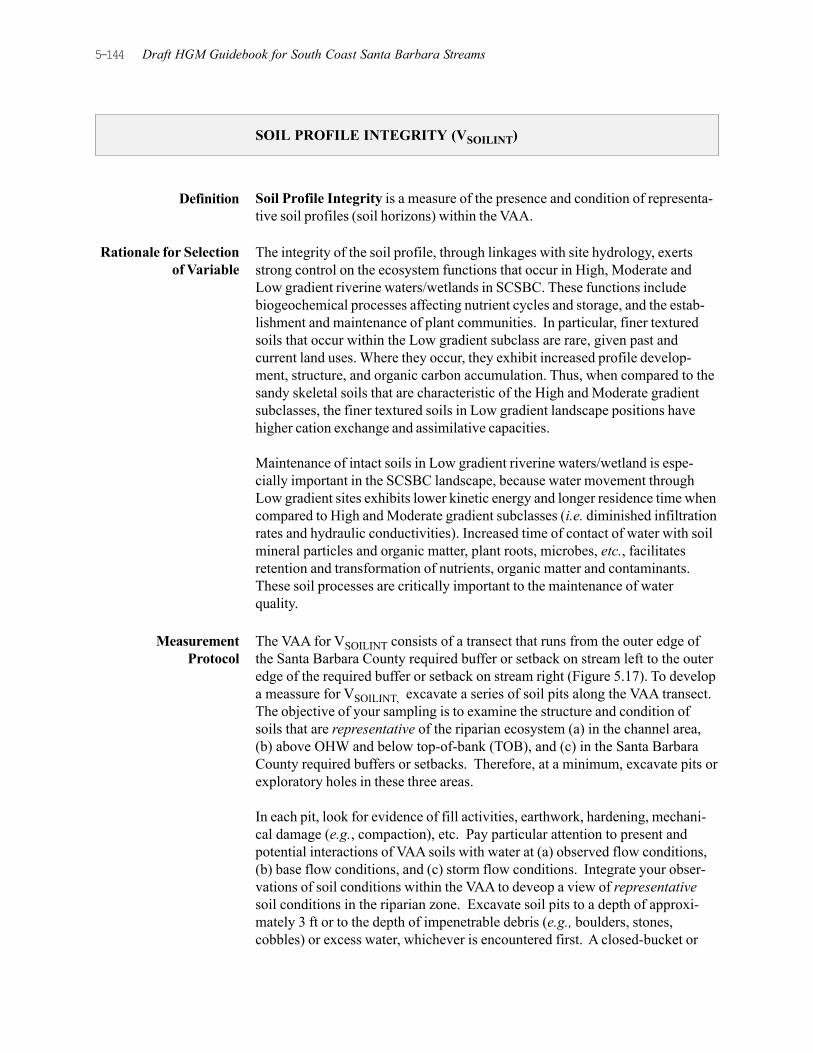
The VAA for VSOILINT consists of a transect that runs from the outer edge ofthe Santa Barbara County required buffer or setback on stream left to the outeredge of the required buffer or setback on stream right (Figure 5.17). To developa meassure for VSOILINT, excavate a series of soil pits along the VAA transect.The objective of your sampling is to examine the structure and condition ofsoils that are representative of the riparian ecosystem (a) in the channel area,(b) above OHW and below top-of-bank (TOB), and (c) in the Santa BarbaraCounty required buffers or setbacks. Therefore, at a minimum, excavate pits orexploratory holes in these three areas.
In each pit, look for evidence of fill activities, earthwork, hardening, mechani-cal damage (e.g., compaction), etc. Pay particular attention to present andpotential interactions of VAA soils with water at (a) observed flow conditions,(b) base flow conditions, and (c) storm flow conditions. Integrate your obser-vations of soil conditions within the VAA to deveop a view of representativesoil conditions in the riparian zone. Excavate soil pits to a depth of approxi-mately 3 ft or to the depth of impenetrable debris (e.g., boulders, stones,cobbles) or excess water, whichever is encountered first. A closed-bucket or
Assessment Model 5-145
Variable: SOIL PROFILE INTEGRITY (VSOILINT)
Figure 5.17 Measurement protocol for the soil profile integrity variable (VSOILINT)
Describe the ripariansoil profile at the
main transect usingthe stream cut bank.
b.If there is no obviouscut bank showing the
soil profile, dig arepresentative soil pit
within the riparianzone. Describe
riparian soil profile.
a.
Dutch auger may be useful below approximately 2 ft. If available, examinerelatively undisturbed portions of road cuts, cutbanks associated with streamchannels, excavations, etc. to augment soil pit information. Identification,nomenclature, and description of soil horizons should be consistent withguidance provided by the USDA Natural Resource Conservation Service (SCS1962; NRCS 1998). All soil depths are measured from the soil surface (usuallyan A) horizon, excluding any litter or duff layers that may have accumulated onthe soil surface (see Figure 5.17). Live vascular and non-vascular plantmaterials are not included in measurements of soil depths. Determine Soilcolors consistent with a Munsell Soil Color Chart (Munsell 1992).
5-146 Draft HGM Guidebook for South Coast Santa Barbara Streams
Variable: SOIL PROFILE INTEGRITY (VSOILINT)
Scaling Rationale The Authors used best scientific judgment and, secondarily, empirical field datafrom 60 project sites to scale this variable. For the Low gradient subclass, soilprofiles are generally loamy or finer in texture, with the presence of a developedA and Bw horizons, and the accumulation of organic carbon (i.e., a value andchroma within the upper part of the profile less than 3). Redoximorphic fea-tures and hydric soils are often present. Organic carbon accumulation, finertextured soil, structure, and horizon development may be absent, diminished, orburied in degraded sites.
For High and Moderate gradient subclasses, soil textures range from loamysand to sandy loams and are dominantly skeletal (>35% coarse fragments suchas gravels, cobbles, stones). Profile development is generally weak to absentand organic carbon accumulation is minimal.
The scaling presented herein is based on the presence, condition, and color(organic carbon content) of organic and/or mineral horizons and the degree ofdisruption that has occurred from direct manipulation of the riparian areas,streambed, and/or stream bank(s) (e.g., rip-rap, revetments, fenced cobble andstone banks, or concrete trapezoids). For all subclasses, the soil profile integrityvariable is scaled down proportional to the degree of anthropogenic disturbanceor disruption of the soil profile.
The Authors’ confidence that reasonable logic and/or data support scaling isMEDIUM for all subclasses.
Confidence
Assessment Model 5-147
Scaling for High and Moderate Gradient Subclasses
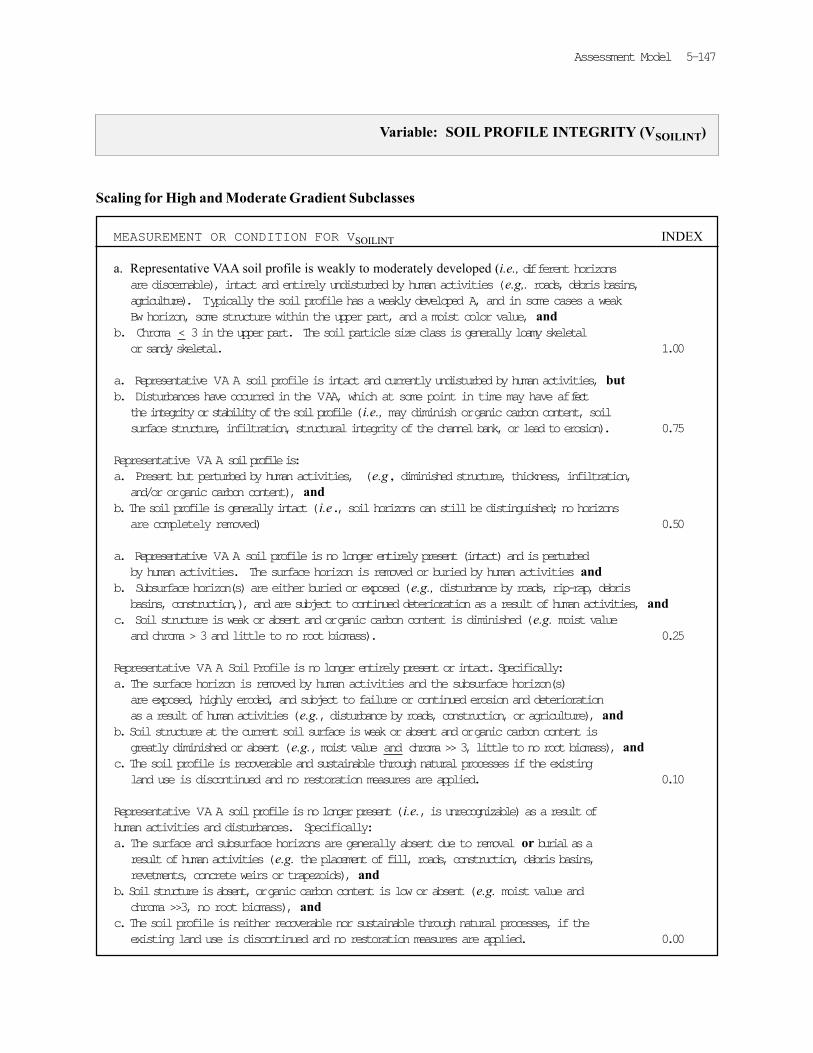
Variable: SOIL PROFILE INTEGRITY (VSOILINT)
MEASUREMENT OR CONDITION FOR VSOILINT INDEX
a. Representative VAA soil profile is weakly to moderately developed (i.e., different horizonsare discernable), intact and entirely undisturbed by human activities (e.g,. roads, debris basins,agriculture). Typically the soil profile has a weakly developed A, and in some cases a weakBw horizon, some structure within the upper part, and a moist color value, and
b. Chroma < 3 in the upper part. The soil particle size class is generally loamy skeletalor sandy skeletal. 1.00
a. Representative VA A soil profile is intact and currently undisturbed by human activities, butb. Disturbances have occurred in the VAA, which at some point in time may have affect
the integrity or stability of the soil profile (i.e., may diminish organic carbon content, soilsurface structure, infiltration, structural integrity of the channel bank, or lead to erosion). 0.75
Representative VA A soil profile is:a. Present but perturbed by human activities, (e.g., diminished structure, thickness, infiltration,
and/or organic carbon content), andb. The soil profile is generally intact (i.e., soil horizons can still be distinguished; no horizons
are completely removed) 0.50
a. Representative VA A soil profile is no longer entirely present (intact) and is perturbedby human activities. The surface horizon is removed or buried by human activities and
b. Subsurface horizon(s) are either buried or exposed (e.g., disturbance by roads, rip-rap, debrisbasins, construction,), and are subject to continued deterioration as a result of human activities, and
c. Soil structure is weak or absent and organic carbon content is diminished (e.g. moist valueand chroma > 3 and little to no root biomass). 0.25
Representative VA A Soil Profile is no longer entirely present or intact. Specifically:a. The surface horizon is removed by human activities and the subsurface horizon(s)
are exposed, highly eroded, and subject to failure or continued erosion and deteriorationas a result of human activities (e.g., disturbance by roads, construction, or agriculture), and
b. Soil structure at the current soil surface is weak or absent and organic carbon content isgreatly diminished or absent (e.g., moist value and chroma >> 3, little to no root biomass), and
c. The soil profile is recoverable and sustainable through natural processes if the existingland use is discontinued and no restoration measures are applied. 0.10
Representative VA A soil profile is no longer present (i.e., is unrecognizable) as a result ofhuman activities and disturbances. Specifically:a. The surface and subsurface horizons are generally absent due to removal or burial as a
result of human activities (e.g. the placement of fill, roads, construction, debris basins,revetments, concrete weirs or trapezoids), and
b. Soil structure is absent, organic carbon content is low or absent (e.g. moist value andchroma >>3, no root biomass), and
c. The soil profile is neither recoverable nor sustainable through natural processes, if theexisting land use is discontinued and no restoration measures are applied. 0.00
5-148 Draft HGM Guidebook for South Coast Santa Barbara Streams
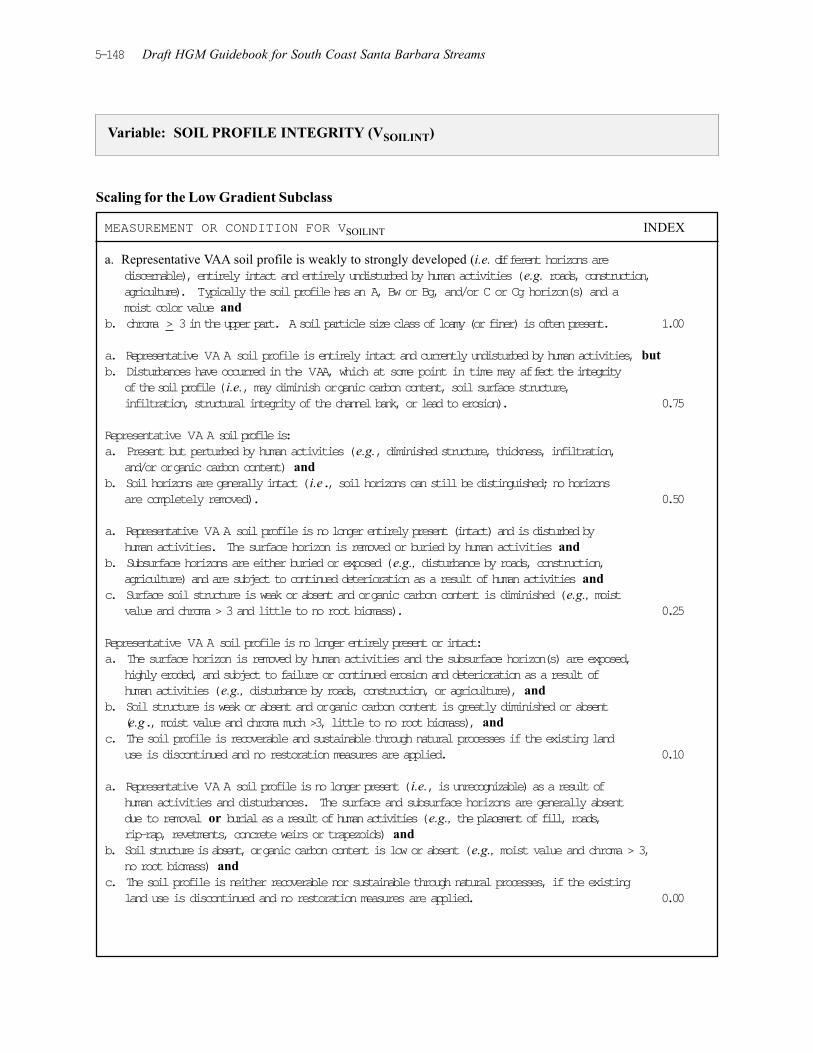
Variable: SOIL PROFILE INTEGRITY (VSOILINT)
Scaling for the Low Gradient Subclass
MEASUREMENT OR CONDITION FOR VSOILINT INDEX
a. Representative VAA soil profile is weakly to strongly developed (i.e. different horizons arediscernable), entirely intact and entirely undisturbed by human activities (e.g. roads, construction,agriculture). Typically the soil profile has an A, Bw or Bg, and/or C or Cg horizon(s) and amoist color value and
b. chroma > 3 in the upper part. A soil particle size class of loamy (or finer) is often present. 1.00
a. Representative VA A soil profile is entirely intact and currently undisturbed by human activities, butb. Disturbances have occurred in the VAA, which at some point in time may affect the integrity
of the soil profile (i.e., may diminish organic carbon content, soil surface structure,infiltration, structural integrity of the channel bank, or lead to erosion). 0.75
Representative VA A soil profile is:a. Present but perturbed by human activities (e.g., diminished structure, thickness, infiltration,
and/or organic carbon content) andb. Soil horizons are generally intact (i.e., soil horizons can still be distinguished; no horizons
are completely removed). 0.50
a. Representative VA A soil profile is no longer entirely present (intact) and is disturbed byhuman activities. The surface horizon is removed or buried by human activities and
b. Subsurface horizons are either buried or exposed (e.g., disturbance by roads, construction,agriculture) and are subject to continued deterioration as a result of human activities and
c. Surface soil structure is weak or absent and organic carbon content is diminished (e.g., moistvalue and chroma > 3 and little to no root biomass). 0.25
Representative VA A soil profile is no longer entirely present or intact:a. The surface horizon is removed by human activities and the subsurface horizon(s) are exposed,
highly eroded, and subject to failure or continued erosion and deterioration as a result ofhuman activities (e.g., disturbance by roads, construction, or agriculture), and
b. Soil structure is weak or absent and organic carbon content is greatly diminished or absent(e.g., moist value and chroma much >3, little to no root biomass), and
c. The soil profile is recoverable and sustainable through natural processes if the existing landuse is discontinued and no restoration measures are applied. 0.10
a. Representative VA A soil profile is no longer present (i.e., is unrecognizable) as a result ofhuman activities and disturbances. The surface and subsurface horizons are generally absentdue to removal or burial as a result of human activities (e.g., the placement of fill, roads,rip-rap, revetments, concrete weirs or trapezoids) and
b. Soil structure is absent, organic carbon content is low or absent (e.g., moist value and chroma > 3,no root biomass) and
c. The soil profile is neither recoverable nor sustainable through natural processes, if the existingland use is discontinued and no restoration measures are applied. 0.00
Assessment Model 5-149
VEGETATIVE STRATA (VSTRATA)
Definition Vegetative Strata is the number of distinct vegetation layers present within theVAA. Vegetation strata were defined as follows: trees (single stem woodyspecies with >3” DBH and > 10 ft tall); shrubs (multiple stem woody species);vines or lianas (woody vines); and herbs, including forbs, graminoids, ferns,and fern allies.
Rationale for Selectionof the Variable
Multiple vegetation strata (e.g., tree and shrub layers) often are good indicatorsof the development and maintenance of plant communities, habitat structure,and channel bank stability (Tilman 1994). For example, the number of stratacan be correlated with the habitat structure and complexity necessary to supportcharacteristic faunal assemblages, e.g., those typical of the SCSBC. Similarly,the number and types of vegetation strata combine to provide the diversity offaunal habitat, as well as the types and quantity of food and cover resourcesavailable.
For the High and Moderate gradient subclasses, multiple strata are, amongothers, reasonable indicators of reference standard conditions. In the Lowgradient coastal surface subclass, a single vegetation stratum, on average, ischaracteristic of reference standard conditions.
Measurement Protocol
The VAA for VSTRATA consists of a 100-foot reach of the two vegetativetransects on stream right and stream left. The 100-foot transects should becentered at the identified midpoints proximate to the PAA cross section. Todevelop a measure for VSTRATA, begin 40 feet downstream from the midpoint ofthe vegetative traansects on stream right. Begin walking upstream along thetransect, stopping at every 10 foot interval. At each 10-foot interval, look forvegetation on the ground as well as directly above the stopping point. Recordthe total number of strata (i.e., herb,vine, shrub, and tree) that intersects thetransect at each stopping point. For example, an HGM user identifies thepresence of only the herb stratum at a given sampling point. They wouldtherefore record one stratum as present. Make this measurement at 10 pointsalong the vegetation transect, and then repeat this process on stream left.Record all results on the Minimum Submittal Worksheet provided in Chapter 7.Using the 20 observations, calculate the average number of vegetation strata forthe VAA. Round this average to the nearest whole number.
VSTRATA
W100’
VAA Transects
5-150 Draft HGM Guidebook for South Coast Santa Barbara Streams
Scaling Rationale The Authors scaled VSTRATA using reference data (see Table 5.24 below), fieldobservations, and best scientific judgment. The literature supports the logicthat multiple vegetation strata operate in concert with other structural featuresof riverine ecosystems, which together lead to greater faunal habitat stability,habitat complexity, increased channel bank stability, etc. Therefore, the pres-ence of multiple vegetation strata (i.e., >2) in riverine waters/wetlands of theSCSBC will result in a higher FCI. Fewer strata will result in a lower FCI dueto the lack of habitat structure, habitat complexity, channel bank stability, etc.
Mean, standard deviation, and ranges the average number of strata forHigh, Moderate and Low gradient subclasses
Table 5.24
Disturbance Sample Average Number of StrataGradient Size (Mean, SD, Range)
Unaltered / Reference Standard 4 1.81 + 0.23 (1.65 to 2.15)
Minimally Altered 13 1.90 + 0.36 (1.55 to 2.35)
Moderately Altered 18 1.99 + 0.46 (1.20 to 2.65)
Extensively Altered 20 1.49 + 0.52 (0.50 to 2.60)
Unrecoverable 2 0.70 + 0.92 (0.05 to 1.35)
Variable: VEGETATIVE STRATA (VSTRATA)
Data Located in Appendix B-33 through B-60
Assessment Model 5-151
Scaling for High, Moderate, and Low gradient subclasses
The Authors’ confidence that reasonable logic and/or data support scaling isMEDIUM for the High and Moderate Gradient subclasses and LOW for theLow gradient subclass.
Confidence
MEASUREMENT CONDITION FOR VSTRATA INDEX
a. Average number of strata ≥ 2.0 andb. Vegetation below top of bank is unaltered by human activities. 1.00
a. Average number of strata ≥ 2.0 andb. Vegetation below top of bank is moderately altered by human activities
(e.g., partial clearing of the the vegetation by grazing of domesticlivestock, or by clearing for crop production, undeveloped parks,urban/suburban development, flood control access, etc.). 0.75
a. Average number of strata is < 2.0 but ≥ 1 andb. Vegetation below top of bank is moderately altered by human
activities (e.g., partial clearing of the vegetation by grazing ofdomestic livestock, crop production, undeveloped parks, urban/suburban development, flood control access, etc.). 0.50
a. Average number of strata is < 2.0 but ≥ 1 andb. Vegetation below top of bank is extensively altered by human
activities (e.g., extensive clearing of the begetation by grazing ofdomestic livestock, crop production, developed parks, urban/suburban development, flood control access, highway right of wayand maintenance, etc.) 0.25
The average number of strata < 1.0. The variable is recoverable to referencestandard conditions and sustainable through natural processes if the existingland use (e.g., site cleared through heavy grazing of domestic livestock,developed park, and crop production) is discontinued and no restorationmeasures are applied. 0.10
The average number of strata < 1.0. The variable is neither recoverablenor sustainable to reference standard conditions through natural processesif the existing land use (e.g., concrete trapezoidal channel, parking lot,box culvert, roads, etc.) is discontinued and no restoration measures areapplied. 0.00
Variable: VEGETATIVE STRATA (VSTRATA)
5-152 Draft HGM Guidebook for South Coast Santa Barbara Streams
SURFACE WATER IN (VSURFIN)
Definition SurfaceWater In refers to the hydrologic connections into the VAA from theadjacent landscape.
Rationale for Selectionof the Variable
The type and number of surface water connections between riverine ecosystemsand their surrounding landscape are good field indicators of the potential for theriverine ecosystem to maintain intact hydrologic, geochemical, plant commu-nity, and faunal support/habitat functions (Brinson et al 1995). For example,intact surface water connections facilitate surface water runoff from surround-ing landscapes. Such runoff is necessary to maintain main channel sedimentprocesses and characteristic cross sectional and longitudinal channel geom-etries. Similarly, surface water connections are vital in allowing biogeochemicalprocesses associated with particulate retention, elemental cycling, and organiccarbon export (both dissolved and particulate) to occur.
Intact surface water connections help to maintain diverse native plant communi-ties in riparian ecosystems. They provide relatively moist microsites that aretransitional habitats among (relatively wet) main channel/riparian and (rela-tively dry) upland habitats. The relatively moist transitional sites associatedwith surface water connections (a) support complex tree canopies and under-story structure, (b) contribute significantly to plant species diversity in riparianecosystems, and (c) act as corridors for dispersal of plant propagules within thebetween components of the riparian ecosystem.
Intact surface water connections within the relatively undisturbed riparianecosystems of SCSBC also provide important links between aquatic andterrestrial habitats for a wide range of aquatic and semi-aquatic faunal species.Specifically, intact surface water connections allow riparian dependent animals(e.g., Steelhead trout, salamanders, and newts) to move within riparian ecosys-tems, and thus to complete life cycle requirements. Surface water connectionsalso provide escape, hiding, resting and reproductive cover for aquatic andterrestrial animals that use all or parts of riparian ecosystems as habitat.
MeasurementProtocol
The VAA for VSURFIN consists of two transects: one upstream and one down-stream. These transects originate at the PAA cross section. Their length isseven times the OHW cross section width. Thus you will travel a total distanceof fourteen times the OHW cross section width (i.e., 7 OHW cross sectionwidths upstream and 7 OHW cross section widths downstream). The width ofthe VAA is the channel system width below OHW (Figure 5.18). To developmeasurements for VSURFIN, examine air photos and maps that will offer infor-mation pertaining to the condition of the source areas for surface water connec-tions to the VAA. Then, start at the main cross section. Walk the upstream anddownstream legs of the VAA and identify the number and type of all permanent,
VSURFIN
W14W
VAA (shaded area)
Assessment Model 5-153
Variable: SURFACE WATER IN (VSURFIN)
Data Located in Appendix B-1through B-12
Figure 5.18 Measurement protocol for the surface water input variable (VSURFIN)
seasonal, and ephemeral surface water connections that run across the OHWlevel and into the stream channel from surrounding landscape position. Char-acterize the condition of the source area landscape as being realtively natural/undisturbed, low, moderate or high density housing, malls, parking lots, indus-trial, etc. Examples of surface water connections into stream channels through-out the SCBC range from being natural tributaries to agricultural ditches toconstructed stormwater inputs to highly engineered and hardened water diver-sion structures. Record results on the Minimal Submittal Worksheet providedin Chapter 7.
5-154 Draft HGM Guidebook for South Coast Santa Barbara Streams
The Authors’ confidence that reasonable logic and/or data support scaling isHIGH for all subclasses.Confidence
Scaling Rationale The Authors scaled VSURFIN using a combination of reference data, fieldobservations, and best scientific judgment. The Authors grouped High, Moder-ate, and Low gradient subclasses based on similarities in the reference systemdata. The Authors combined data with the Authors’ field observations ofrelatively consistent trends in the effects of human activities to VSURFIN condi-tions throughout the reference domain. Specifically, the Authors scaled thisvariable based on the assumptions that (a) no human alteration of VSURFINconditions represents reference standard conditions (1.0), and (b) increasinglevels of human disturbance tend to decrease the number and change the type/complexity of surface connections (Figure 5.19). Elimination of VSURFINconnections via redirection of flows to other channel systems or capture andpiping of surface flows to storm or sewer systems represents an irreversibleendpoint (0.0).
Figure 5.19 Number of natural and unnatural surface inputs into active stream channelsfor all subclasses across a disturbance gradient
Variable: SURFACE WATER IN (VSURFIN)
0 5 10 15 20
1.0
0.75
0.50
0.25
0.0
Dis
turb
ance
Gra
dien
t
Number of surface water inputs into an active stream channel
unnatural
natural
4
4
9
5
8
3
19
Assessment Model 5-155
Variable: SURFACE WATER IN (VSURFIN)
Scaling for High, Moderate, and Low Gradient Subclasses
MEASUREMENT CONDITION FOR VSURFIN INDEX
Surface hydraulic connections into the VAA from the adjacent landscape are unaltered by humanactivities. No manipulations of the surface hydraulic connections leading to, or within the VAAare present. 1.00
Limited alteration of the natural surface hydraulic connections evident (e.g., fire and farm roadcrossings; agricultural or very low density (1 house/100 acres) residential runoff directed tonatural, ungraded tributaries via light grading). 0.75
Surface hydraulic connections into the VA A from the adjacent landscape have been:a. Altered by human activity (e.g., low gradient slope agricultural ditches or swales; inputs from
low (1 house/10 acres) to moderate (1 house/5 acres) density residential areas or open space parksor urban inputs), and
b. Achieved through a combination of natural tributaries and non-hardened engineered structures(e.g., through unlined ditches or swales with or without culvert outfalls), and/or via engineeredstructures delivering treated stormwater. 0.50
Surface hydraulic connectionsinto the VA A are:
a. Altered by moderate to intense human activity, andb. Achieved primarily through hardened engineered structures (e.g., culverts with headwalls,
buried pipes, lined ditches, sheet flow over concrete or asphalt) that convey flow fromareas of moderate density residential (i.e., 1 house/five acres), service industry installations(e.g., < 2 acre malls, parking lots, etc.) and/or high intensity agriculture (e.g., annual rowcrops, orchard production on slopes > 15%). 0.25
Surface hydraulic connections into the VA A from the adjacent landscape have been:a. Significantly altered by human activity such as high density suburban, urban or industrial inputs,
or high intensity agricultural (e.g., annual row crops, orchard production on slopes >15%) andb. Achieved through hardened engineered structures that drain runoff from urban, large
industrial, or high intensity agricultural portions of the landscape proximate to the VAA; andc. The variable is somewhat recoverable to reference standard conditions and sustainable
through natural processes, if the existing land use is discontinued and no restoration measuresare applied. 0.10
Surface hydraulic connections into the VA A from adjacent portions of the landscape have been:a. Significantly altered by human activity (e.g., agricultural, high density urban or industrial
inputs); andb. Achieved through hardened engineered structures that drain runoff from urban or large industrial,
or high intensity agricultural (e.g., annual row crops; orchard production on slopes >15%) portionsof the landscape proximate to the VAA. These structures could not be removed without extensivere-engineering to address substantial threats to public safety, therefore
c. The variable is not recoverable to reference standard conditions and not sustainable throughnatural processes, if the existing land use is discontinued and no restoration measures areapplied. 0.00
5-156 Draft HGM Guidebook for South Coast Santa Barbara Streams
BASAL AREA OF TREES (VTREEBA)
Definition Basal Area of Trees is the cross sectional area of trees (single stem woodyspecies with >3” DBH and > 10 ft tall) within the VAA.
Rationale for SelectionOf the Variable
In forested ecosystems, the basal area of trees is a standard measure of domi-nance (Curtis 1959, Avery 1967, and Mueller Dombois and Ellenberg 1974).Recognition of the relative dominance of the tree strata in forested communitiesis important because trees in several stages of succession regulate micro-climatic conditions that affect terrestrial vegetation community development,and conditions in the aquatic environment (e.g., stream temperature). In addi-tion, tree canopies and root structures help to protect riparian sites from erosiondue, for example, to raindrop energy or high energy surface flows. Treesprovide horizontal and vertical structure that, in turn, present (a) opportunitiesfor the movement of animals into and out of riparian ecosystems and (b) severalforms of cover (e.g., resting , hiding, escape, thermal). Trees produce detritusthat is incorporated into the soil profile, and into aquatic food webs.
MeasurementProtocol
The VAA for VTREEBA is the area surrounding the plot centers for the circularvegetative sample plots proximate to the PAA cross section on stream right andstream left. To develop a measure for VTREEBA, begin at the plot center for thecircular vegetative sample plots proximate to the PAA cross section on streamright and stream left. At each of the plot centers, use a standard plotless cruisewith a basal area factor (BAF) 10 prism or angle gauge (see Figure 5.16) todetermine estimates for the average tree basal area per acre. Remember that atree has been defined as single stemmed woody vegetation that is greater than3” DBH and taller than 10 feet. Protocols for BAF 10 plotless cruises aresummarized in Avery 1967 and Appendix E. Record results on the MinimumSubmittal Worksheet provided in Chapter 7. Average the basal area estimatesfor the two plots (stream right and stream left) to calculate the final estimate oftree basal area per acre.
Assessment Model 5-157
Variable: BASAL AREA OF TREES (VTREEBA)
Located in Appendix B-33 through B-60Data
Scaling Rationale The Authors scaled VTREEBA using reference data, field observations, and bestscientific judgment. Throughout the reference domain and within all threesubclasses, the Authors observed that tree basal area varied, at least one orderof magnitude, either naturally or as a result of human intervention. Addition-ally, reference system data (Table 5.25, 5.26, and 5.27 below) indicate that treebasal area varies more widely at higher elevations (within the High gradientsubclass) than within Moderate or Low gradient subclasses. This variation is afunction of such site-specific phenomena as site water balance conditions, landuse history, successional stage, etc. Human alterations of riparian ecosystems inthe SCSBC usually have resulted in a decrease in the basal area of treesthrough land clearing for residential or commercial developments, debrisbasins, livestock grazing, and so forth. However in some instances, humanintervention can increase basal area (e.g., planting of eucalyptus, avocados).
In the absence of a BAF 10 prism or angle gauge, establish a fixed area plot(e.g., 1/10 acre circular plot [radius 37.3 ft]) and measure the diameter atbreast height (DBH) of each tree within the sample plot. Convert all DBHmeasurements to basal area using the following series of equations (Steps 1through 4) for the area of a circle. Sum all the estimates to develop an approxi-mation of stand basal area, and then convert the stand basal area measurementto a per acre basis. See example below for the necessary calculations.
Step 1. Sum all basal area measurements recorded in your fixed area plot.e.g., 5” + 5” + 3” + 10” + 8” = 31”
Step 2. Convert inches to feete.g., (31 inches) * (1 foot / 12 inches) = 2.58 ft
Step 4. Calculate basal area on a per acre basise.g., (5.23 ft2) / (1/10 acre) = 52.3 ft2 / acre
5-158 Draft HGM Guidebook for South Coast Santa Barbara Streams
Mean, standard deviation and range of total tree basal area for Lowgradient subclass
Table 5.27
Disturbance Sample Total Tree Basal AreaGradient Size (Mean, SD, Range)
Unaltered / Reference Standard 0 N A
Minimally Altered 2 50 + 35.4 (25 to 75)
Moderately Altered 3 35 + 13 (25 to 50)
Extensively Altered 12 17.5 + 15.5 (0 to 40)
Unrecoverable 2 25 + 35.4 (0 to 50)
Table 5.26 Mean, standard deviation, and range of total tree basal area for the Moder-ate gradient subclass
Disturbance Sample Total Tree Basal AreaGradient Size (Mean, SD, Range)
Unaltered / Reference Standard 1 90
Minimally Altered 8 138 + 98 (0 to 300)
Moderately Altered 16 98 + 41 (30 to 140)
Extensively Altered 8 83 + 76 (0 to 240)
Unrecoverable 0 N/A
Mean, standard deviation, and range of total tree basal area for the Highgradient subclass
Table 5.25
Disturbance Sample Total Tree Basal Area
Gradient Size (Mean, SD, Range)
Unaltered / Reference Standard 3 121.7 + 43.7 (85 to 170)
Minimally Altered 2 97.5 + 45.9 (65 to 130)
Moderately Altered 0 N/A
Extensively Altered 0 N/A
Unrecoverable 0 N/A
Variable: BASAL AREA OF TREES (VTREEBA)
Assessment Model 5-159
Variable: BASAL AREA OF TREES (VTREEBA)
Scaling for the High gradient subclass
MEASUREMENT CONDITION FOR VTREEBA INDEX
a. Tree basal area > 100 ft2/acre, andb. Vegetation below top of bank is unaltered by human activity. 1.00
a. Tree basal area > 100 ft2/acre, andb. Vegetation below top of bank is altered by human activities (e.g., partial
clearing of the vegetation by grazing of domestic livestock, or byclearing for crop production, undeveloped parks, urban/suburbandevelopment, flood control access, etc.). 0.75
a. Tree basal area ≥ 65 ft2/acre but <100 ft2/acre, andb. Vegetation below top of bank is altered by human activities (e.g., partial
clearing of the vegetation by grazing of domestic livestock, or byclearing for crop production, undeveloped parks, urban/suburban development,flood control access, etc.). 0.50
a. Tree basal area ≥ 35 ft2/acre but < 65 ft2/acre, andb. Vegetation below top of bank is altered by human activities (e.g., extensive
clearing of the vegetation by grazing of domestic livestock, cropproduction, developed parks, urban/suburban development, flood controlaccess, etc.). 0.25
a. Tree basal area < 35 ft2/acre, andb. Variable is recoverable to reference standard conditions and sustainable
through natural processes if the existing land use (e.g., site clearedthrough heavy grazing of domestic livestock, developed park, and cropproduction) is discontinued and no restoration measures are applied . 0.10
a. Tree basal area < 35 ft2/acre, andb. Variable is neither recoverable nor sustainable to reference standard
conditions through natural processes if the existing land use (e.g., concreteditch, parking lot, box culvert, roads, etc.) is discontinued and norestoration measures are applied . 0.00
5-160 Draft HGM Guidebook for South Coast Santa Barbara Streams
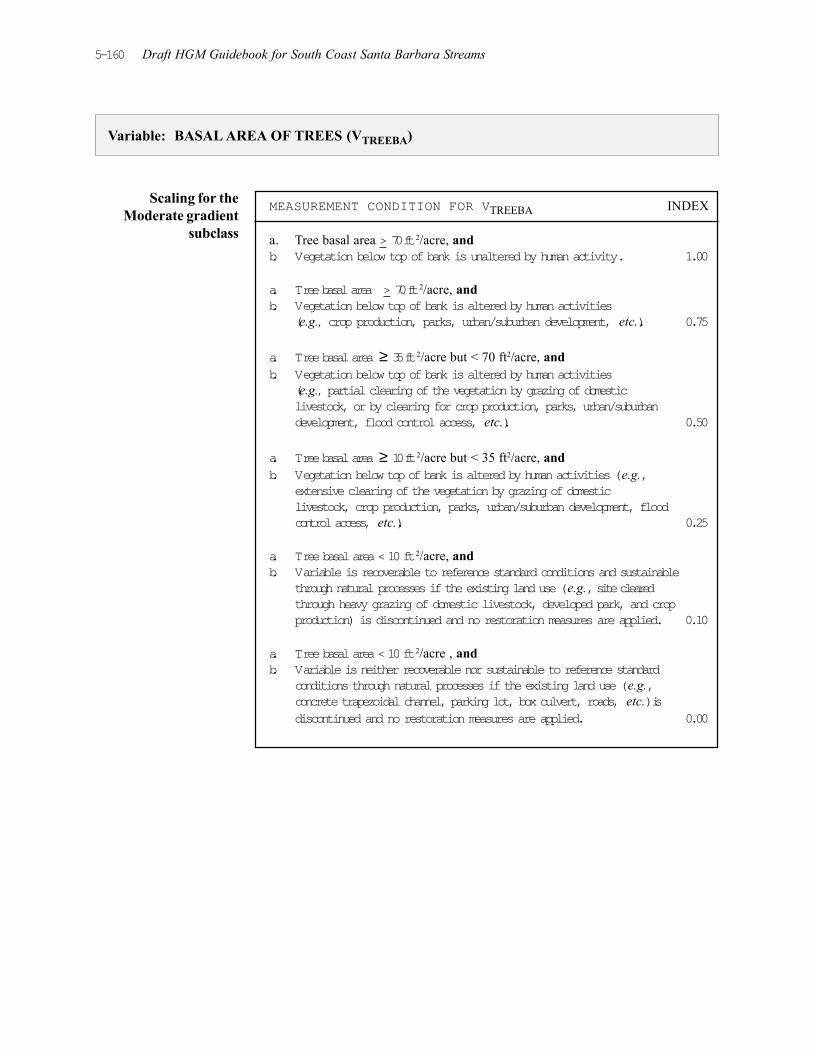
Variable: BASAL AREA OF TREES (VTREEBA)
Scaling for theModerate gradient
subclass
MEASUREMENT CONDITION FOR VTREEBA INDEX
a. Tree basal area > 70 ft2/acre, andb. Vegetation below top of bank is unaltered by human activity. 1.00
a. Tree basal area > 70 ft2/acre, andb. Vegetation below top of bank is altered by human activities
a. Tree basal area ≥ 35 ft2/acre but < 70 ft2/acre, andb. Vegetation below top of bank is altered by human activities
(e.g., partial clearing of the vegetation by grazing of domesticlivestock, or by clearing for crop production, parks, urban/suburbandevelopment, flood control access, etc.). 0.50
a. Tree basal area ≥ 10 ft2/acre but < 35 ft2/acre, andb. Vegetation below top of bank is altered by human activities (e.g.,
extensive clearing of the vegetation by grazing of domesticlivestock, crop production, parks, urban/suburban development, floodcontrol access, etc.). 0.25
a. Tree basal area < 10 ft2/acre, andb. Variable is recoverable to reference standard conditions and sustainable
through natural processes if the existing land use (e.g., site clearedthrough heavy grazing of domestic livestock, developed park, and cropproduction) is discontinued and no restoration measures are applied. 0.10
a. Tree basal area < 10 ft2/acre , andb. Variable is neither recoverable nor sustainable to reference standard
conditions through natural processes if the existing land use (e.g.,concrete trapezoidal channel, parking lot, box culvert, roads, etc.) isdiscontinued and no restoration measures are applied. 0.00
Assessment Model 5-161
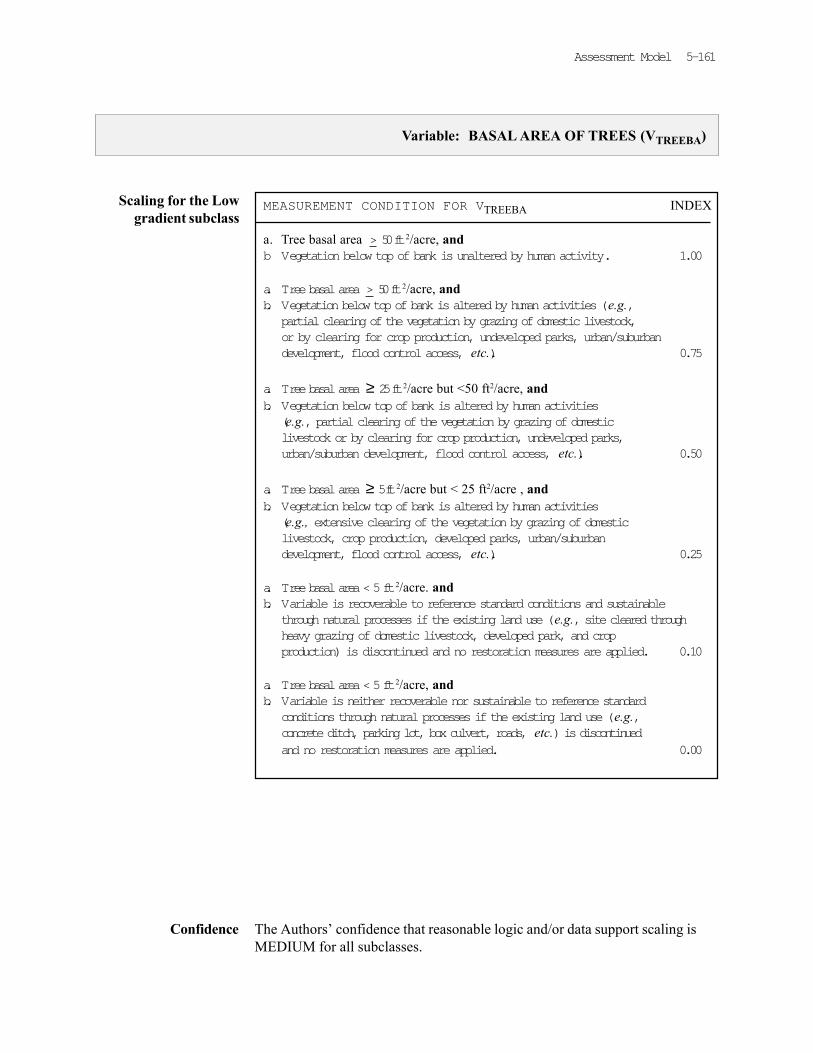
Scaling for the Lowgradient subclass
The Authors’ confidence that reasonable logic and/or data support scaling isMEDIUM for all subclasses.
Confidence
Variable: BASAL AREA OF TREES (VTREEBA)
MEASUREMENT CONDITION FOR VTREEBA INDEX
a. Tree basal area > 50 ft2/acre, andb Vegetation below top of bank is unaltered by human activity. 1.00
a. Tree basal area > 50 ft2/acre, andb. Vegetation below top of bank is altered by human activities (e.g.,
partial clearing of the vegetation by grazing of domestic livestock,or by clearing for crop production, undeveloped parks, urban/suburbandevelopment, flood control access, etc.). 0.75
a. Tree basal area ≥ 25 ft2/acre but <50 ft2/acre, andb. Vegetation below top of bank is altered by human activities
(e.g., partial clearing of the vegetation by grazing of domesticlivestock or by clearing for crop production, undeveloped parks,urban/suburban development, flood control access, etc.). 0.50
a. Tree basal area ≥ 5 ft2/acre but < 25 ft2/acre , andb. Vegetation below top of bank is altered by human activities
(e.g., extensive clearing of the vegetation by grazing of domesticlivestock, crop production, developed parks, urban/suburbandevelopment, flood control access, etc.). 0.25
a. Tree basal area < 5 ft2/acre. andb. Variable is recoverable to reference standard conditions and sustainable
through natural processes if the existing land use (e.g., site cleared throughheavy grazing of domestic livestock, developed park, and cropproduction) is discontinued and no restoration measures are applied. 0.10
a. Tree basal area < 5 ft2/acre, andb. Variable is neither recoverable nor sustainable to reference standard
conditions through natural processes if the existing land use (e.g.,concrete ditch, parking lot, box culvert, roads, etc.) is discontinuedand no restoration measures are applied. 0.00
5-162 Draft HGM Guidebook for South Coast Santa Barbara Streams
TREE CANOPY COVER (VTREECC)
Definition Tree Canopy Cover is the percent canopy cover of trees (single stem woodyspecies with >3” DBH and > 10 ft tall).
Rationale for Selectionof the Variable
Tree canopy coverage is traditionally used as a measure of species distributionand biomass (Clements 1916; Avery 1967; Mueller-Dombois and Ellenberg1974). As such, canopy cover can indicate the potential for a site to supportcharacteristic ecosystem processes such as maintenance of native and non-native plant communities and faunal habitat. Trees contribute to roughness andtopographic variation on floodplain and channel sites. Roughness provides amechanism that slows water flows and thus provides static and dynamic storageof flood flows and cover for aquatic and terrestrial fauna. Trees maintainchannel morphology by increasing bank shear strength through the productionand maintenance of fine root biomass. Trees also function as structural ele-ments that limit and/or control development and maintenance of channelgeometry.
Trees provide allochotonous inputs of labile and refractory organic carbon toriverine ecosystems. In addition, the presence of tree boles and canopies altermicro-climatic conditions in riparian forests (e.g., moisture, nutrients, light,temperature, wind speed etc.). Microclimatic alterations caused by the pres-ence of trees is important in maintaining several ecosystem functions such asbiomass production, maintenance of site water balance, nutrient conservation,habitat structure etc. Furthermore, trees are instrumental in soil genesis,elemental cycling, and successional processes (Hooper and Vitousek 1997).These successional processes include the dispersal and establishment of plantpropagules, support plant and animal species diversity and turnover (Tilman1982, Huston and Smith 1987, Cohen and Levin 1991, and Tilman and Pacala1993).
Measurement Protocol
The VAA for VTREECC consists of six 0.1-acre circular plots (radius = 37.3feet) established along the two vegetation transects, located on stream right andstream left. To measure VTREECC, utilize the six plot centers on the two vegeta-tive transects, stream right and stream left, to define 0.1-acre (radius 37.3 feet)circular plots. This is best accomplished by stretching a tape from the plotcenter to the targeted radius, and walking slowly in a circle around the plotcenter. Within each of the six circular plots, make ocular estimates of thepercent cover for the tree stratum (see Figure 5.10) using midpoints of standardcanopy cover classes (Appendix E.6). Record these estimates of percent coveron the Minimum Submittal Worksheet provided in Chapter 7. Average the sixmeasurements to produce a final estimate of percent canopy cover for the treestratum.
Data Located in Appendix B-33 through B-60
VTREECC
W
75’
75’
VAA (shaded areas)
Assessment Model 5-163
Variable: TREE CANOPY COVER (VTREECC)
The Authors scaled VTREECC using reference data, field observations, and bestscientific judgment. Specifically, reference data for High and Moderate gradientsubclasses were grouped according to similarities in plant community structureand degree of perturbation. Within the two VTREECC scales, ranges of canopycoverage were identified to incorporate the natural range of variation withinforested riparian communities of the SCSBC (Table 5.27). Sites dominated bynon-native trees (e.g., avocado) were excluded from the scaling.
Some of the recorded variation appears to be the result of natural causes (e.g.,cyclical droughts, successional processes, etc.). Higher canopy cover values areindicative of well established riparian forests. However, some of the higherrecorded canopy coverage percentages, particularly within the Low gradientsubclass, were due to anthropogenic disturbances that tended to augment orsupplant the tree canopy coverage of the natural community found in the lowergradient coastal surface subclass.
Scaling Rationale
Mean, standard deviation, and range of percent canopy cover for treeswithin the High and Moderate gradient subclasses
Table 5.27
Table 5.28 Mean, standard deviation and range of percent canopy cover for treeswithin the Low gradient subclass
Disturbance Sample Percent Canopy CoverGradient Size of Trees (Mean, SD, Range)
Unaltered / Reference Standard 4 47 + 37 (0 to 85.5)
Minimally Altered 10 40 + 25 (0 to 85.5)
Moderately Altered 16 52 + 26 (10.5 to 85.5)
Extensively Altered 8 29 + 32 (0 to 85.5)
Unrecoverable 0 N/A
5-164 Draft HGM Guidebook for South Coast Santa Barbara Streams
Scaling for High andModerate gradient
subclasses
Variable: TREE CANOPY COVER (VTREECC)
MEASUREMENT CONDITION FOR VTREECC INDEX
a. Average tree canopy cover > 80% andb. Vegetation below top of bank is unaltered. 1.00
a. Average tree canopy cover > 40% and < 80% andb. Vegetation below top of bank is unaltered by human activities. 0.75
a. Average tree canopy cover > 40% but < 80% andb. Vegetation below top of bank is altered by human activities
(e.g., partial clearing of vegetation by grazing of domesticlivestock, crop production, parks, urban/suburban development, floodcontrol access, etc.). 0.50
Average tree canopy cover > 10% but < 40%. 0.25
a. Average tree canopy cover < 10% andb. Variable is recoverable to reference standard conditions and sustainable
through natural processes if the existing land use (e.g., site clearedthrough heavy grazing of domestic livestock, developed park, and cropproduction) is discontinued and no restoration measures are applied. 0.10
a. Average tree canopy cover < 10% andb. Variable is neither recoverable nor sustainable to reference standard
conditions through natural processes if the existing land use (e.g.,concrete trapezoidal channel, parking lot, box culvert, roads, etc.) isdiscontinued and no restoration measures are applied. 0.00
Assessment Model 5-165
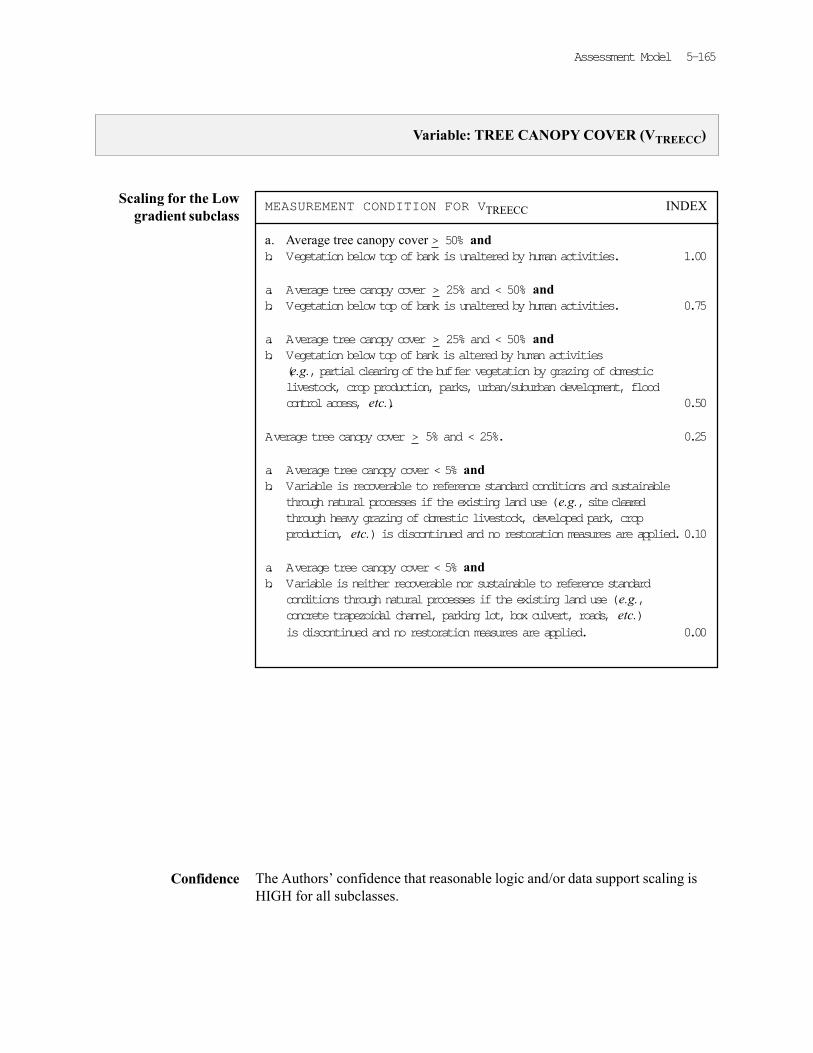
Variable: TREE CANOPY COVER (VTREECC)
Scaling for the Lowgradient subclass
The Authors’ confidence that reasonable logic and/or data support scaling isHIGH for all subclasses.
Confidence
MEASUREMENT CONDITION FOR VTREECC INDEX
a. Average tree canopy cover > 50% andb. Vegetation below top of bank is unaltered by human activities. 1.00
a. Average tree canopy cover > 25% and < 50% andb. Vegetation below top of bank is unaltered by human activities. 0.75
a. Average tree canopy cover > 25% and < 50% andb. Vegetation below top of bank is altered by human activities
(e.g., partial clearing of the buffer vegetation by grazing of domesticlivestock, crop production, parks, urban/suburban development, floodcontrol access, etc.). 0.50
Average tree canopy cover > 5% and < 25%. 0.25
a. Average tree canopy cover < 5% andb. Variable is recoverable to reference standard conditions and sustainable
through natural processes if the existing land use (e.g., site clearedthrough heavy grazing of domestic livestock, developed park, cropproduction, etc.) is discontinued and no restoration measures are applied.0.10
a. Average tree canopy cover < 5% andb. Variable is neither recoverable nor sustainable to reference standard
conditions through natural processes if the existing land use (e.g.,concrete trapezoidal channel, parking lot, box culvert, roads, etc.)is discontinued and no restoration measures are applied. 0.00
5-166 Draft HGM Guidebook for South Coast Santa Barbara Streams
VINE CANOPY COVER (VVINECC)
Definition Vine Canopy Cover is the percent canopy cover of vines or lianas (woodyvines) within the VAA.
Rationale for Selectionof the Variable
Vine canopy coverage is one measure of vegetation that indicates maintenanceof native plant community structure and function. As such, vine canopy covercan be used along with other measures of vegetative cover to indicate thepotential for a site to support characteristic ecosystem processes such asmaintenance of native plant communities, fauna and faunal habitat. Vinecoverage typical of various stages in the fire/flood/debris flow successionalcycles for each subclass indicates natural disturbance dynamics characteristicof riparian plant communities along the SCSBC as well as anthropogenicdisturbance dynamics.
MeasurementProtocol
The VAA for VVINECC consists of six 0.01-acre circular plots (radius = 11.8feet) established along the two vegetation transects, located on stream right andstream left. To measure VVINECC, utilize the six plot centers on the two vegeta-tive transects, stream right and stream left, to define 0.01-acre (radius 11.8 feet)circular plots. This is best accomplished by stretching a tape from the plotcenter to the targeted radius, and walking slowly in a circle around the plotcenter. Within each of the six circular plots, make ocular estimates of thepercent cover for all vines (Figure 5.10) using midpoints of standard canopycover classes (Appendix E.6). Record these estimates of percent cover on theMinimum Submittal Worksheet provided in Chapter 7. Average the six mea-surements to produce a final estimate of vine canopy coverage.
Data Located in Appendix B-33 through B-60
VVINECC
W
75’
75’
VAA (shaded areas)
Assessment Model 5-167
Variable: VINE CANOPY COVER (VVINECC)
Mean, standard deviation, and ranges for vine canopy coverage for High,Moderate and Low gradient subclasses
Table 5.30
Scaling Rationale The Authors scaled VVINECC using reference data, field observations, and bestscientific judgment. Specifically, reference data for all three subclasses weregrouped according to similarities in plant community structure. Reference datawere analyzed to determine average vine cover (by cover class midpoint) foreach plot. This provided the Authors with ranges of vine canopy coverage thatwere used to describe the natural range of variation of vine dominance withinforested riparian communities of the SCSBC (Table 5.30). Canopy coveragevalues for vines exhibited substantial variation within all subclasses, butdifference among subclasses did not warrant development of individual scalesfor each subclass. In general, sites that were either intact without substantialperturbation by humans or late successional, supported comparatively highVVINECC values due to the abundance of native vines. Early successional siteshad low vine coverage due to a recent (< 5 years) disturbance and those siteswhile those sites greatly disturbed by humans tended to exhibit high covervalues of non-native vines.
Unaltered /Near Reference Standard 4 56.75 + 12.5 (38 to 64)
Minimally Altered 13 45.5 + 31.1 (3 to 85.5)
Moderately Altered 18 41.8 + 27.3 (3 to 85.5)
Extensively Altered 20 18.55 + 21.7 (0 to 85.5)
Unrecoverable 2 0
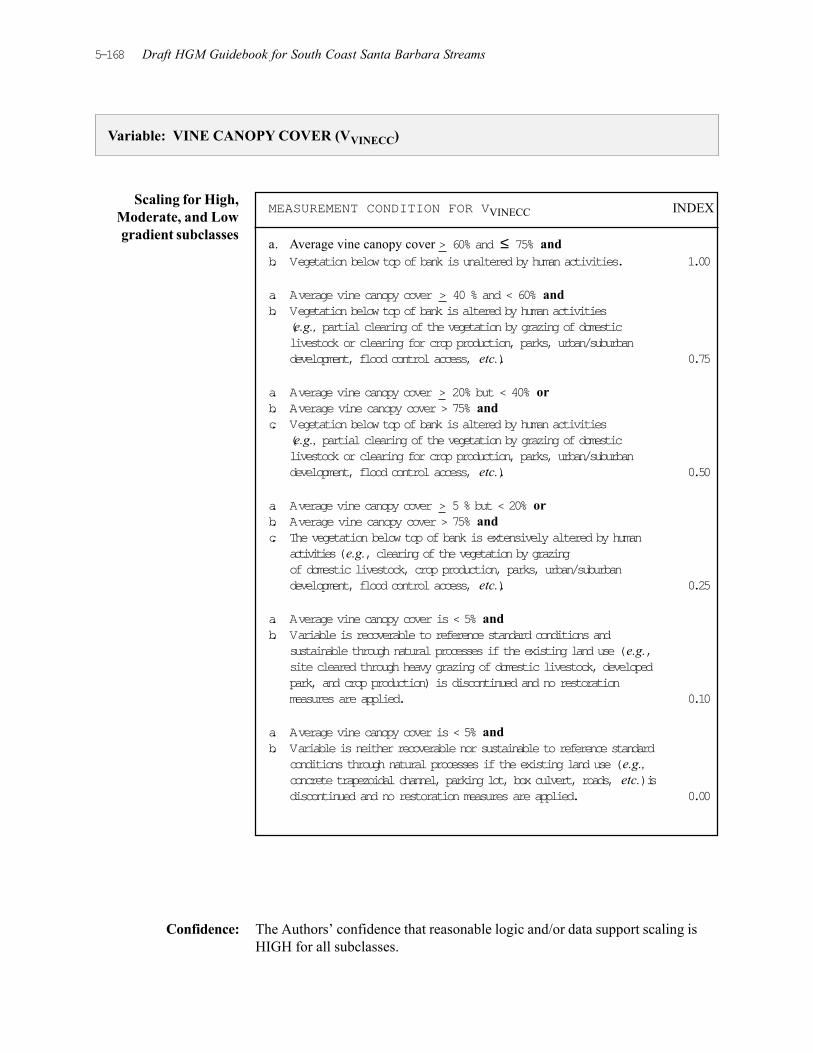
5-168 Draft HGM Guidebook for South Coast Santa Barbara Streams
Scaling for High,Moderate, and Lowgradient subclasses
Confidence: The Authors’ confidence that reasonable logic and/or data support scaling isHIGH for all subclasses.
Variable: VINE CANOPY COVER (VVINECC)
MEASUREMENT CONDITION FOR VVINECC INDEX
a. Average vine canopy cover > 60% and ≤ 75% andb. Vegetation below top of bank is unaltered by human activities. 1.00
a. Average vine canopy cover > 40 % and < 60% andb. Vegetation below top of bank is altered by human activities
(e.g., partial clearing of the vegetation by grazing of domesticlivestock or clearing for crop production, parks, urban/suburbandevelopment, flood control access, etc.). 0.75
a. Average vine canopy cover > 20% but < 40% orb. Average vine canopy cover > 75% andc. Vegetation below top of bank is altered by human activities
(e.g., partial clearing of the vegetation by grazing of domesticlivestock or clearing for crop production, parks, urban/suburbandevelopment, flood control access, etc.). 0.50
a. Average vine canopy cover > 5 % but < 20% orb. Average vine canopy cover > 75% andc. The vegetation below top of bank is extensively altered by human
activities (e.g., clearing of the vegetation by grazingof domestic livestock, crop production, parks, urban/suburbandevelopment, flood control access, etc.). 0.25
a. Average vine canopy cover is < 5% andb. Variable is recoverable to reference standard conditions and
sustainable through natural processes if the existing land use (e.g.,site cleared through heavy grazing of domestic livestock, developedpark, and crop production) is discontinued and no restorationmeasures are applied. 0.10
a. Average vine canopy cover is < 5% andb. Variable is neither recoverable nor sustainable to reference standard
conditions through natural processes if the existing land use (e.g.,concrete trapezoidal channel, parking lot, box culvert, roads, etc.) isdiscontinued and no restoration measures are applied. 0.00