ARTICLE Variant antigen diversity in Trypanosoma vivax is not driven by recombination Sara Silva Pereira 1 , Kayo J.G. de Almeida Castilho Neto 2 , Craig W. Duffy 1 , Peter Richards 1 , Harry Noyes 3 , Moses Ogugo 4 , Marcos Rogério André 2 , Zakaria Bengaly 5 , Steve Kemp 4 , Marta M.G. Teixeira 6 , Rosangela Z. Machado 2 & Andrew P. Jackson 1 ✉ African trypanosomes (Trypanosoma) are vector-borne haemoparasites that survive in the vertebrate bloodstream through antigenic variation of their Variant Surface Glycoprotein (VSG). Recombination, or rather segmented gene conversion, is fundamental in Trypanosoma brucei for both VSG gene switching and for generating antigenic diversity during infections. Trypanosoma vivax is a related, livestock pathogen whose VSG lack structures that facilitate gene conversion in T. brucei and mechanisms underlying its antigenic diversity are poorly understood. Here we show that species-wide VSG repertoire is broadly conserved across diverse T. vivax clinical strains and has limited antigenic repertoire. We use variant antigen profiling, coalescent approaches and experimental infections to show that recombination plays little role in diversifying T. vivax VSG sequences. These results have immediate con- sequences for both the current mechanistic model of antigenic variation in African trypa- nosomes and species differences in virulence and transmission, requiring reconsideration of the wider epidemiology of animal African trypanosomiasis. https://doi.org/10.1038/s41467-020-14575-8 OPEN 1 Department of Infection Biology, Institute of Infection and Global Health, University of Liverpool, 146 Brownlow Hill, Liverpool L3 5RF, UK. 2 Department of Veterinary Pathology, Faculty of Agrarian and Veterinary Sciences, São Paulo State University (UNESP), Jaboticabal, SP, Brazil. 3 Institute of Integrative Biology, University of Liverpool, Biosciences Building, Crown Street, Liverpool L69 7ZB, UK. 4 Livestock Genetic Programme, International Livestock Research Institute, 30709 Naivasha Road, Nairobi, Kenya. 5 International Research Centre for Livestock Development in the Sub-humid Zone (CIRDES), No. 559, rue 5- 31 angle, Avenue du Gouverneur Louveau, Bobo-Dioulasso, Burkina Faso. 6 Department of Parasitology, Institute of Biomedical Sciences, University of Sao Paulo, Avenue Professor Lineu Prestes, 1374 Cidade Universitaria, Sao Paulo, SP 05508-000, Brazil. ✉ email: [email protected]NATURE COMMUNICATIONS | (2020)11:844 | https://doi.org/10.1038/s41467-020-14575-8 | www.nature.com/naturecommunications 1 1234567890():,;
Transcript
ARTICLE
Variant antigen diversity in Trypanosoma vivax isnot driven by recombinationSara Silva Pereira 1, Kayo J.G. de Almeida Castilho Neto2, Craig W. Duffy 1, Peter Richards1, Harry Noyes3,
Moses Ogugo4, Marcos Rogério André2, Zakaria Bengaly5, Steve Kemp4, Marta M.G. Teixeira6,
Rosangela Z. Machado2 & Andrew P. Jackson1✉
African trypanosomes (Trypanosoma) are vector-borne haemoparasites that survive in the
vertebrate bloodstream through antigenic variation of their Variant Surface Glycoprotein
(VSG). Recombination, or rather segmented gene conversion, is fundamental in Trypanosoma
brucei for both VSG gene switching and for generating antigenic diversity during infections.
Trypanosoma vivax is a related, livestock pathogen whose VSG lack structures that facilitate
gene conversion in T. brucei and mechanisms underlying its antigenic diversity are poorly
understood. Here we show that species-wide VSG repertoire is broadly conserved across
diverse T. vivax clinical strains and has limited antigenic repertoire. We use variant antigen
profiling, coalescent approaches and experimental infections to show that recombination
plays little role in diversifying T. vivax VSG sequences. These results have immediate con-
sequences for both the current mechanistic model of antigenic variation in African trypa-
nosomes and species differences in virulence and transmission, requiring reconsideration of
the wider epidemiology of animal African trypanosomiasis.
https://doi.org/10.1038/s41467-020-14575-8 OPEN
1 Department of Infection Biology, Institute of Infection and Global Health, University of Liverpool, 146 Brownlow Hill, Liverpool L3 5RF, UK. 2 Department ofVeterinary Pathology, Faculty of Agrarian and Veterinary Sciences, São Paulo State University (UNESP), Jaboticabal, SP, Brazil. 3 Institute of IntegrativeBiology, University of Liverpool, Biosciences Building, Crown Street, Liverpool L69 7ZB, UK. 4 Livestock Genetic Programme, International Livestock ResearchInstitute, 30709 Naivasha Road, Nairobi, Kenya. 5 International Research Centre for Livestock Development in the Sub-humid Zone (CIRDES), No. 559, rue 5-31 angle, Avenue du Gouverneur Louveau, Bobo-Dioulasso, Burkina Faso. 6 Department of Parasitology, Institute of Biomedical Sciences, University of SaoPaulo, Avenue Professor Lineu Prestes, 1374 Cidade Universitaria, Sao Paulo, SP 05508-000, Brazil. ✉email: [email protected]
African trypanosomes (Trypanosoma spp.) are unicellularhaemoparasites and the cause of African Trypanosomiasisin animals and humans1. These parasites are transmitted
by tsetse flies (Glossina spp.), and their proliferation in blood andother tissues leads to anaemia, immune and neurological dys-function, which is typically fatal if untreated. The profound,negative impact of this disease on livestock productivity acrosssub-Saharan Africa is measured in billions of dollars annually2.
Trypanosoma vivax is a livestock parasite found throughout sub-Saharan Africa and South America3–5. Although superficially likethe more familiar Trypanosoma brucei (the species responsible forHuman African trypanosomiasis) and Trypanosoma congolense(another livestock parasite), T. vivax is distinct in morphology andmotility6, cellular ultrastructure7,8 and genetic repertoire, particu-larly with regard to cell surface-expressed genes9,10. Most con-spicuously, it has a simpler life cycle in tsetse flies, lacking aprocyclic stage in the insect midgut, and can be transmitted non-cyclically by other genera of haematophagous flies6.
Although distinct from T. brucei, T. vivax shares a definingphenotype with other African trypanosomes. Trypanosome cellsurfaces are coated with a variant surface glycoprotein (VSG)that undergoes antigenic variation11. Trypanosome genomesencode hundreds of alternative VSG, but each cell expresses justa single variant. Periodically, new variants emerge that havedynamically switched to an alternative expressed VSG11. EachVSG is strongly immunogenic but confers no heterologousprotection. Thus, as antibodies clear the dominant VSG clones ofthe parasite infra-population, serologically distinct clones replacethem, rendering cognate antibodies redundant and facilitating apersistent infection12.
Previously, we showed that T. vivax VSG are distinct fromthose in T. brucei or T. congolense. T. vivax VSG genes (namedFam23–26 inclusive) display much greater sequence divergence,and include sub-families absent in other species13. In T. brucei,recombination in the form of segmental gene conversion (SGC) isinstrumental in both switching VSG genes and generating novelmosaic antigens14,15. However, sequence repeats known to facil-itate gene conversion in T. brucei were absent from the T. vivaxreference genome, suggesting that the T. brucei-based paradigmof antigenic variation might not apply to other species10.
Experiments from the pre-genomic era revealed certain distinctfeatures of antigenic variation in T. vivax that remain unexplained.Animals infected with T. vivax self-cure more often and fastercompared with other species, which was attributed to antigenicexhaustion16,17. Clones expressing certain VSG re-emerged late ininfection after the host had developed immunity3,17. Quite unlikeT. brucei or T. congolense, recovered animals displayed immunityto strains from very distant locations, indicating that T. vivaxserodemes could span countries, or even the whole continent18,19.Such features prompted the prediction that antigen repertoire inT. vivax would be smaller than in other trypanosomes3.
Here, we address these long-standing issues by characterisingantigenic diversity in clinical T. vivax isolates. We apply the datato examine VSG recombination in parasite populations and toprofile VSG expression during experimental infections in a goatmodel. The variant antigen profile (VAP) we establish for T. vivaxshows that VSG sequence patterns in T. vivax are incompatiblewith the current, T. brucei-based model for antigenic variation intrypanosomes.
ResultsGenome sequencing. Genomes of 28 T. vivax clinical strainsisolated from seven countries were sequenced on the IlluminaMiSeq platform. Genome assemblies ranged in coverage from 32.8to 80.4%, in-sequence depth from 3.5× to 78.5×, and in contiguity
(N50) from 238 to 2852 (Supplementary Data 1). Using sequencehomology with known VSG sequences in the T. vivax Y486 andT. brucei TREU927 reference genomes, between 40 and 436 VSGgenes were recovered from assembled genome contigs; the meanaverage (175) is approximately one fifth of the T. vivax Y486reference genome repertoire (N= 865)10.
T. vivax variant antigen profiles reflect genealogy. We devised aVAP for T. vivax VSG gene repertoire to examine antigenicdiversity across strains. The four VSG-like gene sub-families(Fam23–26)13 in the T. vivax Y486 reference sequence (here-after called ‘Y486’) occurred in all genomes, in similar pro-portions (Supplementary Fig. 1), making them unsuitable fordiscriminating between strains. Therefore, we produced clustersof orthologous genes (COGs) for all VSG-like sequencesfrom Y486 and 28 clinical strains (N= 6235), defining a COGas a group of VSG-like sequences with ≥90% sequence identity.This produced 2039 COGs, each comprising a single gene plusnear-identical paralogues from multiple strains. Most COGs(78%) were cosmopolitan (i.e. present in multiple locations; seeMethods), while 441 were strain-specific (SupplementaryData 2).
VAPs based on presence or absence of VSG COGs werecompared to strain genealogy and geography to examine spatio-temporal variation in VSG repertoire. Figure 1 shows that straingenealogy estimated from whole-genome single nucleotidepolymorphisms (SNPs) recapitulates geography and matchesthe relationships inferred from the VAPs at a regional level,although there are inconsistencies in strain relationships, forinstance in the position of ‘TvGondo’ and ‘TvMagna’, which mayreflect sampling error within the SNP tree or ancestral gene flowbetween T. vivax populations. Overall, VAP broadly reflects bothpopulation history and location. There is a remarkable corre-spondence between VAPs of Ugandan strains with those fromBrazil, suggesting that these Brazilian T. vivax were introducedinto Brazil from East Africa. The correspondence of VAPs andSNPs is particularly clear when we compare the Ugandan/Brazilian profile with those in Nigeria. Still, while clearlydivergent in their VSG repertoire, there remain 769 COGs(37%) that are shared between these distant locations; forinstance, ‘TvILV-21’ possesses various COGs widespread in WestAfrica. Thus, T. vivax VSG repertoires diverge in concert with thewider genome and provide a faithful record of population history,in contrast to T. congolense, where the opposite effect wasobserved20.
Species-wide T. vivax VSG repertoire contains 174 phylotypes.The VSG gene complements in our strain genome sequences areincomplete. So, while comparing partial strain genomes in com-bination provides a coherent analysis of species-wide VSG var-iation, the spatial distribution of COGs, and the number of trulylocation-specific COGs, will increase with greater sampling. Thisis clear when we consider that 248 COGs (12.2%) comprise asingle Y486-specific sequence, which is the only strain with acomplete VSG complement. Presently, a COG-based VAP willinclude too many false-negative ‘absences’ to reliably profileindividual strains.
A VAP that allows comparison of any two strains must bebased on universal markers that also vary in the population.COGs are not universal and sub-families do not vary; so, wereasoned that a taxon of intermediate inclusivity would satisfyboth criteria. Therefore, we devised another VAP based onphylotypes, each consisting of multiple, related COGs with ≥70%sequence identity (see Methods and Supplementary Fig. 2 forfurther explanation of classification system). In all, 174 VSG
phylotypes accommodated every VSG-like sequence we observed.Figure 2 shows the size and distribution of these across strainsand emphasises the widespread distribution of most phylotypes,86% (149/174) of which are cosmopolitan.
Exceptions to this trend, i.e. structurally distinct VSG sub-families restricted to specific populations, may be epidemiologi-cally important. Among Nigerian samples, the location with thelargest sample (N= 11) and so the most robust presence/absencecalls, five phylotypes are unique (P94, P118, P126, P170, P173).These are not recent derivations in Nigerian T. vivax because theyare defined by a threshold sequence identity and so are ofapproximately equally age to other phylotypes. Moreover, theirpositions in Fig. 2 indicate no significant difference in the nodeconnectivity of Nigeria-specific and cosmopolitan phylotypesoverall. As these phylotypes comprised only one or two COGs, weextended the analysis to COGs generally.
We found 130 COGS in at least 9/11 Nigeria strains and noother location. We tested whether the Nigeria-specific COGs were
as old as closely related cosmopolitan COGs in the samephylotype or otherwise evolved more recently. If they wereyounger than the cosmopolitan COGs, this would mean that, atleast in Nigeria, novel VSGs were being generated through geneduplication. Thus, we estimated Maximum Likelihood phyloge-nies for each phylotype containing a Nigerian-specific COG andinferred relative divergence times using the RelTime tool inMEGA v10.0.521 (see Source Data file). This showed that therewas no significant difference (p= 0.35, independent t test) in themean divergence times for Nigeria-specific COGs (μ= 0.038 ±0.005; N= 83) and cosmopolitan COGs in the same phylotype(μ= 0.041 ± 0.005; N= 212). Therefore, Nigerian-specific COGsand phylotypes are just as ancient as lineages with cosmopolitandistributions, and do not provide evidence for population-specificgene family expansions.
In summary, the incompleteness of strain genomes compelledus to adopt phylotypes as a universal but variable metric to profileT. vivax VSG repertoire. On this basis, T. vivax VSG repertoire
0.05 subs/site
Tv1392 (NIG) (77%)
Tv465 (NIG) (79%)
Tv11 (NIG) (79%)
Tv462 (NIG) (79%)
Tv2323 (UG) (71%)
Tv2714 (UG) (70%)
TvILV-21 (UG) (51%)
Tv2005 (UG) (61%)
TvMi (BR) (57%)
TvBrRp (BR) (71%)
TvBobo14 (BF) (34%)
TvKad (BF) (33%)
TvGondo (BF) (47%)
TvMagna (TG) (56%)
Tv3638 (IC) (72%)
Tv3658 (IC) (72%)
Tv3171 (GAM) (55%)
TvD39 (BF) (55%)
Tv340 (NIG) (78%)
Tv596 (NIG) (80%)
Tv493 (NIG) (79%)
Tv3651 (IC) (71%)
Tv306 (NIG) (79%)
Tv319 (NIG) (70%)
Tv684 (NIG) (80%)
Tv338 (NIG) (80%)
TvBobo09 (BF) (34%)
Whole genome
Not observed
ObservedNigeria Uganda BrazilBurkinafaso
TogoGambiaIvorycoast
Tv1392
Tv465
Tv11
Tv462
Tv340
Tv596
Tv493
Tv306
Tv319
Tv684
Tv338
TvBobo14
TvKad
Tv3171
TvBobo09
TvGondo
TvMagna
TvD39
Tv3638
Tv3651
Tv3658
TvMi
TvBrRp
TvILV-21
Tv2005
Tv2323
Tv2714
TvLinsTvLins (BR) (67%)
Variant antigen profile
Fig. 1 Variant antigen profiles of T. vivax clinical isolates based on presence and absence of VSG gene clusters are concordant with population history(i.e. genetic relatedness). On the left, a Maximum Likelihood phylogenetic tree estimated from a panel of 21,906 whole-genome SNPs using a GTR+ Γ+ Imodel. Branch support is provided by 100 bootstrap replicates and branches with bootstrap support >70 are shown in bold. Percentage genome coverageis shown for each strain in brackets following its label. Genome sequence reads for 28 T. vivax clinical strains were mapped to 2038 VSG type sequences,representing conserved clusters of orthologous genes (COGs) or strain-specific sequences, to determine the distribution of each VSG. Presence (red) orabsence (white) of each VSG in each strain is indicated in the central panel. Each profile is labelled with the strain name, coloured by its geographical origin,and linked to the SNP tree by the grey shade. On the right, a dendrogram relating all strains according to their observed VSG repertoire was estimated fromEuclidean distances between VAPs. Source data are provided as a Source Data file.
appears to be relatively conserved over large distances. Populationvariation does exist, especially at COG level, but appears tooriginate through differential patterns of lineage loss rather thanpopulation-specific gene family expansions, since Nigeria-specificCOGs are no younger than other VSG. This degree of widespreadconservation is quite unlike patterns seen in T. brucei22.Suspecting that this indicated a more fundamental differencebetween African trypanosome species in how antigenic diversityevolves, we examined population variation among their VSGsequences in detail.
Minimal signature of recombination in T. vivax VSG sequen-ces. We took multiple approaches to test the hypothesis10 that T.vivax VSG recombine less than T. brucei and T. congolense VSG.First, we asked if VSG sequences assort. Based on the currentmodel of antigenic switching11, VSG reads from 28 clinical strainswould not remain paired after mapping to Y486 because histor-ical recombination events would have distributed them acrossmultiple reference loci. Figure 3a shows that the proportion ofstrain read-pairs remaining paired after mapping is significantlyhigher in T. vivax (mean= 92%; N= 19) relative to T. congolense(mean= 87%; t= 3.23; p < 0.05, independent t test) and T. brucei(mean= 76%; t= 12.8; p < 0.001, independent t test), and is
almost as high as a negative control comprising adenylate cyclasegenes (mean= 97%).
Reversing this approach, we examined how Y486 VSG genesequences mapped to strain assemblies when broken into 150 bpsegments. From this segmental mapping, we characterised VSGsinto fully coupled (FC), multi-coupled (MC), or uncoupled (UC),based on how many reference donors each VSG had and howmuch of the VSG sequence they accounted for (Fig. 3b). FC VSGshave at least one donor contributing to >84% of the sequence;MC VSGs are sequences with donor(s) contributing to less than84% of the sequence but more than 150 bp, or at least two donorfragments in different regions; and UC VSGs are those with one ormore donors contributing with one fragment only (i.e. ≤150 bp).The mean proportion of Y486 VSG that are mosaics of straingenes (i.e. ‘Multi-coupled’ (MC: 25%) or ‘Uncoupled’ (UC: 7%)) issignificantly lower than for equivalent comparisons in T.congolense (MC: 33%, p < 0.05; UC: 31%, p < 0.001; independentt test) and T. brucei (MC: 39%, p < 0.001; UC: 12%, p < 0.001;independent t test), while the number that are essentiallyorthologous (i.e. ‘Fully coupled’ (FC: 59%)) is significantly greater(for T. congolense, p < 0.001; for T. brucei, p < 0.001; independent ttest) (Fig. 3c). Analysis of phylogenetic incompatibility inalignments of FC and MC quartets using PHI23 corroborates the
123
1659
40
16679
1047
28
84
33
424332
17664
65
142
126
48
1432
6
179
7234
15
29
167761
104
12
85
161
147
154
134
77
146
82
125
144
124
14878
11
4
145
168
30
149
150
56
89
162
15581
66
157
159
151
116170
171
16487
128
45
80156
153
160
27
152
8140
131 7
141 2586 18 172
3
88
112
36
114
63
19
35
111
110
117
113
61
13912752 83
169
132
50
133
137
95
93
57
96
55
91
136
106
62
6870
1690
17838
69 3739
138
94129
71
51
1353
135
97
75
120
5
121158
67
107108
103 180
173105
3198
59
54
23
58175
100
22
46
1473
10274
21
163
118
119
60
26
174
41
20
99
24101
1744
West Africa
Cosmopolitan
Nigeria
Uganda
Uganda+Brazil
Burkina Faso
TogoGam
bia
Ivory Coast
Fam 23
Fam 24
Fam 25
Fam 26
T. bruceia-VSG
T. bruceib-VSG
1 5 10 15 20 27
Fig. 2 The T. vivax VSG repertoire is described by 174 phylotypes. A sequence homology network in which nodes represent phylotypes. Four conservedVSG sub-families (Fam23–2613) are indicated by pale red back-shading. Nodes are labelled by phylotype number; node size indicates the number of COGsin each phylotype, while node colour indicates the geographical distribution of the phylotype across 28 clinical isolates. Edges represent PSI-BLASTsimilarity scores greater than a threshold necessary to connect all phylotypes within sub-families. Structural homology of Fam23 and Fam24 with A-typeand B-type T. brucei VSG respectively is indicated at top left. The figure shows that most phylotypes are cosmopolitan in nature, found in multiple strainsand in more than two regions. A minority are strain- or location-specific phylotypes, e.g. there are ten phylotypes specific to West Africa (i.e. Ivory Coast,Togo and Burkina Faso) and another 15 phylotypes that are unique to a single location, for instance five in Nigeria (P94, P118, P126, P170, P173), three inBurkina Faso (P11, P86, P120) and two in The Gambia (P110, P124). Source data are provided as a Source Data file.
mapping patterns. Across all species, FC VSG contain littleevidence for phylogenetic incompatibility and not generally morethan the adenylate cyclase control (Fig. 3d). While MC VSGdisplay phylogenetic incompatibility, T. vivax MC quartetsdisplayed this less frequently (Ppi= 41%) than in T. congolense(Ppi= 65%) and T. brucei (Ppi= 67%).
While there are fewer MC VSG in T. vivax, this sizeable minoritymight still be genuine mosaics. Alternatively, other processes suchas gene paralogy or substitution rate heterogeneity could accountfor the signature of recombination. Hence, we explicitly modelledthe history of recombination within FC or MC sequence quartetsusing ancestral recombination graphs (ARG) and inferred the timeto most recent common ancestor (TMRCA) for each quartet.Average TMRCA was significantly greater for T. vivax FC VSG(0.19 ± 0.17) than either T. congolense (0.05 ± 0.06) or T. brucei(0.06 ± 0.07), indicating much deeper coalescent times for T. vivaxVSG. More importantly, the variance in TMRCA along sequencealignments is extremely small for T. vivax FC VSG, showing that the
whole alignment shares a common ARG (Fig. 3e). Variance isgreater for MC VSG, but both MC and FC types are significantlyless variable than either other species (p < 0.001, independent t test).Both the relatively small TMRCA and variance in TMRCA alongalignments indicates that T. brucei and T. congolense VSG areroutinely mosaics, while the coalescence of most T. vivax VSG canbe modelled without recombination. Interestingly, TMRCA var-iance is significantly higher among T. bruceiMC VSG quartets thanT. congolense VSG (p < 0.001, independent t test), indicating that theformer may have a higher recombination rate (explored further inSupplementary Table 1).
In summary, these analyses show that retention of orthologyamong VSG loci across trypanosome populations varies signifi-cantly between species. Figure 3f plots the total pairwise orthologybetween strains (see Methods). Around 75% of T. vivax VSGare found in multiple strains as orthologues, without evidencefor recombination, compared with ∼40% in T. brucei (p < 0.001,independent t test) and T. congolense (p < 0.001, independent
VSG Adenylatecyclase
60
70
80
90
100
Rea
d-pa
irs p
aire
d af
ter
map
ping
(%
)
FC MC UC UM
Ref
eren
ce V
SG
(%
)
R = 2e–05
Phy
loge
netic
inco
mpa
tibili
ty (Ppi
)
Tv(N = 19)
Tc(N = 27)
Tb(N = 25)
Seq
uenc
e or
thol
ogy
(%)
0
0.2
0.4
0.6
0
20
40
60
80
100
0
20
40
60
80NS
a
d
b c
FCMC
R = 0
NS
e f
P{1
}
0.95
P{2
}P
{3}
0.95
0.95
Strain VSG
Reference VSGpseudo-reads
Fully-coupled VSG Multi-coupled VSG
Donor 1 Donor 2 Donor 3
Adenylatecyclase
0
0.03
0.02
0.01
0.04
�2 T
MR
CA
FCMC Adenylate cyclase
Fig. 3 The frequency of VSG recombination differs between African trypanosome species. a The proportion of read-pairs from strain VSG remainingpaired after being mapped to the reference sequence for each trypanosome genome, shaded by species. Adenylate cyclase genes (AC) were included as anegative control. b The definition of fully coupled (FC) and multi-coupled (MC) VSG sequences. Reference VSG sequences were segmented and mapped tostrain VSGs. Where ≥85% of pseudo-reads map to the same locus (e.g. ‘Donor 1’), the gene is fully coupled. Where a strain VSG has multiple segmentsmapping to multiple locations (e.g. ‘Donor 1–3’), the gene is multi-coupled. Example T. brucei VSG sequence quartets are shown after TOPALi HMManalysis82 (see Methods). The three line graphs represent the Bayesian probabilities of three possible topologies for a quartet phylogeny. An FC VSGdisplays the same topology along its whole length. An MC VSG displays different phylogenetic signals along its length, dependent on the identity of thesequence donor. c A comparison of the proportions of FC, MC, uncoupled (UC) and unmapped (UM) VSG in each trypanosome species. The median valueis shown as a black bar. Statistical significance of differences in the mean are indicated by asterisks (independent t test, *p < 0.05; **p < 0.01; ***p < 0.001).d Phylogenetic incompatibility among VSG genes using Phi23. The proportion of FC and MC VSG quartet alignments showing significant phylogeneticincompatibility (Ppi) in MC and FC VSGs is shown, shaded by species (mean ± s.e.m.). Observed Ppi values for simulated sequences generated byNetRecodon78, either with recombination (R= 2e−05) or without (R= 0), are indicated by dashed lines. e Variation in the ‘time to most recent commonancestor’ (TMCRA) along MC and FC VSG quartet alignments, estimated from ancestral recombination graphs constructed by ACG81. The median value isshown as a black bar. f Total sequence orthology among VSG repertoires in each species. Orthology was calculated as the proportion of VSG base-pairsfully coupled between each strain genome sequence and the reference. Number of strain genomes is shown in brackets. Source data are provided as aSource Data file.
t test). As the VAPs indicated, T. vivax VSG typically retainorthology and essentially behave like ‘normal’ genes in thepopulation, while T. brucei or T. congolense VSG recombinefrequently, causing loss of orthology and the appearance of strain-specific mosaics throughout the population.
Strong phylogenetic effects on VSG expression in vivo. Broadlyconserved VSG phylotypes containing little signature of historicalrecombination indicate that VSG mosaics do not contribute toantigenic diversity in vivo. We tested this by measuring VSGtranscript abundance in goats experimentally infected with T.vivax (strain Lins24) over a 40-day period. Parasitaemia andexpression profiles of VSG phylotypes in four replicates areshown in Fig. 4. We observed the expected waves of parasitaemiabeginning after 4 days and continuing approximately every 3 daysuntil termination (i.e. 6–9 parasitaemic peaks). Transcriptomeswere prepared for each peak and revealed 282 different VSGtranscripts across all replicates (Supplementary Data 3), whichbelonged to 31 different phylotypes (18% of total speciesrepertoire).
Variant antigen profiling of the expressed transcripts char-acterised the dominant (but more often co-dominant) VSGphylotypes across successive peaks (Fig. 4). Somewhat contrary toexpectation, we often saw persistent expression of a phylotype (P)across peaks, e.g. P24 (Supplementary Fig. 3) and P2 (Supple-mentary Fig. 4), or re-emergence of a phylotype after decline, e.g.P40 (Supplementary Fig. 5) and P143 (Supplementary Fig. 6). TheT. vivax (Lins) inoculum was not derived from a clone, but ratherrepresents a mixed population with one dominant clone (seeMethods); hence, this initial heterogeneity could result invariation in VSG expression between animals. However, despitethe unavoidable clonal mixture of the initial inoculum, theidentity of expressed phylotypes was partly reproduced acrossreplicates, with 12/31 phylotypes observed in all four animals, and19 phylotypes in three animals (Supplementary Fig. 7); on 21occasions this extended to an identical VSG sequence (for detail,see Supplementary Figs. 3–6).
Similarly, the order of VSG expression was partly reproducibleacross animals. Figure 5 displays transcript number andabundance at early, middle and late points in the experiment,mapped on to the sequence similarity network of all phylotypes.The best example of reproducibility is the dominant expression ofP24 in the middle-to-late period across all animals. Otherexamples include a group of phylotypes (P2, P40, P142 and P143)expressed early (i.e. peak 1/2, Fig. 5a) in Animal (A) 2 and A3,then re-emerging later at peak 5/6 in A1–3 (Fig. 5b), and evenlater in A4. For detailed analysis of phylotype abundance at eachtime-point, see Supplementary Fig. 8. Importantly, however,while phylotypes show consistency in expression through timeand across replicates, individual VSG transcripts do not. Hence,while the dominant variant antigen belonged to P24 in everyreplicate, the actual P24 transcript expressed was different in eachcase and its variants diverged by up to 26.5% in nucleotideidentity. Further examples in Supplementary Figs. 3–6 demon-strate that this was typical.
Across all peaks, groups of related transcripts of the samephylotype were commonly co-expressed at the same peak (e.g. P2expression comprised 3.08 ± 1.97 transcripts on average, P24=2.33 ± 1.3, P40= 2.67 ± 1.12, P143= 2.71 ± 1.25). On three occa-sions, the observed phylotype comprised seven distinct transcripts(P2 at peak 5 in A1, P8 at peak 8 in A4 and P135 at peak 5 in A1).Overall, only 8/31 phylotypes were ever represented by a singletranscript. This indicates that the expressed repertoire isdetermined in part by sequence homology, and SupplementaryFig. 9 shows that expressed transcripts belong to significantly
fewer phylotypes than simulated transcript repertoires of thesame size, confirming that they are not drawn from the availablerepertoire by chance. For detailed examples, see SupplementaryFigs. 3–6.
An obvious feature in Fig. 5 is the concentration of highlyexpressed phylotypes in the bottom-left corner of the network. Acomplex of closely related Fam23 phylotypes (e.g. P2, P40, P142)were expressed early in A1 and A2 (Fig. 5a, b). This was followedby Fam23 phylotypes placed closer to the centre of the network(e.g. P8), and finally, Fam25 phylotypes (e.g. P24/P44) in lateinfection. In A3 and A4, a similar pattern occurred, except thatFam25 VSG (i.e. P44) were expressed early, followed by the Fam23‘complex’ and then P24. This can also be seen in SupplementaryFig. 8, where phylotypes displaying reproducible profiles acrossreplicates are often closely related (e.g. P2, P40, P142 and P143).The connectivity of nodes representing expressed phylotypes isgreater than that expected by chance. The clustering coefficient ofa sub-network representing all ‘expressed’ nodes across all peaks issignificantly greater than randomised sub-networks of the samesize (for detail, see Supplementary Fig. 10).
In summary, the major pattern emerging from in vivo expressionprofiles is a strong phylogenetic signal on three levels. First, theidentity and order of expressed phylotypes is partly reproducible(but expression of individual transcripts is typically not). Second,phylotypes expressed at a given peak regularly comprise multipledistinct, but closely related, transcripts. Finally, at the phylotypelevel, related phylotypes are expressed simultaneously or consecu-tively, manifested as clustering in Fig. 5 and Supplementary Fig. 8.Therefore, phylogeny (or sequence relatedness) is an importantfactor in explaining the pattern of VSG expression during theseT. vivax infections.
No mosaics of VSG phylotypes during experimental infections.Expressed VSG in T. brucei include sequence mosaics, which isinterpreted as evidence for recombination of VSG loci duringinfections15,25,26. In T. brucei, VSG mosaics can be formedbetween highly divergent donors with as little as 25% identityalong their entire lengths26, and can implicate relatively shortrecombinant tracts of ∼100 bp27. We analysed expressed VSGtranscript sequence mosaics by comparing 100 bp windows ofeach transcript to the T. vivax Lins genome sequence usingBLASTp28. Typically, mosaics would be confirmed where a singletranscript displayed affinities to different VSG genes along itslength. Unfortunately, since both VSG transcripts and genesequences were often fragmentary, it was common for a transcriptto have multiple affinities as no single gene sequence spanned itslength. Even so, without exception, the closest related sequencesin every window of each transcript were other sequences in thesame phylotype.
With sequence affinities inconclusive, we searched forreorganisation of an expressed VSG sequence relative to agenomic locus by mapping all read-pairs belonging to VSGtranscripts to the T. vivax Lins genome. After mapping, thepercentage of unpaired reads (1.06–5.63%) was greater than thepercentage arising from a random selection of 100 housekeepinggenes (0.01–0.05%). However, given that T. vivax VSG arearranged in tandem gene arrays of closely related paralogues10,we reasoned that this repetitive organisation might lead tomultiple mapping of reads. Indeed, the percentage of unpairedVSG reads is not significantly different to that of adenylatecyclases (3.43–7.53%; p= 0.892, independent t test), which do notform mosaics but are often arranged in tandem arrays29 (seeSource Data file).
Nonetheless, the few mis-mapped reads could still derive fromrare mosaic transcripts. To examine these explicitly, we aligned
VSG transcripts with the three most similar genes from the T.vivax Lins genome sequence using BLASTn (where threesequences >500 bp in length could be obtained; N= 68) andused GARD30 to identify potential recombination breakpoints.The closest matches to each transcript were again always from thesame phylotype (minimum full-length sequence identity of 86%).
GARD found that 54/68 alignments displayed significanttopological incongruence not attributable to rate heterogeneity,indicating 1.94 ± 1.66 breakpoints on average (ranging between 0and 7). At first, this might suggest that mosaicism is widespreadwithin phylotypes; however, this degree of phylogenetic incom-patibility was not significantly different to adenylate cyclases (36/
48 alignments with significant topological incongruence and anaverage of 1.87 ± 1.88 breakpoints (ranging between 0 and 8); p=0.39, independent t test) (see Source Data file).
In summary, while most transcript alignments containedbreakpoints, these only implicated very similar sequences, andthe scale of genetic admixture was comparable to other tandemlyarrayed gene families. Thus, we believe that the apparentassortment of these paralogous sequences is consistent with re-arrangements (real or artefactual) caused by tandem arrangementof T. vivax VSG. Certainly, no transcript contained evidence formosaics of different VSG phylotypes and therefore, assortment ofthe same magnitude as T. brucei was not seen.
DiscussionIn the current model of trypanosome antigenic variation, recom-bination is the driver behind the creation of novel VSG sequencesand persistence in the mammalian host. Unlike T. brucei and T.congolense, we find little evidence for VSG mosaics, either histori-cally in the population or during experimental infections. Instead,T. vivax VSG repertoire comprises 174 conserved phylotypes, andincomplete sorting of these lineages produces population variation.Although there are T. vivax populations in Eastern and SouthernAfrica that we have yet to sample, we see now that the deep ancestryof VSG lineages and lack of VSG pseudogenes in T. vivax10 reflect along history without recombination.
Experiments in the twentieth century documented the pro-gression of variant antigen types (VATs) during T. vivaxinfections3,16,17. VATs represent parasite clones that confer aspecific, reproducible immunity, assumed to relate to a specificVSG. Our results confirm the hypothesis that emerged fromthese experiments that the T. vivax VSG repertoire is smallerthan those of other species3,16. While the number of VSG genes iscomparable to T. brucei and T. congolense, these provide fewerunique antigens because they are often extremely similar, areexpressed simultaneously, and cannot recombine. This explainsseveral features of T. vivax infections, including the propensityfor host self-cure16 and the re-emergence of VATs late ininfection17. Furthermore, 70% of phylotypes and 45% of COGsare shared between East and West Africa respectively, whichcould explain the widespread distribution of serodemes, that is,why immunity to VATs in East Africa provides protectionagainst some parasite strains from Western and Southern Africaalso19,31.
We have defined VSG phylotypes as universal but variablequantities for variant antigen profiling of any T. vivax strain. Theevolutionary conservation of many phylotypes, and their repro-ducible expression patterns (in contrast with individual genes),has shown that phylotypes are not merely a convenient means ofclassifying T. vivax VSG, but must have biological relevance. How
they are relevant to the mechanism of antigenic variation inT. vivax is not yet clear. Recently, it was suggested that patterns inT. brucei VSG expression could relate to protein length, withlonger VSG being expressed as infections progress32. Our data donot support this hypothesis in T. vivax, there was no correlationbetween VSG length and days post infection, using either ourown transcript lengths or the full-length, cognate Y486 gene (seeSource Data file). Regardless of why these phylotypes are ubi-quitous, a crucial consideration is how they relate to VATs. Ifindividual transcripts in a phylotype cross-react with the sameantibody, then VATs are likely to be synonymous with phylo-types, which raises the question of why multiple transcripts areexpressed when this confers no benefit to parasite persistence.Conversely, if all VSG transcripts represent serologically distinctproteins, this poses the question of why co-expression is deter-mined by sequence homology. Either way, the relevance of VSGphylogeny to antigenic variation is clear.
The absence of recombination among VSG genes means thatthe generation of antigenic diversity in T. vivax differs fromT. brucei. We propose, based on the current model of T. bruceiantigenic variation, that the mechanism of VSG switching mustalso be different. Although it should be stressed that antigenicdiversity and antigenic variation are distinct processes, it isimportant to realise that the two are intricately linked in T. bruceiby mechanism. T. brucei VSGs are expressed from dedicatedcassettes at the telomeres of megabase chromosomes called VSGexpression sites (ES)33–35; note that analogous structures have notyet been found in T. vivax. In T. brucei, VSG switching can occurthrough activation of alternative ES by epigenetic means36–38, orthrough the substitution of the VSG in the active ES mediated byrepetitive DNA motifs that do not occur in T. vivax10. The lattercan occur through SGC, or telomere exchange, and is mostlytriggered by double-strand breaks39–41. The other consequence ofSGC is the creation of mosaic VSG sequences in T. brucei, that is,antigenic diversity. Therefore, while we have not examined themechanism of T. vivax antigenic variation directly, we proposethat, whatever the mechanism is, it must be different to the T.brucei model because T. vivax VSG show no evidence of mosai-cism historically, or during infections. We do not insist thatrecombination never happens in T. vivax. Among highly similarVSG sequences, for example those found in tandem gene arrays10,we would expect either allelic or ectopic recombination to occurwhen these sequences align. Furthermore, meiotic recombinationduring sexual reproduction (which is unconfirmed in T. vivax)could promote gene flow and antigenic diversity among parasitepopulations. Indeed, recombination could still play a role inT. vivax VSG switching, just not in a manner that promotessequence diversity. We have observed that multiple, relatedT. vivax VSG transcripts are often expressed simultaneously; ifthese co-expressed transcripts derive from the same tandem array
Fig. 4 VSG phylotype expression during experimental T. vivax Lins infections in a goat model (N= 4). Parasitaemia (black line) is shown in the uppergraph (detection limit (DL)) was 4.1 × 10³ trypanosome per millilitre of blood). Parasite RNA was isolated at peaks in parasitaemia, indicated as black dots.The number of unique VSG transcripts (red line) observed in each transcriptome is plotted on the same axis. The lower line graph shows the combinedtranscript abundance for each VSG phylotype (shaded according to key) through the experiment (days post infection) for four replicates animals (A1–A4from top to bottom). Note that phylotypes can comprise several, distinct transcripts of variable abundance. Across all peaks in all animals, a phylotype wasrepresented by a single transcript in 105/196 observations, (mean= 1.88 ± 1.26 s.d.). However, across the 31 expressed phylotypes, only eight (P3, P13,P14, P16, P38, P141, P151 and P178) occur as single transcripts on every occasion when they were observed. Thus, while a slight majority of phylotypes arerepresented by only one transcript at a given peak, most phylotypes are present as multiple transcripts at some point. Phylotypes that were dominant (i.e.superabundant) are labelled adjacent to the pertinent lines. A superabundant VSG was defined as having an expression level at least ten times that of thenext most abundant VSG, and this was observed at 15/28 peaks. For example, P24 is 128 times more abundant than P44 at peak 5 in A1, and P1 is 32 timesmore abundant than P155 at peak 7. The classical expectation of VSG expression is that a peak will include a single superabundant VSG like this; often,however, several co-dominant VSG phylotypes occurred with comparable expression levels, for example at peak 1 in A1 and A2. Source data are provided asa Source Data file.
of VSG paralogues, rearrangement of the arrays could have acentral role in a distinct switching mechanism not dependenton SGC.
Without recombination to create mosaic VSG sequences,there is a fundamental limitation on antigenic diversity inT. vivax and therein its capacity for immune evasion. This posesprofound new questions of how T. vivax persists long enough totransmit (which it evidently does very successfully). PerhapsT. vivax has adopted a different life strategy with respect to the
transmission-virulence or invasion-persistence trade-offs thatgovern pathogen evolution42,43. One possibility is that T. vivaxhas evolved a more acute infection strategy than other speciesand achieves transmission over shorter periods. Some aspectssupport an invasion-persistence trade-off; T. vivax infections(where the host survives) are typically shorter than otherspecies44,45, and some haemorrhagic strains cause an extremelyacute syndrome that is also hypervirulent46,47. Furthermore,where trypanosome species have been directly compared,
166 179
123165
1
123165
1
20
155 87
18 179
165
18172
179
123
166165
27
135
1
14
155
13
123
166
1
14
171 87
27155
135
1
37178
135
123
123
155
17218
1
155
18 141
37
166
179
123
20123
37
24
23
13
2123
179
18
155
17287
165
Peak 1: 5 days Peak 5: 32 days Peak 6: 34 days
Peak 1: 7 days Peak 4: 23 days Peak 5: 31 days
Peak 1: 7 days Peak 5: 31 days Peak 7: 41 days
Peak 1: 5 days Peak 7: 31 days Peak 9: 41 days
24
24
24 2424
24 242 2
22
22
2
40 40
142 142142
142142
142
142
44 44
4444
44
4444
8 88
8
8
8 8
5+ 4 23 1Size (number)
Shade (abundance)
High
Low
a b c
A1
A2
A3
A4
40
40 40
40
40 40
143
143
143
143 143
33 33 33
Co/e = 7.18
Co/e = 6.35 Co/e = 1.63
Co/e = 1.27
Co/e = 1.83 Co/e = 1.78
Co/e = 0.77
Fig. 5 Expression of VSG phylotypes in the context of sequence similarity. Combined transcript abundance for expressed phylotypes are plotted on to thephylotype sequence similarity network at a early (Peak 1), b middle (peaks 4–7), and c late (last peak) infection stages respectively. Data from fourreplicate animals are shown (A1–A4 from top to bottom). Nodes represent phylotypes and are labelled by phylotype number. Node size indicates thenumber of unique expressed transcripts, while node shade indicates the combined transcript abundance (log2 CPM). The classical expectation of VSGexpression is that a dominant VSG should subside in abundance and disappear as the host acquires antibody-mediated immunity. However, phylotypeswere seen to persist across peaks and/or re-emerge later in the experiment; for instance, P40, P24 and P33 are present at all three time-points in A1, A2and A3 respectively. Similarly, P2 was expressed strongly at the beginning and re-emerges at the end of infections in A1 and A2. Likewise, P44 wasexpressed at both the beginning and end of infection in A4. Since only three time-points are shown, it should be noted that these phylotypes were notpresent at all peaks, so this could represent re-emergence rather than persistence. In cases where sufficient nodes were expressed, the clusteringcoefficient (C) for their sub-network was calculated. This observed value was compared to mean average C for 100 randomised sub-networks of the samesize. The ratio of the observed and expected (by chance) clustering coefficients for expressed sub-networks is shown where a calculation was possible.This value typically exceeds one showing that expressed nodes cluster more than random selections. When considered over all peaks, the clusteringcoefficient of expressed nodes is significantly higher than coefficients of randomised sub-networks of the same size (see Supplementary Fig. 10 for furtherdetails). Source data are provided as a Source Data file.
chronic pathologies such as reduced packed cell volume44,45 andhumoral immunosuppression48 are less severe with T. vivax.However, there is no evidence that T. vivax replicates or transmitsquicker, as would be expected under a trade-off. Another possi-bility is that the idiosyncratic life cycle and wider vector range ofT. vivax6 are an adaptation to increase transmission in theabsence of long-term persistence in the mammalian host. How-ever, in various reports, animals that survive the initial acuteT. vivax infection are said to develop a chronic, often asympto-matic, infection during which parasites are not visible49–51, butwhich may cause progressive neuropathy52. Thus, another pos-sibility is that T. vivax cause long-term, chronic infections likeother species, but has an alternative mechanism for persistence.Dissemination to immune-privileged sites might allow persistenceat low cell densities and T. vivax does disseminate to the repro-ductive and nervous systems, but all trypanosome species have acomparable ability for disease tropism53.
In conclusion, the orthology of VSG phylotypes across popu-lations, and the considerable structural divergence among them,indicates that the T. vivax variant antigen repertoire lacks thedynamism typical of T. brucei VSG. Crucially, we find no evi-dence in T. vivax for the vital role that recombination has indiversifying T. brucei VSG sequences. This is a major departurefrom the current model of antigenic variation, indicating thatT. vivax has a distinct mechanism of immune evasion. Antigenicdiversity is limited in T. vivax, but not in T. brucei and T. con-golense; this both explains the antigenic exhaustion observedduring T. vivax infections and poses important new questions ofhow infections persist under such circumstances. Possibly, thelack of adaptation for persistence reflects a fundamentally dif-ferent life strategy in T. vivax, with profound implications forunderstanding virulence and transmission of this pervasive anddevastating pathogen.
MethodsEthical considerations. This study was conducted in accordance with the guide-lines of the Brazilian College of Animal Experimentation (CONCEA), following theBrazilian law for ‘Procedures for the Scientific Use of Animals’ (11.794/2008 anddecree 6.899/2009). Ethical approval was obtained from the Ethical Committee tothe Use of Animals (CEUA) of the Veterinary and Agrarian Sciences Faculty(FCAV) of the State University of São Paulo (Jaboticabal campus) (São Paulo,Brazil) (protocol no. 001494/18, issued on 08/02/2018). The study was alsoapproved by the Animal Welfare and Ethical Review Body (AWERB) of theUniversity of Liverpool (AWC0103).
Sample preparation. A panel of 25 T. vivax-infected blood stabilates (150 µl),representing isolates from Burkina Faso (N= 5), Ivory Coast (N= 3), Nigeria(N= 11), Gambia (N= 1), Uganda (N= 4), Togo (N= 1), were selected from AziziBiorepository (http://azizi.ilri.org/repository/) at the International LivestockResearch Institute (ILRI), and the Centre International de Recherche-Développement sur l’Elevage en zone Subhumide (CIRDES). In addition, genomicDNA of three Brazilian isolates previously described24,54,55 was obtained fromInstituto de Ciências Biomédicas (ICB) at the University of São Paulo. For samplesfrom ILRI and CIRDES: Red blood cells were lysed with ACK lysing buffer (Gibco,UK) and discarded by centrifugation. Cells were washed twice in 1 ml MACS bufferby centrifugation (10 min, 2500 rpm). The pellet was re-suspended in 100 µl lysisbuffer (aqueous solution of 1M Tris-HCl pH8.0, 0.1 mM NaCl, 10 µM ethylene-diaminetetraacetic acid (EDTA), 5% sodium dodecyl sulfate (SDS), 0.14 µM Pro-teinase K). Samples were incubated at room temperature for 1 h and DNA wasextracted with magnetic Sera-Mag Speedbeads (GE Healthcare Life Sciences, UK)according to the manufacturer’s protocol. For samples from ICB: DNA wasextracted following a traditional phenol-chloroform extraction protocol (TvBrRp)or an ammonium acetate protocol as previously described56 (TvBrMi). In sum-mary, sample digestion was performed in Digsol buffer (50 mM Tris, 20 mMEDTA, 117 mM NaCl and 1% SDS) with Proteinase K (final concentration 10 mg/ml) for 3 h at 55 °C. DNA was precipitated with ammonium acetate (2.5 M finalconcentration). DNA purification was performed with ethanol precipitation and70% ethanol washing. Pellets were air-dried for 30 min, DNA re-suspended in 50 μlsterile water and samples stored at −20 °C until use.
Genome sequencing and assembly. Illumina paired-end sequencing librarieswere prepared from genomic DNA using the NEBNext® Ultra™ DNA Library Prep
Kit according to the manufacturer’s protocol (New England Biolabs, UK) andsequenced by standard procedures on the Illumina MiSeq platform, as 150 bp(ILRI) or 250 bp (ICB and CIRDES) paired ends. For each sample, the data yieldfrom sequencing after quality filtering was between 1.69 × 10⁶ and 1.32 × 10⁷ read-pairs. Samples were assembled de novo using Velvet 1.2.1057 with a kmer of 65(ILRI and CIRDES) or 99 (ICB). These produced assemblies with n50 between 238and 2852 bp (median= 353; mean= 985). The ratio of read depth of an alternativeallele over the total read depth was calculated to detect mixed infections58,59. Allsamples were from single infections only.
VSG-like sequence recovery and systematics. VSG-like nucleotide sequenceswere retrieved from the assembled contigs files by sequence similarity search withtBLASTx (v2.8.0)28. We used a database of T. vivax Y486 VSG as query and asignificance threshold of p < 0.001, contig length ≥100 amino acids, and sequenceidentity ≥40%. Additionally, we queried a database of T. brucei a-VSG and b-VSGsequences, using the same p value and length thresholds, to accommodate VSGgenes that might be absent from T. vivax Y486, i.e. the possibility that the referencegenome is not representative of all strains. In the event, the reference proved to berepresentative.
VSG-like sequences were translated and clustered using OrthoFinder60 underthe default settings. Orthofinder clustered orthologous sequences from thereference and 28 strains. In practice, these clusters of orthologues (‘COGs’) alsoincluded near-identical in-paralogues. Sequences in each cluster were aligned usingClustalx (v2.1)61 and all alignments were edited to remove overhangs and short(<100 bp) sequences. Edited alignments were refined to produce COGs with >90%average sequence identity by combining COGs that were very similar or, morefrequently, subdividing Orthofinder clusters that contained several orthologousgroups until the average sequence divergence was <0.05. In complex cases of largeOrthofinder clusters, neighbour-joining phylogenies were estimated to aid sub-division. Sequences that could not be placed with any other such that sequencedivergence was <0.05 were categorised as ‘unclustered’ (assumed to be strain-specific VSG).
With the membership of COGs determined, we reverted to the original,unedited sequences to identify the longest representative of that COG (a ‘typesequence’). Type sequences were combined with the original, unclusteredsequences and compared with Fam23–2613 VSG reference sequences usingBLASTp (v2.8.0) to confirm their validity and assign a subfamily10. We obtained2039 type sequences in total, 961 belonging to Fam23, 543 to Fam24, 244 to Fam25,and 191 to Fam26. Sequences found not to have a satisfactory match to Fam23–26VSG were excluded. This process produced 760 COGs (comprising2582 sequences) and 1279 unclustered, or ‘singleton’ sequences. Each typesequence and singleton was compared against all others using BLASTp to establishcohorts of related COGs/singletons, which we call ‘phylotypes’. A BLASTp outputwas used to create sequence alignments for phylotypes and to estimate neighbour-joining phylogenies for each. The membership of phylotypes was manuallyadjusted by removing the most divergent sequences until each met a threshold of70% average sequence identity.
Note that the geographical distribution VSG COGs and phylotypes is inferredfrom the strains in which type sequences were detected. We define a ‘cosmopolitan’COG or phylotype as being present in more than one location, except if theselocations are Brazil and Uganda, or any combination of Ivory Coast, Togo andBurkina Faso. In both cases, we judged the T. vivax strains to be too close to justifythese as separate populations. COGs or phylotypes found only in Brazil andUganda are considered ‘East African’ in this study. Those found only in somecombination of Ivory Coast, Togo and Burkina Faso are considered ‘West African’.
Variant antigen profiling. To produce VAPs for each strain, we used sequencemapping to confirm the presence or absence of individual COGs. For a gene to bepresent in a strain, at least one read must map with a threshold nucleotide identityof 98% (allowing a maximum of five nucleotides mismatch per 250 bp read). Asmapping makes use of low-coverage reads that would not otherwise be integratedinto VSG sequence assemblies, this was more efficient than inspecting genomecontigs for sequence homology. There was an 11% increase in the observedrepertoire size (an average of 87 additional VSG) when mapping relative to BLAST.Mapping indicated that most singleton sequences were present in other strainsdespite the absence of assembled orthologues. Specifically, from the 1279 sequencesthat could not be placed in a COG with BLAST, only 34 (2.7%) remained unplacedafter mapping. For these reasons, trimmed sequence reads were aligned to the 2039COG type sequences, using Bowtie2 (v2.3.4)62 set to -D 20 -R 3 -N 1 -L 20. Acustomised Perl script was used to select entries with a match length ≥245nucleotides (corresponding to a 2% error rate in a 250 bp sequencing read),mapped as proper pairs, in the correct orientation, and within the expected insertsize. This list was compared to the COG database and used to produce the pre-sence/absence binary matrix that represents the T. vivax VAP. VAP-based strainrelationships were estimated by hierarchical clustering analysis in R, using binarydistance calculation and the Ward’s minimum variance method63, and comparedto the whole-genome variation phylogeny. For phylotype-based VAPs, presence/absence and distribution data were generated by summing over all constituent VSGCOGs and singletons.
Strain variation. To estimate strain relationships based on the whole genome,MiSeq reads were retrieved and mapped against the T. vivax Y486 genome usingBWA mem64, converted to BAM format, sorted and indexed with SAMtools(v1.9)65. Sorted BAM files were cleaned, duplicates marked and indexed withPicard (http://broadinstitute.github.io/picard/), and single nucleotide poly-morphisms (SNPs) were called and filtered with Genome Analysis Toolkit suite(v3.8-0) according to the best practice protocol for multi-sample variant call-ing66. The multi-sample VCF file obtained from GATK was converted to FASTAformat using VCFtools v0.1.1467 and a maximum likelihood phylogeny wasestimated with PHYML (v3.0)68, using the GTR+ Γ+ I model of nucleotidesubstitution, following Smart Model Selection69.
T. vivax experimental infections. Five male Saanen goats of 4−8 months of age,housed at the Veterinary and Agrarian Sciences Faculty (FCAV) of the StateUniversity of São Paulo (Jaboticabal campus) (São Paulo, Brazil), were infectedwith the T. vivax Lins24 isolate. Before inoculation, parasite stabilates cryopreservedin 8% glycerol were thawed, checked for viability under a light microscope. Eachanimal was inoculated intravenously with approximately 6 × 10⁶ parasites. There isno in vitro culture system for bloodstream-stage T. vivax. Therefore, it is notcurrently possible to derive single clones from blood, and the frozen stabilate usedhere represent mixed populations of the antigenic types circulating the donoranimal prior to the experiment. However, we can expect one or two clones to bedominant within these populations and all animals received aliquots of the samepreparation from one donor. Animals were clinically examined daily and para-sitaemia was determined by microscopy using the Brener’s method70. This consistsof loading 5 µl of blood into a slide with a coverslip, counting the number oftrypanosomes present in 50 microscopic fields of view, and multiplying by themicroscope correction factor. Animal 2 was euthanised by anaesthesia overdose onday 39 post infection (p.i.) after showing signs of health deterioration (loss ofappetite, lethargy and anaemia). Xylasine chlorohydrate (0.2 mg/kg) was admi-nistered intra-muscularly as pre-anaesthetic medication, followed by intramuscularketamine chlorohydrate (2 mg/kg) as anaesthetic. Cardio-respiratory arrest wasinduced by intrathecal administration of lidocaine chlorohydrate. Remaining ani-mals were euthanised on day 45 p.i. according to the same procedure.
Blood collection, RNA extraction and sequencing. At each parasitaemia peak,4 ml of blood were collected from jugular venepuncture and centrifuged for 15min at 13,000 × g. The buffy coat was removed into a 2.0 ml LoBind micro-centrifuge tube (Eppendorf, UK), 1.5 ml of ACK Lysing buffer (Gibco, UK)added, and the mixture incubated for 15 min at room temperature to lyse leftoverred blood cells. Samples were centrifuged for 15 min at 13,000 × g, washed twicein PBS, pH 8.0, snap-frozen in liquid nitrogen and kept and −80 °C until RNAextraction. RNA was extracted from 2.23 × 10⁵ to 1.04 × 10⁷ trypanosomes persample, using the RNeasy Mini Kit (Qiagen, UK) according to the manufacturer’sprotocol. RNA yields varied between 117 ng and 13 μg per sample, quantified onthe NanoDrop 2000 (ThermoFisher Scientific, Brazil). Up to 1 μg of total RNAwas used to prepare multiplexed cDNA libraries as described71 using the T. vivaxsplice-leader (SL) sequence72 as the second cDNA strand primer. Briefly, thisconsists of amplification of first-strand cDNA using a random primer linked toan Illumina adaptor sequence, selection of trypanosome cDNA by amplificationof the secondary cDNA strain using a reverse primer containing the SL sequencelinked to an Illumina adaptor sequence, and addition of Illumina sequencingadaptors and double-strand cDNA amplification. Finally, Illumina Nexteraindexes were added by PCR amplification to allow multiplexing. For samples upto day 30 p.i., this protocol was followed exactly as described, quantified usingQubit HS dsDNA (Invitrogen, UK) and the Agilent 2100 Bioanalyzer (AgilentTechnologies, UK), and sequenced at Centre of Genomic Research (Liverpool,UK) on a single lane of the HiSeq 4000 platform (Illumina Inc, USA) as 150paired ends, producing 280 M mappable reads. However, as the library insertsizes produced were longer than recommended for the HiSeq 4000 platform(Illumina Inc, USA), the protocol for samples from days 30 to 45 p.i. wasmodified. Instead of adding the indexes from the Illumina Nextera index kit,adapter-ligated, SL-selected cDNA was used as input for the NEB Ultra II FSDNA library kit (NEB, UK), which includes an initial step of DNA fragmentation.Sequencing statistics are shown in Supplementary D1.
Transcriptome profiling. RNAseq reads were assembled de novo using Trinity(v2.8.6)73. Transcript abundances were estimated for each sample with kallisto(v0.45.0)74 using Trinity pre-compiled scripts. Subsequently, transcript abun-dances of samples from the same animal, expressed as transcripts per million,were combined and normalised based on the weighted trimmed mean of logexpression ratios (trimmed mean of M values (TMM)75). TMM normalisationadjusts expression values to the library size and reduces composition bias. TMMvalues were used to produce transcript expression matrices for each animal. Torecover all VSG-like sequences in the transcriptomes, a sequence similarity searchwas performed with tBLASTx28 using the T. vivax COG database produced aboveas query and a significance threshold of E < 0.001, contig length ≥150 aminoacids, and sequence identity ≥70%. All retrieved VSG-like sequences were
manually curated to remove spurious matches. The resulting lists of VSG tran-scripts were used as query in a sequence similarity search to identify VSG tran-scripts matching the list of COGs defined in the VAP. A threshold of E < 0.001,contig length >50 amino acids, and sequence identity ≥98% was applied. Finally,VSG transcripts were assigned a phylotype based on sequence similarity com-parison to the VSG phylotype network (≥70% nucleotide identity across thewhole gene sequence). VSG transcript abundances were combined per phylotype,resulting in a transcript expression matrix containing the abundance of each VSGphylotype over time.
Recombination analysis. Fifty previously published genomes from T. bruceispp29,76,77. and T. congolense20 and 19 of the T. vivax genomes presented in thisstudy were used to compare signatures of recombination across species (Supple-mentary Data 4). VSGs and adenylate cyclase genes were extracted from genomeassemblies by sequence similarity search (BLASTn28) using a nucleotideidentity ≥50%, length ≥ 600 nucleotides, and E < 0.001. VSG assortment wasquantified by read mapping using Bowtie2 62. VSG read-pairs were retrieved fromthe genomes and mapped against reference full-length VSG to calculate the pro-portion of strain read-pairs remaining paired after mapping. This protocol wasrepeated for adenylate cyclases to provide a negative control; adenylate cyclasegenes are multi-copy and include numerous, tandemly arrayed near-perfect copies,but do not undergo SGC13,29.
In the segmental mapping approach, reference VSGs were broken into 150 bpfragments and mapped against the strain VSGs to calculate the frequency ofreference reads remaining paired. VSGs were characterised into UC, MC and FC,according to the estimated number of donors (i.e. the reference VSGs fromwhich the pseudo-reads were derived). FC VSGs were those with at least onedonor contributing to more than 84% of the sequence. MC VSGs were those withone or more donors contributing with more than one fragment (≥300 bp),whereas UC VSGs were those remaining (i.e. one or more donors contributingwith one fragment only (i.e. ≤150 bp)). The reference VSGs that were notmapped at least once to the strain VSGs were considered reference-specificvariants.
Evidence for past recombination within alignments of MC and FC VSGs andadenylate cyclases was examined using phylogenetic incompatibility in PhiPack23.The proportion of alignments showing significant phylogenetic incompatibility(Ppi) was calculated using PhiPack and compared to the Ppi of two sets of simulateddata (250 replicates, 16 artificial sequences per replicate) with and withoutrecombination. Simulated data were generated with NetRecodon (v6.0.0)78, underdiploid settings, a population mutation rate (θ) of 160, a heterogeneity rate of 0.05,and an expected population size of 1000. The population recombination rate (ρ)was set to 0 and 96 for the non-recombinant dataset and recombinant datasets,respectively. Both experimental and simulated sequences were divided intosequence quartets, aligned with Muscle (v3.8.31)79 and iteratively parsed throughPhiPack23. MC VSG quartets were created with one MC VSG plus three donorVSGs from the reference. FC VSG, adenylate cyclase and simulated quartets wererandomly generated and parsed through PHI 100 times for statistical power. MCquartets were compiled manually with MC VSG and three donors.
Total sequence orthology in each trypanosome species VSG repertoire wascalculated as the proportion of total VSG nucleotides of a strain repertoireshared with the relevant reference genome, averaged over all strains. Thisincludes all FC VSG and conserved segments of MC VSG. The number of sharednucleotides was extracted from the mapping output file using genomecov fromBEDtools (v2.27.0)80.
Estimation of ancestral recombination graphs. Ancestral recombination graphswere reconstructed for multi-coupled and fully coupled VSG quartet alignmentsand adenylate cyclase control quartet alignments using the ACG software pack-age81. The TMRCA was estimated along the length of each aligned quartet at 20 bpintervals using a 100-bp-wide sliding window using constant recombination rate/population size models with an MCMC length of 10,000,000, burn-in of 1,000,000and sampling frequency of 2500. For each individual quartet the TMRCA along thelength of the alignment was summarised by calculating the mean TMRCA. Toidentify evidence of recombination, which would generate a sequence with regionsof differing ancestries, the variance in TMRCA along the alignment was calculatedfor each individual quartet.
Reporting summary. Further information on research design is available inthe Nature Research Reporting Summary linked to this article.
Data availabilityThe datasets generated during the current study are available in the NCBI repository,under the ENA project accession number PRJNA486085. The source data underlyingFigs. 1–3a, 3c–5 and Supplementary Figs. 1 and 8−10 are provided as a Source Data file.
Received: 30 August 2019; Accepted: 18 January 2020;
References1. Giordani, F., Morrison, L. J., Rowan, T. G., De Koning, H. P. & Barrett, M. P.
The animal trypanosomiases and their chemotherapy: a review. Parasitology143, 1862–1889 (2016).
2. Shaw, A. P. M., Cecchi, G., Wint, G. R. W., Mattioli, R. C. & Robinson, T. P.Mapping the economic benefits to livestock keepers from intervening againstbovine trypanosomosis in Eastern Africa. Prev. Vet. Med. 113, 197–210(2014).
3. Gardiner, P. R. Recent studies of the biology of Trypanosoma vivax. Adv.Parasitol. 28, 229–317 (1989).
4. Osório, A. L. A. R. et al. Trypanosoma (Duttonella) vivax: its biology,epidemiology, pathogenesis, and introduction in the New World—a review.Mem. Inst. Oswaldo Cruz 103, 1–13 (2008).
5. Morrison, L. J., Vezza, L., Rowan, T. & Hope, J. C. Animal AfricanTrypanosomiasis: time to increase focus on clinically relevant parasite andhost species. Trends Parasitol. 32, 599–607 (2016).
6. Hoare, C. A. The Trypanosomes of Mammals. A Zoological Monograph(Blackwell, 1972).
7. Vickerman, K. & Evans, A. Studies on the ultrastructure and respiratoryphysiology of Trypanosoma vivax trypomastigote stages. Trans. R. Soc. Trop.Med. Hyg. 68, 45 (1974).
8. Tetley, L. & Vickerman, K. Surface ultrastructure of Trypanosoma vivaxbloodstream forms. Trans. R. Soc. Trop. Med. Hyg. 73, 321 (1979).
9. Van der Ploeg, L. H., Cornelissen, A. W., Barry, J. D. & Borst, P.Chromosomes of kinetoplastida. EMBO J. 3, 3109–3115 (1984).
10. Jackson, A. P. et al. Antigenic diversity is generated by distinct evolutionarymechanisms in African trypanosome species. Proc. Natl. Acad. Sci. USA 109,3416–3421 (2012).
11. Horn, D. Antigenic variation in African trypanosomes. Mol. Biochem.Parasitol. 195, 123–129 (2014).
12. Mugnier, M. R., Stebbins, C. E. & Papavasiliou, F. N. Masters of disguise:antigenic variation and the VSG coat in Trypanosoma brucei. PLOS Pathog.12, e1005784 (2016).
13. Jackson, A. P. et al. A cell-surface phylome for African trypanosomes. PLoSNegl. Trop. Dis. 7, e2121 (2013).
14. Robinson, N. P., Burman, N., Melville, S. E. & Barry, J. D. Predominance ofduplicative VSG gene conversion in antigenic variation in Africantrypanosomes. Mol. Cell. Biol. 19, 5839–5846 (1999).
15. Hall, J. P. J., Wang, H. & Barry, J. D. Mosaic VSGs and the scale ofTrypanosoma brucei antigenic variation. PLoS Pathog. 9, e1003502 (2013).
16. Nantulya, V. M., Musoke, A. J. & Moloo, S. K. Apparent exhaustion of thevariable antigen repertoires of Trypanosoma vivax in infected cattle. Infect.Immun. 54, 444–447 (1986).
17. Barry, J. D. Antigenic variation during Trypanosoma vivax infections ofdifferent host species. Parasitology 92, 51–65 (1986).
18. Dar, F. K., Paris, J. & Wilson, A. J. Serological studies on trypanosomiasis inEast Africa: IV: comparison of antigenic types of Trypanosoma vivax grouporganisms. Ann. Trop. Med. Parasitol. 67, 319–329 (1973).
19. Murray, A. K. & Clarkson, M. J. Characterization of stocks of Trypanosomavivax. II. Immunological studies. Ann. Trop. Med. Parasitol. 76, 283–292(1982).
20. Silva Pereira, S. et al. Variant antigen repertoires in Trypanosoma congolensepopulations and experimental infections can be profiled from deep sequencedata with a set of universal protein motifs. Genome Res. 28, 1383–1394 (2018).
21. Kumar, S., Stecher, G. & Tamura, K. MEGA7: molecular evolutionary geneticsanalysis version 7.0 for bigger datasets. Mol. Biol. Evol. 33, 1870–1874 (2016).
22. Hutchinson, O. C. et al. Variant surface glycoprotein gene repertoires inTrypanosoma brucei have diverged to become strain-specific. BMC Genomics8, 234 (2007).
23. Bruen, T. C., Philippe, H. & Bryant, D. A simple and robust statistical test fordetecting the presence of recombination. Genetics 172, 2665–2681 (2006).
24. Cadioli, F. A. et al. First report of Trypanosoma vivax outbreak in dairy cattlein São Paulo state, Brazil. Rev. Bras. Parasitol. Vet., Jaboticabal 21, 118–124(2012).
25. Mugnier, M. R., Cross, G. A. M. & Papavasiliou, F. N. The in vivo dynamics ofantigenic variation in Trypanosoma brucei. Science 347, 1470–1473 (2015).
26. Jayaraman, S. et al. Application of long read sequencing to determineexpressed antigen diversity in Trypanosoma brucei infections. PLoS Negl.Trop. Dis. 13, e0007262 (2019).
27. Marcello, L. & Barry, J. D. Analysis of the VSG gene silent archive inTrypanosoma brucei reveals that mosaic gene expression is prominent inantigenic variation and is favored by archive substructure. Genome Res. 17,1344–1352 (2007).
28. Altschul, S. F., Gish, W., Miller, W., Myers, E. W. & Lipman, D. J. Basic localalignment search tool. J. Mol. Biol. 215, 403–410 (1990).
29. Berriman, M. et al. The genome of the African trypanosome Trypanosomabrucei. Science 309, 416–422 (2005).
30. Kosakovsky Pond, S. L., Posada, D., Gravenor, M. B., Woelk, C. H. & Frost, S.D. W. GARD: a genetic algorithm for recombination detection. Bioinformatics22, 3096–3098 (2006).
31. Dar, F. K., Paris, J. & Wilson, A. J. Serological studies on trypanosomiasis inEast Africa. Ann. Trop. Med. Parasitol. 67, 319–329 (1973).
32. Liu, D., Albergante, L., Newman, T. J. & Horn, D. Faster growth with shorterantigens can explain a VSG hierarchy during African trypanosome infections:a feint attack by parasites. Sci. Rep. 8, 10922 (2018).
33. Berriman, M. et al. The architecture of variant surface glycoprotein geneexpression sites in Trypanosoma brucei.Mol. Biochem. Parasitol. 122, 131–140(2002).
34. Becker, M. et al. Isolation of the repertoire of VSG expression site containingtelomeres of Trypanosoma brucei 427 using transformation-associatedrecombination in yeast. Genome Res. 14, 2319–2329 (2004).
35. Hertz-Fowler, C. et al. Telomeric expression sites are highly conserved inTrypanosoma brucei. PLoS ONE 3, e3527 (2008).
36. Majiwa, P. A. O., Young, J. R., Englund, P. T., Shapiro, S. Z. & Williams, R. O.Two distinct forms of surface antigen gene rearrangement in Trypanosomabrucei. Nature 297, 514–516 (1982).
37. Young, J. R. et al. Analysis of genomic rearrangements associated with twovariable antigen genes in Trypanosoma brucei. Nucleic Acids Res. 10, 803–819(1982).
38. Young, J. R., Miller, N., Williams, R. O. & Turner, M. J. Are there two classesof VSG gene in Trypanosoma brucei? Nature 306, 196–198 (1983).
39. Morrison, L. J., Marcello, L. & McCulloch, R. Antigenic variation in theAfrican trypanosome: molecular mechanisms and phenotypic complexity.Cell. Microbiol. 11, 1724–1734 (2009).
40. Boothroyd, C. E. et al. A yeast-endonuclease-generated DNA break inducesantigenic switching in Trypanosoma brucei. Nature 459, 278–281 (2009).
41. Glover, L., Alsford, S. & Horn, D. DNA break site at fragile subtelomeresdetermines probability and mechanism of antigenic variation in Africantrypanosomes. PLoS Pathog. 9, e1003260 (2013).
42. King, A. A., Shrestha, S., Harvill, E. T. & Bjørnstad, O. N. Evolution of acuteinfections and the invasion‐persistence trade‐off. Am. Nat. 173, 446–455(2009).
43. Alizon, S., Hurford, A., Mideo, N. & van Baalen, M. Virulence evolution andthe trade-off hypothesis: history, current state of affairs and the future. J. Evol.Biol. 22, 245–259 (2009).
44. Sekoni, V. O., Saror, D. I., Njoku, C. O., Kumi-Diaka, J. & Opaluwa, G. I.Comparative haematological changes following Trypanosoma vivax and T.congolense infections in Zebu bulls. Vet. Parasitol. 35, 11–19 (1990).
45. Mattioli, R. C., Faye, J. A. & Büscher, P. Susceptibility of N’Dama cattle toexperimental challenge and cross-species superchallenges with bloodstreamforms of Trypanosoma congolense and T. vivax. Vet. Parasitol. 86, 83–94(1999).
46. Gardiner, P. R., Assoku, R. K. G., Whitelaw, D. D. & Murray, M.Haemorrhagic lesions resulting from Trypanosoma vivax infection in ayrshirecattle. Vet. Parasitol. 31, 187–197 (1989).
47. Williams, D. J. L., Logan-Henfrey, L. L., Authié, E., Seely, C. & Mcodimba, F.Experimental infection with a haemorrhage‐causing Trypanosoma vivax inN’Dama and Boran cattle. Scand. J. Immunol. 36, 34–36 (1992).
48. Rurangirwa, F. R., Musoke, A. J., Nantulya, V. M. & Tabel, H. Immunedepression in bovine trypanosomiasis: effects of acute and chronicTrypanosoma congolense and chronic Trypanosoma vivax infections onantibody response to Brucella abortus vaccine. Parasite Immunol. 5, 267–276(1983).
49. Maikaje, D. B., Sannusi, A., Kyewalabye, E. K. & Saror, D. I. The course ofexperimental Trypanosoma vivax infection in Uda sheep. Vet. Parasitol. 38,267–274 (1991).
50. Fidelis, O. L. Jr et al. Evaluation of clinical signs, parasitemia, hematologic andbiochemical changes in cattle experimentally infected with Trypanosomavivax. Braz. J. Vet. Parasitol. 2961, 69–81 (2016).
51. Parra-Gimenez, N. & Reyna-Bello, A. Parasitological, hematological, andimmunological response of experimentally infected sheep with Venezuelanisolates of Trypanosoma evansi, Trypanosoma equiperdum, and Trypanosomavivax. J. Parasitol. Res. 2019, 8528430 (2019).
52. Batista, J. S. et al. Infection by Trypanosoma vivax in goats and sheep in theBrazilian semiarid region: from acute disease outbreak to chronic crypticinfection. Vet. Parasitol. 165, 131–135 (2009).
53. Barry, J. D. in African Trypanosomiasis in Vaccination Strategies of TropicalDiseases (ed. Liew, F. Y.) 217 (CRC Press, 1989).
54. Paiva, F. et al. Trypanosoma vivax em bovinos no Pantanal do Estado DoMato Grosso Do Sul, Brasil: I—Acompanhamento Clínico. Rev. Bras.Parasitol. Veterinária 9, 135–141 (2000).
55. Silva, T. M. F. et al. Pathogenesis of reproductive failure induced byTrypanosoma vivax in experimentally infected pregnant ewes. Vet. Res. 44,1–9 (2013).
56. Hamilton, P. B., Adams, E. R., Malele, I. I. & Gibson, W. C. A novel, high-throughput technique for species identification reveals a new species of tsetse-transmitted trypanosome related to the Trypanosoma brucei subgenus,Trypanozoon. Infect. Genet. Evol. 8, 26–33 (2008).
57. Zerbino, D. R. & Birney, E. Velvet: algorithms for de novo short read assemblyusing de Bruijn graphs. Genome Res. 18, 821–829 (2008).
58. Rogers, M. B. et al. Chromosome and gene copy number variation allow majorstructural change between species and strains of Leishmania. Genome Res. 21,2129–2142 (2011).
59. Tihon, E., Imamura, H., Dujardin, J. C. & Van Den Abbeele, J. Evidence forviable and stable triploid Trypanosoma congolense parasites. Parasites Vectors10, 1–8 (2017).
60. Emms, D. M. & Kelly, S. OrthoFinder: solving fundamental biases in wholegenome comparisons dramatically improves orthogroup inference accuracy.Genome Biol. 16, 157 (2015).
61. Larkin, M. A. et al. Clustal W and Clustal X version 2.0. Bioinformatics 23,2947–2948 (2007).
62. Langmead, B. & Salzberg, S. L. Fast gapped-read alignment with Bowtie 2. Nat.Methods 9, 357–359 (2012).
63. Ward, J. H. Hierarchical grouping to optimize an objective function. J. Am.Stat. Assoc. 58, 236–244 (1963).
64. Li, H. Aligning sequence reads, clone sequences and assembly contigs withBWA-MEM. Preprint at https://arxiv.org/abs/1303.3997 (2013).
65. Li, H. et al. The Sequence Alignment/Map format and SAMtools.Bioinformatics 25, 2078–2079 (2009).
66. Van der Auwera, G. A. et al. From fastQ data to high-confidence variant calls:The genome analysis toolkit best practices pipeline. Curr. Protoc. Bioinforma.43, 1–33 (2013). 11.10.
67. Danecek, P. et al. The variant call format and VCFtools. Bioinformatics 27,2156–2158 (2011).
68. Guindon, S. et al. New algorithms and methods to estimate maximum-likelihood phylogenies: assessing the performance of PhyML 3.0. Syst. Biol. 59,307–321 (2010).
69. Lefort, V., Longueville, J.-E. & Gascuel, O. SMS: Smart Model Selection inPhyML. Mol. Biol. Evol. 34, 2422–2424 (2017).
70. Brener, Z. Contribuição ao estudo da terapêutica experimental da doença deChagas (Universidade Federal de Minas Gerais, Belo Horizonte, 1961).
71. Cuypers, B. et al. Multiplexed Spliced-Leader Sequencing: A high-throughput,selective method for RNA-seq in Trypanosomatids. Sci. Rep. 7, 1–11(2017).
72. González-Andrade, P. et al. Diagnosis of trypanosomatid infections: Targetingthe spliced leader RNA. J. Mol. Diagnostics 16, 400–404 (2014).
73. Grabherr, M. G. et al. Full-length transcriptome assembly from RNA-Seq datawithout a reference genome. Nat. Biotechnol. 29, 644–652 (2011).
74. Bray, N. L., Pimentel, H., Melsted, P. & Pachter, L. Near-optimal probabilisticRNA-seq quantification. Nat. Biotechnol. 34, 525–527 (2016).
75. Robinson, M. D. & Oshlack, A. A scaling normalization method fordifferential expression analysis of RNA-seq data. Genome Biol. 11, R25 (2010).
76. Sistrom, M. et al. Comparative genomics reveals multiple genetic backgroundsof human pathogenicity in the Trypanosoma brucei complex. Genome Biol.Evol. 6, 2811–2819 (2014).
77. Weir, W. et al. Population genomics reveals the origin and asexual evolutionof human infective trypanosomes. Elife 5, e11473 (2016).
78. Arenas, M. & Posada, D. Coalescent simulation of intracodon recombination.Genetics 184, 429–437 (2010).
79. Edgar, R. C. MUSCLE: multiple sequence alignment with high accuracy andhigh throughput. Nucleic Acids Res. 32, 1792–1797 (2004).
80. Quinlan, A. R. & Hall, I. M. BEDTools: a flexible suite of utilities forcomparing genomic features. Bioinformatics 26, 841–842 (2010).
81. O’Fallon, B. D. ACG: rapid inference of population history from recombiningnucleotide sequences. BMC Bioinforma. 14, 40 (2013).
82. Milne, I. et al. TOPALi v2: a rich graphical interface for evolutionary analysesof multiple alignments on HPC clusters and multi-core desktops.Bioinformatics 25, 126–127 (2009).
AcknowledgementsThis work was supported by grants from the Biotechnology and Biological SciencesResearch Council (BB/M022811/1 and BB/R021139/1), an International VeterinaryVaccinology Network (IVVN) pump-priming award, a Bill and Melinda Gates Foun-dation Grand Challenges Explorations award (Round 11), and the Wellcome Trust(WT206815/Z/17/Z).
Author contributionsConceived and designed the experiments: S.S.P., A.P.J. Performed the experiments: S.S.P.,H.N., M.O., K.J.G.d.A.C.N. Analysed the data: S.S.P., C.W.D., P.R., A.P.J. Contributedreagents/materials/analysis tools: M.R.A., Z.B., S.K., R.Z.M., M.M.G.T., A.P.J. Wrote thepaper: S.S.P., A.P.J. Obtained funding: S.S.P., M.M.G.T., R.Z.M., A.P.J.
Competing interestsThe authors declare no competing interests.
Additional informationSupplementary information is available for this paper at https://doi.org/10.1038/s41467-020-14575-8.
Correspondence and requests for materials should be addressed to A.P.J.
Peer review information Nature Communications thanks Frederik Van den Broeck andthe other, anonymous, reviewer(s) for their contribution to the peer review of this work.Peer reviewer reports are available.
Reprints and permission information is available at http://www.nature.com/reprints
Publisher’s note Springer Nature remains neutral with regard to jurisdictional claims inpublished maps and institutional affiliations.
Open Access This article is licensed under a Creative CommonsAttribution 4.0 International License, which permits use, sharing,
adaptation, distribution and reproduction in any medium or format, as long as you giveappropriate credit to the original author(s) and the source, provide a link to the CreativeCommons license, and indicate if changes were made. The images or other third partymaterial in this article are included in the article’s Creative Commons license, unlessindicated otherwise in a credit line to the material. If material is not included in thearticle’s Creative Commons license and your intended use is not permitted by statutoryregulation or exceeds the permitted use, you will need to obtain permission directly fromthe copyright holder. To view a copy of this license, visit http://creativecommons.org/licenses/by/4.0/.


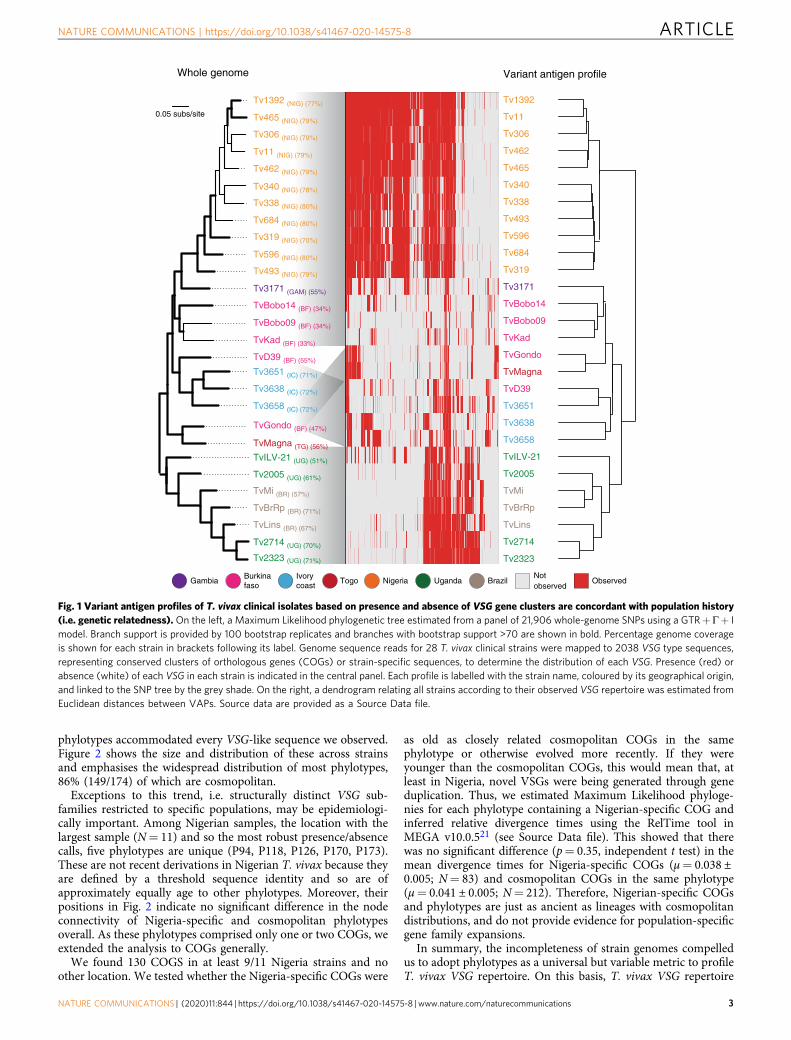
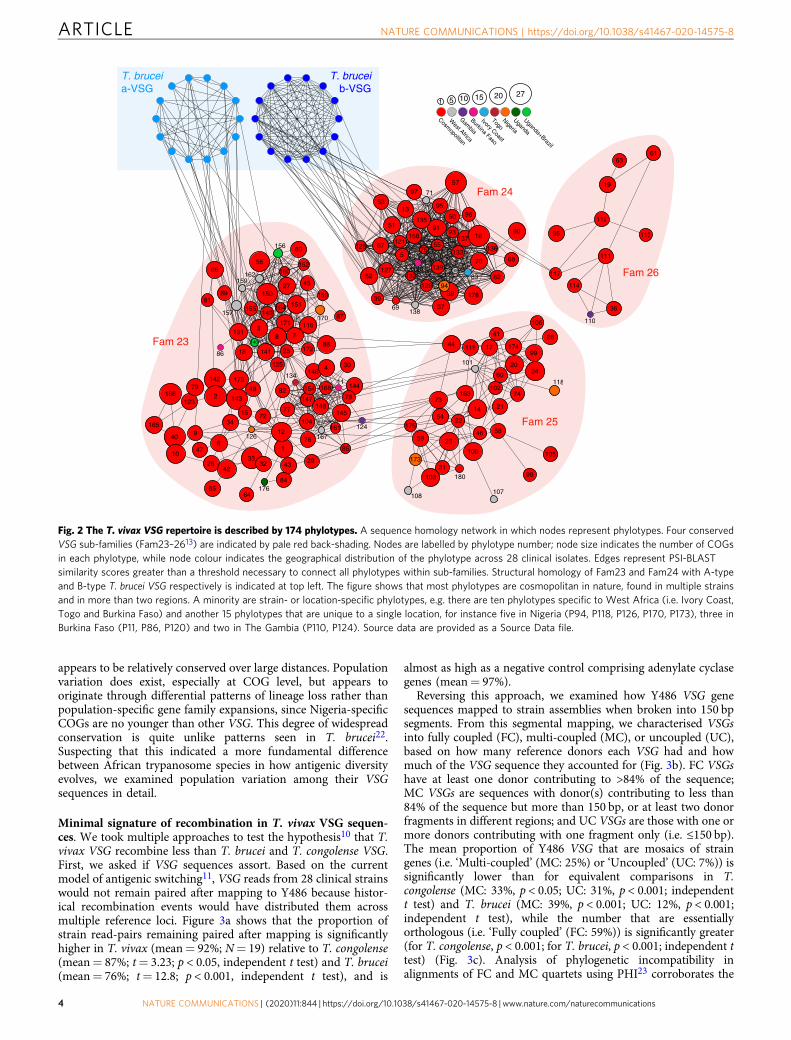


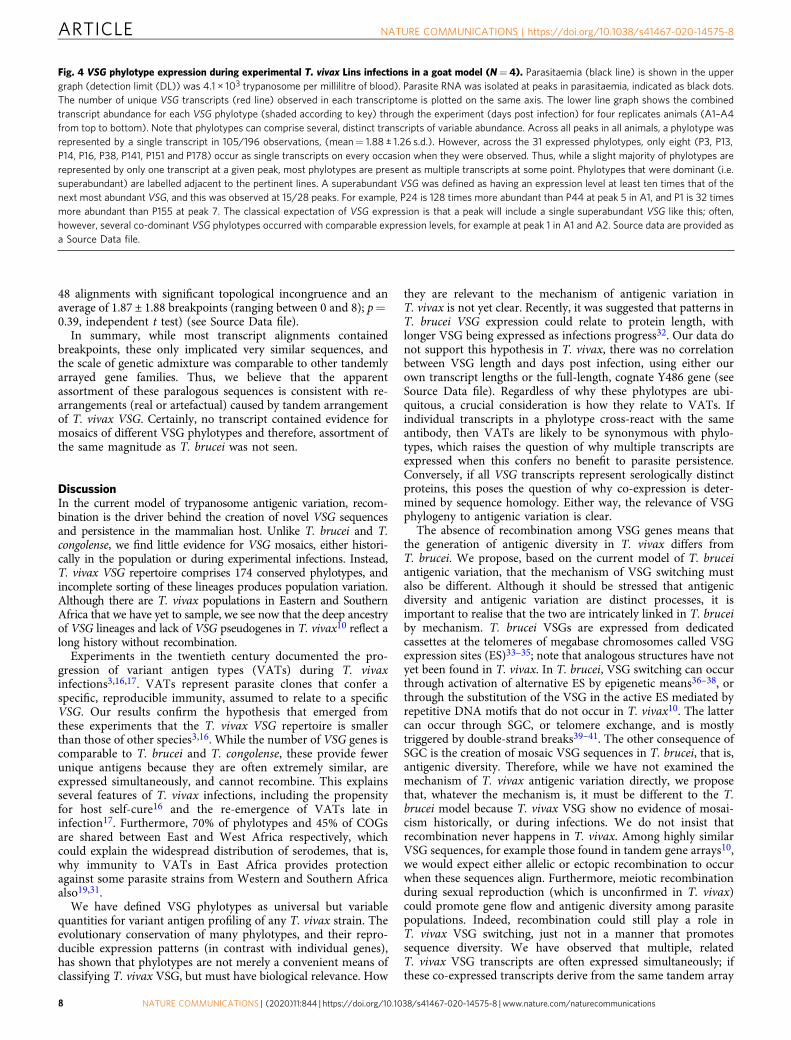
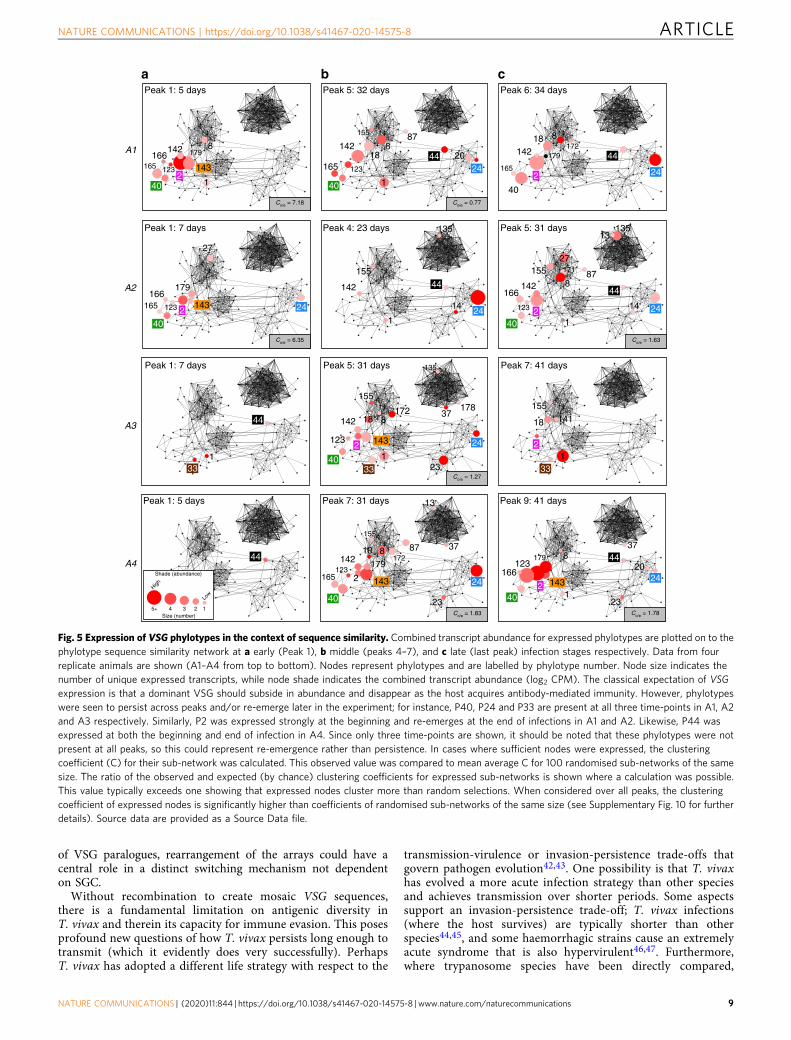

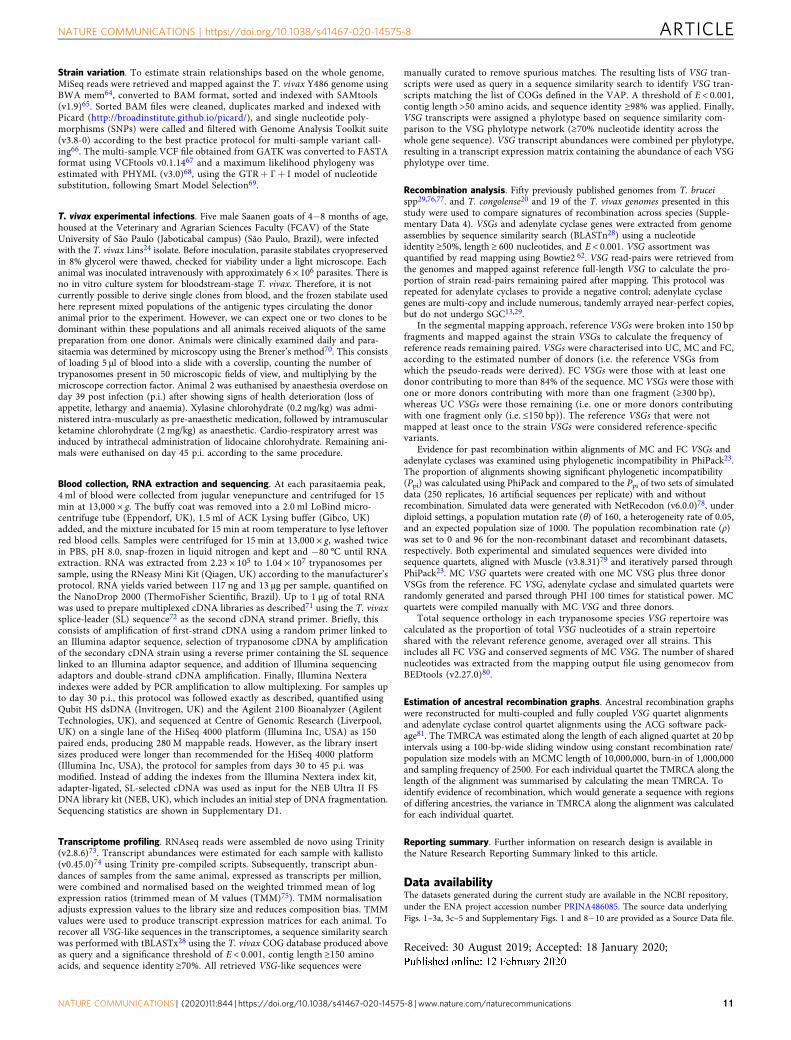
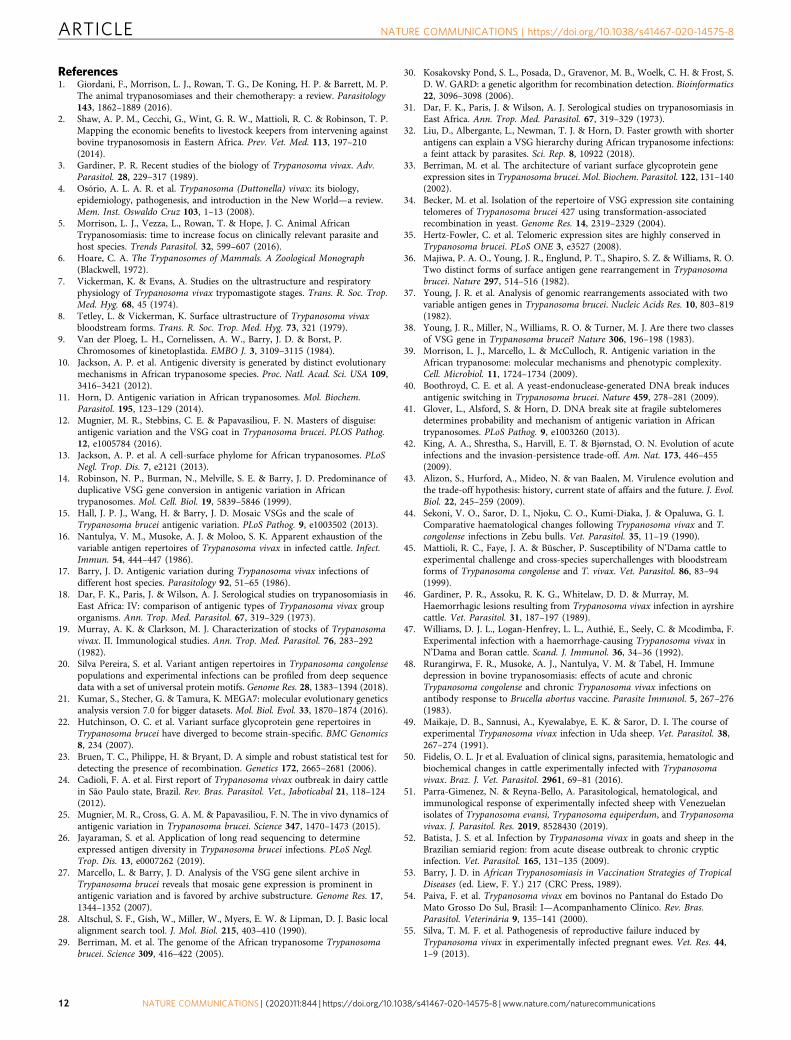
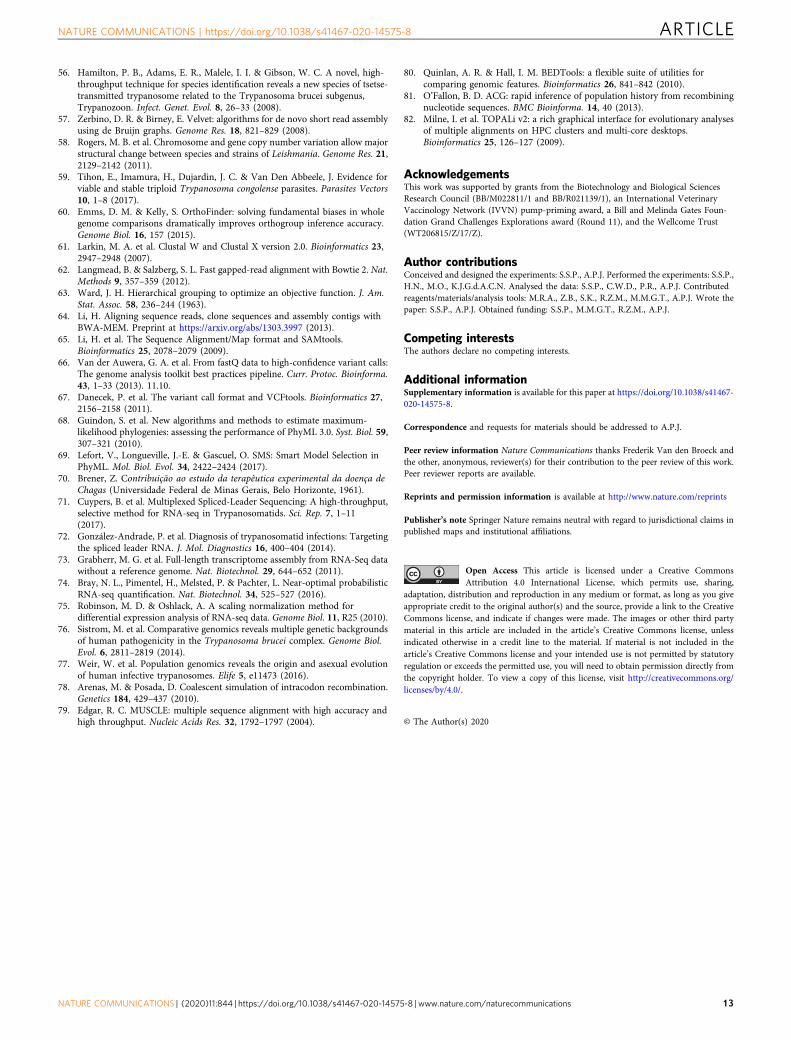


![Molecular and antigenic characterization of Trypanosoma ... … · flagellar pocket [8]. In 1990, a novel type of T. cruzi trypomastigote antigen was identified [9]. This antigen](https://static.documents.pub/doc/80x56/605bbbfcee219321641b708a/molecular-and-antigenic-characterization-of-trypanosoma-flagellar-pocket.jpg)

![PvRON2, a new Plasmodium vivax rhoptry neck · Apical merozoite antigen 1 (AMA-1) is derived from micronemes and is essential in invasion of mostApi-complexa studied so far [16,17].](https://static.documents.pub/doc/80x56/60422231fac898167e74887e/pvron2-a-new-plasmodium-vivax-rhoptry-neck-apical-merozoite-antigen-1-ama-1-is.jpg)


