Variation and correlation patterns in the dentition ofthe red fox from Poland
Elwira Szuma
Szuma, E., Mammal Research Institute Polish Academy of Sciences, ul. A. Waszkiewicza1, PL-17-230 Bialowieza, Poland
Received 13 December 1999, accepted 13 April 2000
Szuma, E. 2000: Variation and correlation patterns in the dentition of the red fox fromPoland. — Ann. Zool. Fennici 37: 113–127.
Analysis of variation in tooth size in a population of red fox, Vulpes vulpes (Linnaeus,1758) from Poland based on three indices (coefficient of variation CV, variation indexVSD, residual standard deviation RSD) and its correlation with average tooth size re-vealed two contradictory patterns. The CV and VSD were significantly correlated withaverage tooth sizes, while RSD values was independent. It was, therefore, concluded thatRSD is the most reliable index for assessing population variation. The least variableposition in the red fox dentition are M1 and M1, whereas the most variable is M3. Thestrongest sexual dimorphism in tooth size in Polish red foxes is observed in the canines.The strongest between-tooth correlations were in the premolar region. Moreover, astrong correlation in both tooth length and tooth width was found between oppositecanines. Both functional and developmental factors determine patterns of morphologi-cal variation in the dentition.
1. Introduction
Variation in mammalian dental characters haspreviously been analyzed using the coefficient ofvariation CV, where CV = SD × 100/M (e.g. VanValen 1962, Yablokov 1974, Gould & Garwood1969, Gingerich 1974, Gingerich & Schoeninger1979, Gingerich & Winkler 1979, Pengilly 1984).Often a negative correlation between a tooth sizeand its coefficient of variation have been observed,usually explained by the influence of factors suchas functional integration or developmental fields.Polly (1998) showed that the negative correlation
may in fact be an artefact of the CV metric ratherthan a biological phenomenon. The author pro-posed alternative methods for assessing variation.Polly (1998) suggests that when comparing traitsof significantly different sizes, assessment of dif-ferences in trait variation cannot be base solelyon a single method. The traditional coefficient ofvariation CV and two other measures of variabil-ity proposed by Polly (1998) were used in thisstudy to analyze dental variation patterns in thered fox from Poland.
Gingerich and Winkler (1979) and Pengilly(1984) in their studies of dental variation in red
Szuma • ANN. ZOOL. FENNICI Vol. 37114
foxes showed that the most variable teeth are lo-cated at the boundaries of morphogenetic fields,whereas the least variable teeth (carnassials) arelocated more centrally. According to Gingerichand Winkler (1979), the pattern of dental varia-tion reflects functional integration. Contrary tothat, on the grounds of a statistically significantnegative relationship between the CV and meantooth size, Pengilly (1984) ascertained that thevariation pattern was a direct consequence of adevelopmental process. Correlation patterns ob-served in two different red fox populations (Kurtén1953, Gingerich & Winkler 1979) did not con-firm the pattern of integration expected from thepattern of variation in this predator. The strongestcorrelations observed within the dentition werebetween non-occluding premolars rather thanfunctionally integrated molars (Kurtén 1953, Gin-gerich & Winkler 1979).
In red foxes from Finland and Kökar Island,statistically significant r correlations were ob-served between teeth in the carnassial region (Kur-tén 1953). The partial correlations of traits in thesame region were only weakly correlated in foxesfrom the Upper Peninsula of Michigan (Gingerich& Winkler 1979). In Pengilly’s opinion (1984)neither variation nor morphological integration arethe direct result of functional integration, but ratherthe manifestation of developmental factors.
The aim of the present study was: (1) to deter-mine patterns of dental variation and correlationin red foxes from Poland, and (2) to determinethe factors responsible for those patterns.
2. Material and methods
In this study, the permanent dentitions of 1 453specimens of the red fox Vulpes vulpes (Linnaeus,1758) from Poland were examined. The sampleincluded 637 males, 535 females, and 281 indi-viduals of unknown sex. The red fox skulls arehoused in the collections of the Mammal ResearchInstitute of the Polish Academy of Sciences inBialowieza (MRI, 959 individuals) and the Insti-tute of the Systematics and Evolution of Animalsof the Polish Academy of Sciences in Cracow(ISEA, 494 individuals). Differences between to-tal number of individuals and the number reportedin tables and figures are due to various instances
of skulls damage, missing teeth, or heavy wear.
2.1. Measurements
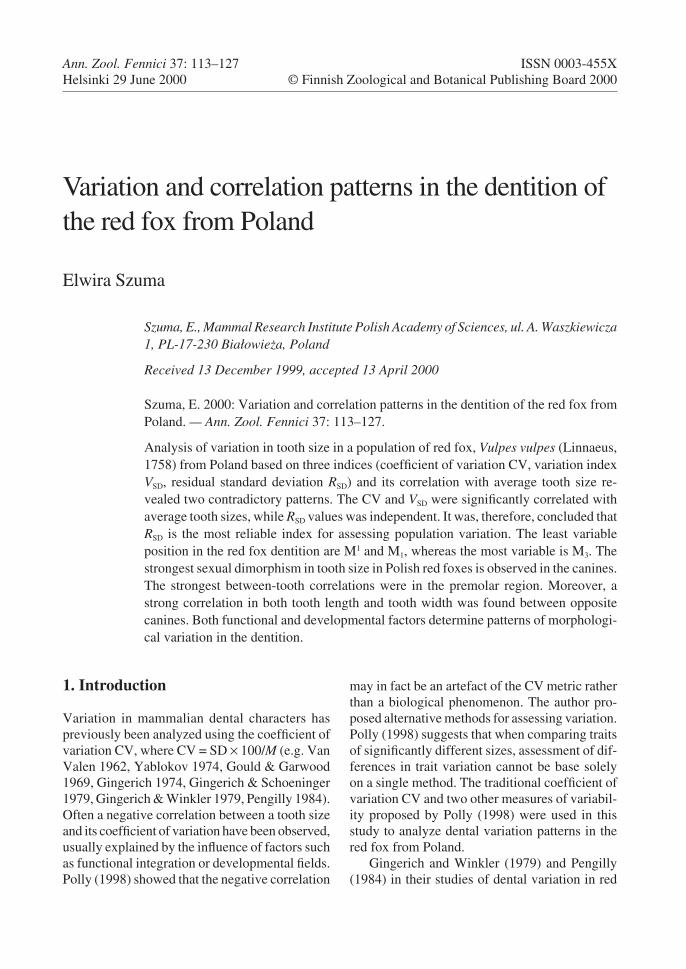
Teeth were measured with a Sylvac digital calli-per and to the nearest 0.05 mm. The upper andlower teeth of both the left and right sides weremeasured (91 measurements were taken on eachspecimen). The length and width of each toothand the heights of the canines were measured asfollows (Fig. 1):
LI1, LI2, LI3, LI1, LI2, LI3 — length of the crownof I1, I2, I3, I1, I2, I3: the greatest mesio-distaldistance on the tooth crown;
WI1, WI2, WI3, WI1, WI2, WI3 — width of thecrown of I1, I2, I3, I1, I2, I3: the greatest labio-lingual distance on the tooth crown;
LC1, LC1 — length of the crown of C1, C1: thegreatest mesio-distal distance at the base ofthe tooth crown;
WC1, WC1 — width of the crown of C1, C1: thegreatest labio-lingual distance at the base ofthe tooth crown;
HC1, HC1 — height of the crown of C1, C1: thegreatest distance between the occlusal tip andthe distalmost (i.e., posterior-most) point ofthe base of the tooth crown;
LP1, LP2, LP3, LP1, LP2, LP3, LP4 — length of thecrown of P1, P2, P3, P1, P2, P3, P4: the greatestlength between the anterior and posterior(mesial and distal) points of the tooth crown;
WP1, WP2, WP3, WP1, WP2, WP3, WP4 — widthof the crown of P1, P2, P3, P1, P2, P3, P4: thegreatest width between the lingual and buccalpoints of the tooth crown;
LP4b — buccal length of the crown of P4: thegreatest length between the anteriormost pointof the antero-buccal lobe of the tooth crownand the distalmost point;
LP4l — lingual length of the crown of P4: thegreatest length between the anteriormost pointof the antero-lingual lobe of the tooth crownand the distalmost point;
WP4 — width of the crown of P4: the greatestdistance between the lingual and buccal pointsof the tooth crown measured perpendicular toLP4b;
LM1, LM2, LM1, LM2, LM3 — length of the crown
ANN. ZOOL. FENNICI Vol. 37 • Variability patterns in the red fox dentition 115
of M1, M2, M1, M2, M3: the greatest distancebetween the anterior and posterior (mesial anddistal) points of the tooth crown;
WM1, WM2, WM1, WM2, WM3 — width of thecrown of M1, M2, M1, M2, M3: the greatestdistance between the lingual and buccal pointsof the tooth crown;
CB — condylobasal length of the skull: thegreatest distance between the line connectingthe most distal points of the occipital condylesand the line connecting the anteriormost pointsof the premaxillary bones.
2.2. Statistical methods
Statistical analyses of the data were performedwith Statgraphics (ver. 5.0) and Systat (ver. 5.0).The following tests were done: descriptive statis-tics, t-test, Duncan test, multifactorial analysis ofvariance (MANOVA), simple regression analy-sis, residual regression and the Pearson coefficientof correlation.
Descriptive statistics (arithmetic mean andstandard deviation) and the analysis of variancewere done using only measurements from the right
Fig. 1. The methods ofmeasurements executionillustrate the following dia-grams: the anterior part ofthe upper dental arch inlateral view (a), the upperdental arch in occlusalview (b), the anterior partof the lower tooth row inlateral view (c), the lowerdental arch in occlusalview (d), and ventral viewof the skull (e).
Szuma • ANN. ZOOL. FENNICI Vol. 37116
side of the dentition. In order to fully assess pat-terns of variation, three different indices were usedfollowing Polly (1998) — the coefficient of vari-ation CV, the standard deviation of log trans-formed variables, and the residual standard de-viation.
Occlusal surface variation was compared withthe natural log of the product of length times widthof each tooth (ln (L × W)). The coefficient of vari-ation was estimated from the standard deviationof this metric (Lewontin 1966).
The relationships between mean tooth size andtooth variability and between variability and tootheruption sequence were analysed using linear re-gression. The eruption sequence of permanentteeth determined by Linhart (1968) was used inthe latter.
The following multivariate analyses were usedto study patterns of correlation in the dentition:correlation between tooth lengths in the upper andin the lower tooth rows, correlation between toothwidths in the upper and in the lower tooth rows,correlation between tooth lengths from oppositetooth rows, correlation between tooth widths fromopposite tooth rows. The correlation between allvariables and condylobasal skull length was alsostudied.
2.3. Abbreviations
CV = coefficient of variationF = the square root of the t statisticsM = the arithmetic meanMm/Mf = coefficient of dimorphism (division of
the arithmetic mean for males by thehomologous mean for females)
r = Pearson’s correlation coefficientr2 = coefficient of determination (square root
of r)RSD = residual standard deviation (the residual
value for each variable after the standarddeviation is regressed onto mean)
VSD = variation index (the product of SD × 100on log transformed data)
3. Results
3.1. Variation in tooth measurements
The CV for tooth measurements in red foxes fromPoland ranged from 4.7 (LP4l) to 11.1 (LM3). Theteeth with the lowest CV for both length and widthwere M1 and M1, whereas with the highest, M3
(Table 1). The distribution of CV for the crown
Fig. 2. Distribution of the coefficient of variability CV for tooth length, width and occlusal surface in the upper (a)and lower (b) dentition in the red fox (Vulpes vulpes) from Poland.
ANN. ZOOL. FENNICI Vol. 37 • Variability patterns in the red fox dentition 117
length and width measurement are presented inFig. 2.
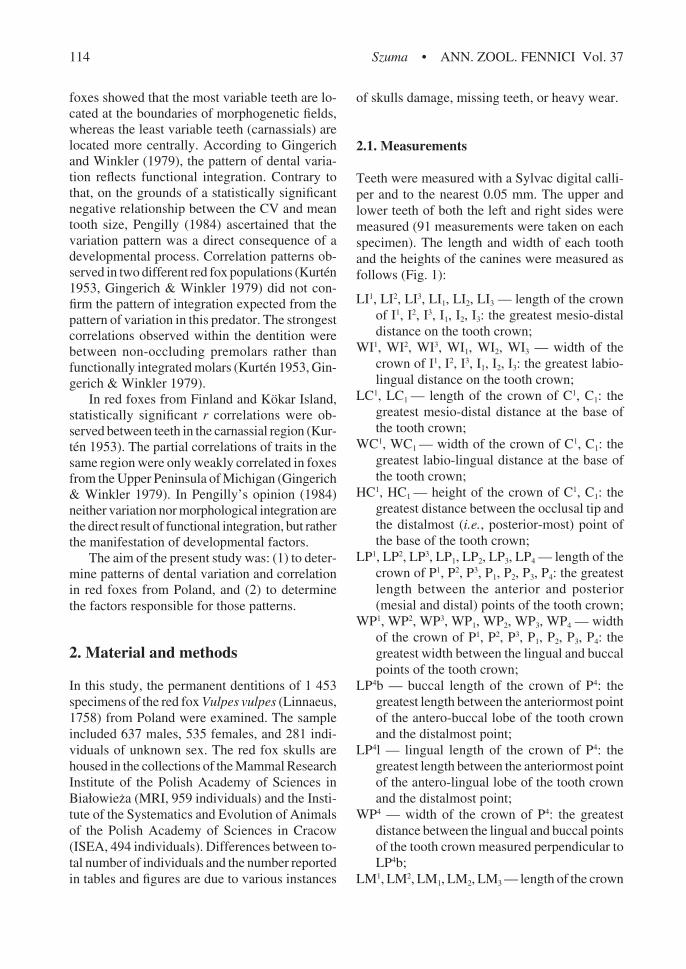
The CV for occlusal surfaces of maxillary teethranged from 9.2 (M1) to 14.6 (C1), while in man-dibular teeth it ranged from 9.6 (M1) to 18.9 (M3)(Fig. 2). The pattern of variation indicated by VSD
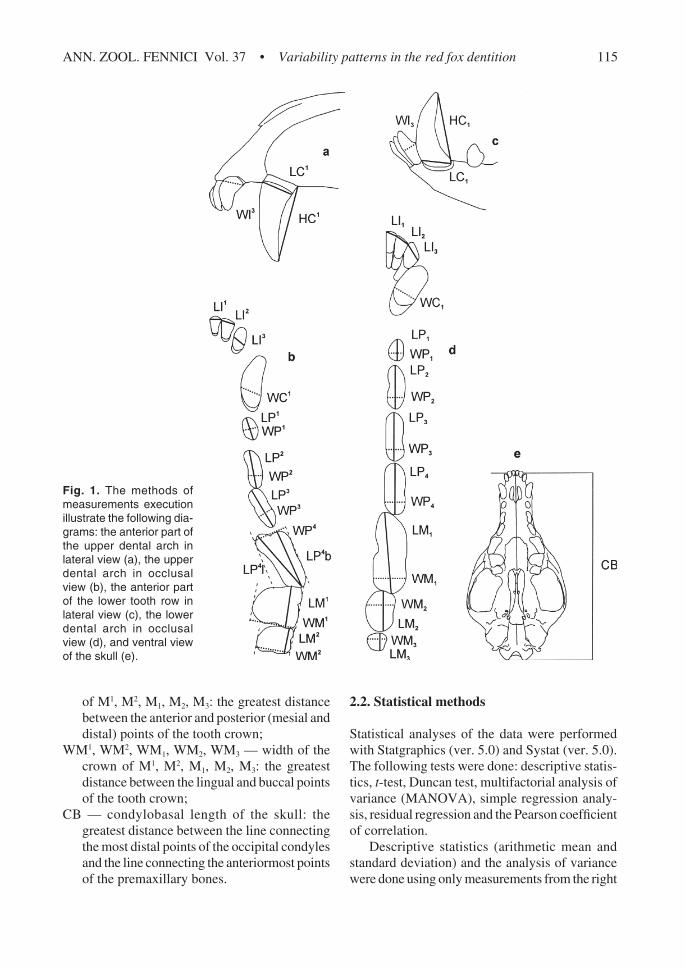
was almost identical (Figs. 2 and 3).The pattern of variation indicated by RSD was
quite different (Fig. 4). Among crown lengths inthe upper dentition, C1 showed the greatest varia-tion and M1
the lowest. The main differences inthe patterns shown by RSD versus CV and VSD werein the incisor and premolar regions. According tothe later two indices, the incisor region was morevariable than the premolar one, but the residualSD analysis indicated that the premolar region wasmore variable.
Residual SD for tooth lengths in the mandibleranged from –0.114 (M1) to 0.138 (M3). A veryhigh value of RSD was also found for LC1 (0.121).
In crown widths, the residual SD analysis alsorevealed a different pattern of variation than dideither CV or VSD. WP4 had the highest variationand WM1 the lowest. Comparatively high valueswere also found for WC1 and WP1, whereas thewidth of incisors was relatively low (ranging from0.020 to –0.049). The range of RSD values for toothwidths in the mandible was –0.043 (P1) to 0.058(M3). According to this index, there were twopoints of heightened variability with the other two,WC1 and WP4 (if the hyper-variable WM3 is ex-cluded).
A regression of CV on the mean character sizeshowed a significant inverse relationship (r2 = 0.30,F = 18.17, p < 0.001; Fig. 5). A regression of VSD
on M for log transformed data also showed asignificant inverse correlation (r2 = 0.28; F =16.83, p < 0.001). RSD was necessarily uncorrelatedwith M since it is the residual of the regression onM (r2 = 7.11 × 10⁻⁸, F = 0.3 × 10⁻⁵, p > 0.05; Fig. 6).
There was a linear relationship between thetooth eruption time and CV for the occlusal sur-face, which is described by the equation y = 0.44x+ 4.34 (r2 = 0.31, F = 8.62, p < 0.001; Fig. 7). Aregression of VSD of tooth lengths onto the erup-tion time did not indicate a correlation, howevery = 0.16x + 3.72, r2 = 0.07, F = 1.53, p > 0.05.Residual SDs for tooth lengths were also not cor-
related with the eruption sequence (r2 = 0.14, F =3.0, p > 0.05; Fig. 8).
3.2. Sexual dimorphism
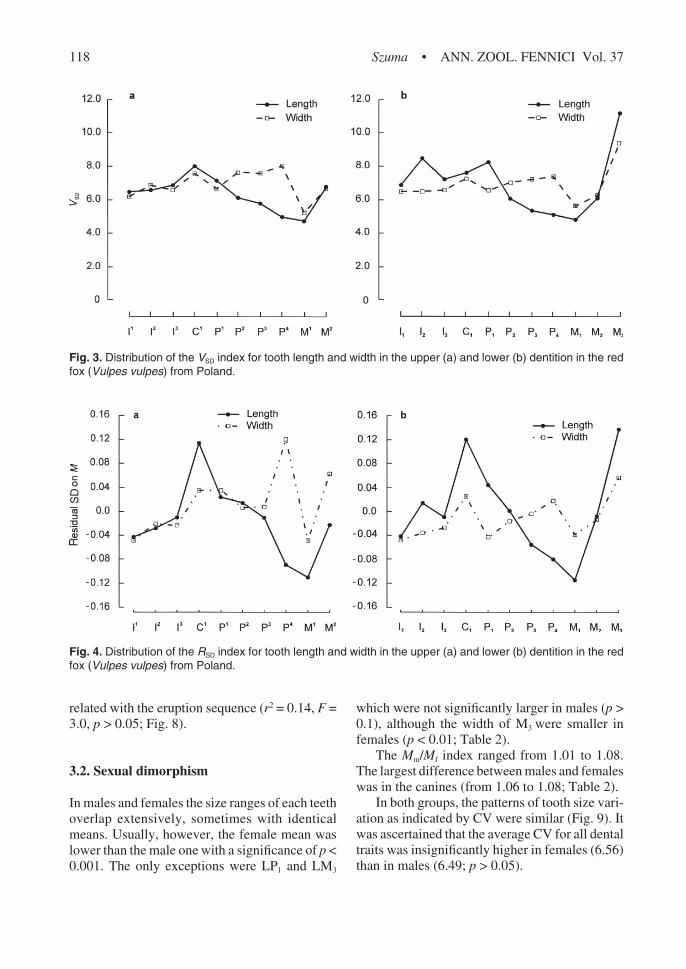
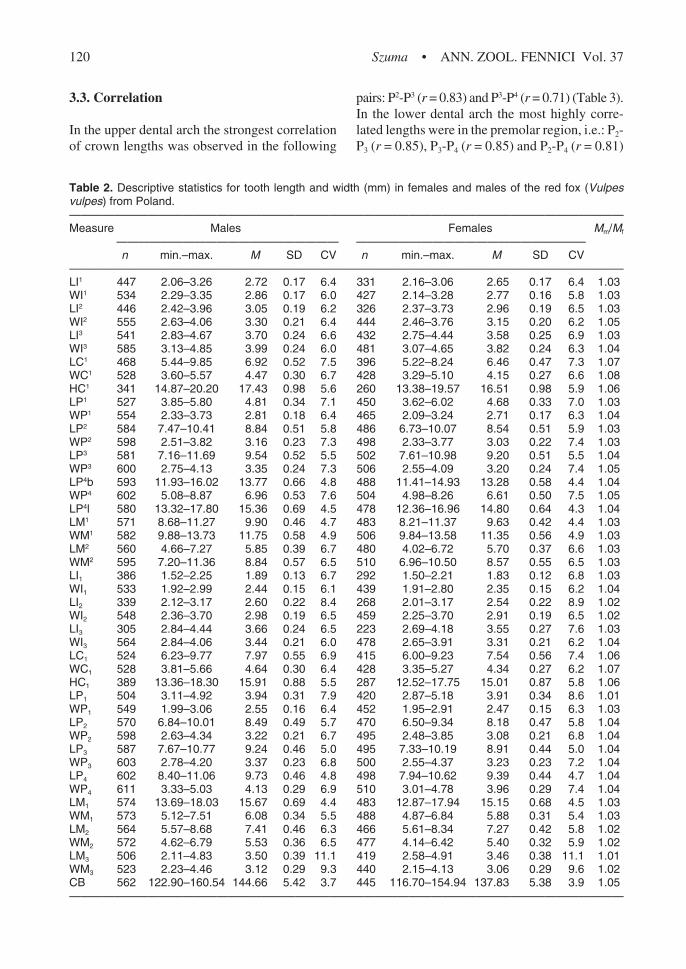
In males and females the size ranges of each teethoverlap extensively, sometimes with identicalmeans. Usually, however, the female mean waslower than the male one with a significance of p <0.001. The only exceptions were LP1 and LM3
which were not significantly larger in males (p >0.1), although the width of M3 were smaller infemales (p < 0.01; Table 2).
The Mm/Mf index ranged from 1.01 to 1.08.The largest difference between males and femaleswas in the canines (from 1.06 to 1.08; Table 2).
In both groups, the patterns of tooth size vari-ation as indicated by CV were similar (Fig. 9). Itwas ascertained that the average CV for all dentaltraits was insignificantly higher in females (6.56)than in males (6.49; p > 0.05).
Fig. 3. Distribution of the VSD index for tooth length and width in the upper (a) and lower (b) dentition in the redfox (Vulpes vulpes) from Poland.
Fig. 4. Distribution of the RSD index for tooth length and width in the upper (a) and lower (b) dentition in the redfox (Vulpes vulpes) from Poland.
ANN. ZOOL. FENNICI Vol. 37 • Variability patterns in the red fox dentition 119
Fig. 5. Linear regression of the coefficient of variabil-ity (CV) on the mean tooth measurements (M) in thered fox (Vulpes vulpes) from Poland. Regression lineis described by the following equation: y = –0.16x +7.73. The broken lines indicate 99% and 95% confi-dence intervals.
Fig. 6. Linear regression of the residual SD (RSD) onthe mean tooth measurements (M) in the red fox (Vul-pes vulpes) from Poland. Regression line is describedby the following equation: y = –4.27 × 10⁻⁶x + 7.10 ×10⁻⁵. The broken lines indicate 99% and 95% confi-dence intervals.
Fig. 7. Linear regression of the coefficient of variabil-ity (CV) for occlusal crown surfaces (natural logarithmof the tooth length and width product) on the dentaleruption time in the red fox (Vulpes vulpes) from Po-land. Regression line is described by the followingequation: y = 0.44x + 4.34. The broken lines indicate99% and 95% confidence intervals.
Fig. 8. Linear regression of the residual SD (RSD) foraverages of tooth lengths on the dental eruption timein the red fox (Vulpes vulpes) from Poland. Regres-sion line is described by the following equation: y =0.01x – 0.19. The broken lines indicate 99% and 95%confidence intervals.
Szuma • ANN. ZOOL. FENNICI Vol. 37120
3.3. Correlation
In the upper dental arch the strongest correlationof crown lengths was observed in the following
pairs: P2-P3 (r = 0.83) and P3-P4 (r = 0.71) (Table 3).In the lower dental arch the most highly corre-lated lengths were in the premolar region, i.e.: P2-P3 (r = 0.85), P3-P4 (r = 0.85) and P2-P4 (r = 0.81)
Table 2. Descriptive statistics for tooth length and width (mm) in females and males of the red fox (Vulpesvulpes) from Poland.—————————————————————————————————————————————————Measure Males Females Mm/Mf
———————————————————— —————————————————————n min.–max. M SD CV n min.–max. M SD CV
ANN. ZOOL. FENNICI Vol. 37 • Variability patterns in the red fox dentition 121
Fig. 9. Distribution of the coefficient of variability CV for tooth lengths in the upper (a) and lower (b) dentition infemales and males of the red fox (Vulpes vulpes) from Poland.
(Table 3).In the maxillary tooth row the crown widths
were strongly correlated in pairs: P2-P3 (r = 0.85),I1-I2 (r = 0.78) and I2-I3 (r = 0.75) (Table 4). Thestrongest correlations between tooth widths in themandibular tooth row were: P2-P3 (r = 0.87), P3-P4 (r = 0.82), P2-P4 (r = 0.78), I1-I2 (r = 0.73) (Ta-ble 4).
The strongest relationships were observed inoccluding tooth pairs. Among those, the strong-est correlations of lengths were: P3-P3 (r = 0.85),P2-P2, P3-P2 (r = 0.82), P2-P3 (r = 0.81), P3-P4 (r =0.80), C1-C1, P4-M1 (r = 0.76), M1-M1 (r = 0.75), P4-P4 (r = 0.73) and P4-P3 (r = 0.72) (Table 5). In the
remaining pairs of occluding teeth the power ofreciprocal correlations of tooth lengths was con-siderable (0.51 < r < 0.70) or moderate (0.31 <r < 0.50) (Table 5). The r coefficient for crownlengths in opposite but non-occluding tooth pairshad a very broad range (0.74–0.10). The strong-est correlations were found in pairs LP4-LP2 andLP4-LP2, while extremely low in pairs LM3-LP2
and LM3-LI3 (Table 5).The correlation for widths of the teeth from
opposite tooth rows was strongest in the follow-ing pairs: C1-C1, P2-P2 (r = 0.84), P2-P3 (r = 0.81),P3-P2 (r = 0.80), P3-P3 (r = 0.79), P1-P1 (r = 0.74),P3-P4 (r = 0.73), P2-P4 (r = 0.71) (Table 6). The
Table 3. Correlations (r) of tooth length for each pair of teeth within the upper dentition (upper triangular matrix)and lower dentition (lower triangular matrix) in the red fox (Vulpes vulpes) from Poland.—————————————————————————————————————————————————
range of r for crown widths in non-occluding toothpairs was also broad (0.71–0.10). The highestvalue in this range was found in pair WP2-WP4,
whereas the lowest was found in WP2-WM3 (Ta-ble 6).
LP3 had the strongest correlation with CB (r =
Table 4. Correlations (r) of tooth width for each pair of teeth within the upper dentition (upper triangular matrix)and lower dentition (lower triangular matrix) in the red fox (Vulpes vulpes) from Poland.—————————————————————————————————————————————————
Table 6. Correlations (r) of tooth width for teeth from opposite tooth rows (left and right side together) in the redfox (Vulpes vulpes) from Poland.—————————————————————————————————————————————————
Table 5. Correlations (r) of tooth length for teeth from opposite tooth rows (left and right side together) in the redfox (Vulpes vulpes) from Poland.—————————————————————————————————————————————————
ANN. ZOOL. FENNICI Vol. 37 • Variability patterns in the red fox dentition 123
0.72). A considerable power of correlation rela-tionships (0.51 < r < 0.70) with CB was revealedby LC1, LP1, LP2, LP3, LP4, LM1 and LC1, LP2,LP4, LM1. The LI2 and LM3 were weakly corre-lated with CB (r < 0.30; Table 3).
The crown widths were generally less corre-lated with CB than the crown lengths in the redfox dentition. Within the upper tooth row, how-ever a considerable correlation with CB (0.51 < r< 0.70) was manifested by WC1, WI2, WI3 andWI1, and in the lower tooth row by WC1, WP2 andWP3 (Table 4).
4. Discussion
4.1. Variation pattern
In the dentition of carnivoran mammals a mor-phological gradient of tooth size and shape is ob-served. Extreme variation in size and shape oc-curs in the premolar region. In the upper toothrow P4 and M1 have the largest measures of sizeand complexity. Anteriorly and posteriorly fromthese points a gradual size reduction and toothsimplification are observed. The central point inthe lower tooth row is M1. In the anterior regionof the upper and lower tooth rows an unilateraldecrease of tooth size is observed from posteriorto anterior, i.e. from C1 to I1 and from C1 to I1
(Fig. 10). In dental profiles of mammals the gra-dient of size and complication of tooth charactersis accompanied by definite trends in variability.
The variability analyses based on CV show asimilar variability pattern to that found in manymammal species. The least variable teeth arepresent in the center of the tooth row and the mostvariable ones lie on its borders (Gingerich 1974,Gingerich & Schoeninger 1979, Gingerich & Win-kler 1979, Pengilly 1984). Both CV and VSD indi-ces showed a pattern of dental variation in the redfox from Poland that was very similar to the den-tal pattern found by Gingerich and Winkler (1979)in the red fox from the Upper Peninsula of Michi-gan. In both populations the least variability wasobserved in the central region of the cheek toothrow (M1 and M1). The upper carnassial showedlow variability in length and high variability inwidth. In both the upper and lower tooth rows anincrease in size variation was observed from thecentral region (carnassial region) towards the an-terior and posterior ends of the tooth row. Thehighest values of CV and VSD for crown lengthand width were found in M3. In Gingerich andWinkler’s (1979) opinion M2 was the most vari-able tooth in the upper dentition. However, thisanalysis of red foxes from Poland shows that thesize of the M2 is quite a stable character. Contraryto the red foxes from the Upper Peninsula of Mich-igan, red foxes from Poland have great variation
Fig. 10. Occlusal crown size [ln (length × width)] in upper and lower dental arches in the red fox (Vulpes vulpes)from Poland.
Szuma • ANN. ZOOL. FENNICI Vol. 37124
in C1 and C1. In both these samples the premolarregion has an intermediate level of variability.
In the red fox dentition, all teeth have differ-ences in the CV of crown lengths versus widths.In the upper tooth row, in the incisor and canineregions, the differences between CV of these mea-surements are not great. The differences increasetoward the P4 but in the molar region they are smallagain. In the mandibular tooth row the pattern ofvariation of tooth lengths and widths looks quitedifferent than in the maxillary tooth row. In theanterior part of the mandible (from I1 to P1) thetooth lengths are more variable than the widths,whereas in the tooth row from P2 to M2 the situa-tion is the opposite.
The large differences between CV for toothlengths and widths in the premolar region is prob-ably the result of the specific, distinctly elongateshape of the teeth, where the tooth lengths are twoor three times longer than tooth widths. The aver-age value of the variation of tooth widths is slightlyhigher than the average value of the variation oftooth lengths in red foxes from Poland. The fore-going observations confirm an earlier assertionby Yablokov (1974) that the CV is determined bya character’s size. The smaller a measurement,the higher the CV, and vice versa.
Analyses of the averages of tooth lengths andCV suggest that there should be an inverse rela-tionship between tooth size and the coefficient ofvariability (CV). Negative relationships betweenCV and measurements of cheek teeth were previ-ously found in a sample of the red fox Vulpes vul-pes (Gingerich & Winkler 1979), in the arctic foxAlopex lagopus (Pengilly 1984), as well as in sam-ples of the American marten Martes americanaand the Eastern grey fox Urocyon cinereoargen-teus (Polly 1998). The regression of the RSD indexin relation to averages of tooth size carried out inthe sample of red foxes from Poland showed com-plete absence of the influence of character size onits variation level, and thus Polly’s observations(1998) were confirmed.
The RSD regression used in the studies of den-tal variation in the red fox from Poland showedtotal absence of the relation between character sizeand the variation level. Contrary to the variabilitypattern based on CV and VSD, in the pattern con-structed on the RSD for P2, P3, P2, and P3 no signifi-cant differences have been observed between vari-
ation in tooth lengths and widths. Moreover, inthe case of P2 and P2 the crown lengths are slightlymore variable than the widths.
Regression of the CV of the occlusal crownsurface on the eruption sequence of the perma-nent teeth showed a trend of increasing tooth sizevariability with later eruption times. The analysisof the dental variation pattern in the sample of thered fox from the Upper Peninsula of Michiganshowed no influence of the eruption time on toothvariation (Gingerich & Winkler 1979). The rela-tionship between the eruption sequence and vari-ation of crown lengths in the sample of the redfox from Poland based on VSD and RSD showed apositive but statistically insignificant relationship.It seems that the relationship between eruptiontime and variation in tooth size in the populationof the red fox in Poland reveals one of many fac-tors determining dental variation patterns, viz.development.
Gingerich and Winkler (1979) said that thepattern of variation is a good measure of func-tional integration in particular regions of the den-tal apparatus. They observed that in the red foxdentition the most precise occlusion is in the car-nassial region, whereas more simple occlusion ispresent in the incisor and canine regions. Oppo-site premolars are characterised by the completeabsence of contact during occlusion of the upperand lower jaws. The pattern of variation in thedentition of the red fox from Poland partiallyagrees with that proposed by Gingerich and Win-kler (1979). The hypothesis offered by these au-thors explains and affirms that the occlusal com-plexity also partially explains the variation pat-tern of tooth dimensions.
In both populations the most tightly occlud-ing, and the most complicated teeth of the carnas-sial region show the lowest variability. The vari-ability increases gradually from the centre to theanterior and posterior ends of the cheek tooth row,and on M3, P1 and P1 it reaches the highest values.The incisor region is characterised by a simpleocclusion and rather low variation. The variationlevel is a little lower in I1 and I1, and increasesposteriorly. A simple occlusion of the canines isnot confirmed by its CV value. In the maxilla, thehighest variation of the occlusal surface of thecrown was shown by C1. The size variation of C1
was also high but it was lower than C1. Trends in
ANN. ZOOL. FENNICI Vol. 37 • Variability patterns in the red fox dentition 125
variability based on RSD and occlusal complica-tion of tooth crowns were similar to those whichwere obtained for CV. High variation was foundin LC1, LC1 and WP4. The analysis of variation infemales and males individually showed that val-ues of CV for occlusal surfaces of C1 and C1 werelower than in the sample of both sexes together.
These results suggest that sexual dimorphismis responsible for higher variation of the canines.In the dentition of the red fox from Poland, thevalues (except P1, P1 and M3) are significantlyhigher in males than in females. A similar pictureof sexual dimorphism of dental characters wasfound by Ansorge (1994) in the population of thered fox from Oberlausitz. He observed that sexualdimorphism in the canine region was higher thanin the carnassial region. Dayan et al. (1989, 1991)stated that in most canids sexual dimorphism ofthe canine lengths is not greater than the dimor-phism of the carnassial lengths. On the contrary,Gittleman and Van Valkenburgh (1997) demon-strated that in the canid family the highest sexualdimorphism of measurements occurred on C1 andC1, and it was higher than the sexual differencesin the carnassial region. Alvesalo (1970) indicatedthat in all earlier odontometric studies of humanpopulations the largest differences between sexesappeared in the length and width of C1 and C1. Inthe dentition of the red fox from Poland the high-est values of the Mm/Mf index were found in thelength, width and height of C1 and C1. It seemsthat sexual dimorphism is one of the more impor-tant factors contributing to the higher variation ofcanines.
The completion of the eruption of the perma-nent dentition in the red fox occurs at the end ofthe sixth month of life (Linhart 1968). Studies oftooth development in dogs showed that the en-closing and filling of the roots of C1 and C1 was aprocess which lasted into the eighth month of life.By that time, canines undergo heavy hormonalchanges typical for a young organism. Activechanges in the root size have their reflection inactive transformations in the oval crown outlineof the cross-section of canines, especially in theirlower part (Lorber et al. 1979). Measurements ofthe canine lengths and widths in the sample of thered fox from Poland were taken just over the junc-tion of the enamel and cement. Moreover, a rela-tively great part of this sample was composed of
young specimens (about seven or eight months ofage). It seems that a higher variation of canines infoxes may be another proof of a significant influ-ence of the developmental process on the dentalvariation pattern.
4.2. Correlation pattern
The general pattern of correlations in the denti-tion of the red fox from Poland is concordant withthat found in other mammals. Inside of each mor-phological region, homologous teeth have strongercorrelations than between teeth from differentregions (Garn et al. 1965, Polly 1997). However,Garn et al. (1965) already remarked that the neigh-bouring teeth in two different morphological fieldsoften have higher correlations than more distantteeth in the same field. In the dentition of the redfox from Poland neighbouring teeth lying in dif-ferent regions, such as: I3 and C1, C1 and P1, aremore strongly correlated with each other than toothpairs that are more distant but lying in the sameregion, e.g. I1 and I3. In accordance with the neigh-bourhood rule (Kurtén 1953, Van Valen 1970),more significant correlations in a single region arefound between neighbouring teeth, the strongestbeing in the central region of the field. Thoughthe upper and lower tooth rows are composed oftwo different morphological units, the generalpattern of relations is identical with correlationsin a single tooth row.
The correlation pattern of tooth lengths foundin red foxes from Poland resembles the correla-tion patterns found for red foxes from Finland andthe Kökar Island (Kurtén 1953) and the UpperPeninsula of Michigan (Gingerich & Winkler1979), as well as for the population of arctic foxesfrom Alaska and Canada (Pengilly 1984). Thehighest level of correlation both for crown lengthand width in the sample of red foxes from Polandwas found in the premolar region. This observa-tion confirmed earlier suggestions about the high-est morphological integration in the premolar re-gion. Pengilly (1984) stated that the absence ofprecise occlusion between opposite premolars ex-cludes the functional explanation of such a highlevel of morphological integration of the teeth. Inhis opinion the only explanation of the strong re-lationships is a common developmental factor. It
Szuma • ANN. ZOOL. FENNICI Vol. 37126
seems that the premolars create a distinct, mor-phogenetic field which is subject to the influenceof the same developmental factors.
Important traits of the correlation pattern inthe red fox dentition from Poland are the closerelationships between lengths and widths in pairC1 and C1, and also the precise correlation betweenthe widths in neighbouring incisors. Unlike thevariability indices, the coefficient of correlation rreflects the functional significance of pairs of op-posite canines. Mellett (1984) emphasised that thefrequently forgotten but very important functionof canines is to guide occlusion in the upper andlower tooth rows. This function requires a highlevel of integration in the canine region. High val-ues of the r coefficient for C1 and C1 are evidenceof that. The strong correlation of the widths be-tween neighbouring incisors can be explained bothby the influence of the functional factor (simpleocclusion) and of the common developmental fac-tor (morphogenetic field of incisors).
In any particular dental system particular toothgroups or pairs have different functions. In preda-tors, the most important are the carnassials (per-forming both grinding and cutting functions). Thecanines are used to kill and play a significant rolein social interactions. The incisors function incatching and holding a prey. Premolars and poste-rior molars have a secondary functional value inrespect to catching and grinding of the food. Thepremolars help to hold the prey, while it is car-ried, whereas the last molars are helpful in grind-ing food. The most probable pattern of functionalintegration in the red fox dentition is presented inFig. 11. The necessity of correct and effective func-
tion in particular regions and of the whole dentalsystem requires at least a minimal integration level.Dental regions performing significant functions inlife should be characterised by a considerable char-acter correlation. Therefore, one would expect thatthe correlation pattern in the red fox dentition is areflection of the functional integration pattern.However, multivariate correlations of dental fea-tures showed that something other than the func-tional integration explains the correlation patternin the dentition of the red fox from Poland (Fig.12). The highest level of tooth measurement cor-relations was found in the region of neighbouringas well as opposite and occluding premolars. Ahigh correlation in respect to all dimensions wasfound between C1 and C1. The carnassials showeda strong relationships only in crown length. In theincisor field I observed mainly moderate levels ofcorrelation, though as for tooth width strong cor-relations were found in the following pairs: I1-I2,I2-I3 and I1-I2. The lowest correlation values werenoted in the posterior molars.
The overall pattern of variation and correla-tion in the red fox dentition is created by compli-cated scheme of functional and developmentalfactors. Eruption time, hormonal regulation dur-ing development, sexual dimorphism and func-tional significance of particular regions determinethe variation level of tooth size. Yet the correla-tion pattern is not a direct reflection of the func-tional importance of the dental system. This pat-tern is a result of some factors operating duringdevelopment, such as: factors of morphogeneticfield, hormonal environment, and also externalenvironment of the system.
Fig. 11. Hypothetical pattern of functional integrationin the red fox dentition.
Fig. 12. Pattern of morphological integration in the redfox dentition.
highest level of functional integration
lowest level of functional integration
carnassials
canines
incisors
last molars
premolars
highest level of morphological integration
lowest level of morphological integration
premolars
canines
carnassials
incisors
last molars
ANN. ZOOL. FENNICI Vol. 37 • Variability patterns in the red fox dentition 127
5. Conclusions
1. Analysis of size variation in the red fox denti-tion showed that the first molars (M1 and M1)are the most stable, whereas M3 is the mostvariable tooth. The overall dental variationpattern is a result of both functional and de-velopmental factors.
2. Sexual dimorphism in the canine region washigher than in the carnassial region. It seemsto be a consequence of the significant socialrole of the canines.
3. The highest correlations in both crown lengthand width in the premolar region are a conse-quence of common morphogenetic influences,whereas the strong correlations in pair C1-C1
are a result of the very important function ofcanines, namely guiding occlusion betweenupper and lower tooth rows.
ACKNOWLEDGEMENTS: I thank M. Wolsan for his helpand many suggestions during preparation of the paper. I amvery grateful to P. D. Polly for improving the English lan-guage, and also to Z. Pucek and J. M. Wójcik and anony-mous referees for providing helpful comments and criticism.
References
Alvesalo, L. 1970: The influence of sex-chromosome genesof tooth size in man. A genetic and quantitative study.— Academic dissertation. Univ. Turku, Turku. 52 pp.
Ansorge, H. 1994: Intrapopular skull variability in the redfox, Vulpes vulpes (Mammalia: Carnivora: Canidae).— Zool. Abh. Mus. Tierkd. Dresden 48: 103–123.
Dayan, T., Simberloff, D., Tchernov, E. & Yom-Tov, Y.1991: Calibrating the paleothermometer climate, com-munities, and the evolution of size. — Paleobiology17: 189–199.
Dayan, T., Tchernov, E., Yom-Tov, Y. & Simberloff, D.1989: Ecological character displacement in Saharo-Ara-bian Vulpes: outfoxing Bergmann’s rule. — Oikos 55:263–272.
Garn, S. M., Lewis, A. B. & Kerewsky, R. S. 1965: Sizeinterrelationships of the mesial and distal teeth. — J.
Dent. Res. 44: 350–354.Gingerich, P. D. 1974: Size variability of the teeth in living
mammals and the diagnosis of closely related sympatricfossil species. — J. Paleont. 48: 859–903.
Gingerich, P. D. & Schoeninger, M. J. 1979: Patterns oftooth size variability in the dentition of primates. —Am. J. Phys. Anthrop. 51: 457–466.
Gingerich, P. D. & Winkler, D. A. 1979: Patterns of varia-tion and correlation in the dentition of the red fox, Vulpesvulpes. — J. Mammal. 60: 691–704.
Gittleman, J. L. & Van Valkenburgh, B. 1997: Sexual di-morphism in the canines and skulls of carnivores: ef-fects of size, phylogeny, and behavioural ecology. —J. Zool., London 242: 97–117.
Gould, S. J. & Garwood, R. A. 1969: Levels of integrationin mammalian dentitions: An analysis of correlationsin Nesophontes micrus (Insectivora) and Oryzomyscouesi (Rodentia). — Evolution 23: 276–300.
Kurtén, B. 1953: On the variation and population dynamicsof fossil and recent mammal populations. — Acta Zool.Fennica 76: 1–122.
Lewontin, R. C. 1966: On the measurement of relative vari-ability. — Syst. Zool. 1966: 141–142.
Linhart, S. B. 1968: Dentition and pelage in the juvenilered fox (Vulpes vulpes). — J. Mammal. 49: 526–528.
Lorber, M., Alvo, G. & Zontine, W. J. 1979: Sexual dimor-phism of canine teeth of small dogs. — Archs OralBiol. 24: 585–589.
Mellett, J. S. 1984: Autocclusal mechanism in the carni-vore dentition. — Aust. Mammal. 8: 233–238.
Pengilly, D. 1984: Developmental versus functional expla-nations for patterns of variability and correlation in thedentitions of foxes. — J. Mammal. 65: 34–43.
Polly, P. D. 1997: Variability profiles and morphologicalintegration in carnivore dentitions: implications for de-velopmental field hypotheses. — J. Vertebr. Paleont.17 (3 supplement): 70A.
Polly, P. D. 1998: Variability in mammalian dentitions: size-related bias in the coefficient of variation. — Biol. J.Linn. Soc. 64: 83–99.