56
Variation in the Care of Surgical Conditions: Obesity A Dartmouth Atlas of Health Care Series
Variation in the Care of Surgical Conditions:Obesity
A Dartmouth Atlas of Health Care Series

Variation in the Care of Surgical Conditions: ObesityA Dartmouth Atlas of Health Care Series
The Michigan Bariatric Surgery Collaborative
Bradley N. Reames, MD, MSNancy J. Birkmeyer, PhDJustin B. Dimick, MD, MPH
The Dartmouth Institute of Health Policy & Clinical Practice
Philip R. Goodney, MD, MSNino Dzebisashvili, PhDDavid C. Goodman, MD, MSKristen K. Bronner, MA
A DARTMOUTH ATLAS OF HEALTH CARE SERIES I
DEPARTMENT OF SURGERY


Table of Contents
Foreword ............................................................................................................................................................. v
Introduction ......................................................................................................................................................... 1Variation in decision-making for surgical conditions ...........................................................................................................2New developments that have influenced surgical decision-making ....................................................................................4Challenges to improving surgical decision-making and the goals of this series .................................................................6Influencing the key decision-makers: Patients, primary care physicians, surgeons, and policymakers ..............................8References ........................................................................................................................................................................10
The burden of obesity in the United States.................................................................................................... 11Before surgery ..................................................................................................................................................................12
Trends and variation in the prevalence of obesity and related comorbidities ................................................................................ 12Treatment options and success rates ............................................................................................................................................ 16Reaching the right decision ........................................................................................................................................................... 19
During surgery ..................................................................................................................................................................22Choosing surgical care, and the type of surgical care ................................................................................................................... 22Trends in utilization ........................................................................................................................................................................ 22Policy influence on procedure utilization ........................................................................................................................................ 24Using regional collaboratives to study comparative effectiveness ................................................................................................. 27Technical quality: the role of centers of excellence in bariatric surgery ......................................................................................... 28
After surgery .....................................................................................................................................................................30Beyond surgery .................................................................................................................................................................32
Spending on surgery – or spending on prevention? ...................................................................................................................... 32Using quality improvement to limit variation .................................................................................................................................. 32Decision aids and shared decision-making ................................................................................................................................... 33
Conclusions ......................................................................................................................................................................33Methods ............................................................................................................................................................................34References ........................................................................................................................................................................43
A DARTMOUTH ATLAS OF HEALTH CARE SERIES III


Foreword
The new Dartmouth Atlas series on variation in the care of surgical conditions, starting with this report on the surgical treatment of obesity, raises new questions regarding surgical management of both common and less frequently occurring medical conditions. This report carefully details the scope of the ever-increasing problem of obesity and, as in previous Atlas analyses, emphasizes geographic practice variation in surgical treatment rates. However, the report also takes a more longitudinal view. The changes over time in which bariatric procedure is favored are particularly fascinating, driven as they appear to be by a mix of clinical evi-dence—including emerging long-term results—and reimbursement policy. Obese patients will often ask me, as a primary care physician, whether they should have one of these procedures, and, if so, where. These questions have always been hard to answer. Population-based registries, as described in the report, should go a long way toward producing the kind of widely applicable data upon which patient decision support tools should be based. Patients want to know procedure and facil-ity-based risks and benefits. Just as the future of medicine is personalization of diagnosis and treatment, so too the future of decision support is to increasingly provide information tailored to the person and his or her health care environment. Ultimately, it is the active participation of fully informed patients that can address the question of “which rate is right,” so provocatively posed by the Dartmouth Atlas analyses. I enjoyed reading this report and will look forward to future analyses tar-geting other common, preference-sensitive interventions.
Michael J. Barry, M.D.President, Informed Medical Decisions FoundationClinical Professor of Medicine, Harvard Medical School
A DARTMOUTH ATLAS OF HEALTH CARE SERIES v


A DARTMOUTH ATLAS OF HEALTH CARE SERIES 1
Variation in the Care of Surgical ConditionsA Dartmouth Atlas of Health Care Series
Introduction
Twenty-first century surgery is among the great accomplishments of medicine. Sur-geons have led some of the most important improvements in care quality, safety, and efficiency. Surgical methods are now highly effective for some of the most serious and previously intractable medical conditions, ranging from arthrosclerosis to obesity to chronic back pain. Today, surgical procedures work better and entail lower risk, less pain, and less time in the hospital.
As the scope and quality of surgical care continues to advance, there is still much that remains to be done to optimize care for patients. For many conditions, surgery is one of several care options, and in some instances, there are several types of surgical procedures available. Research into the effectiveness and adverse effects of a surgical procedure compared to alternatives is often incomplete. While qual-ity has generally improved over time, outcomes can differ across hospitals and surgeons. Too often, treatment options, whether medical or surgical, are recom-mended without patients fully understanding the choices and participating in the decision; and these recommendations can vary markedly from one physician to the next. Finally, the costs of care continue to rise and often differ across health care systems, even the most reputable and prestigious. Why can the “best” surgical care at one academic medical center cost twice as much as another?
This Dartmouth Atlas of Health Care series reports on unwarranted regional varia-tion in the care of several conditions for which surgery is one important treatment option. Unwarranted variation is the differences in care that are not explained by patient needs or preferences. Each report begins with an examination of the underlying condition, the available treatment options before surgery, and the role of shared decision-making. The care during surgery is then presented, including aspects of quality, risks, and costs. The next section is concerned with the care of patients after surgery, including hospital readmissions and ambulatory care.
The bottom line is that the greatest promise of surgery still lies before us. These reports show that quality is often excellent, but not in all places. Variation in surgical rates is high and represents both gaps in outcomes research and poor patient deci-sion quality. Outcomes differ from place to place even when controlling for patient differences. The opportunities for better and more efficient care are substantial and will require renewed efforts in research and clinical quality improvement.
A Dartmouth Atlas of Health Care Series
2 vARIATION IN THE CASE OF SURGICAL CONDITIONS
Variation in decision-making for surgical conditions
Experienced leaders and educators in surgery often emphasize to their trainees and students that performing an operation is easy: choosing the right patients for surgery is much more difficult. Over the last decade, important changes have occurred related to how surgeons and patients decide whether, when, where, and how to best perform surgery. In the past, surgeons commonly played a paternalistic role, and many surgeons made decisions for their patients, relying on their own training and experience.
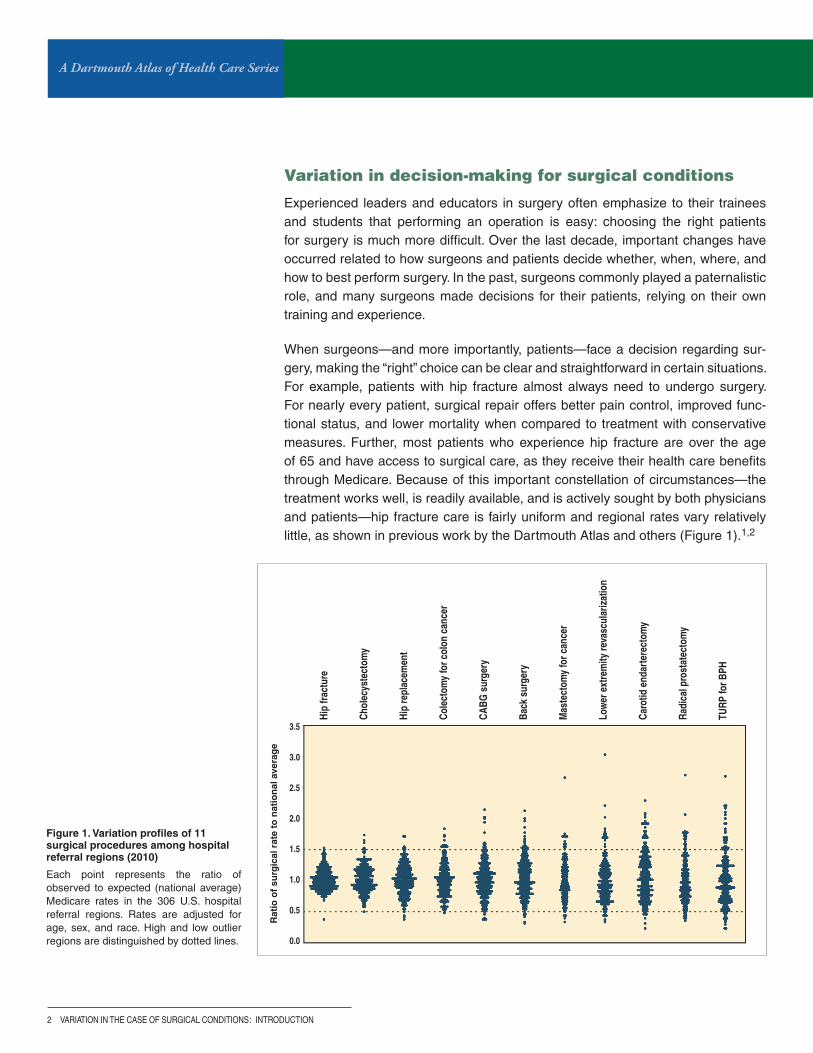
When surgeons—and more importantly, patients—face a decision regarding sur-gery, making the “right” choice can be clear and straightforward in certain situations. For example, patients with hip fracture almost always need to undergo surgery. For nearly every patient, surgical repair offers better pain control, improved func-tional status, and lower mortality when compared to treatment with conservative measures. Further, most patients who experience hip fracture are over the age of 65 and have access to surgical care, as they receive their health care benefits through Medicare. Because of this important constellation of circumstances—the treatment works well, is readily available, and is actively sought by both physicians and patients—hip fracture care is fairly uniform and regional rates vary relatively little, as shown in previous work by the Dartmouth Atlas and others (Figure 1).1,2
Figure 1. Variation profiles of 11 surgical procedures among hospital referral regions (2010)
Each point represents the ratio of observed to expected (national average) Medicare rates in the 306 U.S. hospital referral regions. Rates are adjusted for age, sex, and race. High and low outlier regions are distinguished by dotted lines.
: INTRODUCTION
Rat
io o
f su
rgic
al r
ate
to n
atio
nal
ave
rag
e
Hip
fract
ure
Chol
ecys
tect
omy
Hip
repl
acem
ent
Cole
ctom
y fo
r col
on c
ance
r
CABG
sur
gery
Back
sur
gery
Mas
tect
omy
for c
ance
r
Low
er e
xtre
mity
reva
scul
ariz
atio
n
Caro
tid e
ndar
tere
ctom
y
Radi
cal p
rost
atec
tom
y
TURP
for B
PH3.5
3.0
2.5
2.0
1.5
1.0
0.5
0.0
A DARTMOUTH ATLAS OF HEALTH CARE SERIES 3
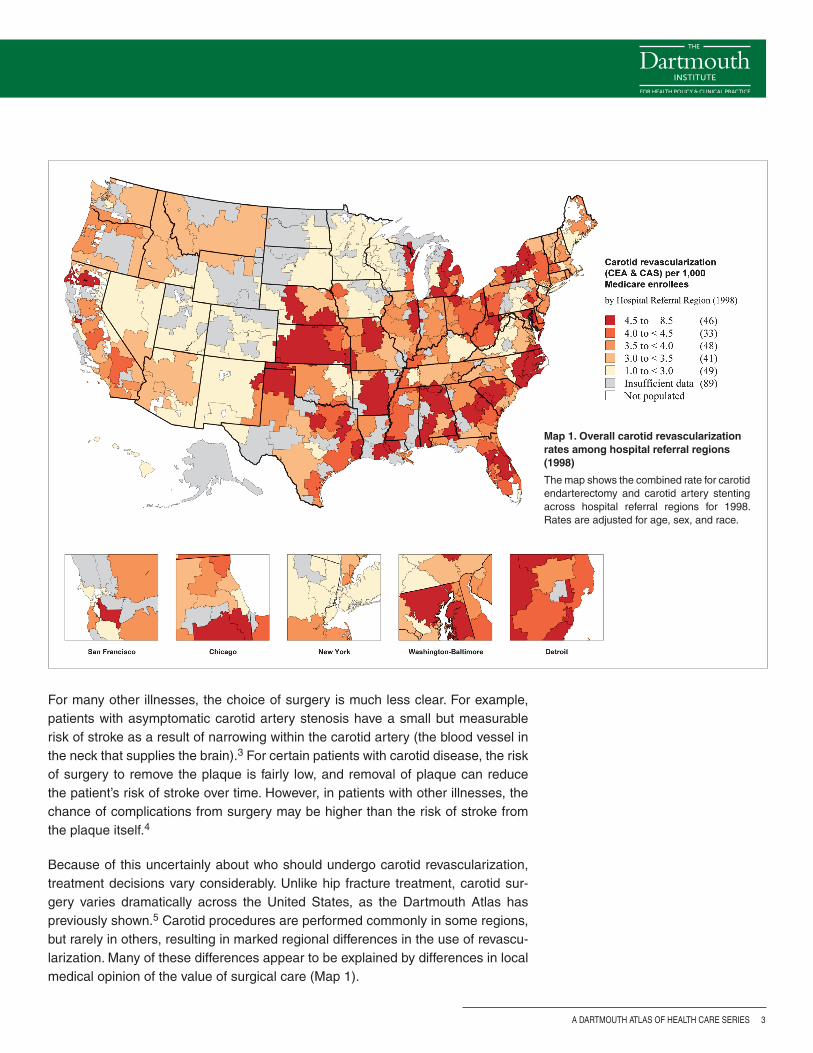
For many other illnesses, the choice of surgery is much less clear. For example, patients with asymptomatic carotid artery stenosis have a small but measurable risk of stroke as a result of narrowing within the carotid artery (the blood vessel in the neck that supplies the brain).3 For certain patients with carotid disease, the risk of surgery to remove the plaque is fairly low, and removal of plaque can reduce the patient’s risk of stroke over time. However, in patients with other illnesses, the chance of complications from surgery may be higher than the risk of stroke from the plaque itself.4
Because of this uncertainly about who should undergo carotid revascularization, treatment decisions vary considerably. Unlike hip fracture treatment, carotid sur-gery varies dramatically across the United States, as the Dartmouth Atlas has previously shown.5 Carotid procedures are performed commonly in some regions, but rarely in others, resulting in marked regional differences in the use of revascu-larization. Many of these differences appear to be explained by differences in local medical opinion of the value of surgical care (Map 1).
Map 1. Overall carotid revascularization rates among hospital referral regions (1998)
The map shows the combined rate for carotid endarterectomy and carotid artery stenting across hospital referral regions for 1998. Rates are adjusted for age, sex, and race.

A Dartmouth Atlas of Health Care Series
4 vARIATION IN THE CASE OF SURGICAL CONDITIONS
New developments that have influenced surgical decision-making
How can surgeons and patients make the best decisions? In the past, many inves-tigators reasoned that the surgeons who achieved the best results were likely to have the largest practices, and using this seemingly simple metric would ensure that patients received good surgical care. However, this assumption ignored the fact that it is difficult for surgeons to know who really achieves the “best” results. Many outcomes (such as death after carotid surgery) occur uncommonly, and a single surgeon has little ability to compare his or her results to those of other surgeons.
Given this challenge, over the last two decades, efforts to organize, measure, and improve results in surgical practice via quality improvement initiatives have developed, despite substantial obstacles. Patterns of surgical practice vary broadly across different regions of the United States, making it challenging to study and compare patients and outcomes. Further, the process of collecting, studying, and improving surgical outcomes represented a formidable challenge a decade ago, when most medical information lived in paper records, arranged in leaning stacks of bulging charts.
One important development in measuring care has been the development of clinical registries. These registries are used to study the clinical characteristics and outcomes of patients undergoing surgery and have supported many quality improvement initiatives, such as those shown in Table 1.
Table 1. Surgical registries and quality improvement organizations
Quality Improvement Initiative Organization Surgical Specialty Focus Funding
American College of Surgeons National Surgical Quality Improvement Initiative (ACS-NSQIP)
American College of Surgeons
Many Measuring and reporting patient characteristics and outcomes
Hospitals
veterans Affairs National Surgical Quality Improvement Program veterans Affairs Many Measuring and reporting patient characteristics and outcomes
Federal
Society of Thoracic Surgeons National Database (STS) Society of Thoracic Surgeons
Thoracic surgery Limiting risk with cardiac and thoracic procedures
Surgeons
vascular Quality Initiative (vQI) Society for vascular Surgery
vascular surgery Improving care of patients with vascular disease
Surgeons and hospitals
: INTRODUCTION
A DARTMOUTH ATLAS OF HEALTH CARE SERIES 5
Uncertainty regarding benefits
and risks of surgery
Information for patients and surgeons
to guide decisions
Uncertainty regarding benefits
and risks of surgery
Information for patients and surgeons
to guide decisions
Variation in surgical decisions: AFTER the evolution of registries, etc.
Variation in surgical decisions: BEFORE the evolution of registries, etc.
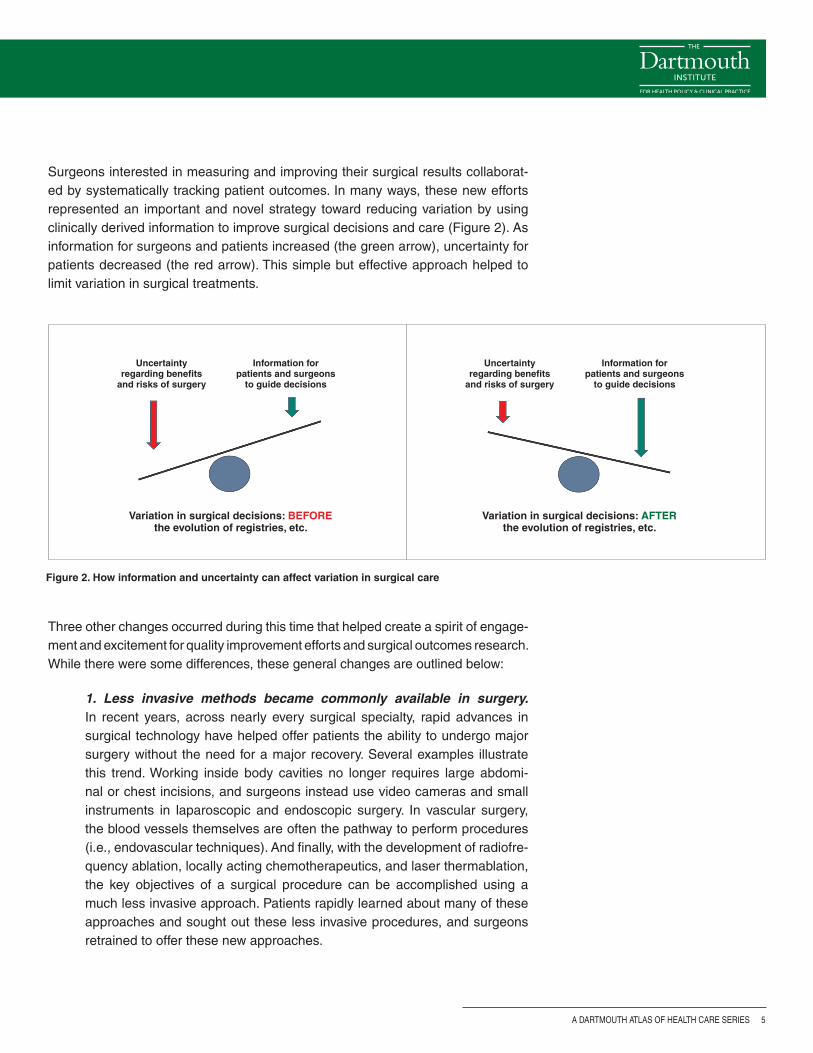
Surgeons interested in measuring and improving their surgical results collaborat-ed by systematically tracking patient outcomes. In many ways, these new efforts represented an important and novel strategy toward reducing variation by using clinically derived information to improve surgical decisions and care (Figure 2). As information for surgeons and patients increased (the green arrow), uncertainty for patients decreased (the red arrow). This simple but effective approach helped to limit variation in surgical treatments.
Figure 2. How information and uncertainty can affect variation in surgical care
Three other changes occurred during this time that helped create a spirit of engage-ment and excitement for quality improvement efforts and surgical outcomes research. While there were some differences, these general changes are outlined below:
1. Less invasive methods became commonly available in surgery. In recent years, across nearly every surgical specialty, rapid advances in surgical technology have helped offer patients the ability to undergo major surgery without the need for a major recovery. Several examples illustrate this trend. Working inside body cavities no longer requires large abdomi-nal or chest incisions, and surgeons instead use video cameras and small instruments in laparoscopic and endoscopic surgery. In vascular surgery, the blood vessels themselves are often the pathway to perform procedures (i.e., endovascular techniques). And finally, with the development of radiofre-quency ablation, locally acting chemotherapeutics, and laser thermablation, the key objectives of a surgical procedure can be accomplished using a much less invasive approach. Patients rapidly learned about many of these approaches and sought out these less invasive procedures, and surgeons retrained to offer these new approaches.
A Dartmouth Atlas of Health Care Series
6 vARIATION IN THE CASE OF SURGICAL CONDITIONS
2. Surgeons learned about data management and quality improvement. In places like Northern New England,6,7 the Veterans Administration,8 and others,9 leaders in surgical outcomes assessment built the systems neces-sary to study and improve surgical care. These regional and national quality improvement efforts grew to become the infrastructure that allowed surgeons and patients to know when, how, where, and why surgical procedures were being performed. These initiatives set the stage for an emphasis on achiev-ing the best outcomes.
3. Surgeons, patients, and payers put a new emphasis on measuring and reporting. Armed with gigabytes of data and advanced analytic sys-tems, surgeons were now able to quickly analyze their outcomes. The ability to determine the structural and process measures associated with the best outcomes allowed surgeons new insights into what works and what does not. For example, surgeons used information from studies based on registries to demonstrate the benefits of processes of care, such as perioperative antibi-otic administration, or of evolving procedures, such as bariatric surgery for patients with morbid obesity. Payers’ and patients’ expectations grew; they demanded the best operation, at the right time, with the highest quality.
Challenges to improving surgical decision-making and the goals of this series
Of course, several challenges accompanied these new developments. Who will pay for continued efforts to organize and measure surgical practice? How should results be shared and compared, especially among competitors? Would efforts to use the newest, latest, or most profitable device win out over the goal of improving quality and efficiency? Would surgeons, a group steeped in tradition and often slow to change, adopt these new approaches?
These questions have different answers in different settings. In some cases, such as in coronary bypass surgery, cardiac surgeons adopted outcomes assessment and quality improvement broadly, quickly, and enthusiastically. However, in other settings, such as surgery for prostate cancer or lower extremity vascular disease, efforts toward quality measurement and outcomes assessment have been taken up more slowly, and the impact of these initiatives remains less striking.
Why might some surgeons improve their decisions using these new strategies while other surgeons choose not to try these approaches? In this series of reports, we will use several examples to illustrate the challenges. We will describe, across a broad spectrum of conditions, advances in surgical decision-making, including shared decision-making, which have resulted in less variation in care, improved patient satisfaction, and better outcomes. We will also describe settings wherein these strategies have been less successful, and variations in surgery rates and
: INTRODUCTION
A DARTMOUTH ATLAS OF HEALTH CARE SERIES 7
Table 2. Structure of each report
Before surgery
Determinants of condition and treatment decisions
Incidence of condition
Regional variation in condition/covariates related to the condition
Treatment options - effectiveness, trade-offs, and knowledge gaps
Issues related to decision quality and shared decision-making
Examples of quality improvement efforts or attempts to limit variation in treatments for condition
During surgery
Technical quality and outcomes
variation in procedure rates
Cross-sectional rates of competing treatments
Technical quality and results (short-term outcomes related to treatments)
Example where regional quality improvement efforts may hold potential benefits in improving care
After surgery
Post-procedure care and long-term outcomes
Downstream effects of treatment on condition
Readmission or re-interventions after treatments for condition
Beyond surgery
Implications for surgeons, patients, and society
How variation in treatments for the condition reflects opportunities for quality and efficiency gains
How, why, and where efforts to limit variation are needed and might help
How to move ahead in limiting variation or improving care in surgical treatments for condition
surgical decision-making remain. In these latter cases, we will outline the potential to improve surgical practice by refining the methods we use to select patients for intervention.
This series will study these conditions and their challenges in much the same way that surgeons approach these problems: by considering the challenges in care that occur before surgery, during surgery, after surgery, and beyond surgery. Within each condition, we will follow the patient along these choices and decisions and learn where the greatest challenges, most important uncertainties, and best evidence lie in making decisions about surgery. Further, we will examine the implications of these uncertainties and identify settings where more effective choices surrounding surgical care could result in healthier populations and potentially even lower costs.

A Dartmouth Atlas of Health Care Series
8 vARIATION IN THE CASE OF SURGICAL CONDITIONS
Influencing the key decision-makers: Patients, primary care physicians, surgeons, and policymakers
In the past, when it came to making a decision about surgery, the surgeon’s recom-mendation was considered the most important opinion. His or her perspective was often critical in determining the use of a particular surgical procedure, especially for “preference-sensitive” care: care for conditions where there is no single “right” rate for every population or patient.
Current models of care suggest that better outcomes occur when full information about treatment options is shared with patients, who are then assisted in sharing the decision with the physician. This information often needs to come not only from surgeons, but also from primary care physicians who help patients choose among the different options, each with their likely outcomes and trade-offs. (For more information about patient-centered medical decision-making, please visit the Dartmouth Center for Informed Choice at http://tdi.dartmouth.edu/research/engaging/informed-choice and the Informed Medical Decisions Foundation at www.informedmedicaldecisions.org). In addition to reaching patients, the best information needs to reach policymakers who make decisions about how we spend our health care dollars, such that our resources provide the most effective care for patients with surgical conditions.
: INTRODUCTION
Shared Decision-Making
Dale Collins Vidal, MDProfessor of Surgery, Geisel School of Medicine; Director, Center for Shared Decision Making, Dartmouth-Hitchcock
Much of the striking variation in the use of surgical procedures reported in this Dartmouth Atlas series can be attributed to differing physi-cian opinions about the value of one surgery over another, or a single surgical option compared to other treatments such as medication, active surveillance, or physical therapy. Each option can have different potential benefits as well as short and long-term side effects. For a given condition, any of the options may be a reasonable alternative. The decision is often further complicated by incomplete evidence regarding both benefit and harm.
It is particularly important to note that many informed patients have different perspectives than their physicians about the benefits and trade-offs of treatment options. The final choice of treatment should be made by patients who have been informed about the choices, including the pros and cons of each approach and any uncertainty about the evidence that supports each option. In addition, the health care team needs to help patients clarify their own goals and partner with patients to make joint decisions.
This process of engaging patients in decisions about their care is known as shared decision-making. Shared decision-making is a col-laborative process that allows patients and their providers to make health care treatment decisions together, taking into account the best scientific evidence available, as well as the patient’s values and preferences. The right choice for one patient may not be the same as the next. In this series, Dartmouth Atlas investigators will consider many clinical situations where there is no single “right” choice and highlight areas where shared decision-making may have an important role for patients with surgical conditions.

A DARTMOUTH ATLAS OF HEALTH CARE SERIES 9
In summary, this series of Atlas reports is intended to help patients, physicians, and policymakers recognize where improvements in science have helped to limit variation and improve surgical care; but more importantly, for each of the surgical conditions we study, we hope to identify specific clinical settings and situations where variation in the treatment of surgical condition remains, and outline the best opportunities for improvement in surgical care that lie ahead.
A Dartmouth Atlas of Health Care Series
10 vARIATION IN THE CASE OF SURGICAL CONDITIONS
References1. Wennberg DE, Birkmeyer JD, eds. The Dartmouth Atlas of Cardiovascular Health Care. American Hospital
Press, Chicago, IL: 1999.
2. Birkmeyer JD, Sharp SM, Finlayson SR, Fisher ES, Wennberg JE. Variation profiles of common surgical procedures. Surgery. 1998;124:917-923.
3. Endarterectomy for asymptomatic carotid artery stenosis. Executive Committee for the Asymptomatic Carotid Atherosclerosis Study. JAMA. 1991;273:1421-1428.
4. Wallaert JB, De Martino RR, Finlayson SR, Walsh DB, Corriere MA, Stone DH, Cronenwett JL, Goodney PP. Carotid endarterectomy in asymptomatic patients with limited life expectancy. Stroke. 2012;43:1781-1787.
5. Goodney PP, Travis LL, Malenka D, Bronner KK, Lucas FL, Cronenwett JL, Goodman DC, Fisher ES. Regional variation in carotid artery stenting and endarterectomy in the Medicare population. Circ Cardiovasc Qual Outcomes. 2010;3:15-24.
6. O’Connor GT, Plume SK, Olmstead EM, Coffin LH, Morton JR, Maloney CT, Nowicki ER, Tryzelaar JF, Hernandez F, Adrian L, et al. A regional prospective study of in-hospital mortality associated with coronary artery bypass grafting. The Northern New England Cardiovascular Disease Study Group. JAMA. 1991;266:803-809.
7. Cronenwett JL, Likosky DS, Russell MT, Eldrup-Jorgensen J, Stanley AC, Nolan BW. A regional registry for quality assurance and improvement: The Vascular Study Group of Northern New England (VSGNNE). J Vasc Surg. 2007;46:1093-1101.
8. Khuri SF, Daley J, Henderson W, Hur K, Demakis J, Aust JB, Chong V, Fabri PJ, Gibbs JO, Grover F, Hammermeister K, Irvin G, 3rd, McDonald G, Passaro E, Jr., Phillips L, Scamman F, Spencer J, Stremple JF. The Department of Veterans Affairs’ NSQIP: The first national, validated, outcome-based, risk-adjusted, and peer-controlled program for the measurement and enhancement of the quality of surgical care. National VA Surgical Quality Improvement Program. Annals of Surgery. 1998;228:491-507.
9. Flum DR, Fisher N, Thompson J, Marcus-Smith M, Florence M, Pellegrini CA. Washington state’s approach to variability in surgical processes/outcomes: Surgical Clinical Outcomes Assessment Program (SCOAP). Surgery. 2005;138:821-828.
: INTRODUCTION
A DARTMOUTH ATLAS OF HEALTH CARE SERIES 11
The burden of obesity in the United States
Obesity is now an epidemic in the United States. Currently, more than one-third of U.S. adults (35.7%) and one-sixth of U.S. children and adolescents (16.9%) are obese.1 Obesity substantially increases the risks of hypertension, dyslipidemia (high blood fats), heart disease, stroke, obstructive sleep apnea, type II diabetes, and osteoarthritis. It also increases the risks of endometrial, breast, prostate, and colon cancer, and is associated with higher mortality from all causes.2 The annual medical cost of obesity is striking; estimates have increased from $78.5 billion in 1998 to $147 billion in 2008, accounting for almost 10% of all medical spending.3
While many Americans attempt lifestyle modification and pharmacologic therapy to lose weight, these treatments are often unsuccessful and, on average, produce modest weight loss at best. While bariatric surgery—or modification of the digestive system to limit caloric intake—is invasive and has risks, it has been shown to reli-ably produce significant and sustainable weight loss in most patients.
This report discusses the growing problem of obesity in the U.S. population and shows different approaches to its treatment over time and by region. It focuses on the surgical treatment of obesity, including the decision to use surgery, the techni-cal quality of surgical care, and patient outcomes. The trends and regional variation presented in this report reflect a combination of factors: the rise of obesity rates; the development of new therapies, particularly less invasive and more effective surgi-cal techniques; and evolving policies related to safety and insurance coverage. Most importantly, regional variation raises questions about a lack of consensus within the medical community regarding the use of bariatric surgery and the role of patients in making fully informed decisions about their care. And finally, while prog-ress has been made in understanding the best ways to limit obesity using surgical and medical approaches, areas in need of further improvement are highlighted.
A Dartmouth Atlas of Health Care Series
12 vARIATION IN THE CASE OF SURGICAL CONDITIONS
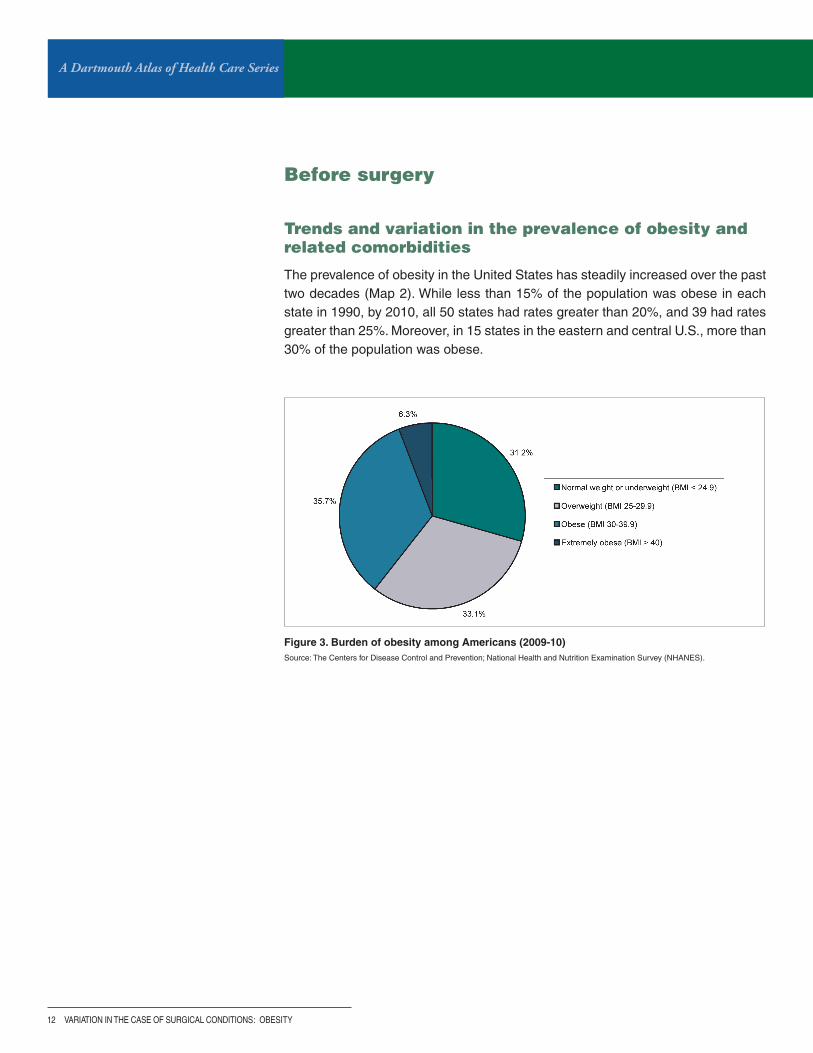
Figure 3. Burden of obesity among Americans (2009-10)Source: The Centers for Disease Control and Prevention; National Health and Nutrition Examination Survey (NHANES).
Before surgery
Trends and variation in the prevalence of obesity and related comorbidities
The prevalence of obesity in the United States has steadily increased over the past two decades (Map 2). While less than 15% of the population was obese in each state in 1990, by 2010, all 50 states had rates greater than 20%, and 39 had rates greater than 25%. Moreover, in 15 states in the eastern and central U.S., more than 30% of the population was obese.
: OBESITY

A DARTMOUTH ATLAS OF HEALTH CARE SERIES 13
Map 2. Obesity trends among U.S. adults
BMI ≥30, or about 30 lbs. overweight for 5’4” person.
Source: The Centers for Disease Control and Prevention; Behavioral Risk Factor Surveillance System (BRFSS).
Map 2A. 1990 Map 2B. 2000
Map 2C. 2010

A Dartmouth Atlas of Health Care Series
14 vARIATION IN THE CASE OF SURGICAL CONDITIONS
Figure 4. Percent of Medicare beneficia-ries with type II diabetes among hospital referral regions (2010-11)
Each blue dot represents the rate of type II diabetes in one of 306 hospital referral regions in the U.S. Red dots indicate the regions with the 5 lowest and 5 highest rates.
Per
cen
t o
f M
edic
are
ben
efici
arie
s w
ith
typ
e II
dia
bet
es
McAllen, TX 38.5%
Harlingen, TX 38.5%
Corpus Christi, TX 30.3%
Dearborn, MI 29.3%
Toledo, OH 29.0%
Fort Collins, CO 16.4%
San Mateo County, CA 16.3%
Santa Rosa, CA 15.6%
Boulder, CO 14.1%
Grand Junction, CO 14.1%
Just as rates of obesity differ across the United States, the rates of other illnesses associated with obesity also vary across the coun-try. For example, the incidence of type II diabetes varies across the United States (Figure 4), with the highest rates of diabetes evident in southeastern regions (Map 3), where rates of obesity are also high. The national average rate of type II diabetes dur-ing 2010-11 was 23%. Less than 15% of Medicare beneficiaries living in the Colorado hospital referral regions of Grand Junction (14.1%) and Boulder (14.1%) had type II diabetes during 2010-11. The incidence of type II diabetes was more than twice as high among Medicare beneficiaries living in the Texas hospital refer-ral regions of McAllen (38.5%), Harlingen (38.5%), and Corpus Christi (30.3%).
: OBESITY

A DARTMOUTH ATLAS OF HEALTH CARE SERIES 15
Map 3. Percent of Medicare beneficiaries with type II diabetes (2010-11)
Rates are adjusted for age, sex, and race.
A Dartmouth Atlas of Health Care Series
16 vARIATION IN THE CASE OF SURGICAL CONDITIONS
Treatment options and success rates
Treatments for obesity can be classified into medical and surgical therapies. Medi-cal therapies include lifestyle modification or medications that limit fat absorption, such as orlistat. The long-term effectiveness of these therapies is modest for most patients. Medical therapies generally lead to an initial loss of 3-10% of body weight,4-8 but sustained weight loss requires the indefinite continuation of therapy, which can be difficult for many patients.
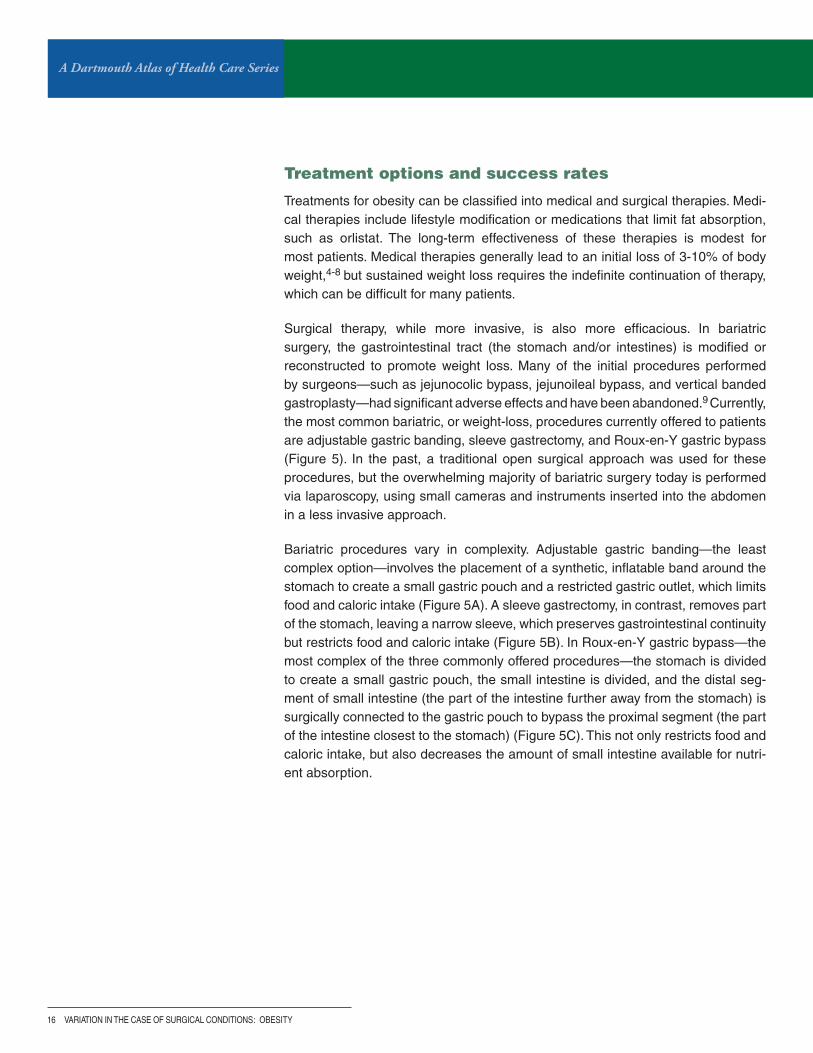
Surgical therapy, while more invasive, is also more efficacious. In bariatric surgery, the gastrointestinal tract (the stomach and/or intestines) is modified or reconstructed to promote weight loss. Many of the initial procedures performed by surgeons—such as jejunocolic bypass, jejunoileal bypass, and vertical banded gastroplasty—had significant adverse effects and have been abandoned.9 Currently, the most common bariatric, or weight-loss, procedures currently offered to patients are adjustable gastric banding, sleeve gastrectomy, and Roux-en-Y gastric bypass (Figure 5). In the past, a traditional open surgical approach was used for these procedures, but the overwhelming majority of bariatric surgery today is performed via laparoscopy, using small cameras and instruments inserted into the abdomen in a less invasive approach.
Bariatric procedures vary in complexity. Adjustable gastric banding—the least complex option—involves the placement of a synthetic, inflatable band around the stomach to create a small gastric pouch and a restricted gastric outlet, which limits food and caloric intake (Figure 5A). A sleeve gastrectomy, in contrast, removes part of the stomach, leaving a narrow sleeve, which preserves gastrointestinal continuity but restricts food and caloric intake (Figure 5B). In Roux-en-Y gastric bypass—the most complex of the three commonly offered procedures—the stomach is divided to create a small gastric pouch, the small intestine is divided, and the distal seg-ment of small intestine (the part of the intestine further away from the stomach) is surgically connected to the gastric pouch to bypass the proximal segment (the part of the intestine closest to the stomach) (Figure 5C). This not only restricts food and caloric intake, but also decreases the amount of small intestine available for nutri-ent absorption.
: OBESITY

A DARTMOUTH ATLAS OF HEALTH CARE SERIES 17
Figure 5. Three commonly performed bariatric proceduresSource: Caiazzo R, Pattou F. Adjustable gastric banding, sleeve gastrectomy or gastric bypass. Can evidence-based medicine help us to choose? J Visc Surg. (2013);150:85-95. Previously cited in: Caiazzo R, Arnalsteen L, Pattou F. Principes du traitement chirurgical de l’obésité sévère. Médecine des Maladies Métaboliques. (2008);2(5):468-472.
A. ADJUSTABLE GASTRIC BANDING B. SLEEVE GASTRECTOMY C. ROUX-EN-Y GASTRIC BYPASS
Relative Use
Performed in this country since 2001, it initially rose in popularity but has recently been surpassed by sleeve gastrectomy in the U.S.
Originally was a component of the duodenal switch procedure, has now gained in popularity as a stand-alone operation.
Among the most frequently used procedures in the U.S., accounting for a significant portion of the bariatric surgery performed in recent years.
Procedure Description
Involves the laparoscopic placement of an adjustable silicone band around the upper part of the stomach.
Involves removal of 85% of the stomach, leaving a tubular shaped stomach.
Involves the use of a stapler to create a small gastric pouch and a length of resected bowel to bypass a portion of the digestive tract.
Weight Loss Mechanism
Limits the amount of food that can be eaten at any one time and slows rate of emptying from the stomach to the intestines.
Limits the amount of food that can be eaten at any one time and secretion of hormones that cause hunger.
Restricts both the intake and the absorption of food.
Procedure Reversible?
Fully reversible with band. Not reversible. Not easily or fully reversible.
Numerous reviews of bariatric surgery outcomes report that substantial and sus-tained weight loss can be achieved following surgery in most study patients.10-13
Further, a majority of bariatric surgery patients experience complete resolution of many weight-related comorbidities, including diabetes, hypertension, hyperlipid-emia, and obstructive sleep apnea. Patients have also reported improvements in their quality of life, especially in aspects such as depression, functional status, and self-esteem.
A Dartmouth Atlas of Health Care Series
18 vARIATION IN THE CASE OF SURGICAL CONDITIONS
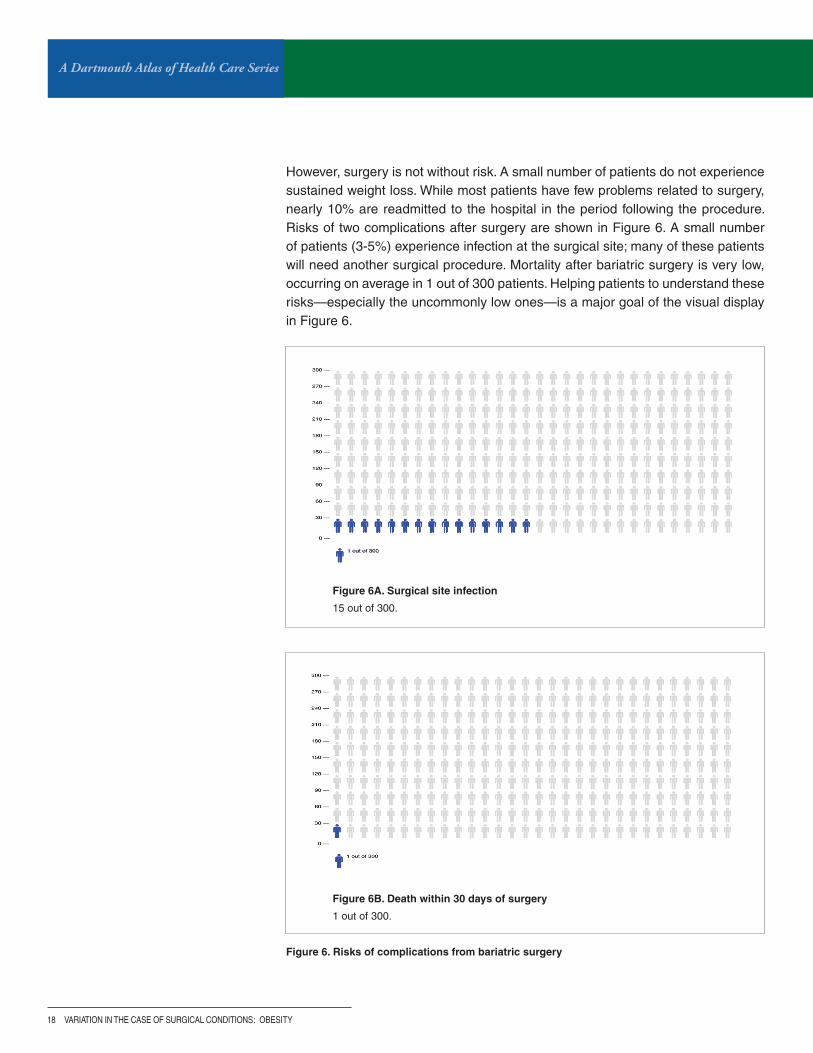
Figure 6. Risks of complications from bariatric surgery
Figure 6A. Surgical site infection
15 out of 300.
Figure 6B. Death within 30 days of surgery
1 out of 300.
However, surgery is not without risk. A small number of patients do not experience sustained weight loss. While most patients have few problems related to surgery, nearly 10% are readmitted to the hospital in the period following the procedure. Risks of two complications after surgery are shown in Figure 6. A small number of patients (3-5%) experience infection at the surgical site; many of these patients will need another surgical procedure. Mortality after bariatric surgery is very low, occurring on average in 1 out of 300 patients. Helping patients to understand these risks—especially the uncommonly low ones—is a major goal of the visual display in Figure 6.
: OBESITY

A DARTMOUTH ATLAS OF HEALTH CARE SERIES 19
Reaching the right decision
Bariatric surgery is not always the best choice for treating obesity. Some patients do not feel that their weight is a problem or may not want to take steps to lose weight. Some patients prefer medical therapy and are successful in maintaining their weight loss. For other patients, their expectations of improvement in physical or emotional health resulting from surgery may not be realistic, or their concurrent medical problems may increase the risk of death or another adverse outcome. Bariatric surgery programs and insurers usually require that patients undergo a supervised course of medical therapy before considering surgery. Physical and psychological screenings are also necessary, and some programs require that patients take a knowledge exam to demonstrate that they understand the likely benefits and possible risks. The latter is particularly important because most bar-iatric surgery patients have a poor understanding of the outcomes.
When bariatric surgery is medically appropriate, the next question is whether it is the right choice for a patient. Arriving at an informed, high-quality decision involves three requirements: 1) the patient receives balanced information in a format that is understandable; 2) the patient has the opportunity to clarify his or her values and preferences related to the options; and 3) the patient is invited into the decision-making process. Together, this process is known as shared decision-making and is often facilitated by decision aids.

A Dartmouth Atlas of Health Care Series
20 vARIATION IN THE CASE OF SURGICAL CONDITIONS
A growing body of literature, including numerous publications from the Dartmouth Institute of Health Policy and Clinical Practice, supports the use of decision aids and shared decision-making for preference-sensitive surgical decisions.14,15 The decision faced by morbidly obese patients considering elective bariatric surgery is complex and must take into account numerous factors: patient preferences, pro-cedure characteristics, surgical risks, surgeon experience, insurance coverage,
Figure 7. Conceptual model for novel bariatric surgery decision support tool
To learn more about the Michigan Bariatric Surgery Collaborative initiative, please visit umchop.org/programs/mbsc.html.
and potential for success. Given this complexity, patients can easily become over-whelmed with information. As a result, decision support tools are ideally suited for patients considering bariatric surgery. Previous evaluations of decision aids in this population have reported significant improvements in knowledge, value concor-dance, decisional conflict, decisional self-efficacy, and treatment choice.16 Decision aids typically provide a broad range of information to patients, including discussion of potential treatment options (diet-based, medical therapies, and surgical treat-ments), and offer shared decision-making as a tool to improve decision quality.
: OBESITY
A DARTMOUTH ATLAS OF HEALTH CARE SERIES 21
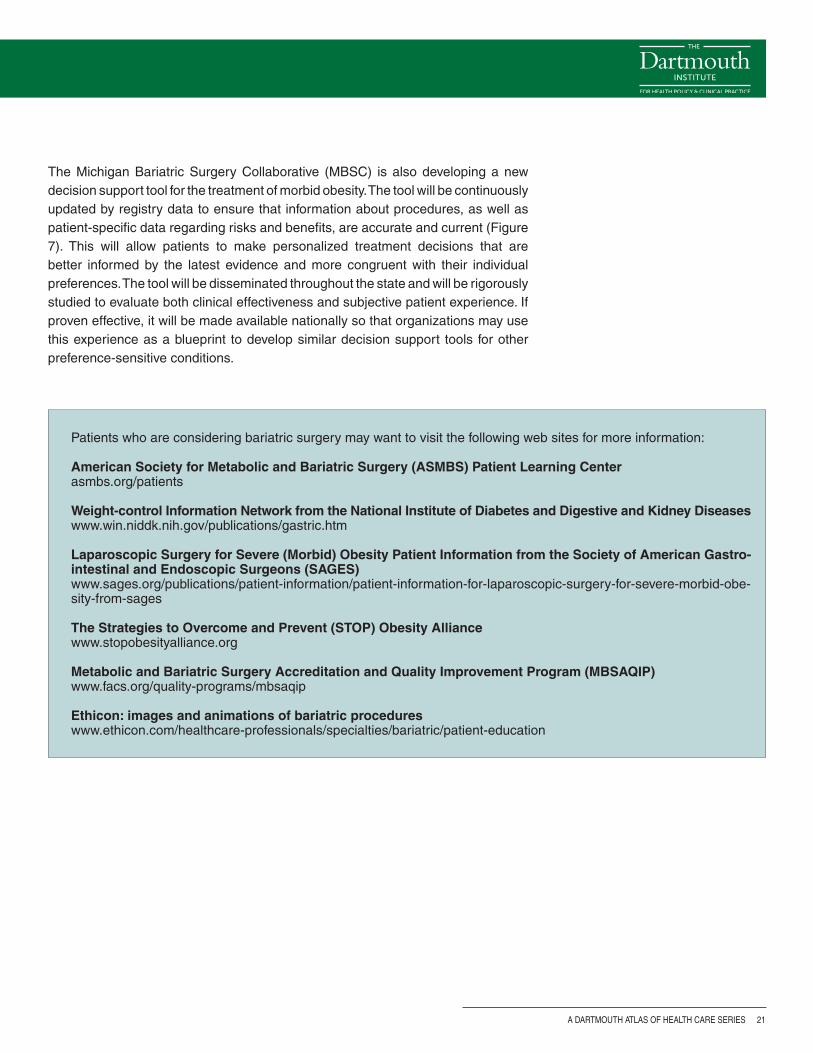
The Michigan Bariatric Surgery Collaborative (MBSC) is also developing a new decision support tool for the treatment of morbid obesity. The tool will be continuously updated by registry data to ensure that information about procedures, as well as patient-specific data regarding risks and benefits, are accurate and current (Figure 7). This will allow patients to make personalized treatment decisions that are better informed by the latest evidence and more congruent with their individual preferences. The tool will be disseminated throughout the state and will be rigorously studied to evaluate both clinical effectiveness and subjective patient experience. If proven effective, it will be made available nationally so that organizations may use this experience as a blueprint to develop similar decision support tools for other preference-sensitive conditions.
Patients who are considering bariatric surgery may want to visit the following web sites for more information:
American Society for Metabolic and Bariatric Surgery (ASMBS) Patient Learning Centerasmbs.org/patients
Weight-control Information Network from the National Institute of Diabetes and Digestive and Kidney Diseaseswww.win.niddk.nih.gov/publications/gastric.htm
Laparoscopic Surgery for Severe (Morbid) Obesity Patient Information from the Society of American Gastro-intestinal and Endoscopic Surgeons (SAGES)www.sages.org/publications/patient-information/patient-information-for-laparoscopic-surgery-for-severe-morbid-obe-sity-from-sages
The Strategies to Overcome and Prevent (STOP) Obesity Alliancewww.stopobesityalliance.org
Metabolic and Bariatric Surgery Accreditation and Quality Improvement Program (MBSAQIP)www.facs.org/quality-programs/mbsaqip
Ethicon: images and animations of bariatric procedureswww.ethicon.com/healthcare-professionals/specialties/bariatric/patient-education

A Dartmouth Atlas of Health Care Series
22 vARIATION IN THE CASE OF SURGICAL CONDITIONS
During surgery
Choosing surgical care, and the type of surgical care
The patient and his or her physician must choose not only whether or not to pro-ceed with surgery, but also the specific procedure that is best for the patient. Procedure choice is influenced by several factors: the patient’s preferences, pro-cedure availability, insurance coverage, the surgeon’s preference, and the current evidence regarding a procedure’s clinical effectiveness. The risk of complications and potential for weight loss also differ with each procedure and change over time. As outcomes research has developed, information about surgical outcomes has become essential to inform patient and provider preferences. Historic and current trends in bariatric procedure utilization reflect the evolution of these factors.
Trends in utilization
The rise in rates of obesity, along with increasing interest in surgical options, has resulted in a dramatic increase in utilization of bariatric surgery in recent years. Figure 8 illustrates the increasing utilization of bariatric surgery from 2001 to 2011. The national average rate of bariatric surgery increased nearly sixfold between 1990 and 2000, and this rise has continued through 2011.17,18 Moreover, the shift in surgical approach from more invasive open procedures (more than 85% of all bariatric surgery in 2000) to a less invasive laparoscopic approach (more than 90% of all bariatric surgery in 2008) over the decade led to a further striking increase in utilization. Rates of overall procedure use reached a high of nearly 40 per 100,000 Medicare patients in 2009.19
Figure 8. Bariatric surgery utilization trends among Medicare beneficiaries (2001-11)
Bar
iatr
ic s
urg
ery
per
100
,000
M
edic
are
ben
efici
arie
s
Year
: OBESITY
A DARTMOUTH ATLAS OF HEALTH CARE SERIES 23
The choice of procedure also shifted during this 20-year period. As gastric bypass gained popularity, increasing from 55% of all bariatric procedures in 1990 to 99% in 2003, vertical banded gastroplasty fell out of favor, decreasing from more than 40% to 7% during the same period.18-20
Additional changes in utilization during this decade reflected emerging research in support of novel procedures and the policy changes that followed. The Food and Drug Administration approved adjustable gastric banding for use in the United States in 2001 following multiple reports of successful outcomes in Europe and Australia.21,22
In the ensuing years, utilization of adjustable gastric banding grew substantially due to its ease of reversibility, adjustability, and overall safety profile.23-25

A Dartmouth Atlas of Health Care Series
24 vARIATION IN THE CASE OF SURGICAL CONDITIONS
Bar
iatr
ic s
urg
ery
per
100
,000
Med
icar
e b
enefi
ciar
ies
Muskegon, MI 110.9
Kettering, OH 83.7
Marquette, MI 77.7
Great Falls, MT 75.3
Bend, OR 73.9
Alameda County, CA 9.3
Cedar Rapids, IA 9.3
Santa Rosa, CA 8.4
San Mateo County, CA 7.9
San Francisco, CA 4.0
Policy influence on procedure utilization
Based on the growing body of literature supporting bariatric surgery as a treatment for morbidly obese patients, the Centers for Medicare & Medicaid Services (CMS) announced in 2006 that gastric bypass, laparoscopic adjustable gastric banding, and biliopancreatic diversion with duodenal switch would be covered for Medicare patients meeting certain criteria.26 Though overall rates of bariatric surgery had started to decline after 2004, this expansion of coverage increased the availabil-ity and use of these procedures. Between 2005 and 2010, as the popularity of adjustable gastric banding grew, the relative utilization of gastric bypass slowly decreased. In 2008, laparoscopic gastric bypass accounted for 69% of all bariatric procedures, while laparoscopic adjustable gastric banding accounted for 29%.19
Laparoscopic sleeve gastrectomy was introduced to the field in 2003. Select private insurers began to cover the procedure in the years following, although CMS chose not to cover the procedure until 2006. This increased insurance coverage was fol-lowed by the rise in utilization observed in Figure 8. During this same period, new research on adjustable gastric banding reported increased late complications and high long-term failure rates (poor weight loss and band removal),27,28 and conse-quently, utilization of adjustable gastric banding decreased.
Figure 9. Bariatric surgery among 100,000 Medicare beneficiaries among hospital referral regions (2007-11)
Each blue dot represents the rate of bariatric surgery in one of 306 hospital referral regions in the U.S. Red dots indicate the regions with the 5 lowest and 5 highest rates.
: OBESITY
A DARTMOUTH ATLAS OF HEALTH CARE SERIES 25
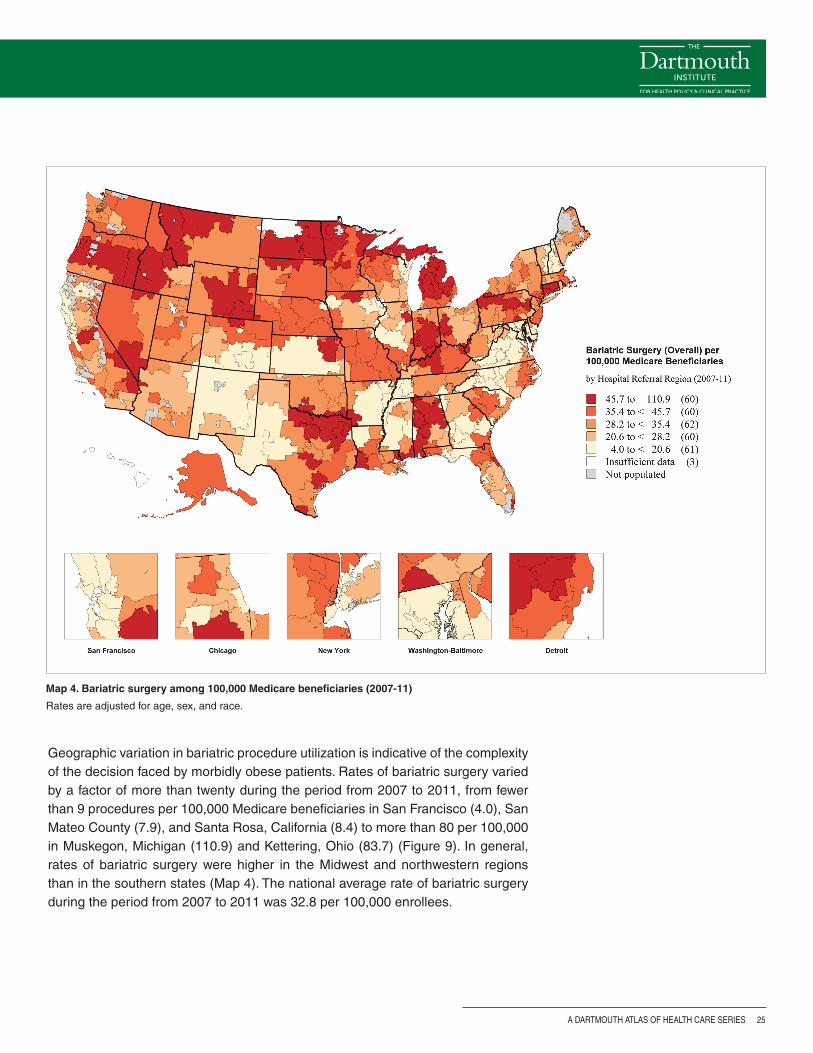
Map 4. Bariatric surgery among 100,000 Medicare beneficiaries (2007-11)
Rates are adjusted for age, sex, and race.
Geographic variation in bariatric procedure utilization is indicative of the complexity of the decision faced by morbidly obese patients. Rates of bariatric surgery varied by a factor of more than twenty during the period from 2007 to 2011, from fewer than 9 procedures per 100,000 Medicare beneficiaries in San Francisco (4.0), San Mateo County (7.9), and Santa Rosa, California (8.4) to more than 80 per 100,000 in Muskegon, Michigan (110.9) and Kettering, Ohio (83.7) (Figure 9). In general, rates of bariatric surgery were higher in the Midwest and northwestern regions than in the southern states (Map 4). The national average rate of bariatric surgery during the period from 2007 to 2011 was 32.8 per 100,000 enrollees.
A Dartmouth Atlas of Health Care Series
26 vARIATION IN THE CASE OF SURGICAL CONDITIONS
Figure 10A. Relationship between obesity rates and bariatric surgery among hospital referral regions
Each dot represents one of the 306 hospital referral regions across the United States. Regional rates of obesity and diabetes were unrelated to rates of bariatric surgery. Obesity rates were estimated using data from the Centers for Disease Control and Prevention.
Figure 10B. Relationship between type II diabetes and bariatric surgery among hospital referral regions
Obesity rate (2010)
Bar
iatr
ic s
urg
ery
per
100
,000
Med
icar
e b
enefi
ciar
ies
(200
7-11
)
Percent of Medicare beneficiaries with type II diabetes (2010-11)
Bar
iatr
ic s
urg
ery
per
100
,000
M
edic
are
ben
efici
arie
s (2
007-
11)
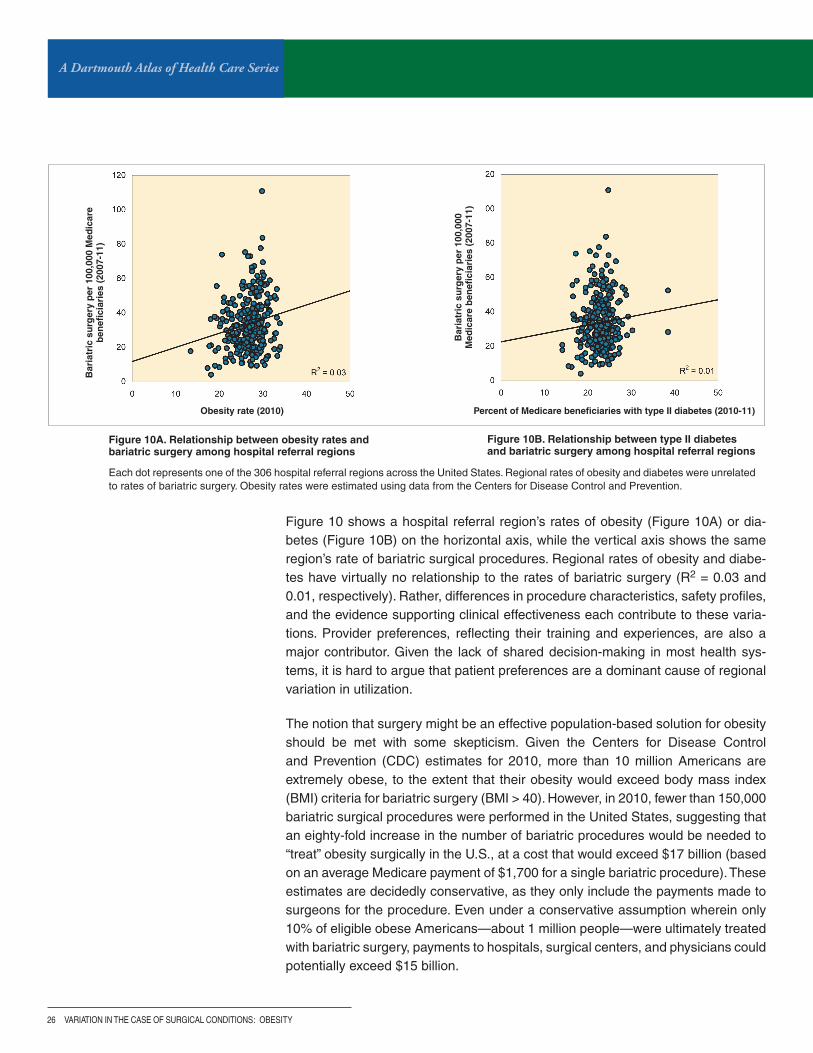
Figure 10 shows a hospital referral region’s rates of obesity (Figure 10A) or dia-betes (Figure 10B) on the horizontal axis, while the vertical axis shows the same region’s rate of bariatric surgical procedures. Regional rates of obesity and diabe-tes have virtually no relationship to the rates of bariatric surgery (R2 = 0.03 and 0.01, respectively). Rather, differences in procedure characteristics, safety profiles, and the evidence supporting clinical effectiveness each contribute to these varia-tions. Provider preferences, reflecting their training and experiences, are also a major contributor. Given the lack of shared decision-making in most health sys-tems, it is hard to argue that patient preferences are a dominant cause of regional variation in utilization.
The notion that surgery might be an effective population-based solution for obesity should be met with some skepticism. Given the Centers for Disease Control and Prevention (CDC) estimates for 2010, more than 10 million Americans are extremely obese, to the extent that their obesity would exceed body mass index (BMI) criteria for bariatric surgery (BMI > 40). However, in 2010, fewer than 150,000 bariatric surgical procedures were performed in the United States, suggesting that an eighty-fold increase in the number of bariatric procedures would be needed to “treat” obesity surgically in the U.S., at a cost that would exceed $17 billion (based on an average Medicare payment of $1,700 for a single bariatric procedure). These estimates are decidedly conservative, as they only include the payments made to surgeons for the procedure. Even under a conservative assumption wherein only 10% of eligible obese Americans—about 1 million people—were ultimately treated with bariatric surgery, payments to hospitals, surgical centers, and physicians could potentially exceed $15 billion.
: OBESITY

A DARTMOUTH ATLAS OF HEALTH CARE SERIES 27
Year
Per
cen
t o
f b
aria
tric
pro
ced
ure
s
Using regional collaboratives to study comparative effectiveness
Our knowledge about the relative effectiveness of different bariatric procedures is incomplete. For example, randomized trials comparing gastric bypass to sleeve gastrectomy are limited to small, single-center studies with short follow-up inter-vals, and the results may not apply to the general obese population.29-36 Most large observational studies utilize administrative data limited to perioperative peri-ods, examine nonspecific surgical outcomes, and often lag behind current practice. Observational studies with longer follow-up periods—that report detailed bariat-ric surgery-specific clinical risk factors and outcomes—are usually single-center studies. As a result, uncertainty remains regarding the outcomes associated with certain patients. Within the state of Michigan, however, a unique environment exists to allow for more detailed evaluation of these issues.
The Michigan Bariatric Surgery Collaborative (MBSC), formed in 2006, is a voluntary regional consortium of all surgeons who perform bariatric surgery and the hospitals where it is performed within the state. The timely collection and distribution of MBSC data—along with detailed bariatric-specific risk factors and outcomes—allows for a more accurate understanding of current trends in the utilization, safety, and effectiveness of bariatric procedures. For example, trends in procedure utilization in Michigan over time parallel those seen nationally. Figure 11 illustrates the utilization
Figure 11. Trends in utilization of gastric bypass, adjustable gastric banding, and sleeve gastrectomy in Michigan (2006-12)
BPD/DS = biliopancreatic diversion with duodenal switch. AGB = adjustable gastric banding. RYBG = Roux-en-Y gastric bypass. Source: Michigan Bariatric Surgery Collaborative.
of gastric bypass, adjustable gastric banding, and sleeve gastrectomy in Michigan during the period from 2006 to 2012. In 2006, gastric bypass accounted for 61% of all bariatric surgery in the state, and adjustable gastric banding accounted for 37%. Utilization of sleeve gastrectomy began in 2007 and increased rapidly in the ensuing years, while rates of gastric bypass decreased moderately and rates of adjustable gastric banding decreased substantially. In 2012, 45% of bariatric procedures performed in Michigan were sleeve gastrectomies, while 43% were gastric bypasses, and only 11% were adjustable gastric banding procedures.
A Dartmouth Atlas of Health Care Series
28 vARIATION IN THE CASE OF SURGICAL CONDITIONS
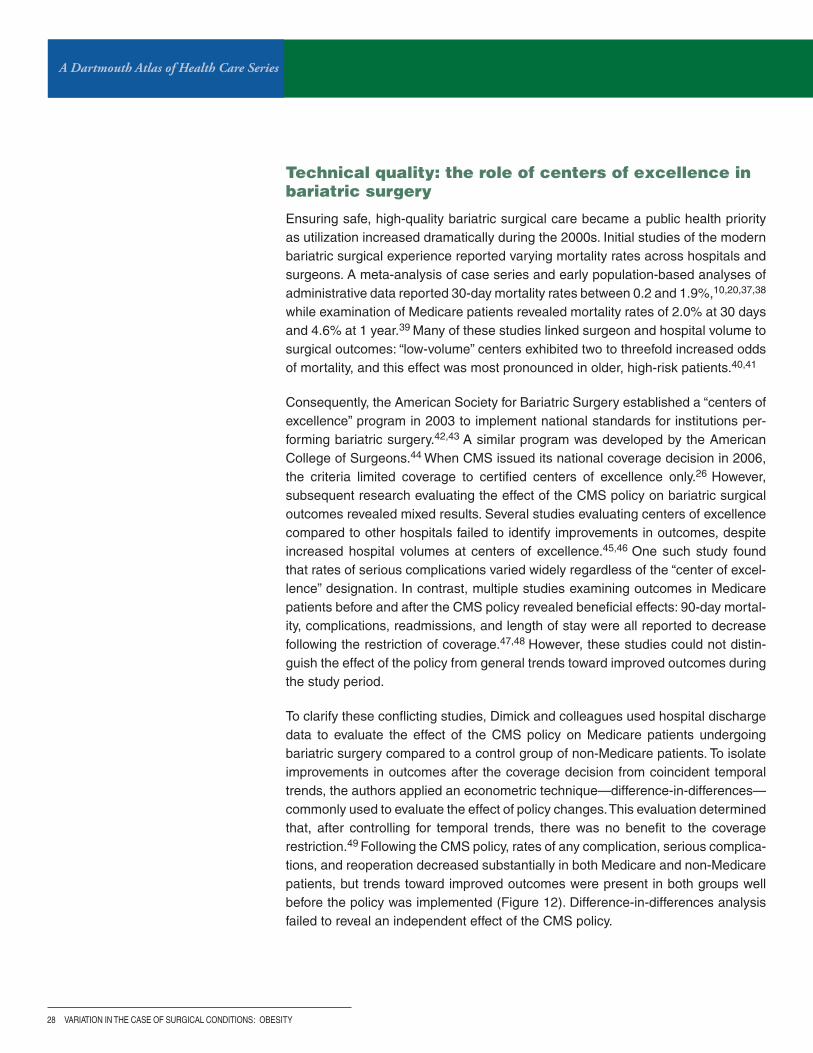
Technical quality: the role of centers of excellence in bariatric surgery
Ensuring safe, high-quality bariatric surgical care became a public health priority as utilization increased dramatically during the 2000s. Initial studies of the modern bariatric surgical experience reported varying mortality rates across hospitals and surgeons. A meta-analysis of case series and early population-based analyses of administrative data reported 30-day mortality rates between 0.2 and 1.9%,10,20,37,38 while examination of Medicare patients revealed mortality rates of 2.0% at 30 days and 4.6% at 1 year.39 Many of these studies linked surgeon and hospital volume to surgical outcomes: “low-volume” centers exhibited two to threefold increased odds of mortality, and this effect was most pronounced in older, high-risk patients.40,41
Consequently, the American Society for Bariatric Surgery established a “centers of excellence” program in 2003 to implement national standards for institutions per-forming bariatric surgery.42,43 A similar program was developed by the American College of Surgeons.44 When CMS issued its national coverage decision in 2006, the criteria limited coverage to certified centers of excellence only.26 However, subsequent research evaluating the effect of the CMS policy on bariatric surgical outcomes revealed mixed results. Several studies evaluating centers of excellence compared to other hospitals failed to identify improvements in outcomes, despite increased hospital volumes at centers of excellence.45,46 One such study found that rates of serious complications varied widely regardless of the “center of excel-lence” designation. In contrast, multiple studies examining outcomes in Medicare patients before and after the CMS policy revealed beneficial effects: 90-day mortal-ity, complications, readmissions, and length of stay were all reported to decrease following the restriction of coverage.47,48 However, these studies could not distin-guish the effect of the policy from general trends toward improved outcomes during the study period.
To clarify these conflicting studies, Dimick and colleagues used hospital discharge data to evaluate the effect of the CMS policy on Medicare patients undergoing bariatric surgery compared to a control group of non-Medicare patients. To isolate improvements in outcomes after the coverage decision from coincident temporal trends, the authors applied an econometric technique—difference-in-differences—commonly used to evaluate the effect of policy changes. This evaluation determined that, after controlling for temporal trends, there was no benefit to the coverage restriction.49 Following the CMS policy, rates of any complication, serious complica-tions, and reoperation decreased substantially in both Medicare and non-Medicare patients, but trends toward improved outcomes were present in both groups well before the policy was implemented (Figure 12). Difference-in-differences analysis failed to reveal an independent effect of the CMS policy.
: OBESITY

A DARTMOUTH ATLAS OF HEALTH CARE SERIES 29
Figure 12. Trends in adverse outcomes before and after the implementation of the Centers for Medicare & Medicaid Services bariatric surgery national coverage decision
Each data marker represents two quarters within each year. The national policy restricting coverage to centers of excellence was implemented starting in the first quarter of 2006.
Time, y Time, y Time, y
Per
cen
tag
eP
erce
nta
ge
Per
cen
tag
e
Per
cen
tag
e
Figure 12A. Any complication Figure 12B. Serious complications Figure 12C. Reoperation
Though this evaluation failed to identify a benefit of the CMS policy, subsequent analyses demonstrated restrictions to access, particularly among minority benefi-ciaries.50 While rates of bariatric surgery remained stable among non-Medicare minorities, rates in Medicare minority patients declined by 17% after the February 2006 national coverage decision. Publication of these findings had a substantial impact on CMS policy. In September of 2013, CMS decided to eliminate the “facil-ity certification requirement,” allowing beneficiaries fulfilling appropriate criteria to pursue bariatric surgery at the institution of their choice.51,52
These examples of policy change clearly illustrate the importance of outcomes research to the field of bariatric surgery. Patients and providers have all benefited from the ongoing evaluation of bariatric surgical quality and access to care. Future health services research must build on these successes through continued evalu-ation of current techniques, surgical outcomes, systems of care, and health policy.
A Dartmouth Atlas of Health Care Series
30 vARIATION IN THE CASE OF SURGICAL CONDITIONS
After surgeryNew attention has been focused on the events that follow surgery, especially among patients undergoing surgical care for obesity. Hospital readmission rates are care-fully scrutinized, as are events that occur after discharge, such as close follow-up with primary care physicians or the surgical team itself. Tables 3 and 4 show the variations in readmission risk and in follow-up with a primary care physician for Medicare patients treated with surgical therapy for obesity. The national average 30-day readmission rate following bariatric surgery was 8.3% during 2007-11; dur-ing that same period, on average, 39.5% of patients had a follow-up visit with a primary care physician within 30 days of bariatric surgery.
However, several pertinent outcomes of bariatric surgery in Medicare patients remain undefined: how much weight they lose, their functional health status, and their satisfaction with their care and outcomes. Nearly every randomized trial has studied weight loss as an outcome, yet this outcome is not routinely available at long-term follow-up in large studies of aged Medicare patients using claims data. Patient-centered outcomes, such as satisfaction with the procedure and the level of functional improvement after the operation, remain incompletely described. Study-ing these important outcomes remains a target for physicians and policymakers across the United States.
: OBESITY

A DARTMOUTH ATLAS OF HEALTH CARE SERIES 31
Table 3. Percent of Medicare beneficiaries readmitted within 30 days following bariatric surgery by hospital referral region (2007-11)
HRR State Percent readmitted within 30 days following bariatric surgery (2007-11)
10 highest HRRs
Cleveland OH 13.3%
Orlando FL 13.0%
Oklahoma City OK 10.8%
Boston MA 10.7%
Nashville TN 10.2%
Fort Lauderdale FL 10.0%
Minneapolis MN 9.9%
Knoxville TN 9.8%
St. Louis MO 9.5%
New Haven CT 9.5%
10 lowest HRRs
Manhattan NY 7.2%
Columbus OH 7.2%
East Long Island NY 7.1%
Los Angeles CA 6.9%
Grand Rapids MI 6.9%
Allentown PA 6.9%
Jacksonville FL 6.6%
Hartford CT 6.1%
Birmingham AL 4.8%
San Antonio TX 4.3%
Table 4. Percent of Medicare beneficiaries having a primary care visit within 30 days following bariatric surgery by hospital referral region (2007-11)
HRR State Percent having primary care visit within 30 days following bariatric surgery (2007-11)
10 highest HRRs
Danville PA 78.6%
Muskegon MI 70.9%
Flint MI 70.1%
McAllen TX 63.5%
Omaha NE 62.8%
Royal Oak MI 60.9%
Saginaw MI 59.9%
Dearborn MI 59.2%
Sarasota FL 57.6%
Marshfield WI 57.0%
10 lowest HRRs
Rochester MN 27.3%
Greeley CO 27.2%
Manchester NH 27.1%
Bronx NY 27.0%
Elmira NY 26.3%
Shreveport LA 25.8%
Oklahoma City OK 24.8%
Lafayette LA 23.4%
Wichita Falls TX 20.1%
Fort Smith AR 19.5%
The tables show the hospital referral regions with the 10 highest and 10 lowest rates for clinical events following discharge after bariatric surgery.

A Dartmouth Atlas of Health Care Series
32 vARIATION IN THE CASE OF SURGICAL CONDITIONS
Beyond surgery
Spending on surgery – or spending on prevention?
Nationally, health care costs related to bariatric surgery were estimated at just under a billion dollars in 2002 and had grown to nearly $3 billion by 2011. While the surgical treatment of obesity is efficacious, this clinical effectiveness comes at a relatively steep price, and extrapolation of this treatment to the true “epidemic” of obesity would come at an impractical and implausible cost.
Should we spend our efforts—and financial resources—on alternatives to surgery for patients with obesity? Progress has been made in preventing childhood obesity; a recent CDC report showed that childhood obesity rates declined in 19 of the 43 states where obesity prevention programs were introduced.53 Many might argue that directing some of the resources currently allocated to surgical care toward pre-venting childhood obesity might have more impact. How resources are—or should be—allocated between preventive measures aimed at younger obese Americans and surgical treatment of older patients remains an open question.
Using quality improvement to limit variation
While the examples above illustrate improved outcomes for patients undergoing bariatric surgery—and the vital role health services research has played—opportu-nities for continued improvement exist. Wide variations persist in hospital processes, surgical outcomes, and procedure utilization despite these improvements. Patients considering bariatric surgery are faced with complex decisions and can become overloaded with information. In addition to these issues, current health care reform efforts require providers at all levels to increase quality of care while simultaneous-ly decreasing costs. Going forward, there is no doubt that health services research will be essential to continued improvements in outcomes and quality.
Within the Michigan Bariatric Surgery Collaborative (MBSC), research is currently under way to better understand these challenges and develop novel strategies for quality improvement. Numerous publications have highlighted the benefits of region-al quality collaboratives.46,54-57 Collaboratives have been shown to lead to decreased complications, mortality, resource utilization, and costs. For bariatric surgery, the MBSC provides an example of the success that can be achieved through regional quality collaboratives: the standardization of venous thromboembolism (VTE) pro-phylaxis in MBSC hospitals.58 After evaluation of VTE prophylaxis regimens revealed wide variations across MBSC hospitals in 2008, the collaborative used registry data to develop a VTE risk-prediction tool and identify optimal prophylaxis strategies for each risk cohort. This and other examples illustrate how further improvements for bariatric surgery patients can be achieved on a national scale.
: OBESITY

A DARTMOUTH ATLAS OF HEALTH CARE SERIES 33
Decision aids and shared decision-making
As described previously, decision support tools can be valuable aids for patients considering bariatric surgery. The MBSC’s work developing a new decision support tool for the treatment of morbid obesity (Figure 7) will allow patients to make per-sonalized treatment decisions that are better informed by the current evidence and more congruent with their individual preferences.
ConclusionsDespite many achievements in treating obesity, future work is needed to determine the outcomes of treatment choices in terms that are meaningful to patients. These efforts, which will likely emanate from regional quality improvement initiatives, will focus on weight loss, functional status, cost effectiveness, and other patient-centered outcomes to ensure that the significant expenditures on surgical care for obese patients in the United States provide the most return on this investment.
Health services research is playing a critical role in advancing the field of treatment for obesity and bariatric surgery. Publications reporting on new techniques, surgical outcomes, and the impact of policy decisions have influenced procedure utilization over time, improved insurance coverage, and resulted in better access to surgical care for obese patients. Better evaluation of these treatments remains a priority, along with the incorporation of the findings into shared decision-making.

A Dartmouth Atlas of Health Care Series
34 vARIATION IN THE CASE OF SURGICAL CONDITIONS
Methods
In this report, we examined secular trends in the rates of obesity, diabetes, bariatric surgery, and outcomes following bariatric surgery at the level of the hospital referral region (HRR). To accomplish this, we studied all patients with evidence of diagnos-tic codes for these conditions (diabetes and obesity), as well as procedure codes indicative of bariatric procedures. We also used data from the Centers for Disease Control and Prevention to establish HRR-level rates of obesity. All diagnostic codes indicative of diabetes and the procedure codes indicating bariatric surgery proce-dures are shown in Table A.
Table A. Codes used to identify patients with type II diabetes and bariatric surgery
Measure Codes Inclusion/exclusion criteria
Type II diabetes*
ICD-9 diagnosis codes 250, 357.2, 362.0, 366.41, 648.0
Beneficiary must be enrolled in Medicare Parts A & B for at least 11 months during the year and at year end. Diabetic diagnosis must be noted in at least two outpatient or one inpatient physician encounter(s).
CPT visit codes: Outpatient: 92002-92014, 99201-99205, 99211-99215, 99217-99220, 99241-99245, 99341-99345, 99347-99350, 99384-99387, 99394-99397, 99401-99404, 99411, 99412, 99420, 99429, 99455, 99456 Non-acute inpatient: 99304-99310, 99315, 99316, 99318, 99324-99328, 99334-99337 Acute inpatient: 99221-99223, 99231-99233, 99238, 99239, 99251-99255, 99291 Emergency department: 99281-99285
Revenue center codes: Outpatient: 051x, 0520-0523,0526-0529, 057x-059x, 082x-085x, 088x, 0982, 0983 Non-acute inpatient: 0118, 0128, 0138, 0148, 0158, 019x, 0524, 0525, 055x, 066x Acute inpatient: 010x, 0110-0114, 0119, 0120-0124, 0129, 0130-0134, 0139, 0140-0144, 0149, 0150-0154, 0159, 016x, 020x,021x, 072x, 080x, 0987 Emergency department: 045x, 0981
Bariatric surgery
Gastric bypassICD-9 procedure codes 44.3, 44.31, 44.38, 44.39
Primary/secondary diagnosis of morbid obesity (ICD-9 codes 278.0, 278.00, 278.01, v77.8) and DRG code for weight loss surgery (DRG 288: MSDRG 619-621)
CPT codes 43846, 43847, 43644, 43645, 43844, 43659, S2085
Adjustable gastric banding ICD-9 procedure code 44.95
CPT codes 43770, S2082
Other procedure ICD-9 procedure codes 43.89, 43.82, 44.68, 45.51, 45.9
CPT codes 43842, 43843, 43845, 43775
*2011 Healthcare Effectiveness Data and Information Set (HEDIS) definition from the National Committee for Quality Assurance
: OBESITY

A DARTMOUTH ATLAS OF HEALTH CARE SERIES 35
After establishing our inclusion criteria, we examined the incidence of each event over time between 2001 and 2011. We assessed rates by each year individually. The numerator for calculating the crude rates consisted of the number of proce-dures in each year selected as described above; the denominator consisted of the number of beneficiaries eligible as of June 30 for each year (a mid-year denomina-tor). These rates were adjusted for changes in age, sex, and race occurring over time using the population during the year 2001 as the standard population.
After defining the rates of bariatric procedures over time, we assessed differences in outcomes. We used t-tests to compare rates between regions, and non-paramet-ric tests of trend were used to test significance across years; p values <0.05 were considered significant. All analysis was performed using SAS (SAS Institute, Cary, NC), and STATA (College Station, TX). To learn more about Dartmouth Atlas meth-ods, please visit www.dartmouthatlas.org.
A Dartmouth Atlas of Health Care Series
36 vARIATION IN THE CASE OF SURGICAL CONDITIONS
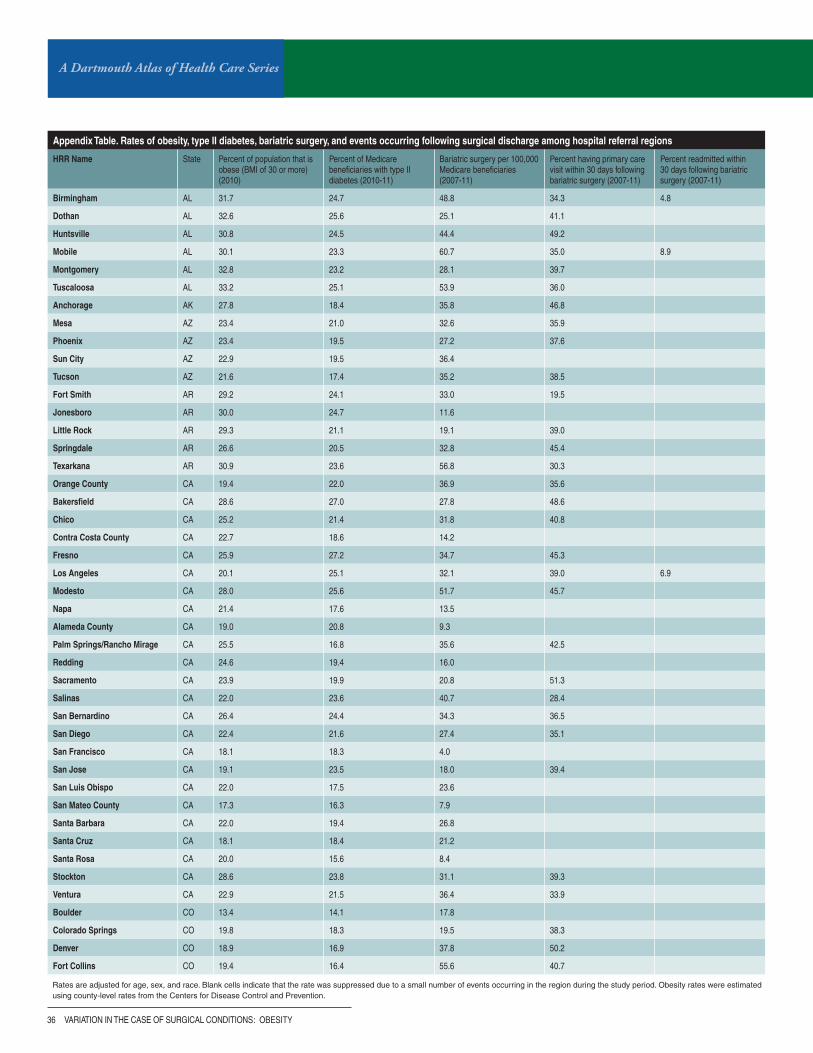
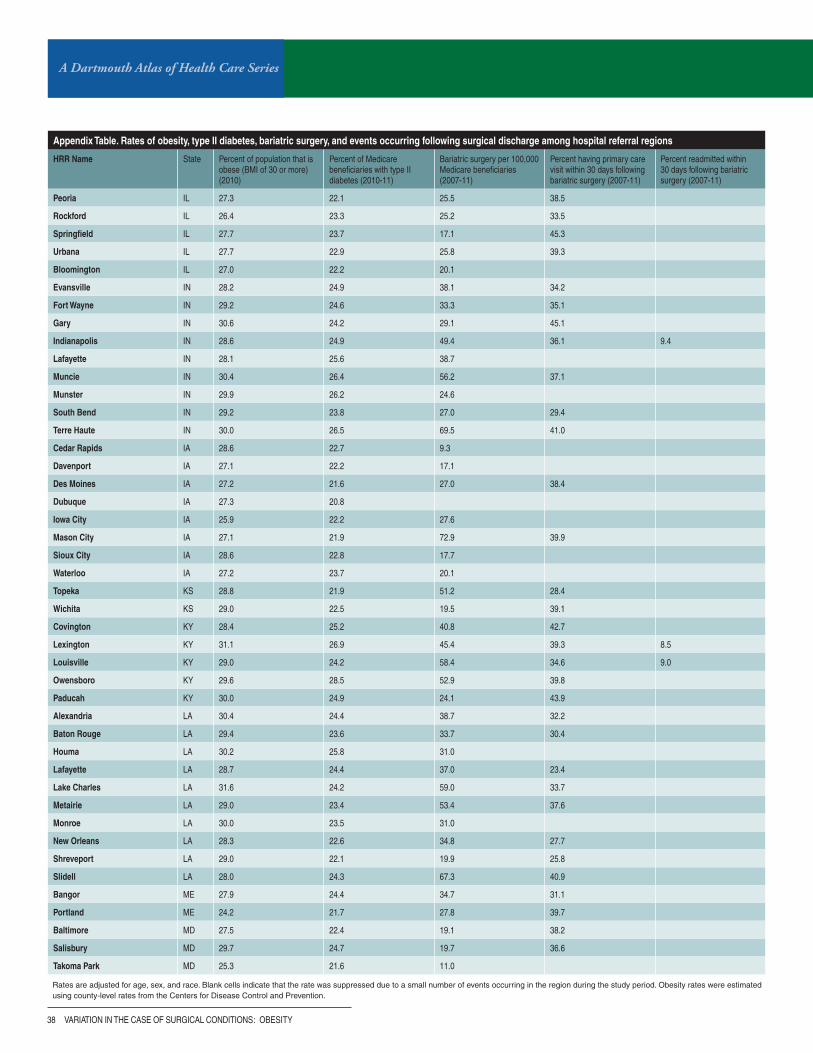
Rates are adjusted for age, sex, and race. Blank cells indicate that the rate was suppressed due to a small number of events occurring in the region during the study period. Obesity rates were estimated using county-level rates from the Centers for Disease Control and Prevention.
Appendix Table. Rates of obesity, type II diabetes, bariatric surgery, and events occurring following surgical discharge among hospital referral regions
HRR Name State Percent of population that is obese (BMI of 30 or more) (2010)
Percent of Medicare beneficiaries with type II diabetes (2010-11)
Bariatric surgery per 100,000 Medicare beneficiaries (2007-11)
Percent having primary care visit within 30 days following bariatric surgery (2007-11)
Percent readmitted within 30 days following bariatric surgery (2007-11)
Birmingham AL 31.7 24.7 48.8 34.3 4.8
Dothan AL 32.6 25.6 25.1 41.1
Huntsville AL 30.8 24.5 44.4 49.2
Mobile AL 30.1 23.3 60.7 35.0 8.9
Montgomery AL 32.8 23.2 28.1 39.7
Tuscaloosa AL 33.2 25.1 53.9 36.0
Anchorage AK 27.8 18.4 35.8 46.8
Mesa AZ 23.4 21.0 32.6 35.9
Phoenix AZ 23.4 19.5 27.2 37.6
Sun City AZ 22.9 19.5 36.4
Tucson AZ 21.6 17.4 35.2 38.5
Fort Smith AR 29.2 24.1 33.0 19.5
Jonesboro AR 30.0 24.7 11.6
Little Rock AR 29.3 21.1 19.1 39.0
Springdale AR 26.6 20.5 32.8 45.4
Texarkana AR 30.9 23.6 56.8 30.3
Orange County CA 19.4 22.0 36.9 35.6
Bakersfield CA 28.6 27.0 27.8 48.6
Chico CA 25.2 21.4 31.8 40.8
Contra Costa County CA 22.7 18.6 14.2
Fresno CA 25.9 27.2 34.7 45.3
Los Angeles CA 20.1 25.1 32.1 39.0 6.9
Modesto CA 28.0 25.6 51.7 45.7
Napa CA 21.4 17.6 13.5
Alameda County CA 19.0 20.8 9.3
Palm Springs/Rancho Mirage CA 25.5 16.8 35.6 42.5
Redding CA 24.6 19.4 16.0
Sacramento CA 23.9 19.9 20.8 51.3
Salinas CA 22.0 23.6 40.7 28.4
San Bernardino CA 26.4 24.4 34.3 36.5
San Diego CA 22.4 21.6 27.4 35.1
San Francisco CA 18.1 18.3 4.0
San Jose CA 19.1 23.5 18.0 39.4
San Luis Obispo CA 22.0 17.5 23.6
San Mateo County CA 17.3 16.3 7.9
Santa Barbara CA 22.0 19.4 26.8
Santa Cruz CA 18.1 18.4 21.2
Santa Rosa CA 20.0 15.6 8.4
Stockton CA 28.6 23.8 31.1 39.3
Ventura CA 22.9 21.5 36.4 33.9
Boulder CO 13.4 14.1 17.8
Colorado Springs CO 19.8 18.3 19.5 38.3
Denver CO 18.9 16.9 37.8 50.2
Fort Collins CO 19.4 16.4 55.6 40.7
: OBESITY
A DARTMOUTH ATLAS OF HEALTH CARE SERIES 37
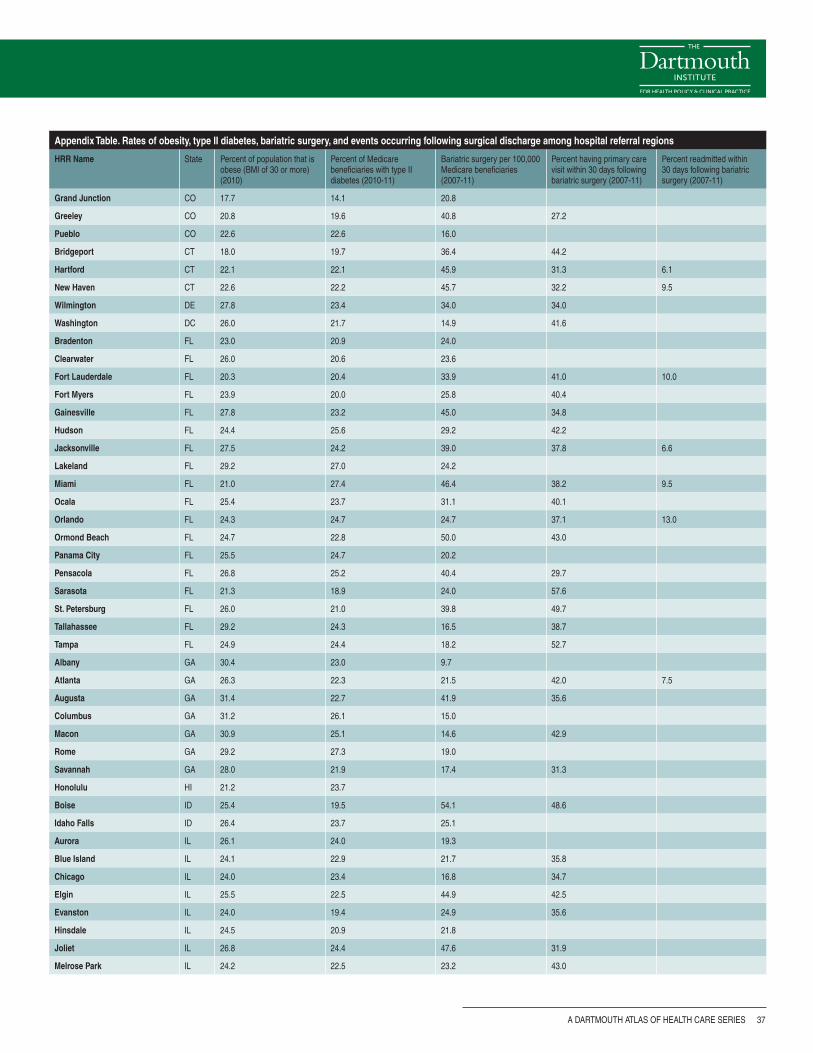
Appendix Table. Rates of obesity, type II diabetes, bariatric surgery, and events occurring following surgical discharge among hospital referral regions
HRR Name State Percent of population that is obese (BMI of 30 or more) (2010)
Percent of Medicare beneficiaries with type II diabetes (2010-11)
Bariatric surgery per 100,000 Medicare beneficiaries (2007-11)
Percent having primary care visit within 30 days following bariatric surgery (2007-11)
Percent readmitted within 30 days following bariatric surgery (2007-11)
Grand Junction CO 17.7 14.1 20.8
Greeley CO 20.8 19.6 40.8 27.2
Pueblo CO 22.6 22.6 16.0
Bridgeport CT 18.0 19.7 36.4 44.2
Hartford CT 22.1 22.1 45.9 31.3 6.1
New Haven CT 22.6 22.2 45.7 32.2 9.5
Wilmington DE 27.8 23.4 34.0 34.0
Washington DC 26.0 21.7 14.9 41.6
Bradenton FL 23.0 20.9 24.0
Clearwater FL 26.0 20.6 23.6
Fort Lauderdale FL 20.3 20.4 33.9 41.0 10.0
Fort Myers FL 23.9 20.0 25.8 40.4
Gainesville FL 27.8 23.2 45.0 34.8
Hudson FL 24.4 25.6 29.2 42.2
Jacksonville FL 27.5 24.2 39.0 37.8 6.6
Lakeland FL 29.2 27.0 24.2
Miami FL 21.0 27.4 46.4 38.2 9.5
Ocala FL 25.4 23.7 31.1 40.1
Orlando FL 24.3 24.7 24.7 37.1 13.0
Ormond Beach FL 24.7 22.8 50.0 43.0
Panama City FL 25.5 24.7 20.2
Pensacola FL 26.8 25.2 40.4 29.7
Sarasota FL 21.3 18.9 24.0 57.6
St. Petersburg FL 26.0 21.0 39.8 49.7
Tallahassee FL 29.2 24.3 16.5 38.7
Tampa FL 24.9 24.4 18.2 52.7
Albany GA 30.4 23.0 9.7
Atlanta GA 26.3 22.3 21.5 42.0 7.5
Augusta GA 31.4 22.7 41.9 35.6
Columbus GA 31.2 26.1 15.0
Macon GA 30.9 25.1 14.6 42.9
Rome GA 29.2 27.3 19.0
Savannah GA 28.0 21.9 17.4 31.3
Honolulu HI 21.2 23.7
Boise ID 25.4 19.5 54.1 48.6
Idaho Falls ID 26.4 23.7 25.1
Aurora IL 26.1 24.0 19.3
Blue Island IL 24.1 22.9 21.7 35.8
Chicago IL 24.0 23.4 16.8 34.7
Elgin IL 25.5 22.5 44.9 42.5
Evanston IL 24.0 19.4 24.9 35.6
Hinsdale IL 24.5 20.9 21.8
Joliet IL 26.8 24.4 47.6 31.9
Melrose Park IL 24.2 22.5 23.2 43.0
A Dartmouth Atlas of Health Care Series
38 vARIATION IN THE CASE OF SURGICAL CONDITIONS
Appendix Table. Rates of obesity, type II diabetes, bariatric surgery, and events occurring following surgical discharge among hospital referral regions
HRR Name State Percent of population that is obese (BMI of 30 or more) (2010)
Percent of Medicare beneficiaries with type II diabetes (2010-11)
Bariatric surgery per 100,000 Medicare beneficiaries (2007-11)
Percent having primary care visit within 30 days following bariatric surgery (2007-11)
Percent readmitted within 30 days following bariatric surgery (2007-11)
Peoria IL 27.3 22.1 25.5 38.5
Rockford IL 26.4 23.3 25.2 33.5
Springfield IL 27.7 23.7 17.1 45.3
Urbana IL 27.7 22.9 25.8 39.3
Bloomington IL 27.0 22.2 20.1
Evansville IN 28.2 24.9 38.1 34.2
Fort Wayne IN 29.2 24.6 33.3 35.1
Gary IN 30.6 24.2 29.1 45.1
Indianapolis IN 28.6 24.9 49.4 36.1 9.4
Lafayette IN 28.1 25.6 38.7
Muncie IN 30.4 26.4 56.2 37.1
Munster IN 29.9 26.2 24.6
South Bend IN 29.2 23.8 27.0 29.4
Terre Haute IN 30.0 26.5 69.5 41.0
Cedar Rapids IA 28.6 22.7 9.3
Davenport IA 27.1 22.2 17.1
Des Moines IA 27.2 21.6 27.0 38.4
Dubuque IA 27.3 20.8
Iowa City IA 25.9 22.2 27.6
Mason City IA 27.1 21.9 72.9 39.9
Sioux City IA 28.6 22.8 17.7
Waterloo IA 27.2 23.7 20.1
Topeka KS 28.8 21.9 51.2 28.4
Wichita KS 29.0 22.5 19.5 39.1
Covington KY 28.4 25.2 40.8 42.7
Lexington KY 31.1 26.9 45.4 39.3 8.5
Louisville KY 29.0 24.2 58.4 34.6 9.0
Owensboro KY 29.6 28.5 52.9 39.8
Paducah KY 30.0 24.9 24.1 43.9
Alexandria LA 30.4 24.4 38.7 32.2
Baton Rouge LA 29.4 23.6 33.7 30.4
Houma LA 30.2 25.8 31.0
Lafayette LA 28.7 24.4 37.0 23.4
Lake Charles LA 31.6 24.2 59.0 33.7
Metairie LA 29.0 23.4 53.4 37.6
Monroe LA 30.0 23.5 31.0
New Orleans LA 28.3 22.6 34.8 27.7
Shreveport LA 29.0 22.1 19.9 25.8
Slidell LA 28.0 24.3 67.3 40.9
Bangor ME 27.9 24.4 34.7 31.1
Portland ME 24.2 21.7 27.8 39.7
Baltimore MD 27.5 22.4 19.1 38.2
Salisbury MD 29.7 24.7 19.7 36.6
Takoma Park MD 25.3 21.6 11.0
Rates are adjusted for age, sex, and race. Blank cells indicate that the rate was suppressed due to a small number of events occurring in the region during the study period. Obesity rates were estimated using county-level rates from the Centers for Disease Control and Prevention.
: OBESITY

A DARTMOUTH ATLAS OF HEALTH CARE SERIES 39
Appendix Table. Rates of obesity, type II diabetes, bariatric surgery, and events occurring following surgical discharge among hospital referral regions
HRR Name State Percent of population that is obese (BMI of 30 or more) (2010)
Percent of Medicare beneficiaries with type II diabetes (2010-11)
Bariatric surgery per 100,000 Medicare beneficiaries (2007-11)
Percent having primary care visit within 30 days following bariatric surgery (2007-11)
Percent readmitted within 30 days following bariatric surgery (2007-11)
Boston MA 22.1 21.5 39.3 37.7 10.7
Springfield MA 24.6 23.1 24.4 42.9
Worcester MA 23.8 22.5 32.8 39.1
Ann Arbor MI 29.6 23.3 42.1 55.0 7.8
Dearborn MI 33.2 29.3 37.2 59.2
Detroit MI 31.4 25.1 41.5 54.2 7.3
Flint MI 33.0 25.3 48.2 70.1
Grand Rapids MI 28.2 23.6 54.7 43.4 6.9
Kalamazoo MI 28.9 23.9 35.5 41.5
Lansing MI 29.5 24.4 52.9 43.6
Marquette MI 29.5 22.6 77.7 54.9
Muskegon MI 29.8 24.7 110.9 70.9
Petoskey MI 29.8 23.5 57.4 45.8
Pontiac MI 26.0 22.7 48.1 48.8
Royal Oak MI 26.3 23.2 45.7 60.9
Saginaw MI 31.0 25.1 51.0 59.9
St. Joseph MI 28.9 23.6 28.1
Traverse City MI 28.7 23.2 61.6 41.1
Duluth MN 26.3 20.7 55.4 35.5
Minneapolis MN 25.6 19.0 41.7 39.3 9.9
Rochester MN 27.3 19.3 34.9 27.3
St. Cloud MN 27.2 19.5 51.4
St. Paul MN 26.3 19.4 36.7 45.3
Gulfport MS 31.0 23.3 46.4 33.8
Hattiesburg MS 33.9 24.6 34.0 34.9
Jackson MS 33.7 22.7 18.6 37.6
Meridian MS 34.0 24.5 20.3
Oxford MS 33.0 23.5 28.2
Tupelo MS 31.8 24.9 23.9 33.8
Cape Girardeau MO 29.8 26.7 36.1 51.1
Columbia MO 29.3 23.2 44.9 42.3
Joplin MO 30.2 24.7 21.7 46.9
Kansas City MO 28.9 22.4 44.0 41.0 7.5
Springfield MO 29.0 22.1 37.9 37.9
St. Louis MO 28.9 23.8 43.5 39.9 9.5
Billings MT 23.9 17.8 28.4 44.3
Great Falls MT 25.9 20.5 75.3 27.5
Missoula MT 21.1 16.6 49.0 43.0
Lincoln NE 27.9 20.9 45.5 54.4
Omaha NE 28.1 21.4 38.4 62.8
Las Vegas Nv 25.2 22.0 56.2 32.8 7.8
Reno Nv 22.8 16.6 38.6 38.4
Lebanon NH 25.1 19.4 10.7
Manchester NH 24.2 21.1 18.8 27.1
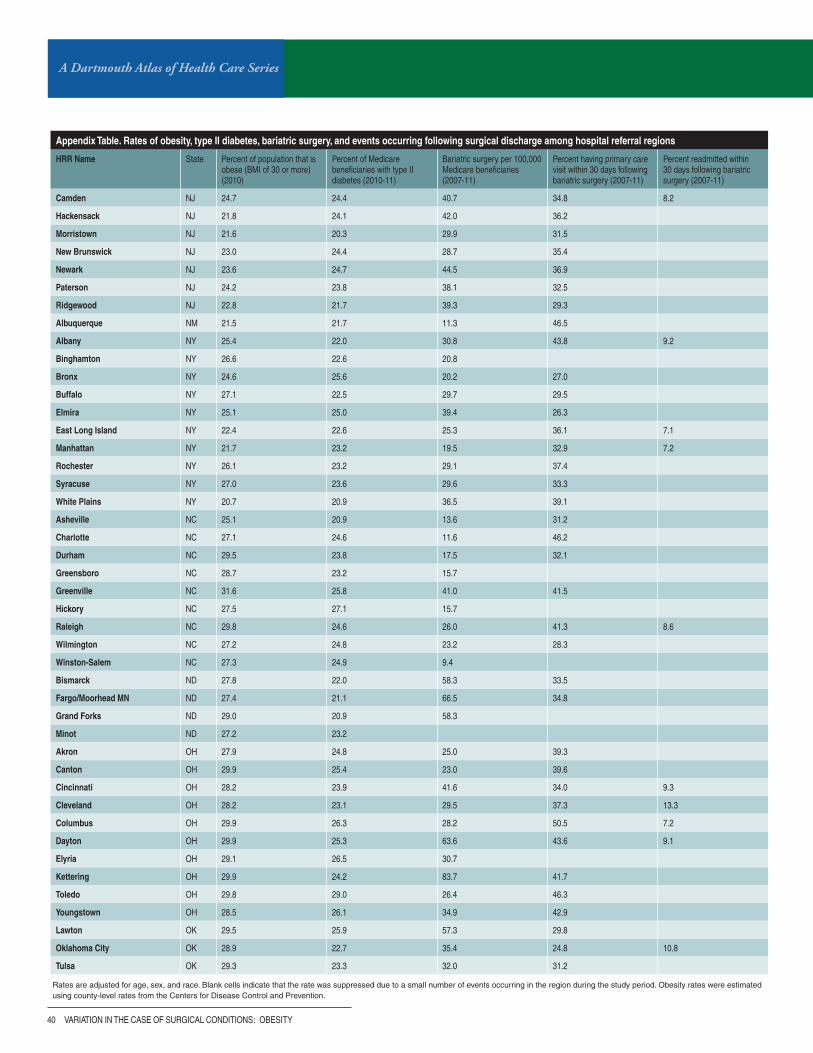
A Dartmouth Atlas of Health Care Series
40 vARIATION IN THE CASE OF SURGICAL CONDITIONS
Appendix Table. Rates of obesity, type II diabetes, bariatric surgery, and events occurring following surgical discharge among hospital referral regions
HRR Name State Percent of population that is obese (BMI of 30 or more) (2010)
Percent of Medicare beneficiaries with type II diabetes (2010-11)
Bariatric surgery per 100,000 Medicare beneficiaries (2007-11)
Percent having primary care visit within 30 days following bariatric surgery (2007-11)
Percent readmitted within 30 days following bariatric surgery (2007-11)
Camden NJ 24.7 24.4 40.7 34.8 8.2
Hackensack NJ 21.8 24.1 42.0 36.2
Morristown NJ 21.6 20.3 29.9 31.5
New Brunswick NJ 23.0 24.4 28.7 35.4
Newark NJ 23.6 24.7 44.5 36.9
Paterson NJ 24.2 23.8 38.1 32.5
Ridgewood NJ 22.8 21.7 39.3 29.3
Albuquerque NM 21.5 21.7 11.3 46.5
Albany NY 25.4 22.0 30.8 43.8 9.2
Binghamton NY 26.6 22.6 20.8
Bronx NY 24.6 25.6 20.2 27.0
Buffalo NY 27.1 22.5 29.7 29.5
Elmira NY 25.1 25.0 39.4 26.3
East Long Island NY 22.4 22.6 25.3 36.1 7.1
Manhattan NY 21.7 23.2 19.5 32.9 7.2
Rochester NY 26.1 23.2 29.1 37.4
Syracuse NY 27.0 23.6 29.6 33.3
White Plains NY 20.7 20.9 36.5 39.1
Asheville NC 25.1 20.9 13.6 31.2
Charlotte NC 27.1 24.6 11.6 46.2
Durham NC 29.5 23.8 17.5 32.1
Greensboro NC 28.7 23.2 15.7
Greenville NC 31.6 25.8 41.0 41.5
Hickory NC 27.5 27.1 15.7
Raleigh NC 29.8 24.6 26.0 41.3 8.6
Wilmington NC 27.2 24.8 23.2 28.3
Winston-Salem NC 27.3 24.9 9.4
Bismarck ND 27.8 22.0 58.3 33.5
Fargo/Moorhead MN ND 27.4 21.1 66.5 34.8
Grand Forks ND 29.0 20.9 58.3
Minot ND 27.2 23.2
Akron OH 27.9 24.8 25.0 39.3
Canton OH 29.9 25.4 23.0 39.6
Cincinnati OH 28.2 23.9 41.6 34.0 9.3
Cleveland OH 28.2 23.1 29.5 37.3 13.3
Columbus OH 29.9 26.3 28.2 50.5 7.2
Dayton OH 29.9 25.3 63.6 43.6 9.1
Elyria OH 29.1 26.5 30.7
Kettering OH 29.9 24.2 83.7 41.7
Toledo OH 29.8 29.0 26.4 46.3
Youngstown OH 28.5 26.1 34.9 42.9
Lawton OK 29.5 25.9 57.3 29.8
Oklahoma City OK 28.9 22.7 35.4 24.8 10.8
Tulsa OK 29.3 23.3 32.0 31.2
Rates are adjusted for age, sex, and race. Blank cells indicate that the rate was suppressed due to a small number of events occurring in the region during the study period. Obesity rates were estimated using county-level rates from the Centers for Disease Control and Prevention.
: OBESITY

A DARTMOUTH ATLAS OF HEALTH CARE SERIES 41
Appendix Table. Rates of obesity, type II diabetes, bariatric surgery, and events occurring following surgical discharge among hospital referral regions
HRR Name State Percent of population that is obese (BMI of 30 or more) (2010)
Percent of Medicare beneficiaries with type II diabetes (2010-11)
Bariatric surgery per 100,000 Medicare beneficiaries (2007-11)
Percent having primary care visit within 30 days following bariatric surgery (2007-11)
Percent readmitted within 30 days following bariatric surgery (2007-11)
Bend OR 20.6 17.2 73.9 37.7
Eugene OR 27.5 20.4 64.4 43.7
Medford OR 24.1 19.3 33.0 39.9
Portland OR 25.8 20.1 41.0 36.0 7.5
Salem OR 30.2 21.5 62.0
Allentown PA 27.2 24.8 54.9 45.2 6.9
Altoona PA 29.4 27.2 34.3
Danville PA 27.3 25.7 55.9 78.6
Erie PA 29.2 24.9 54.6 54.0
Harrisburg PA 28.3 24.9 38.6 44.7
Johnstown PA 30.0 25.6 29.4
Lancaster PA 25.9 23.2 22.0
Philadelphia PA 25.5 20.9 24.0 42.3 8.2
Pittsburgh PA 27.4 23.2 30.7 39.7 9.4
Reading PA 27.8 24.3 36.0 42.9
Sayre PA 28.4 24.1 39.9
Scranton PA 25.6 23.7 24.6
Wilkes-Barre PA 27.1 24.8 27.4
York PA 28.7 24.9 49.9 55.0
Providence RI 23.1 22.3 23.6 39.3
Charleston SC 28.9 22.7 33.7 35.6
Columbia SC 31.1 23.5 39.7 37.2 7.3
Florence SC 32.6 25.4 19.0
Greenville SC 26.2 23.8 30.3 29.2
Spartanburg SC 29.8 23.5 43.8 30.7
Rapid City SD 26.7 18.5 29.0
Sioux Falls SD 27.8 20.4 37.7 43.7
Chattanooga TN 29.2 25.8 19.5 43.1
Jackson TN 30.7 25.7 13.0
Johnson City TN 28.8 24.2 27.5
Kingsport TN 29.3 27.5 25.1 42.6
Knoxville TN 29.5 25.9 35.4 45.2 9.8
Memphis TN 33.3 23.2 15.0 37.5
Nashville TN 29.7 24.5 30.8 48.6 10.2
Abilene TX 26.6 22.0 29.1
Amarillo TX 27.5 20.2 23.1
Austin TX 23.1 21.4 48.1 34.7
Beaumont TX 29.7 26.1 34.5 41.8
Bryan TX 26.6 22.1 28.8
Corpus Christi TX 26.9 30.3 29.2 41.8
Dallas TX 26.9 22.6 55.8 36.8 8.4
El Paso TX 23.9 27.4 25.2 33.3
Fort Worth TX 26.6 24.2 47.5 36.6 8.2
Harlingen TX 26.1 38.5 28.3

A Dartmouth Atlas of Health Care Series
42 vARIATION IN THE CASE OF SURGICAL CONDITIONS
Appendix Table. Rates of obesity, type II diabetes, bariatric surgery, and events occurring following surgical discharge among hospital referral regions
HRR Name State Percent of population that is obese (BMI of 30 or more) (2010)
Percent of Medicare beneficiaries with type II diabetes (2010-11)
Bariatric surgery per 100,000 Medicare beneficiaries (2007-11)
Percent having primary care visit within 30 days following bariatric surgery (2007-11)
Percent readmitted within 30 days following bariatric surgery (2007-11)
Houston TX 26.5 22.7 41.7 28.9 7.3
Longview TX 29.1 22.9 49.8 36.8
Lubbock TX 26.7 23.8 17.0 36.0
McAllen TX 28.5 38.5 52.5 63.5
Odessa TX 27.3 23.4 9.7
San Angelo TX 26.6 24.1 18.1
San Antonio TX 26.3 26.9 30.1 36.3 4.3
Temple TX 27.5 24.2 31.1 40.4
Tyler TX 27.5 23.2 64.2 32.5
Victoria TX 27.6 28.0 54.3
Waco TX 30.3 22.8 30.1
Wichita Falls TX 26.6 24.8 72.9 20.1
Ogden UT 25.0 23.1 31.9
Provo UT 24.8 21.7 36.5
Salt Lake City UT 23.9 20.4 32.5 38.5
Burlington vT 23.5 22.6 24.7 28.8
Arlington vA 23.2 18.6 12.2 42.7
Charlottesville vA 26.4 23.6 16.7
Lynchburg vA 28.4 24.0 14.2
Newport News vA 29.5 21.8 23.6 35.5
Norfolk vA 27.6 24.6 32.7 40.3
Richmond vA 28.2 22.6 20.5 42.1
Roanoke vA 27.6 25.5 12.8 41.6
Winchester vA 29.6 24.2 21.3
Everett WA 27.0 19.7 36.8 46.5
Olympia WA 29.2 19.9 28.6 30.8
Seattle WA 22.8 18.7 30.7 43.8 9.5
Spokane WA 26.7 21.2 37.1 36.3 9.4
Tacoma WA 29.0 21.1 33.6 41.3
Yakima WA 28.1 23.4 27.9
Charleston Wv 31.1 28.0 33.0 32.6
Huntington Wv 32.7 28.8 49.9 36.4
Morgantown Wv 30.0 26.4 23.8 56.6
Appleton WI 27.4 22.8 24.2
Green Bay WI 27.8 22.2 19.9
La Crosse WI 27.0 20.7 31.0
Madison WI 26.3 20.5 22.9 30.7
Marshfield WI 28.0 22.3 39.9 57.0
Milwaukee WI 27.7 21.9 26.7 33.4 8.2
Neenah WI 26.9 22.0 31.8
Wausau WI 27.6 21.8 42.7
Casper WY 25.5 17.4 58.2 50.1
United States average 25.9 23.0 32.8 39.5 8.3
Rates are adjusted for age, sex, and race. Blank cells indicate that the rate was suppressed due to a small number of events occurring in the region during the study period. Obesity rates were estimated using county-level rates from the Centers for Disease Control and Prevention.
: OBESITY

A DARTMOUTH ATLAS OF HEALTH CARE SERIES 43
References1. Adult Obesity Facts. Overweight and Obesity. August 16th, 2013; http://www.cdc.gov/obesity/data/adult.
html. Accessed November 12th, 2013.
2. Clinical Guidelines on the Identification, Evaluation, and Treatment of Overweight and Obesity in Adults: The Evidence Report. NHLBI Obesity Education Initiative Expert Panel on the Identification, Evaluation, and Treatment of Obesity in Adults (US). Bethesda (MD): National Heart, Lung, and Blood Institute; 1998 Sep.
3. Finkelstein EA, Trogdon JG, Cohen JW, Dietz W. Annual medical spending attributable to obesity: Payer-and service-specific estimates. Health Affairs. 2009;28(5):w822-w831.
4. Hainer V, Toplak H, Mitrakou A. Treatment modalities of obesity: What fits whom? Diabetes Care. 2008;31(Supplement 2):S269-S277.
5. Tsai AG, Wadden TA. Systematic review: An evaluation of major commercial weight loss programs in the United States. Ann Intern Med. Jan 4 2005;142(1):56-66.
6. Ritter S, Vetter M, Sarwer D. Lifestyle modifications and surgical options in the treatment of patients with obesity and type 2 diabetes mellitus. Postgraduate Medicine. 2012;124(4):168-180.
7. Li Z, Maglione M, Tu W, et al. Meta-analysis: Pharmacologic treatment of obesity. Ann Intern Med. Apr 5 2005;142(7):532-546.
8. Holes-Lewis KA, Malcolm R, O’Neil PM. Pharmacotherapy of obesity. Am J Med Sci. 2013;345(4):284-288.
9. Moshiri M, Osman S, Robinson TJ, Khandelwal S, Bhargava P, Rohrmann CA. Evolution of bariatric surgery: A historical perspective. Am J Roentgenol. 2013;201(1):W40-W48.
10. Buchwald H, Avidor Y, Braunwald E, et al. Bariatric surgery: A systematic review and meta-analysis. JAMA. Oct 13 2004;292(14):1724-1737.
11. Ferchak CV, Meneghini LF. Obesity, bariatric surgery and type 2 diabetes--A systematic review. Diabetes Metab Res Rev. Nov-Dec 2004;20(6):438-445.
12. Shah M, Simha V, Garg A. Review: Long-term impact of bariatric surgery on body weight, comorbidities, and nutritional status. J Clin Endocrinol Metab. Nov 2006;91(11):4223-4231.
13. Buchwald H, Estok R, Fahrbach K, et al. Weight and type 2 diabetes after bariatric surgery: Systematic review and meta-analysis. Am J Med. Mar 2009;122(3):248-256 e245.
14. Stacey D, Bennett CL, Barry MJ, et al. Decision aids for people facing health treatment or screening decisions. Cochrane Database Syst Rev. 2011(10):CD001431.
15. Knops AM, Legemate DA, Goossens A, Bossuyt PM, Ubbink DT. Decision aids for patients facing a surgical treatment decision: A systematic review and meta-analysis. Ann Surg. May 2013;257(5):860-866.
16. Arterburn DE, Westbrook EO, Bogart TA, Sepucha KR, Bock SN, Weppner WG. Randomized trial of a video-based patient decision aid for bariatric surgery. Obesity. Aug 2011;19(8):1669-1675.
17. Pope GD, Birkmeyer JD, Finlayson SR. National trends in utilization and in-hospital outcomes of bariatric surgery. J Gastrointest Surg. Nov-Dec 2002;6(6):855-860; discussion 861.
18. Trus TL, Pope GD, Finlayson SR. National trends in utilization and outcomes of bariatric surgery. Surg Endosc. May 2005;19(5):616-620.
19. Nguyen NT, Masoomi H, Magno CP, Nguyen XM, Laugenour K, Lane J. Trends in use of bariatric surgery, 2003-2008. J Am Coll Surg. Aug 2011;213(2):261-266.
20. Santry HP, Gillen DL, Lauderdale DS. Trends in bariatric surgical procedures. JAMA. Oct 19 2005;294(15):1909-1917.
21. Belachew M, Zimmermann JM. Evolution of a paradigm for laparoscopic adjustable gastric banding. Am J Surg. Dec 2002;184(6B):21S-25S.
22. Hinojosa MW, Varela JE, Parikh D, Smith BR, Nguyen X-M, Nguyen NT. National trends in use and outcome of laparoscopic adjustable gastric banding. Surg Obes Relat Dis. 2009;5(2):150-155.
23. Rubenstein RB. Laparoscopic adjustable gastric banding at a U.S. center with up to 3-year follow-up. Obes Surg. Jun 2002;12(3):380-384.
24. Watkins BM, Montgomery KF, Ahroni JH. Laparoscopic adjustable gastric banding: Early experience in 400 consecutive patients in the USA. Obes Surg. Jan 2005;15(1):82-87.
25. Edwards MA, Grinbaum R, Schneider BE, Walsh A, Ellsmere J, Jones DB. Benchmarking hospital outcomes for laparoscopic adjustable gastric banding. Surg Endosc. Nov 2007;21(11):1950-1956.
26. National Coverage Determination (NCD) for Bariatric Surgery for Treatment of Morbid Obesity (100.1). Medicare Coverage Database [http://go.cms.gov/1heFT95]. Accessed December 3rd, 2013.

A Dartmouth Atlas of Health Care Series
44 vARIATION IN THE CASE OF SURGICAL CONDITIONS
27. Himpens J, Cadiere GB, Bazi M, Vouche M, Cadiere B, Dapri G. Long-term outcomes of laparoscopic adjustable gastric banding. Arch Surg. Jul 2011;146(7):802-807.
28. Spivak H, Abdelmelek MF, Beltran OR, Ng AW, Kitahama S. Long-term outcomes of laparoscopic adjustable gastric banding and laparoscopic Roux-en-Y gastric bypass in the United States. Surg Endosc. Jul 2012;26(7):1909-1919.
29. Carlin AM, Zeni TM, English WJ, et al. The comparative effectiveness of sleeve gastrectomy, gastric bypass, and adjustable gastric banding procedures for the treatment of morbid obesity. Annals of Surgery. 2013;257(5):791-797.
30. Peterli R, Wolnerhanssen B, Peters T, et al. Improvement in glucose metabolism after bariatric surgery: Comparison of laparoscopic Roux-en-Y gastric bypass and laparoscopic sleeve gastrectomy: A prospective randomized trial. Ann Surg. Aug 2009;250(2):234-241.
31. Kehagias I, Karamanakos SN, Argentou M, Kalfarentzos F. Randomized clinical trial of laparoscopic Roux-en-Y gastric bypass versus laparoscopic sleeve gastrectomy for the management of patients with BMI < 50 kg/m2. Obes Surg. Nov 2011;21(11):1650-1656.
32. Lee WJ, Chong K, Ser KH, et al. Gastric bypass vs sleeve gastrectomy for type 2 diabetes mellitus: A randomized controlled trial. Arch Surg. Feb 2011;146(2):143-148.
33. Woelnerhanssen B, Peterli R, Steinert RE, Peters T, Borbely Y, Beglinger C. Effects of postbariatric surgery weight loss on adipokines and metabolic parameters: Comparison of laparoscopic Roux-en-Y gastric bypass and laparoscopic sleeve gastrectomy--A prospective randomized trial. Surg Obes Relat Dis. Sep-Oct 2011;7(5):561-568.
34. Helmio M, Victorzon M, Ovaska J, et al. SLEEVEPASS: A randomized prospective multicenter study comparing laparoscopic sleeve gastrectomy and gastric bypass in the treatment of morbid obesity: Preliminary results. Surg Endosc. Sep 2012;26(9):2521-2526.
35. Peterli R, Steinert RE, Woelnerhanssen B, et al. Metabolic and hormonal changes after laparoscopic Roux-en-Y gastric bypass and sleeve gastrectomy: A randomized, prospective trial. Obes Surg. May 2012;22(5):740-748.
36. Schauer PR, Kashyap SR, Wolski K, et al. Bariatric surgery versus intensive medical therapy in obese patients with diabetes. N Engl J Med. Apr 26 2012;366(17):1567-1576.
37. Zingmond DS, McGory ML, Ko CY. Hospitalization before and after gastric bypass surgery. JAMA. Oct 19 2005;294(15):1918-1924.
38. Flum DR, Dellinger EP. Impact of gastric bypass operation on survival: A population-based analysis. J Am Coll Surg. Oct 2004;199(4):543-551.
39. Flum DR, Salem L, Elrod JA, Dellinger EP, Cheadle A, Chan L. Early mortality among Medicare beneficiaries undergoing bariatric surgical procedures. JAMA. Oct 19 2005;294(15):1903-1908.
40. Liu JH, Zingmond D, Etzioni DA, et al. Characterizing the performance and outcomes of obesity surgery in California. Am Surg. Oct 2003;69(10):823-828.
41. Nguyen NT, Paya M, Stevens CM, Mavandadi S, Zainabadi K, Wilson SE. The relationship between hospital volume and outcome in bariatric surgery at academic medical centers. Transactions of the ... Meeting of the American Surgical Association. 2004;CXXII(&NA;):184-192.
42. Champion JK, Pories WJ. Centers of excellence for bariatric surgery. Surg Obes Relat Dis. Mar-Apr 2005;1(2):148-151.
43. Pratt GM, McLees B, Pories WJ. The ASBS Bariatric surgery centers of excellence program: A blueprint for quality improvement. Surg Obes Relat Dis. Sep-Oct 2006;2(5):497-503; discussion 503.
44. Schirmer B, Jones DB. The American College of Surgeons bariatric surgery center network: Establishing standards. Bull Am Coll Surg. Aug 2007;92(8):21-27.
45. Livingston EH. Bariatric surgery outcomes at designated centers of excellence vs nondesignated programs. Arch Surg. Apr 2009;144(4):319-325; discussion 325.
46. Birkmeyer NJ, Dimick JB, Share D, et al. Hospital complication rates with bariatric surgery in Michigan. JAMA. Jul 28 2010;304(4):435-442.
47. Nguyen NT, Hohmann S, Slone J, Varela E, Smith BR, Hoyt D. Improved bariatric surgery outcomes for Medicare beneficiaries after implementation of the Medicare national coverage determination. Arch Surg. Jan 2010;145(1):72-78.
48. Flum DR, Kwon S, MacLeod K, et al. The use, safety and cost of bariatric surgery before and after Medicare’s national coverage decision. Ann Surg. Dec 2011;254(6):860-865.
49. Dimick JB, Nicholas LH, Ryan AM, Thumma JR, Birkmeyer JD. Bariatric surgery complications before vs after implementation of a national policy restricting coverage to centers of excellence. JAMA. Feb 27 2013;309(8):792-799.
: OBESITY

A DARTMOUTH ATLAS OF HEALTH CARE SERIES 45
50. Nicholas LH, Dimick JB. Bariatric surgery in minority patients before and after implementation of a centers of excellence program. JAMA. 2013;310(13):1399.
51. National Coverage Analysis (NCA) for Bariatric Surgery for the Treatment of Morbid Obesity - Facility Certification Requirement (CAG-00250R3). http://go.cms.gov/1diaZd1. Accessed December 16th, 2013.
52. Decision Memo for Bariatric Surgery for the Treatment of Morbid Obesity - Facility Certification Requirement (CAG-00250R3). http://go.cms.gov/1k9j0Gl. Accessed December 16th, 2013.
53. Centers for Disease Control and Prevention. http://www.cdc.gov/healthyyouth/obesity/facts.htm. Accessed June 1, 2014.
54. O’Connor GT, Plume SK, Olmstead EM, et al. A regional intervention to improve the hospital mortality associated with coronary artery bypass graft surgery. The Northern New England Cardiovascular Disease Study Group. JAMA. Mar 20 1996;275(11):841-846.
55. Ingraham AM, Richards KE, Hall BL, Ko CY. Quality improvement in surgery: The American College of Surgeons National Surgical Quality Improvement Program approach. Adv Surg. 2010;44:251-267.
56. Share DA, Campbell DA, Birkmeyer N, et al. How a regional collaborative of hospitals and physicians in Michigan cut costs and improved the quality of care. Health Affairs. Apr 2011;30(4):636-645.
57. Guillamondegui OD, Gunter OL, Hines L, et al. Using the national surgical quality improvement program and the Tennessee Surgical Quality Collaborative to improve surgical outcomes. J Am Coll Surg. Apr 2012;214(4):709-714; discussion 714-706.
58. Birkmeyer NJ, Share D, Baser O, et al. Preoperative placement of inferior vena cava filters and outcomes after gastric bypass surgery. Ann Surg. Aug 2010;252(2):313-318.


The Dartmouth Atlas Working Group
LeadershipElliott S. Fisher, MD, MPH, Dartmouth Atlas Co-Principal InvestigatorDavid C. Goodman, MD, MS, Dartmouth Atlas Co-Principal InvestigatorJonathan S. Skinner, PhD, Senior ScholarJohn E. Wennberg, MD, MPH, Founder of the Dartmouth AtlasKristen K. Bronner, MA, Managing Editor
Senior Authors and FacultyJohn Erik-Bell, MDShannon Brownlee, MSJulie P.W. Bynum, MD, MPHChiang-Hua Chang, PhDPhilip P. Goodney, MD, MSNancy E. Morden, MD, MPHJeffrey C. Munson, MD, MSThérèse A. Stukel, PhDJames N. Weinstein, DO, MS
Analytic and Administrative StaffThomas A. Bubolz, PhDDonald Carmichael, MDivJulie Doherty, BAJennifer Dong, MSDaniel J. Gottlieb, MSJia Lan, MSMartha K. Lane, MAStephanie R. Raymond, BASandra M. Sharp, SMJeremy Smith, MPHYunjie Song, PhDDean T. Stanley, RHCEYin Su, MSStephanie Tomlin, MPARebecca Zaha, MPHWeiping Zhou, MS
Design and ProductionJonathan Sa’adah and Elizabeth Adams
The Dartmouth Atlas Project works to accurately describe how medical resources are distributed and used in the United States. The project offers comprehensive information and analysis about national, regional, and local markets, as well as individual hospitals and their affiliated physicians, in order to provide a basis for improving health and health systems. Through this analysis, the project has demonstrated glaring variations in how health care is delivered across the United States.
A Report of the Dartmouth Atlas Project
The Dartmouth Atlas Project is funded by the Robert Wood Johnson Foundation and the California Healthcare Foundation.
The Dartmouth AtlasThe Dartmouth Institute for Health Policy and Clinical Practice
Center for Health Policy Research
Contact: Annmarie Christensen (603) 653-0897 [email protected]
www.dartmouthatlas.org
09162014_dap1.2 Copyright 2014 by the Trustees of Dartmouth College


