40
Variation in Health Care Spending Target Decision Making, Not Geography

Variation in Health Care SpendingTarget Decision Making, Not Geography

2
Committee on Geographic Variation in Health Care Spending and Promotion of High-Value CareJoseph P. Newhouse (Chair)Harvard School of Public Health, Harvard Kennedy School, and Harvard Medical SchoolAlan Garber (Vice-Chair)Harvard UniversityPeter BachMemorial Sloan-Kettering Cancer CenterJoseph BakerMedicare Rights CenterAmber E. BarnatoUniversity of PittsburghRobert BellAT&T Labs-ResearchKaren DavisJohns Hopkins Bloomberg School of Public HealthA. Mark FendrickUniversity of MichiganPaul B. GinsburgCenter for Studying Health System Change
Douglas HastingsEpstein Becker & Green, P.C.Brent C. JamesIntermountain Health CareKimberly S. JohnsonDuke UniversityEmmett B. KeelerThe RAND CorporationThomas H. LeePartners Community HealthCare, Inc. Mark B. McClellanThe Brookings InstitutionSally C. MortonUniversity of PittsburghRobert D. ReischauerThe Urban InstituteAlan WeilNational Academy for State Health PolicyGail R. WilenskyProject HOPE
3
Geographic Variation in Health Care Spending and Quality
For over three decades, experts at Dartmouth have documented significant variation in Medicare spending between geographic regions seemingly unrelated to health outcomes.

4
Dartmouth Institute Map of Price Adjusted Medicare PMPM Spending by HRR (2008)
5
Geographic Variation Reflects “Acceptable” and “Unacceptable” Sources of Variation
• “Acceptable” sources of variation include aspects of health status or population demographics. • “Unacceptable” sources of variation include aspects of system inefficiencies, such as overuse of low-value services and unnecessary service duplication. •There are also gray areas
6
Committee Charge
1. To independently evaluate geographic variation in health care spending levels and growth among Medicare, Medicaid, privately insured, and uninsured populations in the U.S.;
2. To make recommendations for changes in Medicare Parts A, B, and C payments, considering findings from task (1) of the study and changes to Medicare payment systems under the ACA; and
3. To address whether Medicare payments for physicians and hospitals should incorporate a “value index based on a composite of appropriate measures of quality and cost that would adjust provider payments on a regional or provider-level basis”¹ ¹The Affordable Health Care for America Act, H.R. 3962, 111th Cong., 1st sess. (October 29, 2009)

7
Research Framework and Statistical Modeling Approach
The Committee addressed two basic questions:
1. How do health care spending, utilization, and quality vary across geographic regions?
2. Should Medicare provider payments be adjusted for regionally-based measures of value?
8
Geographic Units of Analysis
The Committee examined geographic variation at three levels:
• Hospital Referral Regions (HRR)• Hospital Service Areas (HSA)• Metropolitan Core-Based Statistical Areas (Metropolitan CBSA, also known as Metropolitan Statistical Area)

9
SubcontractorsThe following subcontractors supported the Committee’s commissioned analyses:
Acumen, LLC• Tom MaCurdy, Ph.D., Managing Member and Senior Research Associate
Dartmouth • Jonathan Skinner, Ph.D., Joan Sloan Dickey Third Century Professor in Economics
Harvard University• Michael Chernew, Ph.D., Professor, Department of Health Care Policy
The Lewin Group, Inc.• Nancy Walczak, F.S.A., Ph.D., Managing Director, Health and Human Services Consulting
University of Pittsburgh• Yuting Zhang, Ph.D., Assistant Professor, Department of Health Policy and Management
Precision Health Economics• Darius Lakdawalla, Ph.D., Managing Director
RAND Corporation• David Auerbach, Ph.D, Policy Researcher, RAND • Ateev Mehrotra, M.D., M.P.H., M.Sc., Policy Analyst, RAND
10
Definitions of Key Terms
Health Care Value is the amount by which overall health benefit and/or well-being produced by the care exceeds (or falls short of) the costs of producing it. Value Index is a relative measure of value, for example, a measure of improvement in patient-centered, clinical health outcomes per unit of resources used in one area relative to the national average.

11
Desirable Features of a Geographic Value Index
A geographic value index for Medicare should:• effectively shift provider behavior toward greater efficiency (i.e., using fewer resources) without substantially diminishing health care outcomes.• generate hospital and provider payments that are perceived as fair.

12
Committee Findings
Conclusion 2.1 Geographic variation in spending and utilization is real, and not an artifact reflecting random noise. The committee’s empirical analyses of Medicare and commercial data confirm the robust presence of variation, which persists across geographic units and health care services and over time.

13
Ratio of the 90th to the 10th Percentile of UnadjustedPer-Member-Per Month (PMPM) Medicare and Commercial
Spending across Geographic Units
HSA HRR MetropolitanCBSA
Medicare 1.47 1.42 1.38OptumInsight(Commercial 1)
1.71 1.42 1.50
MarketScan(Commercial 2)
1.43 1.36 1.36
NOTE: Unadjusted spending” refers to all-cause spending that has not been adjusted for any factors other than year of analysis and length of beneficiary enrollment.
14
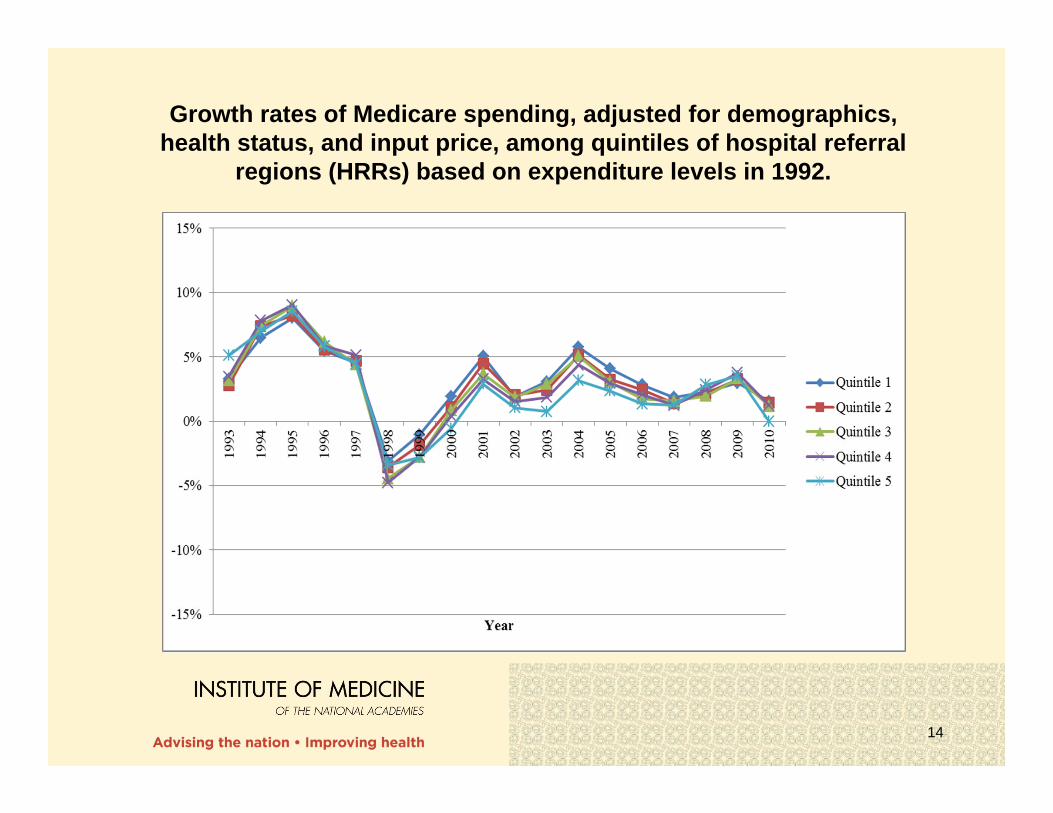
Growth rates of Medicare spending, adjusted for demographics, health status, and input price, among quintiles of hospital referral
regions (HRRs) based on expenditure levels in 1992.
15
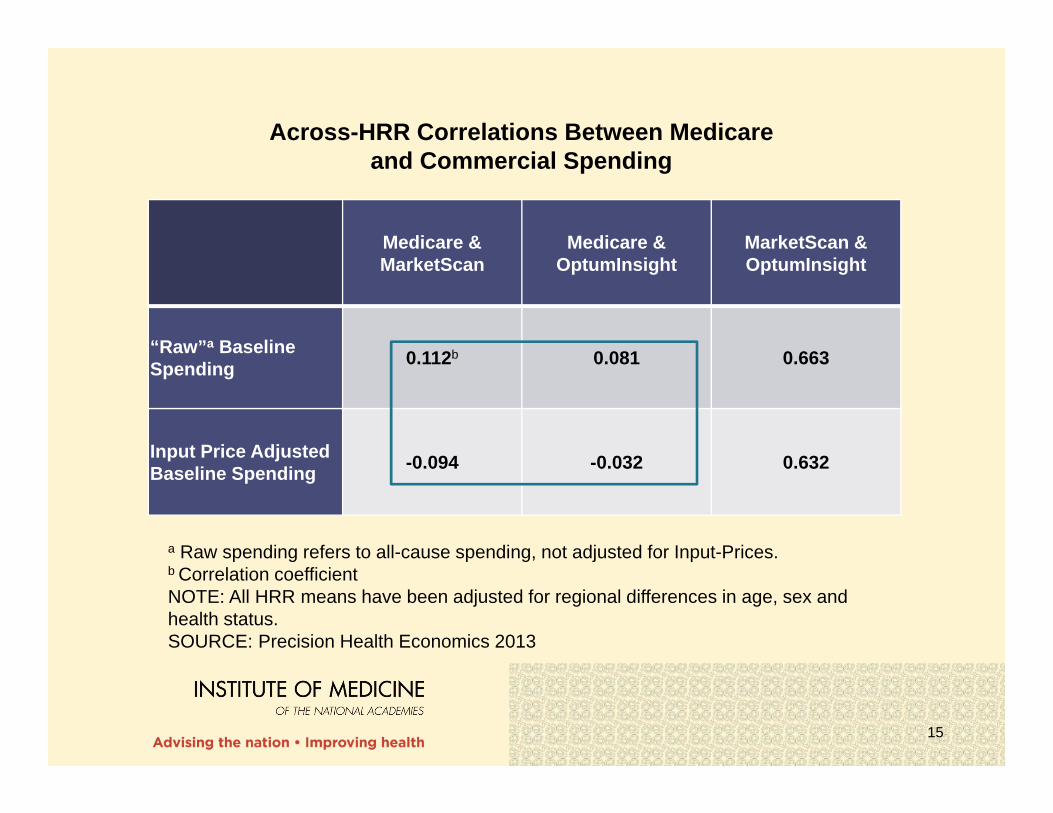
Across-HRR Correlations Between Medicare and Commercial Spending
Medicare & MarketScan
Medicare & OptumInsight
MarketScan & OptumInsight
“Raw”a Baseline Spending 0.112b 0.081 0.663
Input Price Adjusted Baseline Spending -0.094 -0.032 0.632
a Raw spending refers to all-cause spending, not adjusted for Input-Prices. b Correlation coefficientNOTE: All HRR means have been adjusted for regional differences in age, sex and health status. SOURCE: Precision Health Economics 2013
16
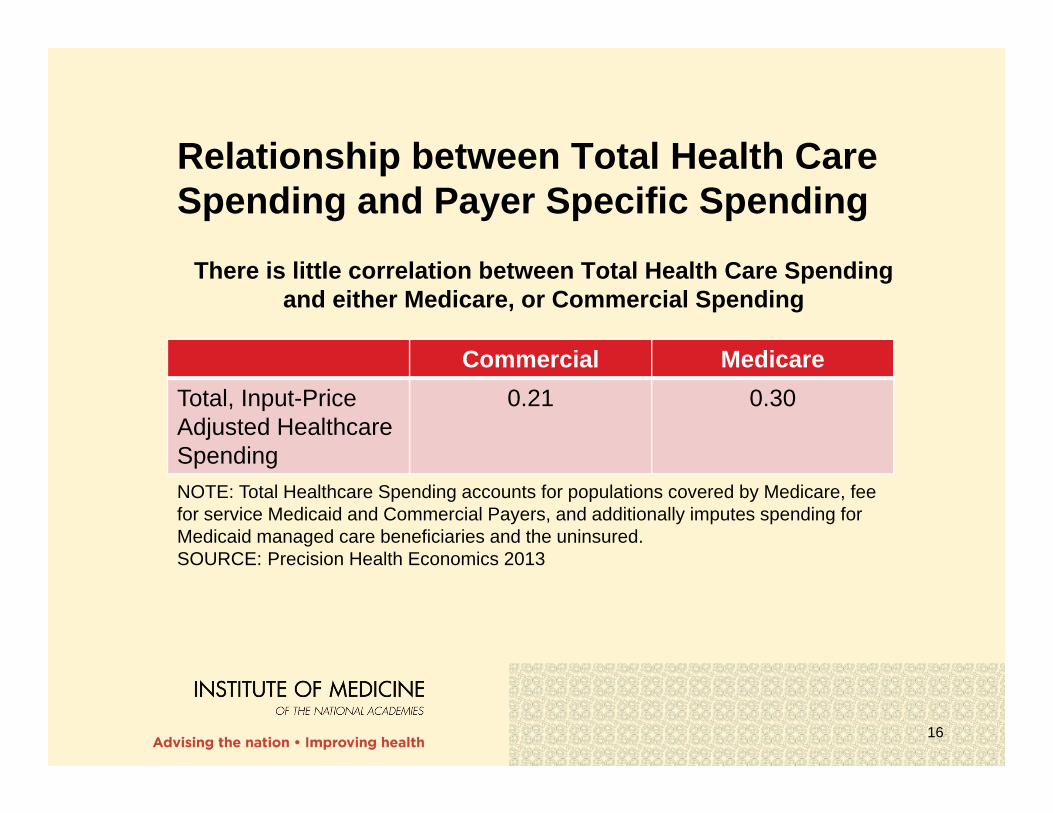
Relationship between Total Health Care Spending and Payer Specific Spending
Commercial MedicareTotal, Input-Price Adjusted Healthcare Spending
0.21 0.30
There is little correlation between Total Health Care Spending and either Medicare, or Commercial Spending
NOTE: Total Healthcare Spending accounts for populations covered by Medicare, fee for service Medicaid and Commercial Payers, and additionally imputes spending for Medicaid managed care beneficiaries and the uninsured. SOURCE: Precision Health Economics 2013
17
Committee Findings
Conclusion 2.3 The committee’s empirical analysis revealed that after accounting for differences in age, sex, and health status, geographic variation is not further explained by other beneficiary demographic factors, insurance plan factors, or market-level characteristics. In fact, after controlling for all factors measurable within the data used for this analysis, a large amount of variation remains unexplained.

18
SOURCE: Committee’s analysis of subcontractor data.
After accounting for age, sex and health status, other factors do not further explain variation in Medicare or Commercial spending
19
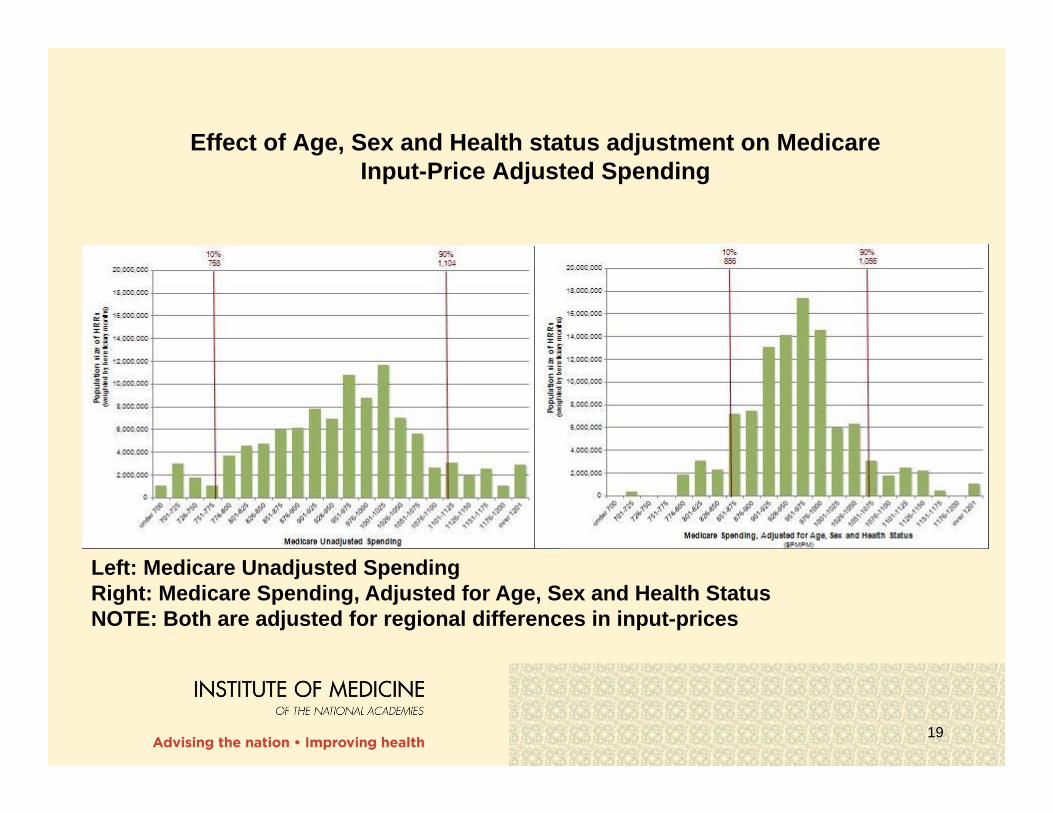
Effect of Age, Sex and Health status adjustment on Medicare Input-Price Adjusted Spending
Left: Medicare Unadjusted SpendingRight: Medicare Spending, Adjusted for Age, Sex and Health StatusNOTE: Both are adjusted for regional differences in input-prices
20
Committee Findings
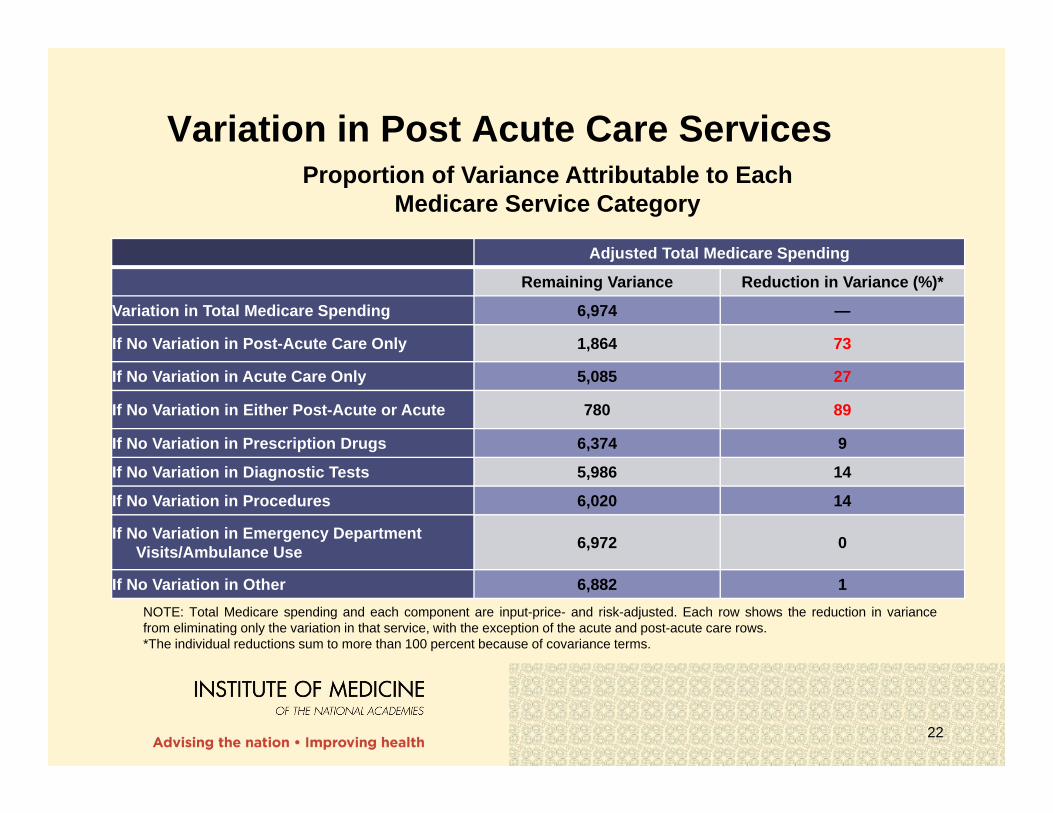
Conclusion 2.4 Variation in total Medicare spending across geographic areas is driven largely by variation in the utilization of post-acute care services, and to a lesser extent by variation in the utilization of acute care services.
21
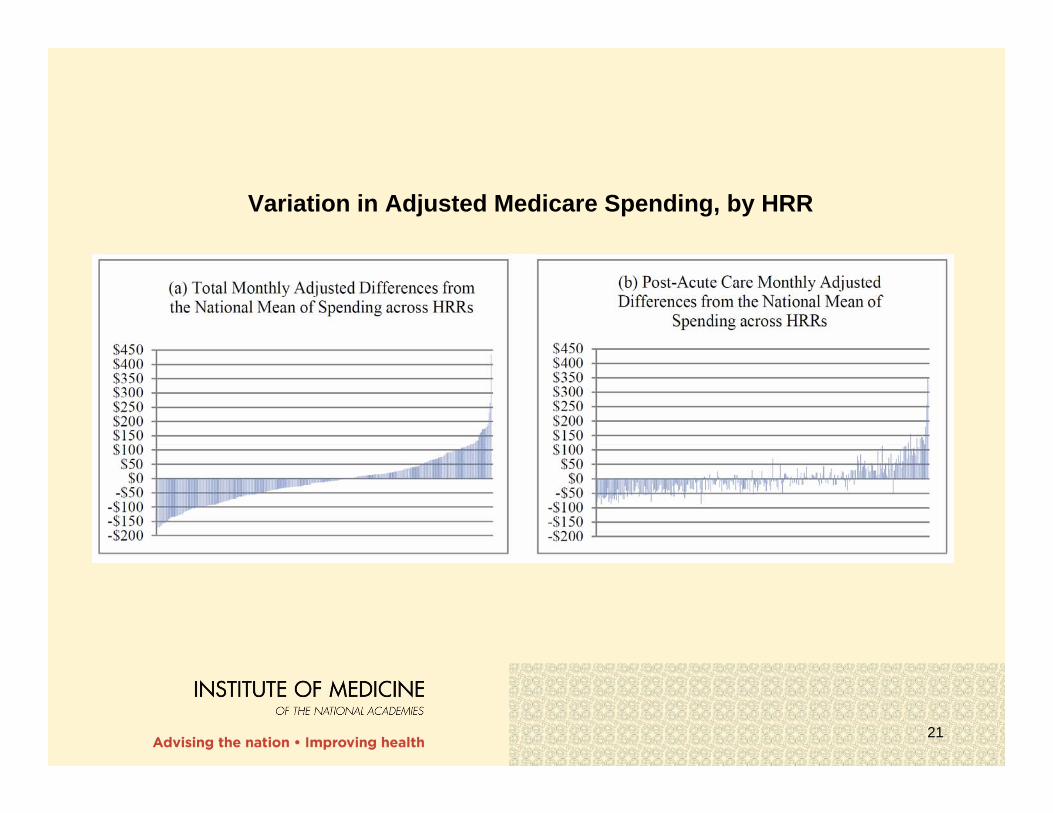
Variation in Adjusted Medicare Spending, by HRR
22
Variation in Post Acute Care ServicesProportion of Variance Attributable to Each
Medicare Service Category
Adjusted Total Medicare Spending
Remaining Variance Reduction in Variance (%)*
Variation in Total Medicare Spending 6,974 —
If No Variation in Post-Acute Care Only 1,864 73
If No Variation in Acute Care Only 5,085 27
If No Variation in Either Post-Acute or Acute 780 89
If No Variation in Prescription Drugs 6,374 9
If No Variation in Diagnostic Tests 5,986 14
If No Variation in Procedures 6,020 14
If No Variation in Emergency Department Visits/Ambulance Use 6,972 0
If No Variation in Other 6,882 1NOTE: Total Medicare spending and each component are input-price- and risk-adjusted. Each row shows the reduction in variancefrom eliminating only the variation in that service, with the exception of the acute and post-acute care rows.*The individual reductions sum to more than 100 percent because of covariance terms.
23
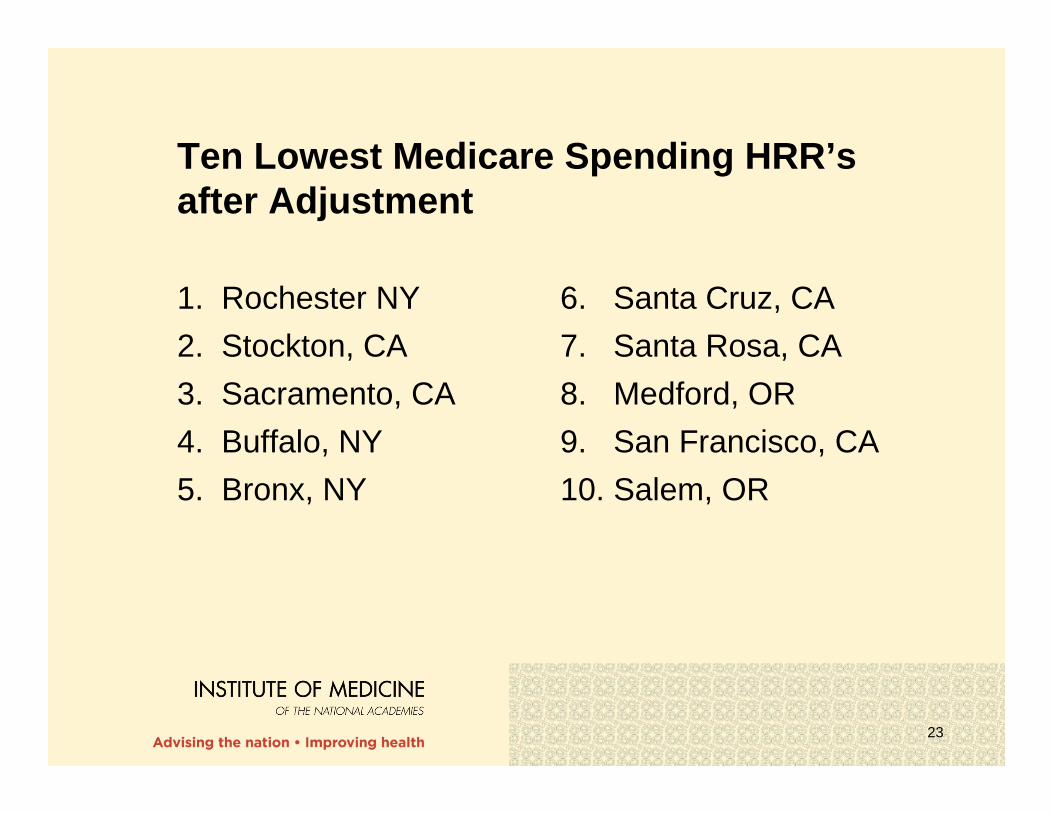
Ten Lowest Medicare Spending HRR’s after Adjustment
1. Rochester NY 6. Santa Cruz, CA2. Stockton, CA 7. Santa Rosa, CA3. Sacramento, CA 8. Medford, OR4. Buffalo, NY 9. San Francisco, CA5. Bronx, NY 10. Salem, OR

24
Ten Highest Spending Medicare HRR’s after Adjustment
1. Miami, FL 6. Lafeyette, LA2. McAllen, TX 7. Shreveport, LA3. Monroe, LA 8. Baton Rouge, LA4. Houston, TX 9. Fort Lauderdale, FL5. Alexandria, LA 10. Metairie, LA
25
Committee Findings
Conclusion 2.2 Variation in spending in the commercial insurance market is due mainly to differences in price markups by providers rather than to the differences in the utilization of health care services.
26
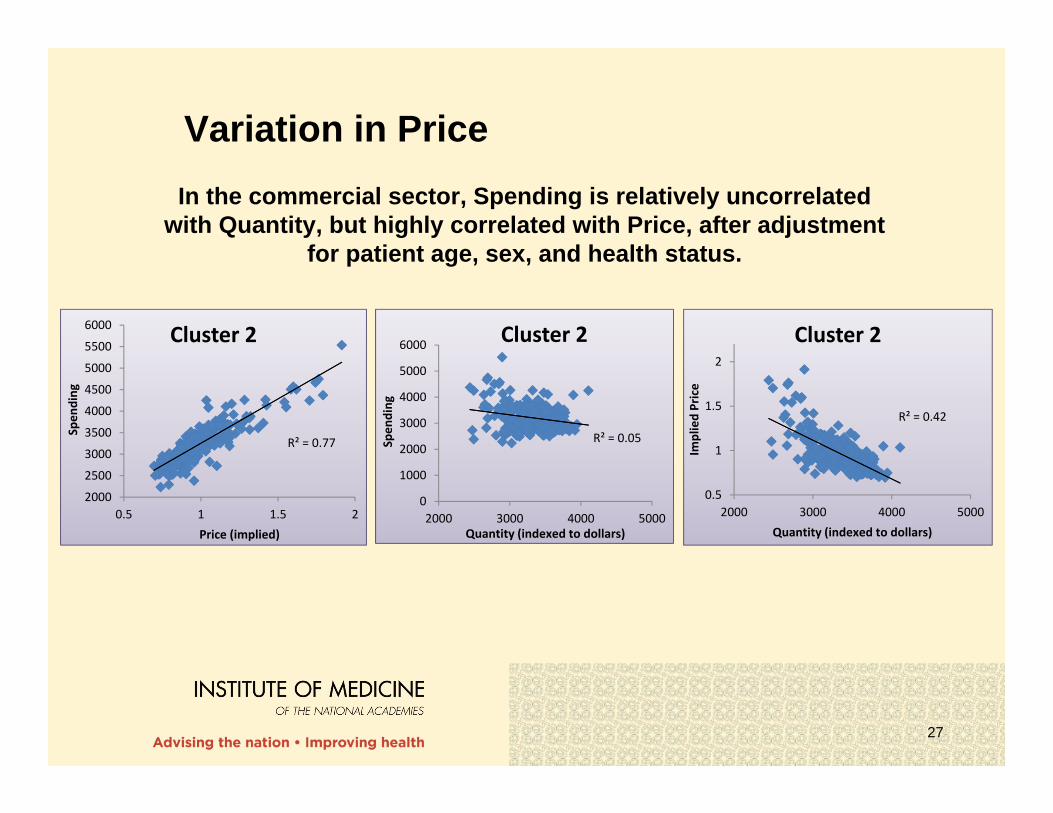
Variation in Price
• Variation in health care spending reflects variation in both unit price and utilization (quantity of services)• Whereas CMS sets uniform national base prices, the commercial prices are set through negotiations between payer and provider and vary geographically• Price variation is larger in the commercial sector than in Medicare, as negotiating power varies across areas
27
Variation in PriceIn the commercial sector, Spending is relatively uncorrelated
with Quantity, but highly correlated with Price, after adjustment for patient age, sex, and health status.
R² = 0.77
2000
2500
3000
3500
4000
4500
5000
5500
6000
0.5 1 1.5 2
Spen
ding
Price (implied)
Cluster 2
R² = 0.05
0
1000
2000
3000
4000
5000
6000
2000 3000 4000 5000
Spen
ding
Quantity (indexed to dollars)
Cluster 2
R² = 0.42
0.5
1
1.5
2
2000 3000 4000 5000
Implied Price
Quantity (indexed to dollars)
Cluster 2

28
Variation in Commercial PricesRelative Proportion of Commercial Spending Variation due to
Quantity (utilization), Markup, and Input Price, Decomposed by Service Type
Quantity (%) Markup (%) Input-Price (%)
Total Medical Spending 16 70 14
Inpatient Spending 18 62 20
Outpatient Spending 21 70 9
29
Committee Recommendation
RECOMMENDATION 1:Congress should encourage CMS, and provide the necessary resources, to make accessing Medicare and Medicaid data easier for research purposes. CMS should collaborate with private insurers to collect, integrate, and analyze standardized data on spending, as well as clinical and behavioral health outcomes, to enable more extensive comparisons of payments and quality and evaluation of value-based payment models across payers.

30
Committee Findings
Conclusion 3.2 Substantial variation in spending and utilization remains as units of analysis get progressively smaller.
• Within the HRR (HSA level)• Within the HRR (Hospital level)• Within single provider practices• Additionally, individual physician performance varies across individual measures of quality and service use

31
Example: Spending variation at the Hospital Level within HRRs
for various clinical condition cohorts

32
Conclusion 3.3 Quality across conditions and treatments varies widely within HRRs; spending and utilization across conditions are moderately correlated within HRRs.
Committee Findings

33
Correlation Coefficients for Input-Price-Adjusted Spending across Cohorts in the Harvard MarketScan Commercial Population
NOTE: CHF = congestive heart failure; LBP = lower back pain.
LBP Cataracts CHF Breast Cancer
Prostate Cancer Cholecystectomy
LBP 1.00
Cataracts 0.35 1.00
CHF 0.52 0.36 1.00
Breast Cancer 0.49 0.52 0.37 1.00
Prostate Cancer 0.43 0.33 0.39 0.49 1.00
Cholecystectomy 0.40 0.36 0.39 0.42 0.36 1.00
34
Conclusion 3.4 HRR-level quality is not consistently related to spending or utilization in Medicare or the commercial sector.
Committee Findings
35
Inconsistent Relationship between Spending and Quality of Health Care
Correlations of spending and measures of quality for various diseases were mostly near zero, with both positive and negative signs, for both Medicare and commercial populations

36
Committee RecommendationRECOMMENDATION 2: Congress should not adopt a geographically based value index for Medicare. Because geographic units are not where most health care decisions are made, a geographic value index would be a poorly targeted mechanism for encouraging value improvement. Adjusting payments geographically, based on any aggregate or composite measure of spending or quality, would unfairly reward low-value providers in high-value regions and punish high-value providers in low-value regions.
37
Committee Recommendation
RECOMMENDATION 3: To improve value, CMS should continue to test payment reforms that incentivize the clinical and financial integration of health care delivery systems and thereby encourage their (1) coordination of care among individual providers, (2) real-time sharing of data and tracking of service use and health outcomes, (3) receipt and distribution of provider payments, and (4) assumption of some or all of the risk of managing the care continuum for their populations. Further, CMS should pilot programs that allow beneficiaries to share in the savings due to higher-value care.
38
Committee Recommendation
RECOMMENDATION 4: During the transition to new payment models, CMS should conduct ongoing evaluations of the impact on value of the reforms included in Recommendation 3 by measuring Medicare spending and beneficiaries’ clinical health outcomes. CMS should use the results of these evaluations to iteratively improve these payment models. CMS should also monitor how these reforms impact Medicare beneficiaries’ access to medical care.

39
Committee Recommendation
RECOMMENDATION 5: If evaluations of specific payment reforms demonstrate increased value, Congress should give CMS the flexibility to accelerate the transition from traditional Medicare to new payment models.

Thank You!


