28
CHAPTER 5 VARIATION OF RAINFALL WITH LATITUDE AND ALTITUDE

CHAPTER 5
VARIATION OF RAINFALL WITH LATITUDE AND ALTITUDE
5.1 GENERAL
Kerala is an elongated coastal State lies in the
south-western part of India. It lies between latitudes 8° N
and 13° N comprising approximately 560 km in the north-south
direction. Physiographically, Kerala extends from the
lowlands adjoining the western sea bed, the landscape ascends
steadily towards the east to the mid-lands and further on to
the high lands sloping down from the Western Ghats. The
mountain ranges which form a natural wall separating Kerala
from the adjoining states, have an average elevation ot about
1 km with peaks rising to over 2 km. The Anamalai and the
Nilgiris are the tallest mountains in the Western Ghats
skirting the west-coast of Indian peninsula. A remarkable
feature is the Palghat Gap of about 25 km width between the
Anamalai and the Nilgiris which is the only marked break in
the mountain wall. The western slopes of the hills and
mountains at the eastern border of Kerala receive copious
raintall during the monsoon season.
The nature of rainfall variations from south to
north of Kerala associated with changes in latitude have been
studied and are reported in the present chapter. For the
purpose ot the study, the variations in rainfall amount and
the number of rainy days with latitude during annual as well
as southwest and northeast monsoon periods were studied
139

separately. Similarly, the variability ot raintall with
stations located at different heights above mean sea level
were also carried out to find the influence of altitude on
the changes in rainfall pattern of the State.
5.2 DATA
Monthly mean raintall data from 84 stations
distributed in the entire State were utilised for the study.
The stations are located latitude-wise from Parassala (8 0 20'
N) in the south to Kasargod (12 0 31' N) in the north, and
longitude-wise from the western-most station, Kasargode (74 0
59' E) which is also the northernmost station- to the
eastern-most station, Marayur (77 0 09'E). Table 4.1 lists the
stations selected, their geographical location, altitude
above mean sea level, number of years of data used, number ot
rainy days and the climatological monthly and annual rainfall
data.
5.3 SPATIAL DISTRIBUTION OF ANNUAL RAINFALL
A three-dimensional representation of the
latitude-longitude distribution of annual rainfall over
Kerala State is depicted in Fig. 5.1. Annual rainfall showed
two distinct peaks in the south-central as well as north
central regions. The southern peak is located in IdukJci
District and the northern peak is noted in Kozhikode
140

Fig. 5 . 1 Spatial distribution of annual rainfall
141

District. A region ot low raintall can be seen between the
above two peaks is due to the Jow raintall zone in tIle
Palghat Gap located around 11° N.
5.4 LATITUDINAL VARIATION OF ANNUAL RAINFALL
Fig. 5.2. is a plot of the climatological mean
annual rainfall with latitudes from 84 evenly distributed
rainfall stations over Kerala, located trom southernmost part
to the northern latitude. The curve of best-fit of annual
rainfall against latitude is obtained by using the 6-degree
polynomial equations and are drawn as shown in Fig. 5.2.
From both Figs. 5.1 and 5.2, it can be seen that
the annual rainfall over Kerala show an increase from
southern-most latitude of Kerala to about 120 km northwards.
Parassala, the southern-most rainfall station, located at
latitude 8° 20' N, experiences the lowest annual mean
rainfall of 1479 mm, which steadily increase to 3400 mm at
about 9° 30' N. Between latitudes 9° 30' Nand 10° IS' N,
annual rainfall showed larger spatial variability. Three
stations in this latitude belt showed annual rainfall well
below 2000 mm. These stations are Santhanpara (1861 mm),
Kumily (1721 mm) and Marayur (1349 mm). Even though the above
stations are located at high altitude regions, annual
rainfall is quite low comparing to other stations in the same
latitude region. The main reason tor a decrease in raihtall
142

7000
'E 6OOO E
'-"5000 -1 --1
Lt. 4000 z ~
0::: 3000 --1 ~
~ 2000 z ~
1000 •
• • •
•
•
•
• ••
°a 9 10 11 12 LATITUDE
Fig. 5.2 Scatter diagram of annual rainfall versus
latitude
143
13
in these stations are due to their location on the leeward
side of the mountain, which reduces rainfall. On the other
hand, stations which are located on the same latitude zone,
namely Pirmed (4471 mm), Neriamangalam (4576 mm) and
Kanjirapally (4151 mm) experiences very heavy rainfall, well
above 4000 mm annually. The above high rainfall regions are
not located at the same altitude levels. Neriamangalam is
situated almost nearer to mean sea level, only at an altitude
of 45 gpm from mean sea level. Kanjirappally is located at an
elevation of 400 gpm and Pirmed is at 950 gpm. Higher amount
of rainfall recorded at these stations are due to their
position on the windward side of the mountain which favours
condition for good rainfall.
After attaining the peak around 9° 30'N, the annual
rainfall shows a decreasing trend with latitude to another
150 km northwards. The Palghat Gap plays a major role in
reducing the rainfall at 11° N. An increasing trend in
raintall with large variability is again seen from 11° N to
about 12° N. Heavy rainfall pockets of Kerala are situated
around 12° N latitude region. Mavattom, is located at 11° 40'
N, recorded the highest annual rainfall region of Kerala. In
this station, an annual rainfall ot 6073 mm with an average
ot 136 rainy days per year is reported. In addition, three
more stations experiences annual raintall well over 4000 mm
in this latitude zone. They are Karingad (4918 mm), Vythjri
144
(443~ mm) and Kuttiadi (4504 mm). Northern portion of Kerala,
beyond 12° N show a slight decrease in raintall with lower
variability.
In general, annual rainfall of Kerala shows an
increase from 1479 mm in the extreme south latitude (8° 20'
N) at Parassala to over 3500 mm in the northern-most latitude
(12° 31' N) at Kasaragod. There are two heavy raintall
pockets
located
seen over Kerala. One of the heavy rainfall zone is
in the southern halt ot the State, located between
latitudes 9° and 10° N. Kanjirappally, Neriamangalam and
Pirmed stations are located in this zone. Northern heavy
raintall pocket is situated in the district of Kozhikode,
located near 12° N latitude. Heavy rainfall stations situated
in this latitude region are Mavattom, Vythiri, Kuttiadi and
Karingad.
The rainfall variation in the coastal zone of
Kerala shows that the coastal belt trom Cochin to Kozhikode
receives an annual rainfall of around 3000 mm. The rainfall
exhibits a sharp increase to the north ot Kozhikode and a
decrease to the south of Cochin along the coastal belt. There
is a rapid decrease in raintall is seen trom Kayamkulam to
the southern part ot Kerala.
145

5 • ~ VARIA'I'ION OF 'I'HE NUMBER OF ANNUAL RAINY DAYS
Number of annual rainy days versus latitude is
plotted in Fig. 5.3 and the best-tit curve is drawn using the
6-degree polynomial equations. There is a sharp increase in
the number of rainy days with increase in latitude is noted
in the southern part of Kerala, and attained the peak ot 165
days near 9° 45' N latitude. Thereafter, the number ot annual
rainy days decrease with latitude. The annual number ot rainy
days attained the secondary minimum around 11° N, the region
near the Palghat Gap, and then showed an increasing trend,
reached the second maximum around 12° N. The rainy days
decrease with latitude thereafter.
Lowest number of annual rainy days (84) reported at
Parassala, the southernmost latitude station of Kerala.
Another station Marayur, located near to the Tamil Nadu
border and also on the leeward side ot the Western Ghats, has
lower number of rainy days in an year. On the other hand,
highest number of annual rainy days are seen in the central
Kerala, situated in Idukki District. The Kanjirapally
station, located at latitude 9° 34' N, recorded 163 number of
annual rainy days, and Karikode 9° 50' N, has 160 annual
rainy days.
A comparison between Fig. 5.2 and Fig. 5.3 explain
that the area of peak raintall is not always associated with
the r~gion of highest number ot rainy days. From Fig. 5.2 it
146

(/)
~ 0
>-z « a::::
180
160 • • • • • • • ,
140
120
100
• 80
60a 9 10 1 1 LATITUDE
Fig. 5.3 Scatter diagram of annual number of rainy days
against latitude
147

is evident that the highest annual rainfall region is located
in northern Kerala, situated in Kozhikode District. Fig. 5.3
show that the maximum number ot annual rainy days are located
in the central Kerala, between go and 100 N latitude belt.
The best-tit curve in both Figs 5.2 and 5.3 showed two peaks.
The annual rainfall curve showed the maximum peak at higher
latitude zone than the lower latitude, whereas the annual
number ot rainy days curve showed its highest peak in the
central part of Kerala rather than in the northern
latitudes. It is evident trom these results that southern
Kerala experiences more rainy days with lower intensity of ~
rainfall. On the other hand, northern Kerala gets higher
amount of rainfall with relatively less number of rainy days.
The duration as well as the intensity of raintall is quite
large in the northern part of Kerala.
The study is further extended to find the influence
of latitud~ on the two major rainy seasons of Kerala, viz.,
southwest monsoon season (June - September) and the northeast
monsoon season (October - December), separately.
5.6 SPATIAL DISTRIBUTION OF SOUTHWEST MONSOON RAINFALL
Fig. 5.4 is the three dimensional representation ot
the latitude-longitude distribution of southwest monsoon
raintall over the entire State. It is evident trom Fig. 5.4
that the raintall during the southwest monsoon season have an
148
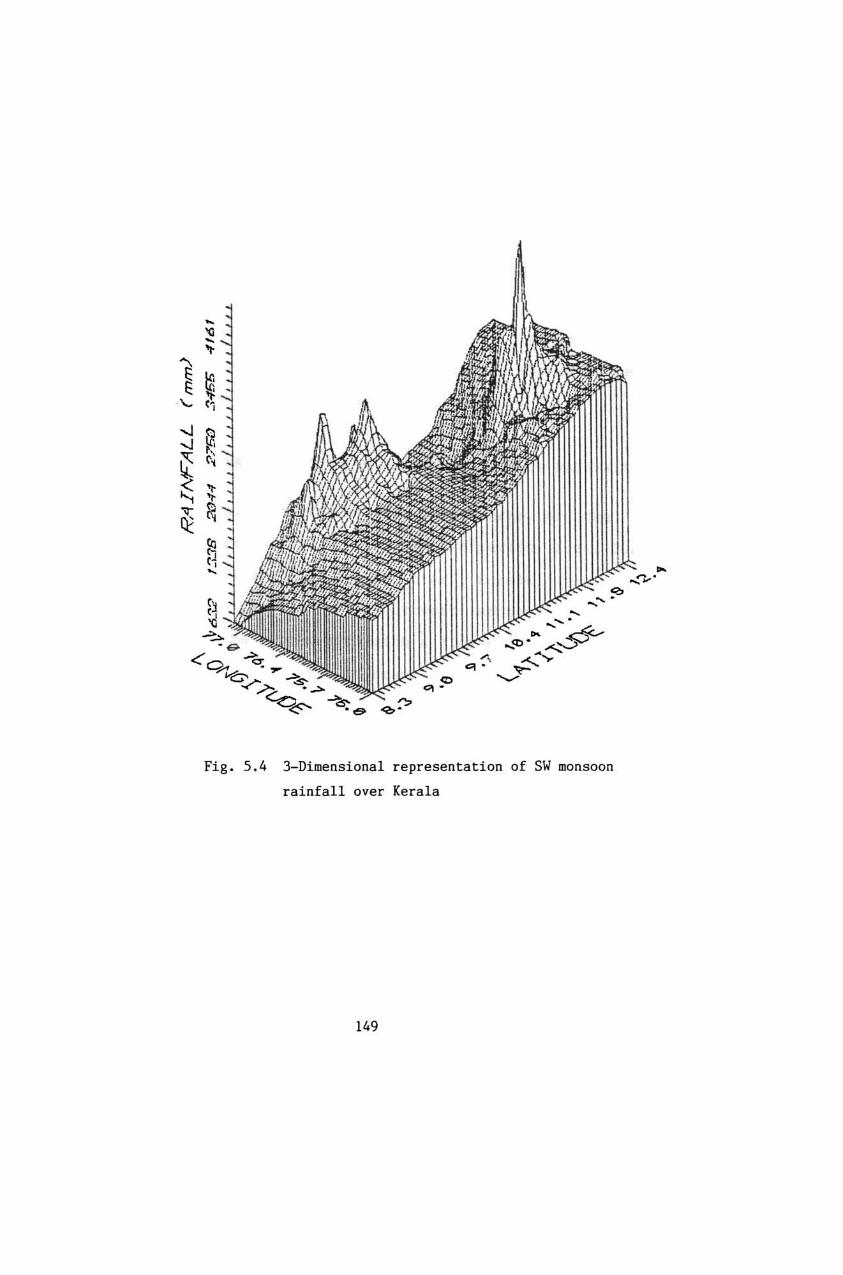
Fig. 5.4 3-Dirnensional representation of SW monsoon
rainfall over Kerala
149

increasing trend tram the southern part ot Kerala to the
North. Southwest monsoon raintall over Kerala region showed
an increasing tendency with latitude. Superimposed on this
increasing tendency, there are two distinct regions where the
southwest monsoon rainfall peaks, one is situated in Idukki
District and the other in Kozhikode District. Both these
heavy rainfall pockets are seen in annual rainfall
variations. In middle Kerala, the rainfall showed a decrease
which is associated with the Palghat Gap.
5.7 LATITUDINAL VARIATION OF SOUTHWEST MONSOON RAINFALL
Fig. 5.5 shows the scattergram of the total
rainfall during the southwest monsoon period, i.e., June to
September, versus latitude over Kerala region. The
relationship between the southwest monsoon raintall and
latitude can be represented with a linear regression equation
and the line of best fit is drawn as illustrated in Fig. 5.5.
A linear increase in the summer monsoon rainfall is noted
trom south to north of Kcrala. Southwest monsoon rainfall is
very less in the southern part of Kerala, ot the order ot
1000 mm during this season and increase four times of the
order ot 4000 mm in the northern latitude of the State. It is
evident trom the scattergram (Pig. 5.5) that relatively large
variability in southwest monsoon rainfall is noted between
10° and 12° N, where the position and the orientation of the
orography controls the rainfall activity. Northern Kerala
150

5000
,,--...,4000
E E
'--'3000
-' -' <{ LL 2000 Z <t: er
1000 A
A A
Fig. 5.5
..
A
.. A A
A
Scatter plot of southwest monsoon rainfall versus
latitude
151
experienced raintall on the higher side ot the regression
line ot the scattergram.
The linear regression equatiop obtained trom the
latitudinal distribution of southwest monsoon raintall over
Kerala shows a positive slope and derives an increase in
rainfall of the order ot 464 mm for every 1° latitude
distance. In other words, assuming the latitudinal distance
is approximately 110 km, then the increase in rainfall during
the southwest monsoon season is of the order of 4.2 mm ,
/kilometer distance. Computed correlation coetficient between
southwest monsoon rainfall and the latitude is 0.69'1 tor the
84 stations considered for the study reveal that the computed
correlation coefficient (see Table 5.1) is highly significant
of the order ot >99% level of signiticance with 82 degrees of
freedom.
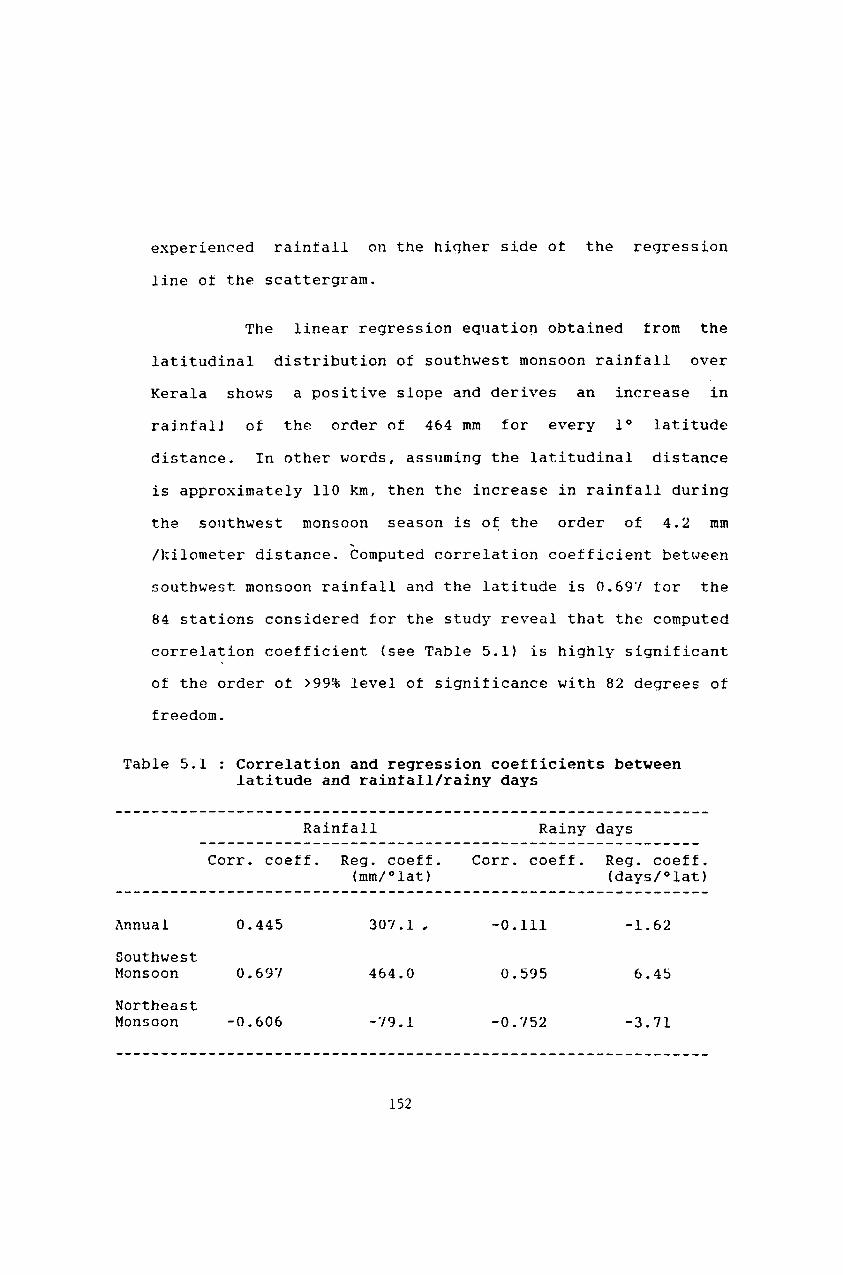
Table 5.1
Annual
Southwest Monsoon
Northeast Monsoon
Correlation and regression coetticients between latitude and rainfall/rainy days
Rainfall
Corr. coeff. Reg. coeff. (mm/olat)
0.445 307.1 .,
0.69'/ 464.0
-0.606 -'/9.1
152
Rainy days
Corr. coeff. Reg. coeft. (days/olat)
-0.111 -1.62
0.595 6.45
-3.71

5.7.1 Number ot Rainy Days in Southwest Monsoon
As the case of the amount ot rainfall during the
southwest monsoon season, the number of rainy days during the
period also showed a linear increase with latitude over
Kerala. A scattergram plotted between the number of rainy
days and latitude and the linear regression line are shown in
Fig. 5.6. The number of southwest monsoon rainy days are less
in the southern part of Kerala which increases towards the
northern part of the State.
The number of rainy days in southwest monsoon
period also showed a positive correlation with latitude. The
correlation coefficient computed between the number of rainy
days and latitude during the summer monsoon season gives a
positive and statistically signiticant correlation ot 0.595.
The regression coefficient show that the number ot rainy days
during the southwest monsoon increases of the order of 6.45
days per latitude from the south of Kerala to the north.
S.8 SPATIAL DISTRIBUTION OF NORTHEAST MONSOON RAINFALL
Spatial variation in raintall, represented by the
3-dimensional graphical presentation of rainfall during the
northeast monsoon season is depicted in Fig.5.? The decrease
in raintall trom south to north ot Kerala can be seen in the
153

U1100
~ 0
>- 80 Z « er: 1.L 60 0
er W m 40 ::2 => Z
11 11 If
A .. A
lA 11 .. A
A tft!-AA bA_
A
Ad
" " A
JI6 .. " A
A
A A
Fig. 5.6 Scatter plot of normal SW monsoon rainy days
against latitude
154

Fig.~.1. Apart trom localised high raintall zones noted in
the distribution, the rainfalJ during the northeast monsoon
season have a strong inverse dependence on latitude.
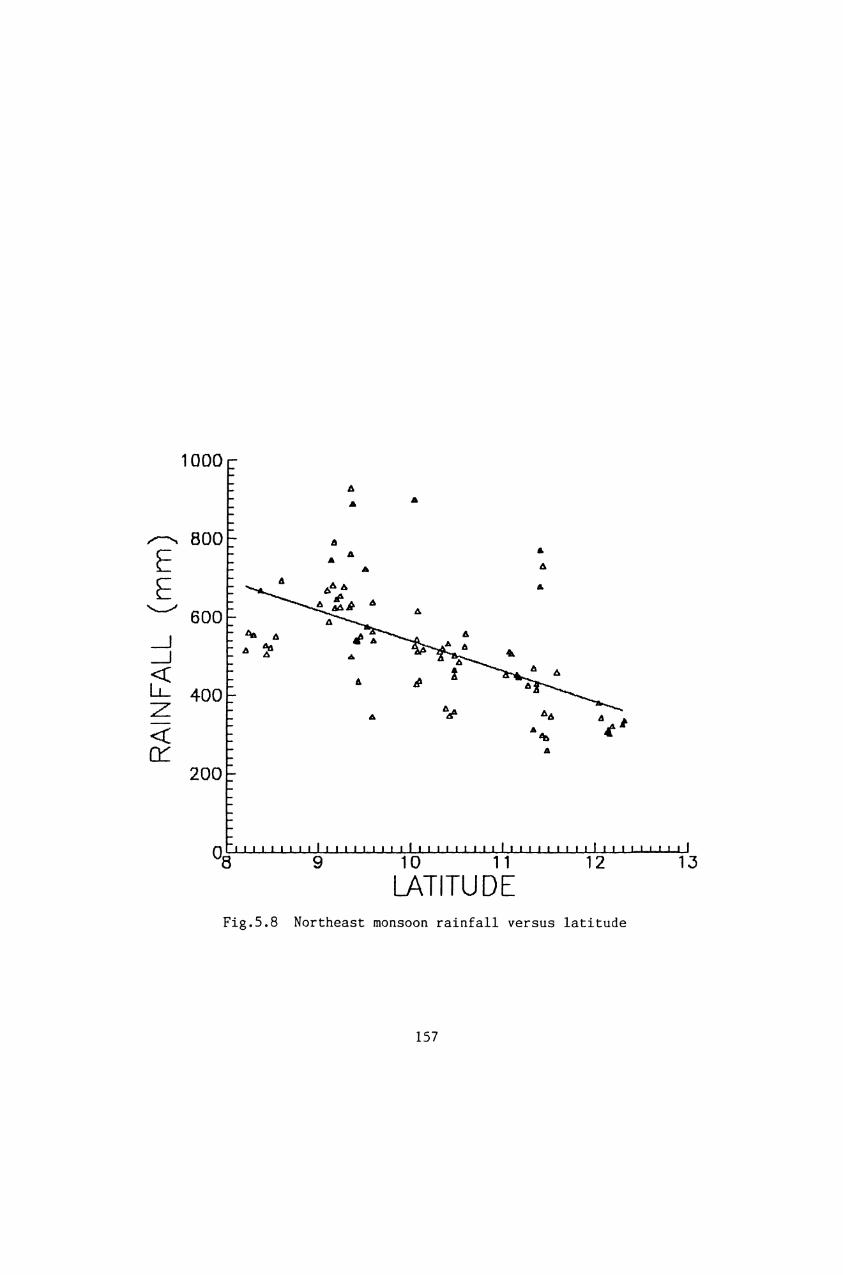
5.9 LATITUDINAL VARIATION OF NORTHEAST MONSOON
Latitudinal variation in northeast monsoon rainfall
over Kerala observed during the season October to December is
plotted in the scattergram and the linear regression line is
drawn as shown in Fig. 5.8. The rainfall during the
northeast monsoon season is found to be decreasing with
increasing latitude, which is just opposite to that observed
in the case of southwest monsoon season. Higher rainfall
during the months of October to December is noted in the
southern part of Kerala and it decreases towards the northern
latitudes. Relatively higher rainfall is noted between 9° and
10° N latitude in the SOllthern half of Kerala and around 12°
N in the northern part of the State. Rainfall in both these
regions, showed higher values than the regression line drawn
in the scatter diagram.
In the southern region, the mean rainfall during
the northeast monsoon period is estimated as 700 mm, which
decreased to its half of 350 mm in the northern part of
Kerala. The regression coefficient between rainfall and
latitude showed that the rainfall during the northeast
monsoon season is decreasing at the rate of 79 mm per degree
155

'" "'.
Fig. 5 .7 3-Dirnensional representation of NE monsaon rainfal l over Kerala
156
1000 A .. ..
,,-.... ~
E A .. .. A ..
E .. '---" 600 A
-1 .t\a A 6
-1 A ~ ... -It.
~ 6 ~ 400
Z ... A,sA A6 4 ~~ -« A
~
et: A
200
Fig.5.B Northeast monsoon rainfall versus latitude
157

latitude. The computed correlation coetticient between
latitude and raintall for the 84 stations considered for the
study showed a value ot -0.606, which is negatively
signiticant at 99% level ot significance.
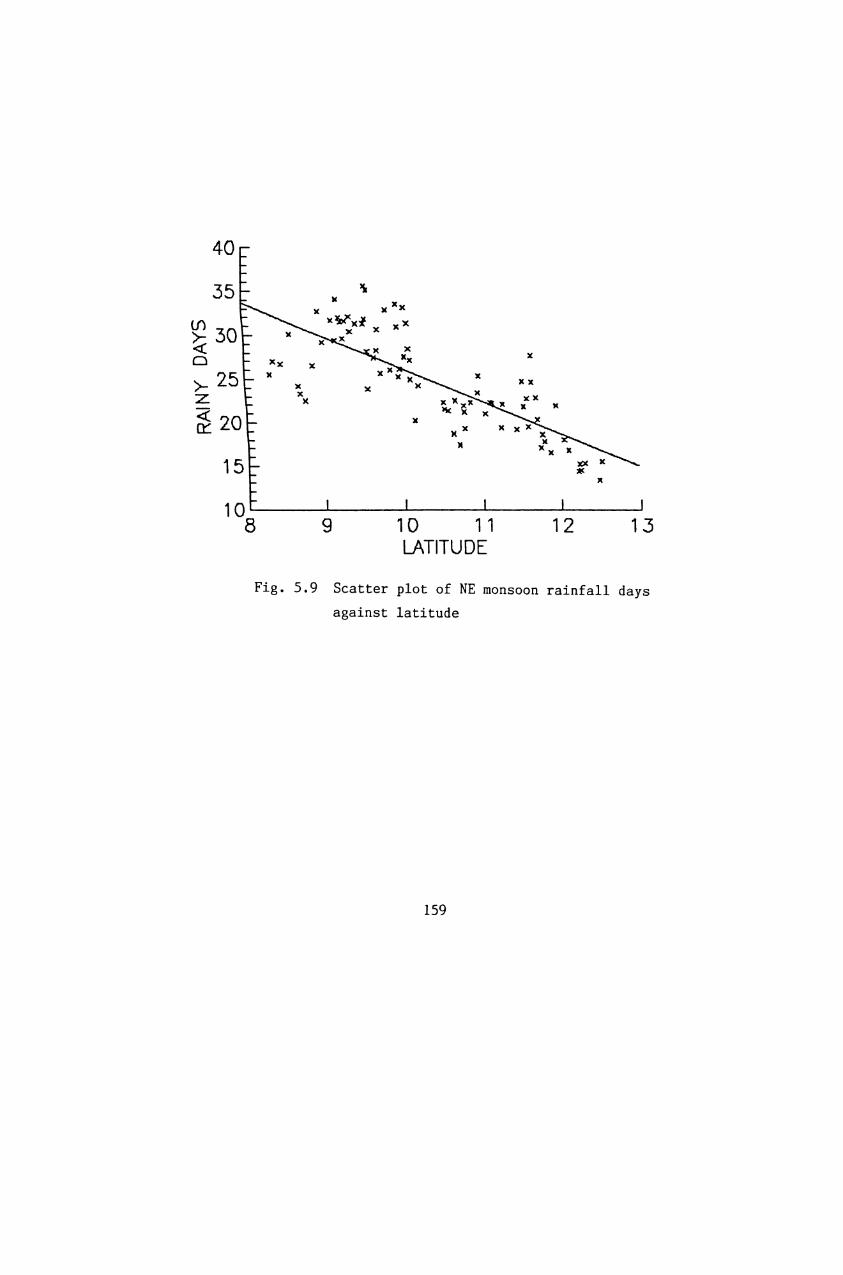
5.9.1 Number of Rainy Days in Northeast Monsoon
Average number of rainy days during the northeast
monsoon season versus latitude is plotted in Fig. 5.9. As in
the case of rainfall during this season, the number ot rainy
days are also decreasing with latitude. South ot 9°N
latitude, average number of rainy days are less to that of
the regression line. Higher number of rainy days are noted
between 9° and 10° N latitude region in the southern part and
around 12° N in the northern part of Kerala. Both these
regions showed higher raintall than that estimated by the
regression equation. The region located between 10° and 11°
30' N latitude belt experiences lower number of rainy
during
south
this season. The average number ot rainy days in
is estimated as 32 is decreased to its half in
northern region.
days
the
the
The estimated correlation coefficient between
latitude and number ot rainy days during the northeast
monsoon season is -0.152, which is also highly significant.
The regression coefficient between the above two parameters
showed a value ot -3.71 rainy days per degree latitude.
158
40
35
(f) 30 ~ o >- 25 z & 20
15
x
)( X X
)(
XX
11
x
xx
10L-----L-----L-----~----~--~ 8 9 10 11 12 13
LATITUDE
Fig. 5.9 Scatter plot of NE monsoon rainfall days
against latitude
159
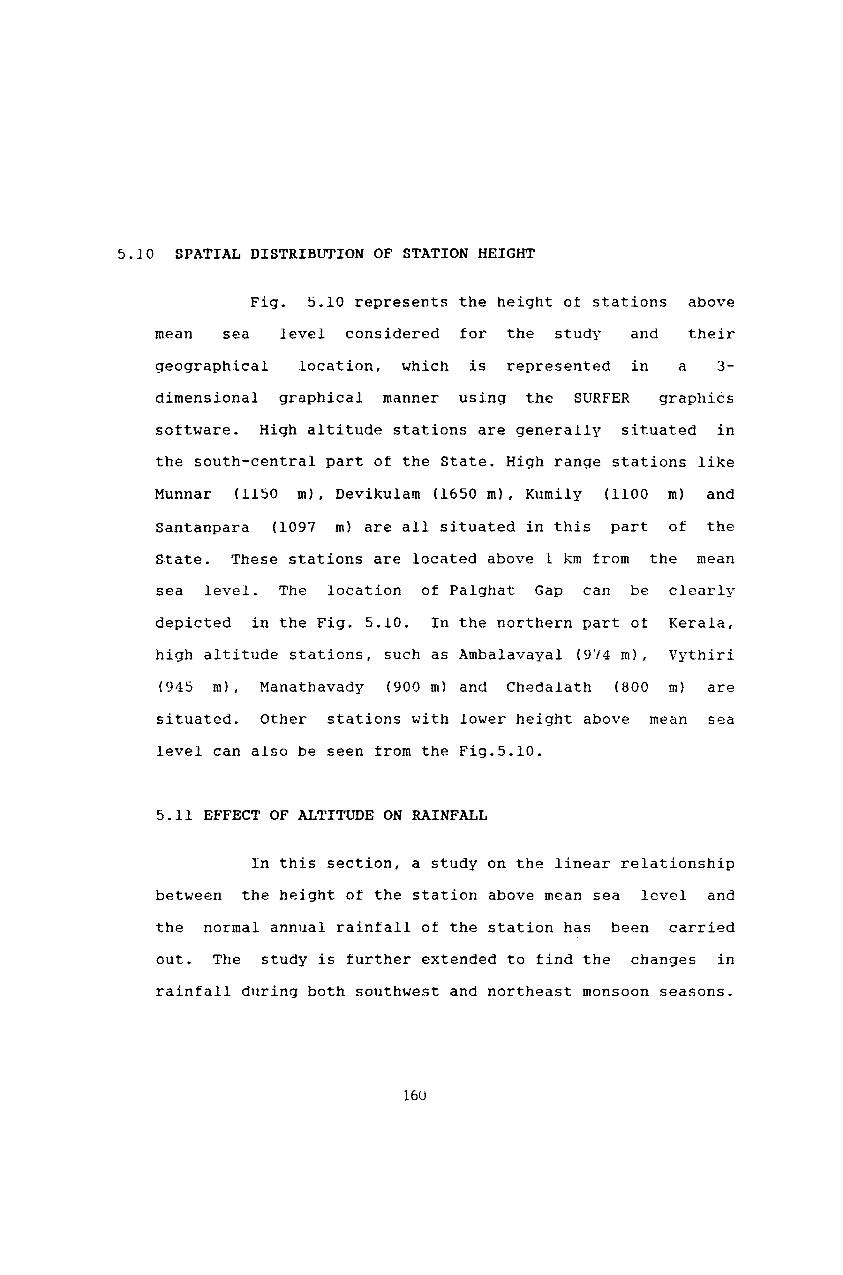
5.10 SPATIAL DISTRIBUTION OF STATION HEIGHT
mean
Fig. 5.10 represents the height ot stations above
sea level considered for the study and their
geographical location, which is represented in a 3-
dimensional graphical manner using the SURFER graphics
software. High altitude stations are generally situated in
the south-central part of the State. High range stations like
Munnar (1150 m), Devikulam (1650 m), Kumily (1100 m) and
Santanpara (1097 m) are all situated in this part ot the
State. These stations are located above 1 km trom the mean
sea level. The location of Palghat Gap can be clearly
depicted in the Fig. 5.10. In the northern part of Kerala,
high altitude stations, such as Ambalavayal (9'l4 m), Vythiri
(915 m), Manathavady (900 m) and Chedalath (800 m) are
situated. Other stations with lower height above mean sea
level can also be seen from the Fig.S.lO.
5.11 EFFECT OF ALTITUDE ON RAINFALL
In this section, a study on the linear relationship
between the height of the station above mean sea level and
the normal annual rainfall ot the station has been carried
out. The study is further extended to find the changes in
raintall dl1ring both southwest and northeast monsoon seasons.
160

~ , ~
~ ~
~ \1 ~
'-
~ ~ 2 ~ t: ~ ..J ~
'" ~
~ '. ~ ,
Fig. 5. 10 3-Dimensional representation of the height of rainfal l
stations above msl

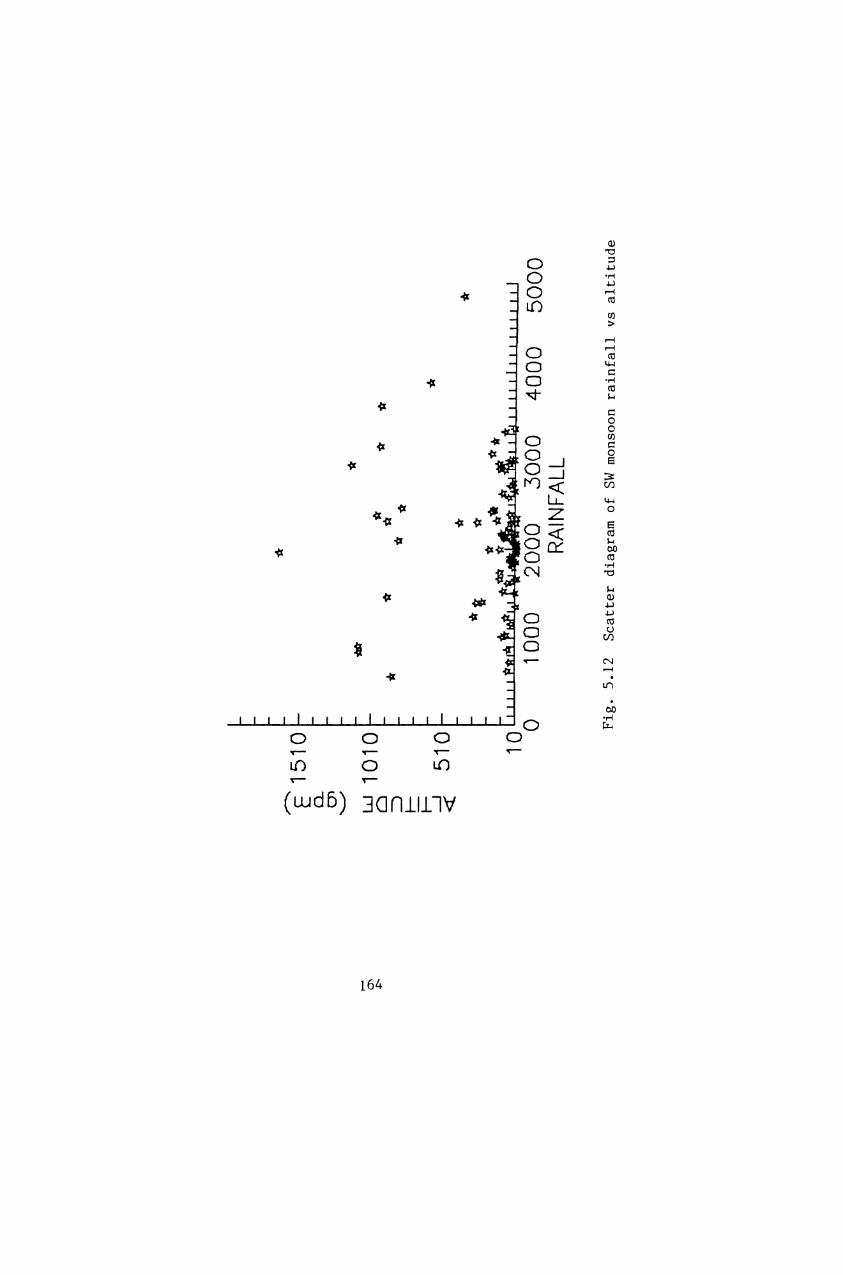
The intluence ot the heiqht ot the station above
mean sea level on raintall during annual, southwest monsoon
and northeast monsoon periods are illustrated in the three
scatter diagrams shown in Figs. 5.11, 5.12, and 5.13,
respectively. From these figures, it seems that the altitude
factor alone does not have signiticant influence on the
raintall ot a station. In the case ot annual rainfall, the
stations near mean sea level experiences raintall in the
range of 500 mm to 3500 mm, in which most of the stations
have rainfall around 2000 mm. Stations located at high
altitude regions are also recorded rainfall in the same
range. It is evident that the criteria of altitude tactor
alone does not hold good for relatively higher rainfall
compared to that of the mean sea level statjons. Similarly,
southwest and northeast monsoon rainfall are also not shown
signiticant influence by the station height (see Figs. 5.12
and 5.13).
162

Fig
. 5
.11
S
catt
er
plo
t o
f an
nu
al ra
infa
ll
ver
sus
alt
itu
de
Fig
. 5
.12
S
catt
er
dia
gra
m o
f SW
mon
soon
ra
infa
ll
vs
alt
itu
de

t-' '" Ul
o E
15
10
0.
.. C
Jl
'--"
w
10
10
C
l => .-
0 0
~
~
o 0
0 <>
8 <>
~
51
0
<!
0
0 0
0
~ O~O
0 ~
<> «.
<> 0
• ..
Jri ~I ~"
I I
I Id
I I
I I~
1 0
I I
I I
I I
I I
I I
I I
I I
I "w
tyl I~.
o 2
00
4
00
6
00
8
00
1
00
0
RA
INFA
LL
Fig
. 5
.13
S
catt
er
diag
ram
of
NE
mon
soon
ra
infa
ll
ver
sus
alt
itu
de


