Page 1
University of Central Florida University of Central Florida
STARS STARS
Electronic Theses and Dissertations, 2004-2019
2016
Variations in Health Services Utilization by Patients with Prostate Variations in Health Services Utilization by Patients with Prostate
Cancer Cancer
Roberta McKee University of Central Florida
Part of the Public Administration Commons, and the Public Affairs Commons
Find similar works at: https://stars.library.ucf.edu/etd
University of Central Florida Libraries http://library.ucf.edu
This Doctoral Dissertation (Open Access) is brought to you for free and open access by STARS. It has been accepted
for inclusion in Electronic Theses and Dissertations, 2004-2019 by an authorized administrator of STARS. For more
information, please contact [email protected] .
STARS Citation STARS Citation McKee, Roberta, "Variations in Health Services Utilization by Patients with Prostate Cancer" (2016). Electronic Theses and Dissertations, 2004-2019. 5199. https://stars.library.ucf.edu/etd/5199
Page 2
i
VARIATIONS IN HEALTH SERVICES UTILIZATION BY PATIENTS WITH
PROSTATE CANCER
by
BOBBIE MCKEE
B.A. Youngstown State University, 2003
M.P.A University of South Florida, 2006
A dissertation submitted in partial fulfillment of the requirements
for the degree of Doctor of Philosophy
in the Department of Public Affairs
in the College of Health and Public Affairs
at the University of Central Florida
Orlando, Florida
Summer Term
2016
Major Professor: Thomas T.H. Wan
Page 3
ii
ABSTRACT
Among men living in the United States, prostate cancer is the second leading cause of
cancer death, and, excluding skin cancers, it is the cancer diagnosed most frequently. While
incidence and mortality rates have been declining, the American Cancer Society estimated that
there were 220,800 men diagnosed with prostate cancer and more than 27,500 prostate cancer
deaths in 2015. Various patient-level and community-level factors have been shown to influence
the differential patterns of diagnosis, care, and outcomes for men with prostate cancer. Detailed
information regarding the utilization of health services by prostate cancer patients, particularly
those with higher propensity for health services use, could be used to inform efforts intended to
improve the coordination and delivery of care to work towards the elimination of disparities. The
purpose of the study is to facilitate a better understanding of the determinants of health services
utilization by older males with prostate cancer in the United States by examining the relative
influence and interaction effects of factors characterizing individual patients and their county of
residence.
Andersen’s behavioral model of health services utilization is used as a framework to
guide this study. A cross-sectional design is used to analyze administrative claims data from the
2008 Medicare Provider Analysis Review (MEDPAR) file (n=5,754). County-level data from
Area Health Resources File (ARHF) are merged to include the community and contextual
characteristics. American Hospital Association (AHA) annual survey data are also used to
examine the importance of hospital attributes in a subset analysis (n=555). A two-stage approach
is used for analyzing the data. First, several social and demographic variables are included in
automatic interaction detector (AID) analysis to identify relatively homogenous subgroups of
patients with similar service utilization patterns for emergency room visits and hospital length of
Page 4
iii
stay. Second, regression analysis is performed in the full dataset including all patients, and in
each subgroup to determine the amount of variance explained by predictor variables categorized
as predisposing, enabling, and need-for-care factors. Hierarchical logistic regression is
performed to analyze the variability in emergency room use, and hierarchical multiple regression
is performed to analyze the variability in hospital length of stay.
The results show that the need-for-care factors are dominant predictors of service use.
However, the relative importance of the predictor variables varies by subgroups of prostate
cancer patients identified in the initial AID analysis. The findings lend some support of the use
of an integrated approach to examine the personal and social determinants of health services
utilization by prostate cancer patients enrolled in the U.S. Medicare program. The theoretical
framework and analytic approach employed in this study make it possible to obtain an in-depth
understanding of the influential factors associated with emergency room use and length of stay
for all-cause hospitalizations, which can be used to inform future research and efforts aimed at
developing targeted interventions to improve the coordinated care and to reduce health
disparities among Medicare beneficiaries with prostate cancer.
Page 5
iv
TABLE OF CONTENTS
LIST OF FIGURES ....................................................................................................................... vi
LIST OF TABLES ........................................................................................................................ vii
LIST OF ACRONYMS/ABBREVIATIONS .............................................................................. viii
CHAPTER ONE: INTRODUCTION ............................................................................................. 1
Problem and Its Significance ...................................................................................................... 1
Theoretical Framework ............................................................................................................... 7
Aims of the Study ..................................................................................................................... 11
Analytic Approach .................................................................................................................... 12
Significance of the Study .......................................................................................................... 16
Organization of Chapters .......................................................................................................... 20
CHAPTER TWO: LITERATURE REVIEW ............................................................................... 21
Introduction to Literature Review ............................................................................................. 21
Approaches in Prostate Cancer Research ................................................................................. 22
Behavioral Model of Health Services Utilization ..................................................................... 27
Predictors of Health Services Utilization .................................................................................. 29
Utilization of Health Services for Cancer Care ........................................................................ 34
Development of Hypotheses ..................................................................................................... 40
Chapter Summary ..................................................................................................................... 44
CHAPTER THREE: RESEARCH METHODOLOGY ............................................................... 46
Research Design........................................................................................................................ 46
Data Sources ............................................................................................................................. 46
Population and Sample Selection.............................................................................................. 48
Measurement of Study Variables .............................................................................................. 50
Methods of Data Analysis ......................................................................................................... 61
Chapter Summary ..................................................................................................................... 70
CHAPTER FOUR: RESULTS ..................................................................................................... 72
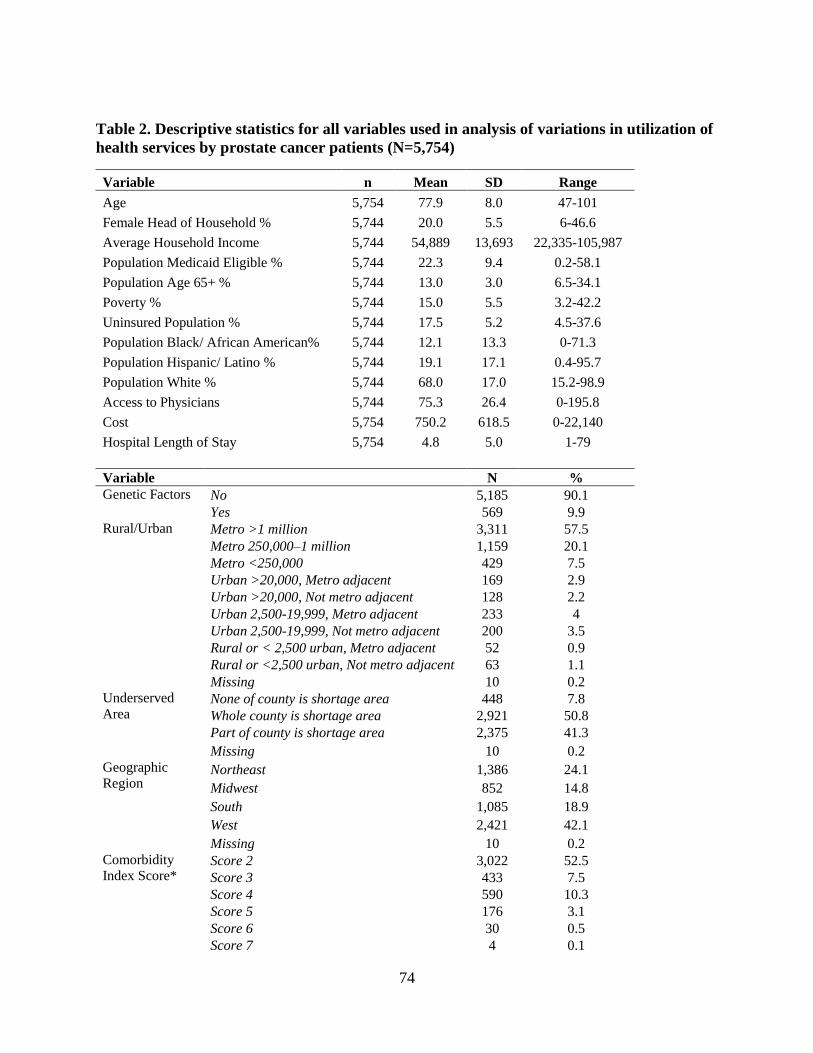
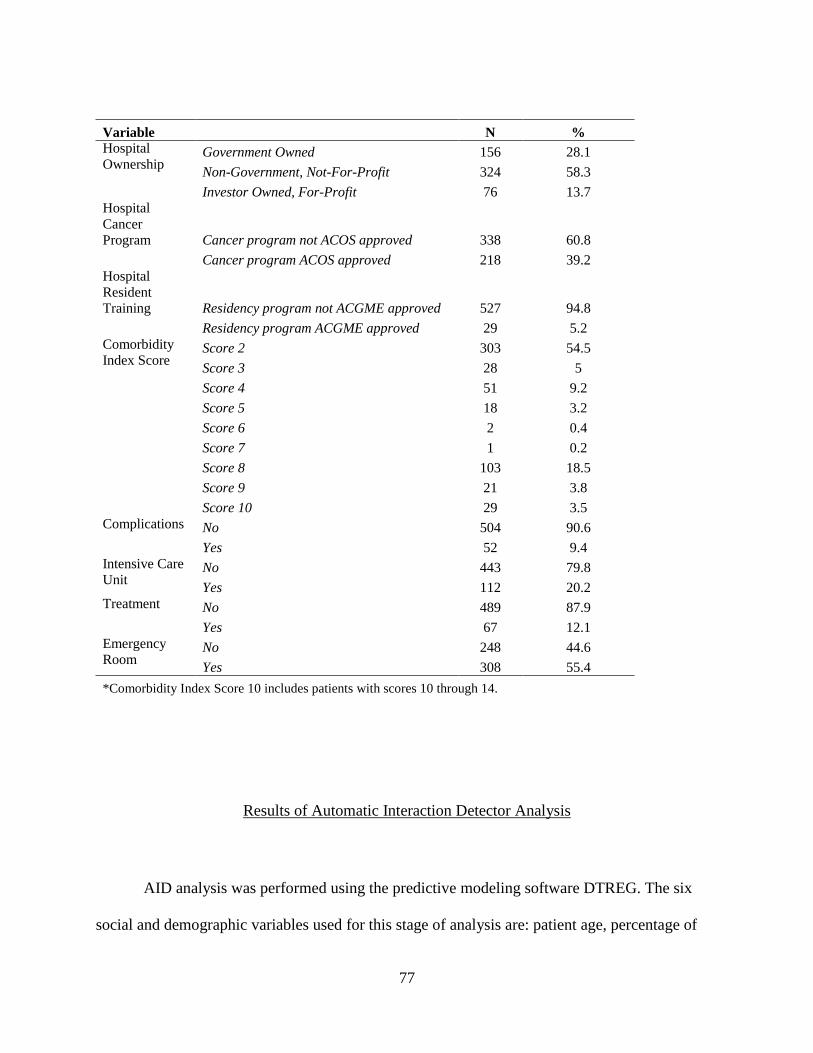
Descriptive Statistics ................................................................................................................. 73
Results of Automatic Interaction Detector Analysis ................................................................ 77
Page 6
v
Results of Regression Analysis in the Target Subgroups ......................................................... 85
Results of Hypothesis Testing and the Overall Model Validation ......................................... 123
CHAPTER FIVE: DISCUSSION AND CONCLUSIONS ........................................................ 130
Introduction to Discussion ...................................................................................................... 130
Summary of Major Findings: Hypothesis Testing and Model Validation .............................. 131
Implications............................................................................................................................. 133
Contributions........................................................................................................................... 140
Study Limitations .................................................................................................................... 141
Future Research ...................................................................................................................... 144
Conclusions ............................................................................................................................. 148
APPENDIX A: ICD-9-CM CODES USED FOR VARIABLES ............................................... 151
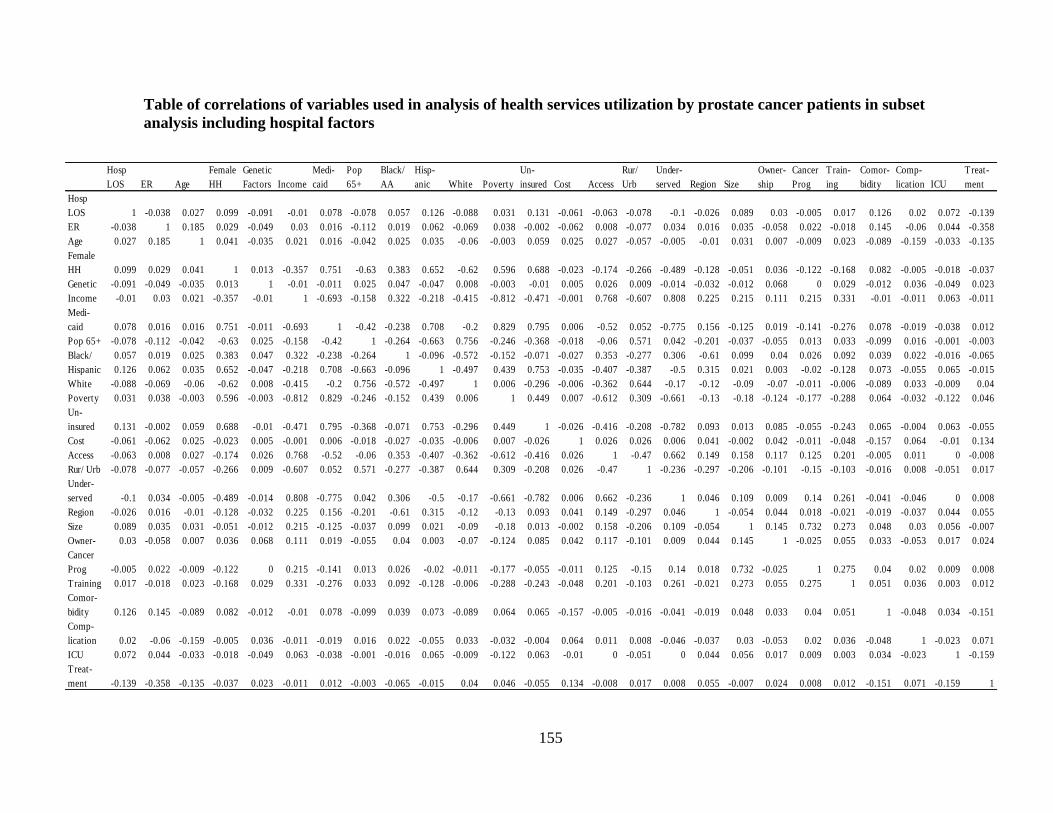
APPENDIX B: TABLES OF CORRELATIONS ...................................................................... 153
APPENDIX C: SUMMARY OF PREDICTOR TREE TERMINAL NODES .......................... 156
APPENDIX D: LOGISTIC REGRESSION RESULTS............................................................. 158
APPENDIX E: MULTIPLE REGRESSION RESULTS ........................................................... 165
APPENDIX F: SUBSET ANALYSIS LOGISTIC REGRESSION RESULTS ........................ 180
APPENDIX G: SUBSET ANALYSIS MULTIPLE REGRESSION RESULTS ...................... 190
APPENDIX H: IRB APPROVAL .............................................................................................. 197
REFERENCES ........................................................................................................................... 199
Page 7
vi
LIST OF FIGURES
Figure 1. Andersen’s Initial Behavioral Model .............................................................................. 8
Figure 2. Schematic diagram of modified model for analyzing utilization of inpatient health
services by prostate cancer patients .............................................................................................. 10
Figure 3. Predictor tree for analysis of emergency room utilization by prostate cancer patients . 80
Figure 4. Predictor tree for analysis of hospital length of stay by prostate cancer patients.......... 81
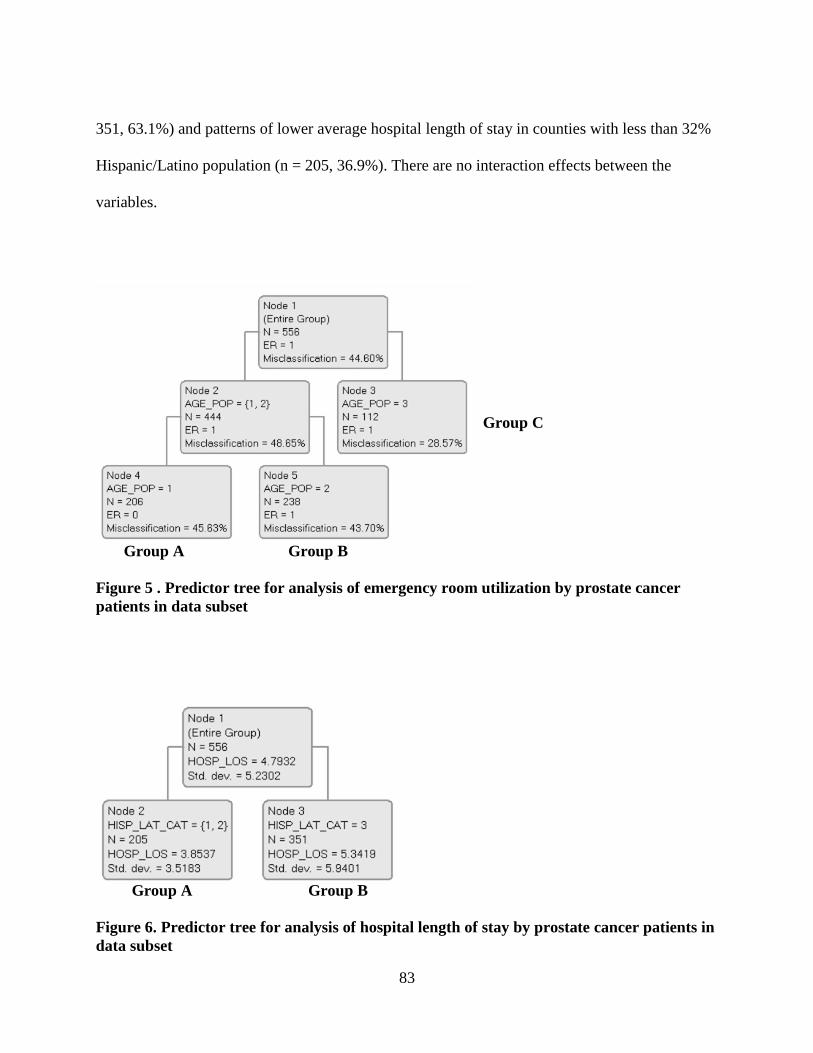
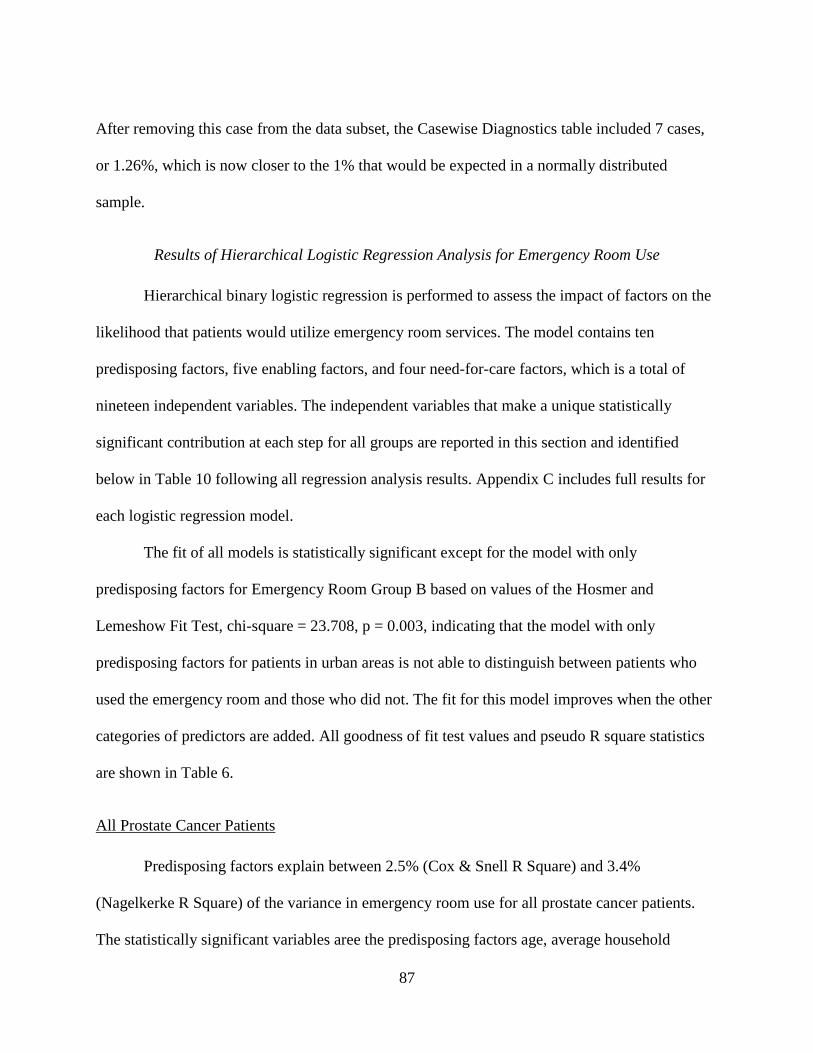
Figure 5 . Predictor tree for analysis of emergency room utilization by prostate cancer patients in
data subset ..................................................................................................................................... 83
Figure 6. Predictor tree for analysis of hospital length of stay by prostate cancer patients in data
subset............................................................................................................................................. 83
Page 8
vii
LIST OF TABLES
Table 1. Measurement of predictor variables selected for analysis of variations in health services
utilization by prostate cancer patients ........................................................................................... 60
Table 2. Descriptive statistics for all variables used in analysis of variations in utilization of
health services by prostate cancer patients (N=5,754).................................................................. 74
Table 3. Descriptive statistics for variables used in analysis of variations in utilization of health
services by prostate cancer patients using data subset with hospital variables (N=556) .............. 76
Table 4. Characteristics, average hospital length of stay and percentage of emergency room
utilization by prostate cancer patients for six independent variables in automatic interaction
detector analysis ............................................................................................................................ 78
Table 5. Description of subgroups used for regression analysis of variations in health services
utilization by prostate cancer patients ........................................................................................... 84
Table 6. Goodness of fit tests and variance in emergency room utilization by prostate cancer
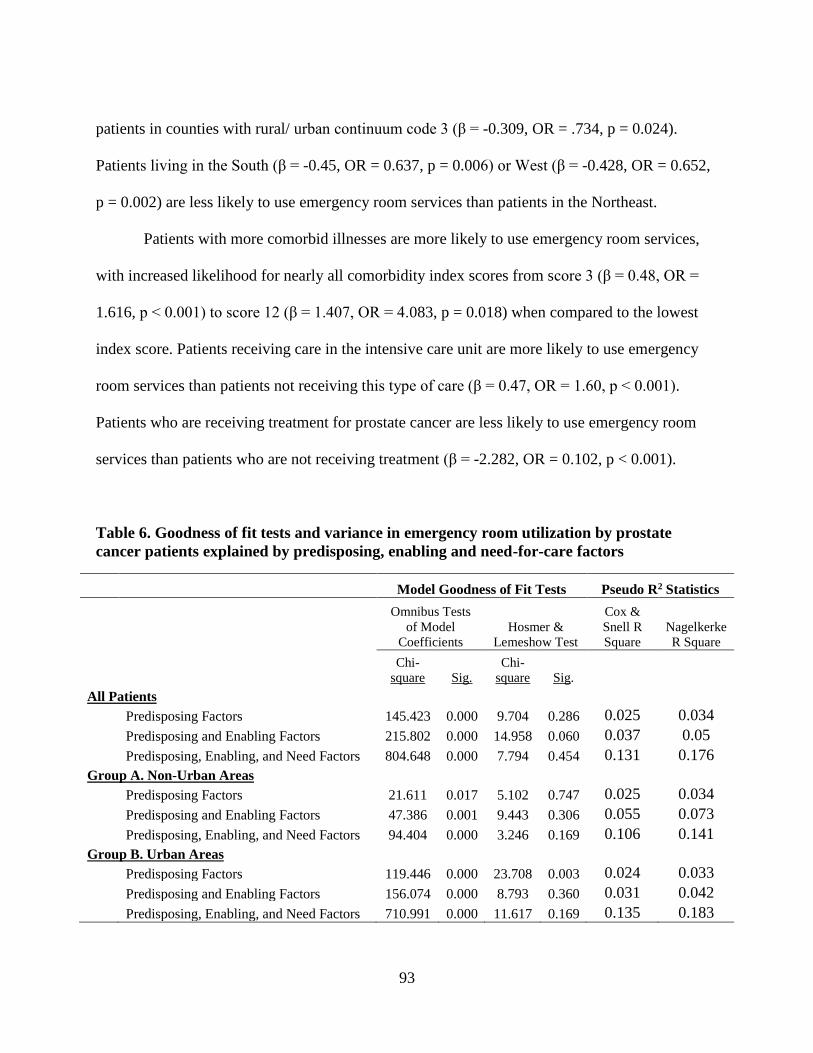
patients explained by predisposing, enabling and need-for-care factors ...................................... 93
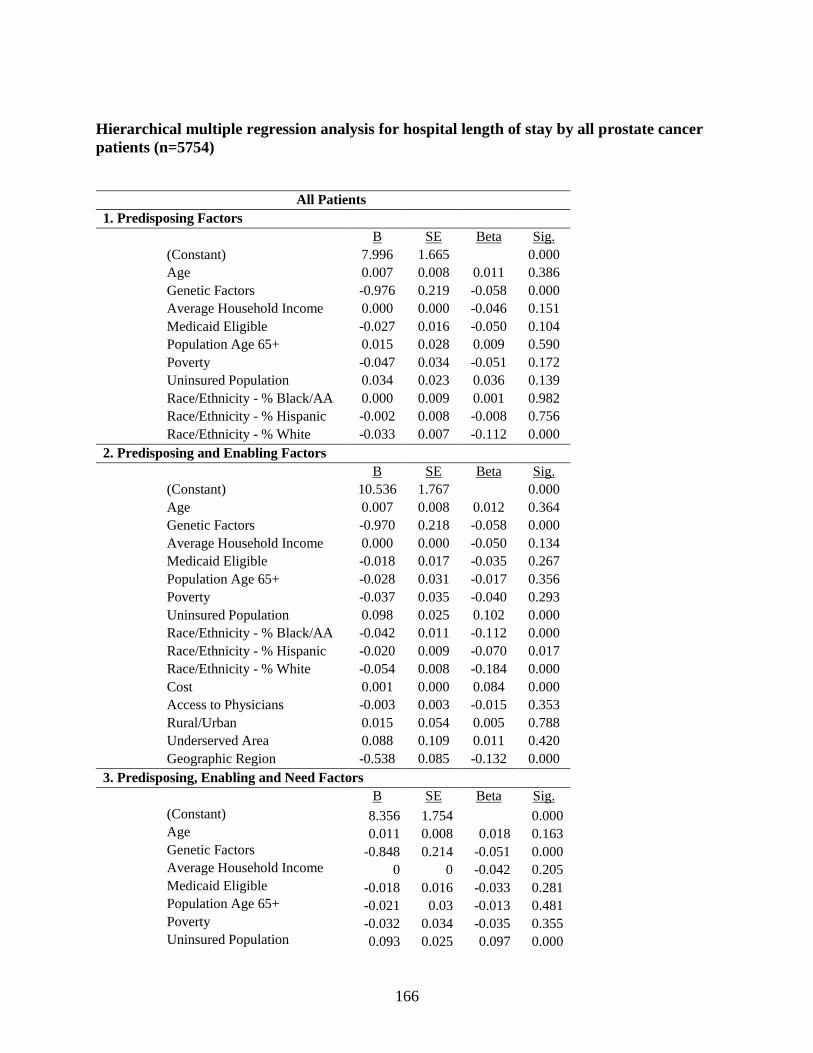
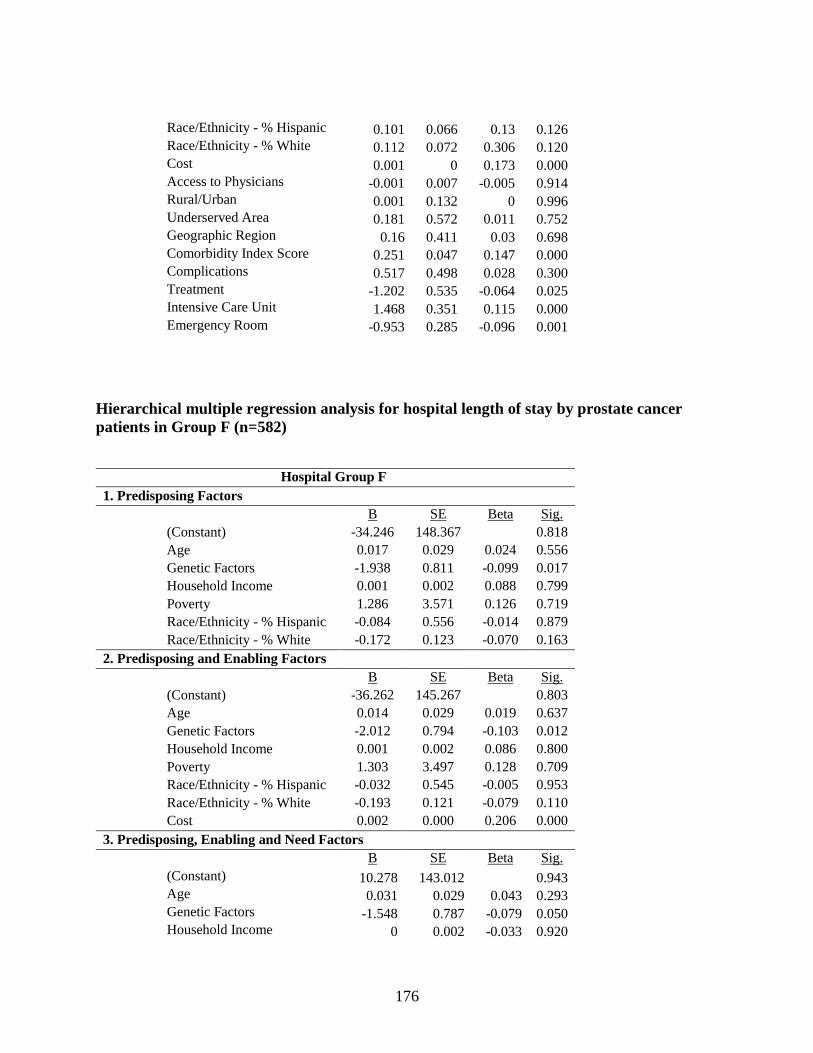
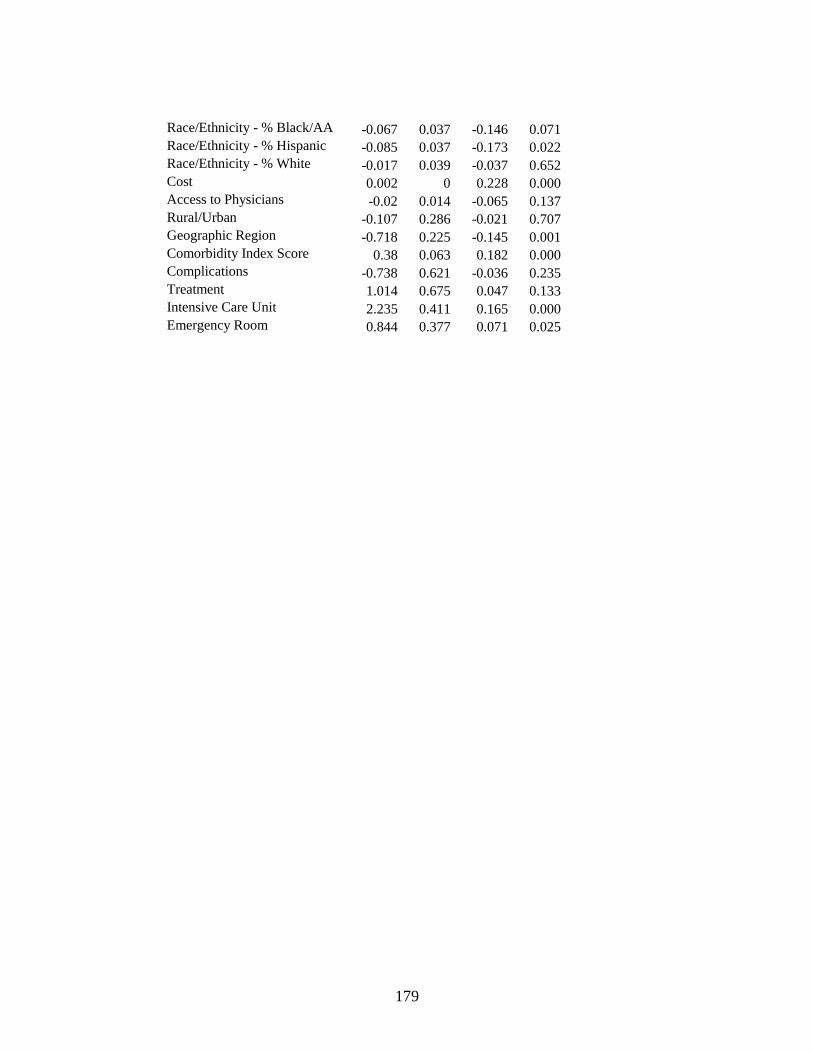
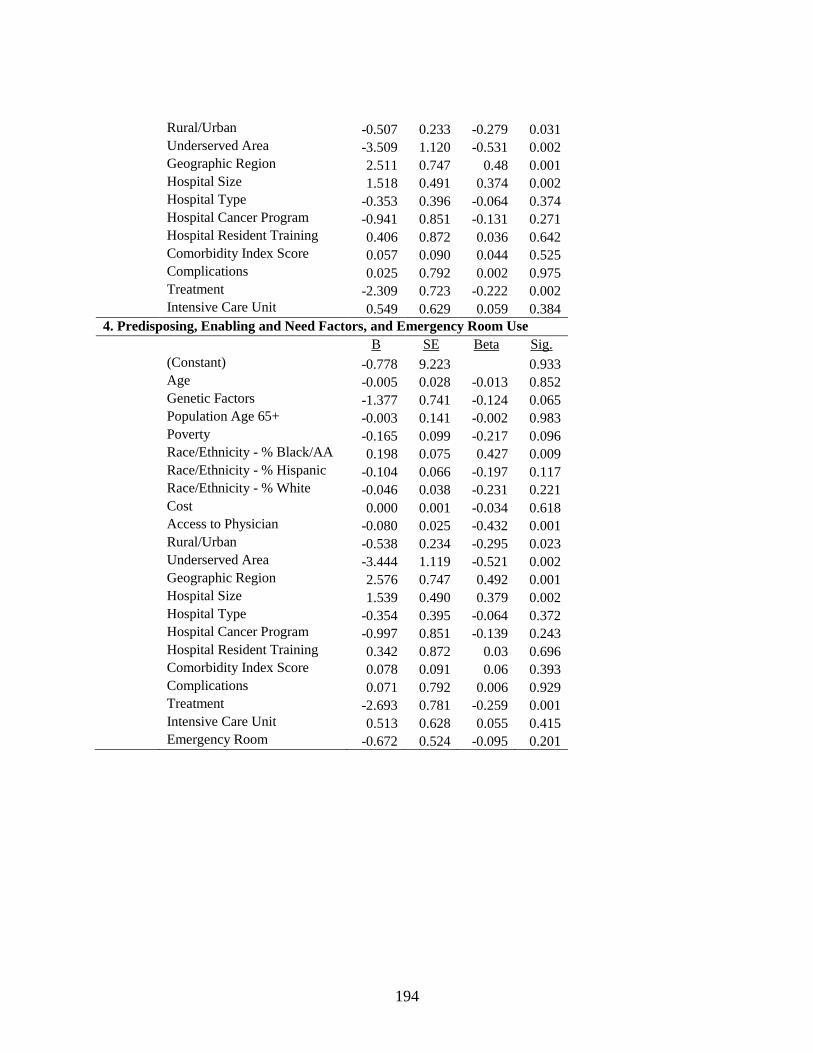
Table 7. Variation in hospital length of stay by prostate cancer patients explained by
predisposing, enabling and need-for-care factors, and emergency room use ............................... 95
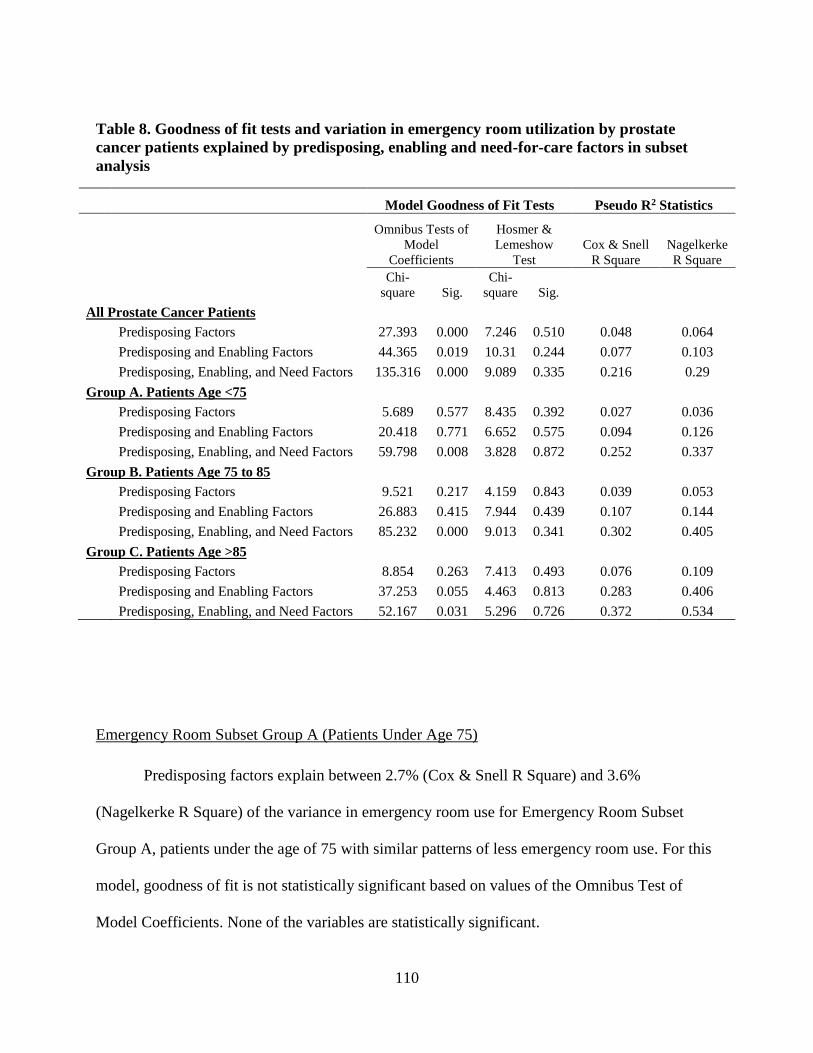
Table 8. Goodness of fit tests and variation in emergency room utilization by prostate cancer
patients explained by predisposing, enabling and need-for-care factors in subset analysis ....... 110
Table 9. Variation in hospital length of stay by prostate cancer patients explained by
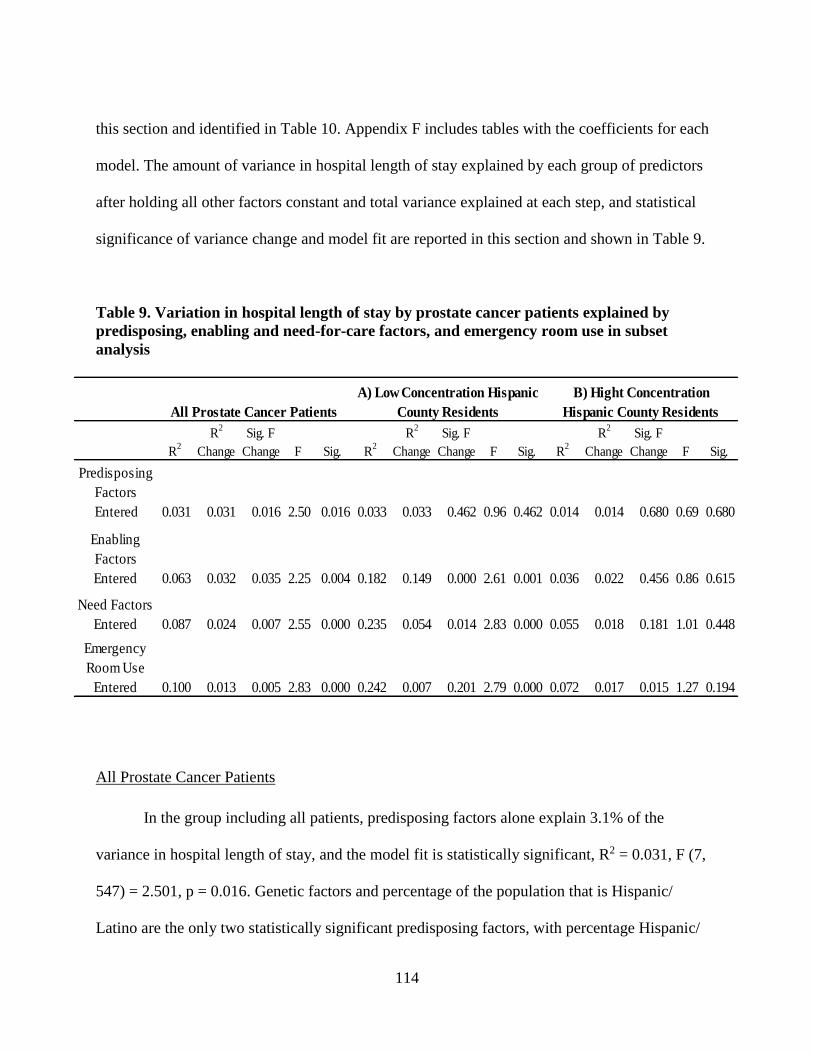
predisposing, enabling and need-for-care factors, and emergency room use in subset analysis 114
Table 10. Statistically significant predictors from regression analysis of emergency room
utilization and hospital length of stay by prostate cancer patients.............................................. 120
Table 11. Results of hypothesis testing for utilization of health services by prostate cancer
patients ........................................................................................................................................ 132
Page 9
viii
LIST OF ACRONYMS/ABBREVIATIONS
AA African American
AHA American Hospital Association
AHRF Area Health Resources File
AHRQ Agency for Healthcare Research and Quality
AID Automatic Interaction Detector
ACoS American College of Surgeons
CMS Centers for Medicare and Medicaid Services
ER Emergency Room
FIPS Federal Information Processing Standard
HPSA Health Professional Shortage Area
HRSA Health Resources and Services Administration
ICD-9-CM International Classification of Disease, 9th edition, Clinical Modification
ICU Intensive Care Unit
MEDPAR Medicare Provider Analysis Review
NCI National Cancer Institute
OR Odds Ratio
PEDSF Patient Entitlement and Diagnosis Summary File
PSA Prostate-Specific Antigen
SEER Surveillance, Epidemiology and End Results
SSA Social Security Administration
VIF Variance Inflation Factor
Page 10
1
CHAPTER ONE: INTRODUCTION
Problem and Its Significance
Among males living in the U.S., prostate cancer is the second leading cause of cancer
death, and, excluding skin cancers, remains the cancer diagnosed most frequently. In 2015, an
estimated 220,800 men will be diagnosed with prostate cancer and more than 27,500 will die
from it. According to the American Cancer Society, approximately 25 years ago, prostate cancer
incidence numbers increased considerably as a result of more screening using the prostate-
specific antigen (PSA) blood test, but since then, there has been a decline in the rates of
incidence as well as death. Incidence rates have decreased by 2.8% each year in men 65 and
older and were stable in those younger than 65 from 2007 to 2011; death rates have declined by
3.2% each year during that same time period. Although there have been declines in prostate
cancer incidence and death rates, in black men, the incidence rates are approximately 60% higher
and death rates are more than twice that of other racial and ethnic groups (American Cancer
Society, 2015, p.20).
The burden of prostate cancer is quite complex. There are numerous issues confounding
the problem, such as the lack of consensus about screening to diagnose prostate cancer and
which of the multiple treatment options is optimal, challenges identifying and reaching those
who are most at risk, variations in access to the providers and quality care needed to reduce
adverse health outcomes, and high costs to both the patient and health care system. Most often, it
is believed that when cancer is diagnosed early, treatment is more effective and less costly.
Page 11
2
Screening with PSA test to diagnose prostate cancer, however, has been met with greater
uncertainty. Randomized clinical trials have not found there to be survival increases using this
screening test, and there are conflicting views on whether or not the risk of potential treatment
side effects is greater than the benefit of diagnosing and treating the cancers found through PSA
based screening (Ross, Taylor & Howard, 2011, p. 229).
While increasing age, African ancestry, a family history, and genetic susceptibility due to
certain inherited conditions are said to be the only well-established risk factors for prostate
cancer, studies have provided evidence suggesting a number of other potentially impactful
factors, such as particular dietary choices also increase risk, a higher risk of aggressive prostate
cancer due to obesity, association between smoking and prostate cancer death, and disparities in
health practices and the delivery and utilization of care between groups according to
race/ethnicity, socioeconomics, and/or geography (American Cancer Society, 2015, p. 20;
DeChello, Gregorio, & Samociuk, 2006, pp. 59-60). Although “the literature has contradictory
findings” and “the reasons why the poor present with more advanced stages are unclear,” studies
have identified factors such as diet, race, lack of health insurance, being poor, and, low literacy
as being possible influences (Brawley & Jani, 2007, p. 214).
Most prostate cancer patients, 93%, are diagnosed with local or regional stage, which has
a 5-year relative survival rate of nearly 100%, and research into new biologic markers to improve
the distinction between indolent and aggressive prostate cancer is underway (American Cancer
Society, 2015, p. 20). However, it currently remains that some patients will have prostate cancer
that is at an advanced stage and/or has spread, and thus have distinct needs which may impact the
utilization of health services. Metastasis to the bone can put patients at risk for various
complications which are associated with impaired health-related quality of life, greater
Page 12
3
comorbidity, decreased survival, and increased healthcare costs. Improved coordination across
various clinical services and care settings can be supported through detailed information
concerning the health services utilized following the diagnosis of advanced-stage prostate cancer
(Hagiwara, Delea, Saville & Chung, 2013, p. 23; Yong, Onukwugha, Mullins, Seal & Hussain,
2014, p. 297). The costs to Medicare for care of prostate cancer patients in the last year of life is
estimated to be $34,000 (American Cancer Society Cancer Action Network, 2012, p.19).
The various aspects and issues that may potentially make it challenging to adequately
identify the specific individuals and populations likely to be faced with this disease are met with
the additional difficulties associated with the development of targeted interventions to better
coordinate care and control costs. Variations in the use of services, care patterns and survival
outcomes of prostate cancer patients have been documented, indicating that there is a lack of
equality in the health and healthcare for men diagnosed with this disease. There have been
observed differences in the use of specialist services by race among older men with prostate
cancer due to patient-level and community factors (Onukwugha, et al., 2014), and in the use of
mental health services by cancer patients who are disadvantaged ethnic minorities and are
potentially not receiving the same recommendations for mental health problems as other cancer
patients (Nakash, Nagar, Alon, Gottried, & Levav, 2012). Care and mortality differences have
been found to exist across individual-level factors, such as race, age, and marital status, as well
as across area-level factors, like the number of physicians, poverty rate, and racial distribution.
On the issue of care patterns for prostate cancer, Brawley and Jani (2007) state, “There are
significant data to show disparities in the amount and type of treatment given by a number of
parameters. There are clear age, racial, and SES differences in patterns of care received” (p.
218).
Page 13
4
Researchers have reported observed disparities in prostate cancer treatment and survival
for different racial/ethnic groups, health care settings, and socioeconomic classes (Onega, et al.,
2010; Rapiti, et al., 2009). The utilization of therapies for localized prostate cancer has also been
found to vary by race, geography, and health care setting; when differences in disease biology
cannot be used to explain such variations, it is possible that there are inequities in care delivery
(Spencer, et al., 2008, p. 3736). The factors that have been shown to influence such variabilities
are attributes of not only the individual, but also the social structure and contextual environment.
It is important to understand the determinants of racial and ethnic disparities in health
resource utilization, treatment, cost, and mortality when developing policies intended to
effectively improve the quality of care prostate cancer patients receive (Jayadevappa, Chhatre,
Johnson, & Malkowicz, 2011, p. 97). After reviewing numerous studies, the Institute of
Medicine disclosed that racial and ethnic disparities actually decline to some degree when
variation in health insurance coverage and system attributes that influence access to and quality
of healthcare are accounted for in analyses (Onega, et al., 2010, p.2698). This highlights the need
for contextual factors to be included in research, as availability of resources and way in which
care is delivered can account for some of the variation that may otherwise attributed to personal
or social factors.
The health care delivery system is common topic among researchers, decision makers,
politicians, and individuals; it often seems like an almost unavoidable topic. A massive effort to
reform the U.S. health care system began in 2010 when the Patient Protection and Affordable
Care Act was signed into law. This legislation impacted oncology in several ways. By
broadening cancer care to millions of additional Americans and expanding Medicaid, more
patients with cancer are able to have coverage, which eliminates ethical dilemmas associated
Page 14
5
with the care they receive, and could help with earlier diagnosis and improved outcomes.
Insurers must cover at least one drug of each type, thus granting broader treatment coverage, and
they are prohibited from denying coverage for investigational trials, preexisting conditions, or
technicalities. Annual or lifetime caps on coverage are also prohibited. Closing the hole in
Medicare Part B eliminates high out of pocket expenses, making costly drugs more affordable.
Important necessities in cancer care such physical therapy are covered, and preauthorization for
emergency room care is no longer required (Kantarjian, Steensma, & Light, 2014, p. 1601). As
provisions of the Affordable Care Act are implemented and evolve, and new ideas and proposals
are put forth, there will continue to be a need for reliable and useful information.
Policy makers and public health professionals are often tasked with determining how
resources, which are often limited, should be dispensed, and which strategies are best for
individuals, communities, and society as a whole. The Agency for Healthcare Research and
Quality (AHRQ) reported in 2009 that in comparison to other conditions, cancer care-related
hospitalizations are lengthier and cost $5,700 more for each stay, and for nearly half of these
hospital stays Medicare was identified as the payer. In 2010, national expenditures for cancer
care were estimated to be $124 billion; this amount is expected to rise to $173 billion in 2020
(Manzano, Lou, Elting, George, & Suarez-Almazor, 2014, p. 3527). Medicare spending for
cancer care totaled $34.4 billion in 2011. Prostate cancer accounted for 10% of these
expenditures. The out-of-pocket costs are 15% higher for Medicare beneficiaries with cancer
compared to those who do not have cancer; for prostate cancer patients, out-of-pocket costs are
estimated to be 18% higher (American Cancer Society Cancer Action Network, 2012, pp. 15-
16). Given the high costs associated with cancer care, and the need for equitable and effective
Page 15
6
public policies, efforts to better understand factors that impede or facilitate the utilization of
services, and modify and/or develop interventions as necessary continue to be important.
Health behavior research has been approached from multiple perspectives. As such, the
way in which health is defined may differ based on the profession or discipline. “Physicians,
sociologists, anthropologists, and psychologists offer different definitions of health and illness”
according to Gochman (1997), describing the emphasis that physicians place on pathology, while
the emphasis by psychologists is feelings of well-being, perceptions, and equilibrium,
sociologists give emphasis to the ability to adhere to expected behavioral norms or perform roles
and tasks, and symptom responses in relation to cultural implications is emphasized by
anthropologists (pp. 9-10). Cancer has been widely studied by researchers across disciplines. The
attention given to prostate cancer specifically has been ongoing and consistent over the years,
and it too has been approached from multiple perspectives, such as psychology, sociology, and
economics. These research efforts have contributed significantly to understanding the many
issues surrounding the health and health care of prostate cancer patients. However, the problems
that need to be addressed often occur in an environment that must simultaneously consider the
aspects of individuals and communities, as well as costs and the care delivery system.
Despite what is already known about why variations might exist in the utilization of
services, treatment and survival of prostate cancer patients, there are gaps remaining in the
current level of knowledge surrounding specific characteristics and predictors contributing to
such differences. Group differences in chronic disease outcomes are often attributed to variations
in the utilization of health services, access to care, and treatment patterns (Freeman, Durazo-
Arvizu, Arozullah, & Keys, 2003, p. 1706). The examination of health services utilization is
needed for understanding access to services, identifying possible gaps in services, and improving
Page 16
7
organizational efficiency and cost-effectiveness (Treanor & Donnelly, 2012, p. 1). Decision
makers and clinicians need to maintain an awareness of health resource utilization as new
treatment patterns evolve, as comprehensive information on utilization of health services in
patients with prostate cancer can help inform the conversation about resource use and emerging
care patterns (Seal, et al., 2014, p. 556). Detailed information regarding the utilization of health
services by prostate cancer patients, particularly those with higher propensity for health services
use, could be used to support the coordination of health care delivery by considering the relative
importance of various personal and societal factors.
Aday and Andersen (1974) describe health services utilization research as providing “a
framework to describe those factors that inhibit of facilitate entrance to the health care delivery
system as well as measurements of where, how often, and for what purposes entry is gained and
how these inhibiting (or facilitating) factors operate to affect admittance” (p. 216). In order to
develop appropriate, evidence-based public policies and other health interventions to support
equitable and appropriate care needed by patients with the burdensome and complex disease of
prostate cancer, information regarding the individual and contextual factors impacting the
utilization of health services could be of great value.
Theoretical Framework
The behavioral model of health services use has been widely used by researchers as a
framework to examine the use of various types of health services for numerous illnesses and
conditions for an array of populations. Developed by Andersen in the late 1960’s, this model was
Page 17
8
initially intended to support efforts aimed at understanding the reasons families use health
services and the development of policies that encourage equitable access, and to address how
equitable access is defined and measured (Andersen, 1995, p.1). According to the model, use
depends on an individual’s predisposition to use services based on demographic, social, and
health belief factors, the ability to secure services given the personal and community resources
available, and the level of need the illness presents as perceived by the individual and evaluated
by medical professionals. These predisposing, enabling, and need-for-care factors constitute a
sequence of conditions that contribute to whether or not people use services and the volume of
services used (Andersen & Aday, 1978, p. 534). Andersen’s initial behavioral model of the
1960s (Andersen, 1995, p. 2) is shown in Figure 1.
Figure 1. Andersen’s Initial Behavioral Model
In the initial model, health services use is a function of predisposing characteristics,
enabling resources, and need-for-care factors. These three categories of predictors remain to be a
fundamental component in subsequent phases of the model. Over time, revisions were made to
PREDISPOSING
CHARACTERISTICS
│
Demographic
│
Social Structure
│
Health Beliefs
ENABLING
RESOURCES
│
Personal/ Family
│
Community
NEED
│
Perceived
│
Evaluated
USE OF HEALTH SERVICES
Page 18
9
the model. Additions in phase two were the health care system, more detailed measures of use,
and consumer satisfaction as an outcome of health services use. Outcome was expanded upon in
the third phase with the addition of perceived and evaluated health status. Phase three also
included the external environment and personal health practices (Andersen, 1995, pp. 5-6).
These developments to the model are particularly relevant from a policy perspective given that
not just the individual, but also many important factors regarding society, system organization,
and resource use must be taken into consideration.
Aday and Awe (1997) describe several defining contributions of this model to research
in the field of health service use as: 1) systematic characterization of service utilization
predictors as predisposing, enabling, and need factors; 2) delineation of utilization indicators
based on type of service and reason for use; 3) specifying the hypothesized relationship between
predictive factors and indicators of use; and 4) provision of an integrated theoretical and
empirical approach that is generalizable to various populations and health policy problems (p.
154). The ability to provide an integrated approach is of particular importance as it prevents
analyses from being restricted by a single discipline or dimension of a problem. While this model
has been frequently employed in studies of health services utilization, its application has been
less frequent in prostate cancer studies, which are often approached from a single perspective
such as the psychological perspective, sociological perspective, or economic perspective. The
broad perspectives in prostate cancer research will be discussed in greater detail in Chapter Two.
A comprehensive understanding of the individual and societal determinants of use can
provide new information that offers a valuable contribution to distinguishing variations in health
services utilization patterns by prostate cancer patients. Andersen and Newman (1973) describe
that in this model, the utilization of services is recognized as “a type of individual behavior,” and
Page 19
10
societal determinants are also taken into account, as these factors “are shown to affect the
individual determinants both directly and through the health services system” (Andersen &
Newman, 1973, pp. 96-97). A social behavior system model provides an integrated approach that
is not confined by a single perspective.
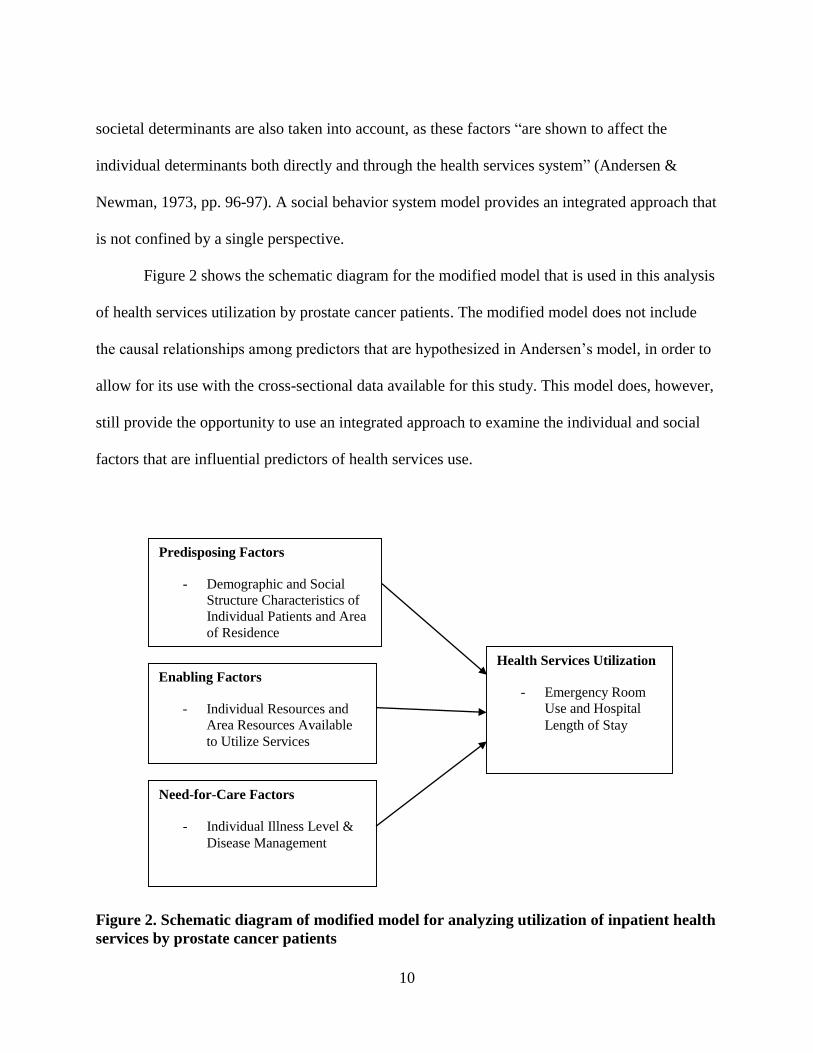
Figure 2 shows the schematic diagram for the modified model that is used in this analysis
of health services utilization by prostate cancer patients. The modified model does not include
the causal relationships among predictors that are hypothesized in Andersen’s model, in order to
allow for its use with the cross-sectional data available for this study. This model does, however,
still provide the opportunity to use an integrated approach to examine the individual and social
factors that are influential predictors of health services use.
Figure 2. Schematic diagram of modified model for analyzing utilization of inpatient health
services by prostate cancer patients
Predisposing Factors
- Demographic and Social
Structure Characteristics of
Individual Patients and Area
of Residence
Need-for-Care Factors
- Individual Illness Level &
Disease Management
Enabling Factors
- Individual Resources and
Area Resources Available
to Utilize Services
Health Services Utilization
- Emergency Room
Use and Hospital
Length of Stay
Page 20
11
Aims of the Study
The purpose of this study is to facilitate a better understanding of the determinants of
health services utilization by older males with prostate cancer in the United States. The research
problem explored focuses on reasons for differential use patterns of services by examining
predisposing factors, enabling factors, and need-for-care factors characterizing individual
patients and their county of residence to determine which factors are the most important
predictors, the degree to which they impact use, and their interaction effects. Distinguishing the
sources of variation in hospital length of stay and use of emergency room services may make it
possible to identify personal and/or social aspects impacting health services utilization behaviors
and determine the relative importance of such factors to provide an indication of use patterns in
the sample population and possible homogenous subgroups. The sample population includes
patients that have been diagnosed with prostate cancer. These patients are Part A Medicare
beneficiaries who have been admitted to the hospital for any condition at least once in the 2007
calendar year.
The following research questions are addressed:
1. What is the relative importance of predisposing factors, enabling factors, and need-for-
care factors in accounting for variability in emergency room use among prostate cancer
patients?
Page 21
12
2. What is the relative importance of predisposing factors, enabling factors, and need-for-
care factors in accounting for variability in hospital length of stay among prostate cancer
patients?
3. To what degree does emergency room use have an effect on hospital length of stay
among prostate cancer patients?
4. Do predisposing, enabling, and need-for-care factors show any important interaction
effects accounting for the variability in the use of health services in specific subgroups of
prostate cancer patients?
5. To what degree do hospital attributes influence the utilization of health services among
prostate cancer patients?
Analytic Approach
This is a non-experimental study using a cross-sectional design, and a two stage approach
for data analysis. Prostate cancer patients with inpatient records in administrative claims data
from a single year are studied to observe influential factors associated with differential patterns
of emergency room use and hospital length of stay. Based on the theoretical framework, the
independent variables are categorized as predisposing, enabling and need-for-care factors, and
Page 22
13
take into account both personal and societal characteristics. This approach is intended to more
precisely identify which factors are influential, their relative importance, and any important
interaction effects to better understand variations in health services utilization by prostate cancer
patients.
The analysis uses data from the Medicare Provider Analysis Review (MEDPAR) file.
This file includes one summarized record per admission for all Medicare Part A inpatient
hospital visits and skilled nursing facility bills during a single calendar year. Patient records that
are excluded from the dataset include those that do not include a diagnosis of prostate cancer and
skilled nursing facility admissions. The MEDPAR claims records make it possible to analyze
variabilities in emergency room use and length of hospital stay by prostate cancer patients.
Although a longitudinal analysis would have been more desirable, the 2008 MEDPAR file is the
only year that is available to use for this project.
Two additional data sources are included in this study. Data regarding the contextual
environment of the counties in which patients live is obtained from Area Health Resources Files
(AHRF), which is generated by the U.S. Department of Health and Human Services, Health
Resources and Services Administration (HRSA) using a collection of other data sources.
American Hospital Association (AHA) Survey Data is used for information pertaining to hospital
attributes. Analysis of hospital variables categorized as enabling factors is performed in only a
subset of the administrative claims data due to the fact that only a portion of patient records are
able to be matched with the facility information in the AHA survey dataset.
The first stage of data analysis uses the predictive modeling computer software DTREG
to build classification and regression decision trees to identify subgroups of prostate cancer
patients having homogeneous patterns of health services use through automatic interaction
Page 23
14
detector (AID) analysis. Several social and demographic variables are used as predictors to
subdivide the sample into clusters presented in a single-tree model that includes a node for each
split. By examining of the terminal nodes and information pertaining to the split points, it is
possible to identify influential predictors and any important interaction effects between the
variables. This stage of analysis is intended to identify subgroups of prostate cancer patients with
similar use patterns and assess which factors and interactions of factors may be associated higher
or lower utilization of emergency room services and hospital length of stay hospital by
partitioning prostate cancer patients into subgroups with similar use patterns.
In the second stage of analysis, the computer software IBM SPSS Statistics version 23
Premium Grad Pack is used to analyze the influence and relative importance of the predisposing
factors, enabling factors, and need-for-care factors as predictors of the dependent variables that
have been selected to measure utilization of health services by prostate cancer patients. For each
of the subgroups identified in stage one and for the entire sample, hierarchical binary logistic
regression is performed for emergency room use, and hierarchical multiple regression analysis is
performed for hospital length of stay. The hierarchical technique allows the researcher to enter
blocks of predictor variables into the equation sequentially in order to assess their contribution in
predicting the dependent variable while controlling for the factors entered in previous blocks
(Pallant, 2007, p. 147). These methods make it possible to assess the amount of variance
explained by predisposing, enabling, and need-for-care factors independently and when
categories are combined by observing the change in pseudo R Square and R Square values as
each group of independent variables is added to the model, as well as to identify the predictors
that make a statistically significant unique contribution to the explained variance. Performing the
regression analyses within each subgroup makes it possible to see how the relative influence of
Page 24
15
predictors changes based on the specific social and/or demographic characteristics of patient
groups.
Hierarchical regression has been used in previous research guided by the Andersen model
in order to examine the amount of variance in health services use that is explained by
predisposing, enabling, and need-for-care factors as the groups of variables are entered
sequentially and factors entered previously are controlled for (Chan & Wong, 2014; Staudt,
2000). Employing the hierarchical regression procedure allows for the influence of each category
of independent variables to be assessed, as well as their joint influence. Health policy looks to
alter characteristics that are more easily manipulated, such as enabling factors like income or
health insurance coverage, when trying to impact access to care for population groups (Aday &
Andersen, 1974, p. 214). The extent to which health services utilization is influenced by
predisposing, enabling, and need-for-care is relevant from a policy perspective given the
practicality of altering certain aspects versus other aspects. The use of hierarchical regression in
this analysis makes it possible to assess the influence of each category of predictors as well as
the relative influence of individual predictors.
Previous health services utilization research has also demonstrated that, through the use
of multivariate analytical techniques, the complexity of factors influencing health services
utilization behaviors can be examined to better understand what the most important determinants
of utilization are, the magnitude of effects of particular factors, and possible interaction effects of
factors (Wan & Soifer, 1975, p. 229). The interaction effects of certain variables can provide
information that is of greater detail and useful for addressing issues. For example, the observed
interactions between age, race, and socioeconomic status in prostate cancer research regarding
the temporal trends in late-stage diagnosis can be applied to enhance local interventions or
Page 25
16
develop new strategies to improve the health of prostate cancer patients based on finding higher
prevalence in patients who are black, aged 40 to 64, and of lower socioeconomic status
(Goovaerts, et al., 2015). Given the complex burden of prostate cancer and need for specific
information to better understand the differences of individual patients and populations, this
analytical approach is appropriate to address the specific research questions in this study. The
research design and methodology are described in detail in Chapter Three.
Significance of the Study
The potential theoretical, methodological, policy, and practical implications of
conducting this research help to illustrate its relevance and usefulness. First, it does not appear
that the utilization of health services by Medicare enrollees with prostate cancer has been studied
using the theoretical framework and analytic approach employed in this analysis. The
contributions made by previous research have shown that a comprehensive understanding of the
predictors influencing the use health services by individuals and groups can be obtained using
the behavioral model of health services utilization to examine predisposing, enabling, and need-
for-care factors, as this integrated approach allows for the inclusion of both individual and
societal determinants, while analytical techniques to determine the relative importance of
predictors and their interaction effects can make it possible to identify individuals or groups with
similar service utilization patterns (Andersen & Newman, 1973; Wan & Soifer, 1975; Wan &
Yates, 1975).
Page 26
17
The use of national administrative claims data to capture patient information and a
national dataset to capture contextual factors provides the opportunity to further address the
current gaps in understanding of the factors associated with variations in health services
utilization patterns by Medicare beneficiaries with prostate cancer. The use of state-wide or state-
based program data sets in previous research regarding the utilization of cancer services was
reported to limit the ability to also account for area-level factors in which patients reside (Miller,
et al., 2008; Mayer, Travers, Wyss, Leak & Waller, 2011). The inclusion of social aspects in
analyses can be critical for understanding issues. Research has shown that difficulties in meeting
health care needs were most likely to be encountered and reported by residents of disadvantaged
counties, with challenges being related to factors like area level poverty and educational
attainment more so than physician workforce and other health system characteristics, thus
suggesting that policy interventions should not focus solely on increasing health system
resources, but also seek to address contextual characteristics (Litaker & Love, 2005, pp. 188-
191). Together, the data, analytical technique, and theoretical framework used in this study have
the potential to yield new insightful information concerning the personal and social factors
impacting the use of health services by prostate cancer patients and the ways in which the
utilization patterns of these patients can better be studied and understood.
Additionally, the potential of this study to derive new information that is relevant to the
existing body of research and ongoing efforts to understand and improve cancer care is
significant from both a practical perspective and policy perspective. Information pertaining to
trends in emergency room use and hospital length of stay can be important for understanding
cost changes occurring over time and predicting future costs. Hospital stays are generally the
greatest cost driver for any disease, and an awareness of patient populations that have a higher
Page 27
18
risk of seeking services through unplanned visits to the emergency room may enable health care
providers to develop specific targeted strategies for symptom management, discharge planning,
follow-up care (Lang, et al., 2009, p. 228; Bryant, et al., 2015, p. 410). This new information can
potentially add to what is known about particular individual and contextual factors that influence
aspects of prostate cancer service use and help to inform work concerning care and outcome
disparities.
Existing research has highlighted the potential for such information to be applied to
cancer care through policies and practices aimed at improving both patient health and costs. For
example, better comorbidity management could reduce the number of hospitalizations among
cancer patients. This could be achieved through sound coordination of oncologists, primary care
providers, and impatient teams during patients’ cancer trajectory. A better understanding of the
factors that could lead to the use of a greater number of potentially avoidable inpatient services
among cancer patients can aid policy makers and health care providers involved with resource
allocation decisions, cancer care provider coordination, and patient education (Manzano, et al.,
2014, p. 3532). Thus, identifying the relative importance of predisposing, enabling and need-for-
care factors, and the ways in with their interactions impact use patterns by prostate cancer
patients can be beneficial to inform the development of targeted interventions to improve health
care delivery.
Finally, understanding the factors influencing service use by prostate cancer patients who
are enrolled in Medicare is important from a public policy perspective The U.S. Medicare
program was one of the federal government’s major efforts to equalize access to health care
through an economic approach, which mainly seeks to reduce the economic resources an
individual or family must expend to receive care; thus, the design did not intend to directly
Page 28
19
address barriers considered noneconomic, like the geographic distribution of primary care
providers or transportation issues (Aday & Andersen, 1974, p. 218). These types of factors,
which would be considered enabling factors, may hold the greatest potential for policy change
given that altering these aspects is generally more feasible than altering predisposing factors
(Andersen & Newman, 1973, p. 119). Examining the characteristics of individuals and their
contextual environment can help to clarify potential factors associated with the propensity for
Medicare patients with prostate cancer utilize more health services.
Policy discussions related to Medicare frequently include the need for improvements in
the coordination and delivery of care, and patient outcomes, as well concerns regarding costs for
taxpayers and beneficiaries. Understanding the factors influencing service use, and the use
patterns of certain patients can serve to inform such discussions. By identifying predictors of
health care utilization, planned interventions to minimize certain factors can be carried out to
minimize growing health care costs (de Boer, Wijket, & de Haes, 1997, p. 102). The approach
for analyzing utilization variations proposed in this study can contribute to the existing
knowledge surrounding how the specific needs and behaviors of distinct population subgroups
might be better identified and understood in order to develop targeted intervention strategies that
will deliver care and use resources more effectively and efficiently.
Studies have produced a substantial amount of information concerning variations in the
utilization of health services for cancer care and, yet there are still gaps in what is known about
the reasons for potential use pattern differences in prostate cancer patients. More in-depth
analysis integrating the personal and social factors that impact utilization behaviors among men
with prostate cancer is needed in order to develop a better understanding of what potentially
predicts use and identify those with higher propensity for using health services in order to inform
Page 29
20
efforts aimed at better coordination of health care delivery. Currently, there appears to be no
published studies that specifically address the predictors of health services utilization in prostate
cancer patients who are enrolled in Medicare using the integrated approach, analytical methods,
and data sources employed in this research study.
Organization of Chapters
Chapter two provides a review of the relevant literature, including discussion of the broad
perspectives that are most prevalent in prostate cancer research, the contributions and potential
limitations of these studies, the health behavior model, and the previous work that has
demonstrated that has demonstrated the advantages of using this integrated approach.
Chapter three describes the research design and methodology this study employs. This includes
discussion of the data sources, population and sample selection, measurement of the study
variables, and methods for analysis. Chapter four describes the analytic procedures performed
and the results obtained. Descriptive statistics, results of AID analysis and regression analysis,
and conclusions of hypothesis testing are included in this chapter. Chapter five includes a
discussion of the study findings, contributions, and limitations. This chapter concludes with
recommendations for future research.
Page 30
21
CHAPTER TWO: LITERATURE REVIEW
Introduction to Literature Review
Different approaches have been used to study the factors that may contribute to the
variations in the utilization of health services among prostate cancer patients. The models used
these analyses are frequently based on a perspective that focuses narrowly on attributes of the
individual, societal elements, or economic and service resources of the contextual environment.
The frameworks that are most prevalent in studies concerning the use of health services by men
with prostate cancer can be broadly categorized as psychological, sociological, or economic
approaches. While this research has produced valuable information to advance the understanding
of the widely documented disparities in health and health care among patients facing this disease,
there are limitations to what can be learned when analyses are confined to a single perspective.
Using an integrated approach to examine not only the individual and societal factors that
may predict health services utilization, but also the context in which use occurs can provide a
more comprehensive understanding of the important determinants of use which may be
particularly important for influencing public policies. The behavior model of health services use
incorporates demographic and social factors of individuals and their environment, the available
personal and community resources that may facilitate or impede service use, and the level of
need the illness presents. These predictors of utilization are systematically categorized as
predisposing, enabling, and need-for-care factors. Previous research using this model has shown
that various analytic techniques can be applied to determine the relative importance of predictors
Page 31
22
as well as their interaction effects to better understand the utilization patterns of individuals and
subgroups within the population. Although the relevant prostate cancer literature does not
include an ample number of studies using this model, this research and other analyses of health
services utilization have provided empirical evidence to help guide the selection of predictors.
Approaches in Prostate Cancer Research
Prostate cancer research has been approached from numerous perspectives. The broad
perspectives that can be used to categorize the frameworks most prevalently employed in studies
include psychology, sociology, and economics. These studies have made important contributions
to understanding factors associated with utilization of health services by men with prostate
cancer. However, the influential predictors identified were not able to be fully analyzed along
with additional determinants, thus limiting the knowledge gained regarding the relative influence
and interactions of factors.
Psychological Approach
The utilization of health services by prostate cancer has been studied with focus on only
the individual. Yong, Onukwugha, Mullins, Seal, and Hussain (2014) examined health services
utilization among prostate cancer patients, focusing specifically on those who were diagnosed
with stage four metastatic disease in order to better understand the relationship between the use
of services and diagnosis of metastatic disease. This study aimed to address the utilization of
services from the perspective of prior symptoms and illness state driving patients to seek using a
conceptual framework based on Suchman’s theory involving five stages an individual
Page 32
23
experiences when deciding whether or not to utilize health services. In this comparison of health
services utilization between prostate cancer patients with metastatic disease and stage four
prostate cancer patients without metastasis, the likelihood of skilled nursing facility use was
found to be approximately double by those with metastasis. Greater comorbidity and poorer
functional status were determined to be among the most influential predictors among men with
advanced prostate cancer (pp. 291-296). Findings supported that increased disease burden can
lead to greater utilization, which can inform decisions regarding the coordination of care for
these patients. Additional attributes of the individuals and social structure or the contextual
environment may also be influencing use, and a more complete understanding of these factors
could enable even greater improvements for the coordination of care.
Examining a health education intervention to reduce the unnecessary utilization of health
services, Inman, Maxon, Johnson, Myers, and Holland (2011) evaluated the use health care
services 30 days following hospital discharge for radical prostatectomy to assess the
effectiveness of an educational telephone follow-up intervention. Services included in this study
were phone calls to doctor or nurse, clinic visits, emergency department visits, and
hospitalization/ readmission. Among these prostate cancer patients, unplanned use of services
was reported by 47% of those in the intervention group who received a follow-up telephone call
and 60% of patients in the control group who received the usual care. The decrease in utilization
of services was not found to be significant. (p. 90). Only the effectiveness of the intervention,
which focused primarily on the individuals’ behaviors, was assessed. Additional characteristics
of the patient or contextual environment may have been influential.
Page 33
24
Sociological Approach
Onukwugha, Osteen, Jayasekera, Mullis, Mair and Hussain (2014) evaluated the
utilization of services by prostate cancer patients to determine the impact of race and ethnicity
using the intersectionality perspective proposed by sociological theorists to depict how systems
of inequality, such as race/ethnicity and class, overlap and result in unequal outcomes in society.
This study focused on area-level deprivation and race/ethnicity, and found that the utilization of
specialist services following prostate cancer diagnosis was lower among African American
patients when compared to white patients. Factors associated with decreased likelihood of
utilization of specialist visits following prostate cancer diagnosis include lack of reimbursement
for services and not seeing a primary care physician. While this is consistent with previous
findings regarding race differences in physician visits among older adults, it is of particular
concern for prostate cancer given that disparities in treatment may result from differences in
specialist visits. (pp. 1-6).
Using patient and community-level factors, this study made important contributions to
the understanding of service utilization and disparities in prostate cancer. Given that the
influential predictors are related to the availability of resources and the health care delivery
system, the inclusion of factors characterizing these aspects may have provided an even greater
level of understanding.
Economic Approach
The recent literature pertaining to the utilization of health services by prostate cancer
patients has included a number of studies focused on advanced prostate cancer. In these analyses,
increased costs associated with the utilization of services for care were the primary point of
Page 34
25
interest. Hagiwara, Delea, Saville and Chung (2013) conduced an episode of care analysis, which
“represents a period initiated by patient presentation with a diagnosis of clinical condition and
concluded when the condition is resolved” in order to determine the costs of skeletal-related
events in patients with advanced prostate cancer that has metastasized to the bone. The intention
was to understand the economic impact of providing care for patients with skeletal-related events
and estimate potential cost savings from interventions to prevent these events (p.23). The
findings regarding service utilization patterns were informative, showing that hospitalizations
and costs are higher in patients with these particular complications. However, by not including
any demographic factors or social structure characteristics in the analysis, it is not possible to
examine the potential impact of other factors that may be associated with these care patterns.
Seal, et al. (2014) analyzed health care resource utilization and costs for patients with
prostate cancer to compare those with bone metastasis to those without. The emergence of new
therapies for prostate cancer and a lack of information regarding the costs associated with
treatment patterns were the basis for this research focus of this evaluation Patients with bone
metastasis were identified as having a greater likelihood of having inpatient care, emergency
department admissions, and longer lengths of stay when hospitalized (pp.549-553). Again, there
is new information that is of value, but only the economic resources required to provide care and
patients’ diagnosed health conditions were considered. These findings appear to consistently
demonstrate that patients with more severe illness utilize more health services, and provide
valuable information regarding the care patterns for prostate cancer patients. The lack of
additional factors to better understand the individual and environment does not make it possible
to assess whether or not need for care was the only influential factor.
Page 35
26
Integrated Approach
Miller, et al., (2008) used the behavioral model of health services utilization to examine
racial and ethnic disparities in health services utilization in men who are enrolled in a state
program for uninsured low-income men with prostate cancer. In this study, the enabling factors
were essentially the same for the entire study population because the program provides free and
comprehensive prostate cancer treatment, including an assigned primary cancer care provider, a
clinical care coordinator, and an enabling set of social service resources such as counseling and
interpreter services, educational materials, and assistance with transportation, food, and housing.
No association was found between race/ethnicity and either of the two utilization measures, use
of emergency room care and frequency of surveillance PSA testing. Patient-reported outcomes
did vary across race/ethnicity, with Hispanic men reporting very high satisfaction. The
interpreter services and language-concordant educational materials provided through the
program were presented as a possible explanation for this variation (pp. 319-326).
Although the use of an integrated model in this study did not enhance what is known
about the effect of each predictor in differential use patterns, the lack of finding variation due to
race and ethnicity when there are no differences in the necessary support and coverage related to
care could underscore the importance of concepts regarding equitable access in the health care
delivery system.
The prostate cancer literature reviewed was predominantly guided by frameworks
drawing from a single perspective. The integrated approach of a social behavior system model
allows for a more comprehensive analysis of the influential predictors and their relative
importance health services utilization. A systematic review of health behavior research from
2000 to 2005 reported that theoretical frameworks including the community level were used in a
Page 36
27
relatively small number of articles, with the majority of articles employing individual-level or
interpersonal-level theories (Painter, Borba, Hynes, Mays & Glanz, 2008, p. 361). While the
community level was considered in the prostate cancer literature, few studies employed a model
in which the community level and individual level were both incorporated.
Behavioral Model of Health Services Utilization
Andersen’s behavioral model of health services utilization was selected as the theoretical
framework to guide this analysis based on previous research which has demonstrated the model’s
capability to allow for the study of individual and social attributes as well as elements of the
contextual environment. The ability to provide an integrated approach may be considered
especially important for examination of health service use by prostate cancer patients given the
various factors that could potentially be adding to the burden of this disease, and the lack of
previous research that has used this model for this particular issue.
The literature highlights the versatility of this model and important contributions of
research that has applied the framework. According to Andersen (1995), the model can be used
to predict the utilization of health services given that each component can be viewed as
contributing independently to predict use, but the model also suggests a causal ordering which
may make it useful for explanatory purposes (pp. 1-2). Phillips, Morrison, Andersen and Aday
(1998) describe model as a conceptual framework that “uses a systems perspective to integrate a
range of individual, environmental, and provider-related factors associated with decisions to seek
care” (p. 572). The inclusion of contextual variables, which are the environmental factors (i.e.,
Page 37
28
characteristics of the healthcare delivery system, community, external environment) and
provider-related factors (i.e., characteristics of the patients, providers, and their interactions) is of
particular importance for research intended to develop or otherwise influence policies (Phillips,
Morrison, Andersen, & Aday, 1998, pp. 572-573). Given that the decision making process
involves consideration of not just the individual, but also the many contextual factors that may be
involved, this may be an appropriate model for evaluations of numerous issues in the policy
realm.
Health services utilization research has shown that an even greater level of understanding
can be achieved, which may be of particular importance for the development of policy, through
the use of the three categories of predictor variables (predisposing factors, enabling factors, and
need-for-care factors) and application multivariate analysis techniques. The two-stage method
used by Wan and Soifer (1975) to examine the predictors of physician utilization demonstrated
that it is possible to obtain a more precise understanding of the factors that may impede or
facilitate care by identifying the relative importance of predictors for the total study sample and
for subgroups with similar utilization patterns (Wan & Soifer, 1975). This approach was also
shown to be advantageous for the study of dental services utilization (Wan & Yates, 1975).
In the first stage, AID analysis was used to partition the sample into clusters with
homogeneous patterns of use. Only social and demographic variables were used in this stage. In
the second stage, multiple regression analysis was performed within each subgroup and on the
entire study sample. Additional variables categorized as predisposing, enabling, and need-for-
care factors were included for this stage, and all were considered simultaneously to determine the
relative influence of predictors (Wan & Soifer, 1975; Wan & Yates, 1975). Understanding how
the significance of predictors varies by subgroup makes it possible to better address the needs of
Page 38
29
these individuals by appropriately targeting the specific aspects that are influencing utilization
patterns.
Predictors of Health Services Utilization
As described previously, according to the behavioral model of health services utilization,
the use of health services depends on predisposing factors which include characteristics of
demographics, social structure, and beliefs; enabling factors, which represent the availability of
resources allowing for the use of services; and need-for-care factors, which represent the
perceived or immediate illness level causing an individual to seek care. Although need-for-care
factors appear to most consistently be the strongest predictors of utilization, throughout the
literature, studies have shown variables from each category of these predictors to be influential in
analyses of health services use. For example, in a review of studies regarding health services
utilization patterns and determinants by cancer survivors, Treanor and Donnelly (2012) reported
predictors of inpatient hospital care to include older age and impoverished residential area, as
well as comorbid conditions (p. 17). The elements of these categories of predictors and their use
in previous research that may be most relevant to the study of health services utilization by
prostate cancer patients enrolled in Medicare is provided in this section.
Predisposing Factors
Predisposing factors include variables such as age, gender, race, ethnicity, and education.
These are demographic and social structure factors and the health beliefs that may provide an
Page 39
30
indication of how likely it is that health services will be needed. Although not included in the
initial model developed in the 1960s, genetic factors and psychological characteristics were later
considered to be components that could be added as predisposing factors (Andersen, 1995, p. 2).
Age has often been reported to impact the utilization of health services in cancer care,
with older patients being more likely to use health services. In two analyses health services
utilization by prostate cancer patients with metastatic disease, hospitalization and skilled nursing
facility use was found to be 12.6% and 0.3% respectively in a study population with a mean age
of 78, while the respective estimates were much higher, 60.9% and 22.3% during the first year
following diagnosis in a study population with a mean age of 59 (Hagiwara, et al., 2013, p. 25;
Yong, et al., 2014, p. 297). Although the reported utilization differences may be attributable to
various factors not captured in the research, these findings could also be reflective of the
importance of age as a predictor of service use.
Differences in medical care utilized by men with prostate cancer have been found to exist
between racial and ethnic groups. Incongruities in access and continuity in medical care have
been suggested as a possible explanation for Hispanic men having lower utilization and
awareness of prostate specific antigen (PSA) testing, and the increased likelihood for African-
Americans to have care provided in public clinics or emergency departments and by different
clinicians on subsequent visits related to their cancer (Miller, et al., 2008, pp. 318-319). Racial
and ethnic disparities in prostate cancer treatment could potentially be associated with factors
such as discrimination in the healthcare setting and uncertainty in clinical communication and
decision making (Jayadevappa, et al., 2011, p. 104).
Page 40
31
Enabling Factors
Enabling factors are the individual resources, such as health insurance and income, and
measures of community resources, such as number of health facilities and personnel and the
rural-urban nature of an area that can affect service utilization (Andersen & Newman, 1973,
p.16). Obstacles pertaining to accessing the health care system and behaviors of patients and
providers are often proposed to explain racial disparities in prostate cancer in the United States
(Freeman, Durazo-Arvizu, Arozullah, & Keys, 2003, p. 1706). Sundmacher and Busse (2011)
found that the rate of avoidable cancer deaths for most cancer types that are amenable to
treatment was impacted by the number of physicians per 100,000 of the population. Areas with a
higher number of physicians per capita may experience lower social and economic costs, such as
decreased expenses for travel and wait times, to access health services, as well as better quality
services if the larger supply leads to greater competition among physicians. This could serve to
benefit cancer patients utilizing services in these areas, as they may be diagnosed earlier, have
more specialized care, and increased number of necessary follow-up visits (Sundmacher &
Busse, 2011, pp. 58-59).
The degree to which an area is considered to be rural or urban can present unique
conditions which may facilitate or impede the use of health services. Compared to urban areas,
rural areas often have higher levels of poverty and uninsured residents, fewer health care
resources such as hospital beds, physicians, and specialists, and may face transportation
challenges with accessing care. Despite urban areas having some of the greatest health care
facilities and higher concentration of medical professionals, the distribution of these services is
often not equal, and those living in poor inner-city communities may lack access to such care
(Blumenthal & Kagen, 2002, p. 109). Contextual factors can be indicative of the resources
Page 41
32
available to individual and the community, and in turn may be important predictors of health
service use.
Economic and health care system resources have been considered to explain variations in
prostate cancer. For example, the lack of reimbursement for doctor visits has been associated
with the decreased likelihood of prostate cancer patients’ utilization of services by visiting
specialists, and factors such as hospital location, size, and ownership may influence health
resource utilization and treatment, as well as quality of care in prostate cancer patients
(Onukwugha, et al., 2014, p.6; Jayadevappa, et al., 2011, p. 104). Furthermore, even individuals
with benefits that ensure payment coverage of services may not have sufficient access to health
care due to non-financial obstacles such as health behaviors, environmental factors, minority
status, language, and availability of services, providers, and usual source of care (Miller, et al.,
2008, p. 318).
Prostate cancer care decisions and patients’ subsequent reactions to treatments can be
impacted by genetic differences, as well as social and health system factors that affect access to
and the availability of resources in a given area. Harlan, et al. (2001) examined factors associated
with treatment for localized prostate cancer, finding that both clinical and nonclinical factors
impacted the treatment men received. Additionally, it was reported that the use of particular
treatments varied by geographic region and population subgroup, raising the question of whether
or not access to all treatment options is provided to all patients. The lack of evidence concerning
one method of treatment for prostate cancer over another is considered to be a probable cause for
there being little agreement among healthcare providers as to how patients with this disease
should be treated; in turn, treatment variations by geographic area, as well as a number of other
Page 42
33
nonclinical factors, could be attributable to this lack of consensus (Harlan, et al., 2001, pp. 1868-
1870).
In a study of the use of treatment in older men with prostate cancer, Roberts, et al. (2011)
found that comorbidity status did not predict the selection of treatment, while clinical factors,
such as tumor characteristics, only slightly influenced such decisions; the most powerful
predictor of therapy use was geographic area. A possible explanation for regional variations in
treatment is that urologists and radiation oncologists are unevenly distributed across the U.S.
given that the treatment suggested by these specialists tends to be that of their profession
(Roberts, et al., 2011, p.242). Based on the current literature, the various individual and
contextual characteristics that can be categorized as enabling factors have been influential
predictors in studies concerning prostate cancer care.
Need-For-Care Factors
Need for care may include factors characterizing illness level, diagnoses, symptoms or
complications. Wolinsky, et al. (2008) examined the emergency department utilization patterns
and factors related to use among Medicare patients, and found that need-for-care factors were the
strongest predictors of visits that required services deemed as life-threatening and appropriate for
emergency care use, while residing in rural counties and small cities were among the most
influential predictors of visits that required low intensity physician services which could have
been provided in a setting outside of the emergency department and were presumed to be non-
urgent or avoidable (pp.205-208). In a comprehensive review of studies concerning health
services utilization in the chronically ill, de Boer, Wijker, and de Haes (1997) reported that the
majority of research articles evaluated found predisposing and enabling factors to have very little
Page 43
34
impact on hospitalizations and physician visits, while need factors were consistently identified as
major predictors of use for these services in chronically ill patients (pp.111-112).
For cancer patients, the severity of illness can rise to levels requiring the specialized care
provided through intensive care units (ICU) due to conditions such as respiratory failure,
infection, and bleeding (Kostakou, et al., 2014, pp. 817-818). Comorbidity is frequently
identified as an influential predictor of health service use in cancer care. Shayne, et al. (2013)
studied hospitalizations in cancer patients aged 65 and older, and reported comorbidity,
advancing age, and race to be influential predictors of prolonged length of stay, with comorbidity
having the greater impact (pp. 311-312). Legler, Bradley, and Carlson (2011) found inpatient
hospitalizations and emergency room admissions to be high in cancer patients with multiple
comorbid illnesses. The difficulties that these patients may face in managing a symptom crisis
and the lack of necessary resources by some hospices to treat these patients at home were cited
as possible explanations for the observed use patterns (p. 754). The effect of comorbidity on
utilization shown in studies throughout the literature emphasizes the importance of need-for-care
factors in predicting use.
Utilization of Health Services for Cancer Care
The utilization of health services can be described in terms of its type, site, purpose, and
time interval. These distinctions can be helpful in understanding the demands that would be
placed on the system, the care-seeking process, and the impact of various determinants (Aday &
Andersen, 1974, pp. 214-215). Historically, the ability to successfully deliver the necessary and
Page 44
35
appropriate care to those who actually need it has been a challenge in America’s health care
system. From 1993 to 2003, there was a net decline in U.S. hospitals, impatient beds, and
emergency departments of 11%, 17%, and 9% respectively. During this same time, the was a
12% increase in population size, 13% increase in hospital admissions, and 26% increase in
emergency department visits. It has been reported that 91% of emergency departments
experience overcrowding, with academic medical centers noting overcrowded emergency
departments 35% of the time, and 40% of all emergency departments finding that this problem
occurs on a daily basis (Wolinsky, et al., 2008, p. 204).
Emergency Room Services
Previous studies have offered information concerning factors that may cause cancer
patients to utilize emergency services, as well as why an understanding of the determinants of
use is important. Mayer, Travers, Wyss, Leak and Waller (2011) examined the reasons why
cancer patients visit the emergency department using a state-wide population-based data set.
Among prostate cancer patients, pain, respiratory problems, injury, and bleeding were the most
common categories of chief complaints; the chief complaints most frequently cited by all cancer
patients were in the categories of pain, respiratory problems, and gastrointestinal issues. The
authors make the point that cancer care can be improved by understanding the reasons patients
utilize emergency room services, as this information could make it possible to detect
inadequacies in symptom management and/or the accessibility of regular oncology care, and then
develop appropriate interventions (pp. 2685-2687).
Page 45
36
Hospitalization
Assessments of hospitalization often focus on the costs related to care given the concern
for health care expenditures and costliness of hospital stays. Hospitalizations are one of the most
substantial cost drivers in cancer care. It has been reported that approximately 50% of costs
during the first year after a cancer diagnosis and 60% of costs during the last year of life are due
to hospitalizations (Manzano, et al., 2014, p. 3527). Inpatient services accounted for 22% of the
$34.4 billion Medicare paid for cancer care in 2011(American Cancer Society Cancer Action
Network, 2012, pp. 16-18). In addition to understanding costs, it is also important to understand
patterns of use. Studies focusing on issues such as the length of hospital stay for prostate cancer
patients following surgical treatment with radical prostatectomy have been viewed as important
for identifying possible factors associated variations in utilization.
In a briefing on related to cancer-related hospital stays, Price, Strangers, & Elixhuser
(2012) provided that hospitalizations due to cancer in adults declined by 4% between 2000 and
2009, which may be partially due to the rise in options for outpatient cancer treatment. In 2009,
hospitalizations for adults with principal diagnosis of cancer were on 1.6 days longer than all
other hospitalizations (6.6 days compared to 5 days), and $5,700 more per stay and $500 more
per day ($16,400 compared to $10,700, $3,300 compared to $2,800). These costs for cancer
hospitalizations represent approximately 6% of total adult inpatient hospital costs (pp. 1-2). Data
specific to men with cancer was also included. The most common cancer hospitalizations among
men were for prostate cancer and metastatic cancer, each listed as being the reason for 97,000
hospital stays. Compared to the average length of stay for all cancer hospitalizations, 6.6 days,
the mean length of stay for hospitalizations listing prostate cancer as the principle diagnosis was
lower, 2.4 days, while the mean stay for hospitalizations due to metastatic cancer was higher, 6.7
Page 46
37
days. Prostate cancer hospitalizations, however, were the costliest per day ($4,600/day)
compared to all other cancer hospitalizations. For hospitalizations with cancer as secondary
diagnosis, prostate cancer was again most common among men (Price, Strangers & Elixhuser,
2012, pp. 4-7).
Variations in the length of hospital stay have been associated with numerous factors, such
as degree of illness, certain hospital attributes, and geographic characteristics. Research efforts
have aimed to better understand the variations in the length of hospital stay for prostate cancer
patients following surgical treatment with radical prostatectomy. Mitchell, et al. (2009) analyzed
centers in the University Health System Consortium Clinical Data Base and found that for
centers from three tiers of lowest to highest case volumes the average length of stay was 3.77,
2.65 and 2.09 days, respectively. In this study, the centers with the highest case volume also had
the lowest intensive care unit admission rates, while the highest rates were observed in centers
with the lowest case volume (Mitchell, et al., p. 1443). Inman, et al. (2011) reported the length of
stay after radical prostatectomy to range from 1 to 4 days for a patients treated at a large
academic medical center in the Midwest United States (p. 89). Understanding hospital service
use variations is important for addressing concerns related to cost and care patterns, and a clearer
sense of the factors associated with longer or shorter stays can help to predict needs of patients
and future use, as well as inform strategies to prevent recurrent hospital stays.
Disparities
Cancer health disparities are described by the NCI as “adverse differences in cancer
incidence (new cases), cancer prevalence (all existing cases), cancer death (mortality), cancer
survivorship, and burden of cancer or related health conditions that exist among specific
Page 47
38
population groups in the United States. These population groups may be characterized by age,
disability, education, ethnicity, gender, geographic location, income, or race” (NCI, 2016).
Disparities in healthcare are the result of a complex interplay of multiple factors and events that
are met throughout the whole healthcare experience; these factors could be due to differences in
patients, healthcare providers’ actions and decisions, or the way in which the healthcare system
is designed (Greenberg, Weeks, & Stain, 2008, p. 523). Factors such as stage of disease, duration
of treatments, access to medical care and support, patient characteristics, and provider
preferences can be linked to variations in care for cancer. Prostate cancer and the men faced with
it are characterized by a number of distinct factors, such as the growing number of men living
with this disease due to early detection (Krupski, et al., 2006, p. 121), needing to choose between
several treatment options which all lack proof of “being superior in terms of overall survival”
(Jayadevappa, et al., 2010, p. 711), and the many health related quality of life difficulties that are
possible based simply on the location of the prostate gland and its treatments’ sensitive nature
(Eton and Lepore, 2002, p.307).
The critical role that access to health care has in understanding and managing prostate
cancer has been emphasized throughout the literature. Patients’ ability to reach and potentially
use cancer care, considered access to cancer care, can be important to their utilization of services
as well as their outcomes, and reducing access to care has significant adverse effects on cancer
treatment outcomes, and increases disparities in cancer care (Wang & Onega, 2015, p. 110;
Kantarijan, Steensma, & Light, 2014, p. 1602). The distinct meanings of access to health care
and utilizing health services have been described as access, a process, referring to “the timely use
of personal health services to achieve the best possible health outcomes” while utilization is
“more commonly regarded as a measurable outcome that reflects the actual use of services”
Page 48
39
(Litaker & Love, 2005, p. 184). According to Andersen (1995), the presence of enabling
resources potential access, and the actual use of services is realized access. It is more likely that
use will occur if more enabling resources are present, and the dominant predictors of realized
access define whether or not access is equitable (p. 4).
Social aspects are not the only causes for the disparate cancer burden some groups face,
but studies continue to show that they might be some of the most influential. While age, race,
geographic area, and economic status are factors shown to be related to disparities in the
treatment treatments cancer patients receive, a key determinant proposed for racial and ethnic
disparities in screening, treatment, morbidity, and mortality in prostate cancer is variation in
access to health care (Shayne, et at., 2013, p. 314; Miller, et al., 2008, pp. 318-319). Wang, Luo,
and McLafferty (2010), reported that the risk diagnosis at a late-stage for many cancers, such as
breast, prostate, and colorectal cancer, is often linked to two groups of factors: access to health
care, which pertains to spatial factors, and socioeconomic and demographic characteristics,
which are considered nonspatial factors. They also note that although socioeconomic status is a
characteristic of individuals, it cannot be separated from a neighborhood context, as well (pp.
239-241). A more precise understanding the factors that are significant predictors of utilization,
and the degree to which they are influential in subpopulations can be applied to what is known
about disparities in prostate cancer in order to address the specific needs of patients.
Page 49
40
Development of Hypotheses
This study of the determinants of health services utilization among older males with
prostate cancer in the United States is guided by the theoretical framework of Andersen’s
behavior model of health services utilization, and examines the predisposing factors, enabling
factors, and need-for-care factors that characterize individual patients and their county of
residence in order to determine the relative importance of factors and their interaction effects.
The relevant literature provides empirical evidence to suggest that the predisposing factors,
enabling factors, and need-for-care factors included in this study may be influential predictors of
health services utilization, and analysis of these factors may facilitate a more precise
understanding of the reasons for differential use patterns of health services by prostate cancer
patients.
To address the specific aims of this study outlined by the research questions, several
hypotheses have been developed:
Research Question 1: What is the relative importance of predisposing factors, enabling factors,
and need-for-care factors in accounting for variability in emergency room use among prostate
cancer patients?
Need-for-care factors are frequently described as the most influential predictors of health
services utilization, and empirical evidence supports this. Among Medicare patients, need-for-
care factors have been identified as the strongest predictors of emergency room service use, and
Page 50
41
cancer patients and Medicare enrollees with greater comorbid illnesses have been shown to have
higher rates of emergency room admission (Legler, Bradley & Carlson, 2011; Wolinsky, et al.,
2008). Need-for-care factors such as comorbidity may influence utilization differences in
emergency room services.
Hypothesis 1: Need-for-care factors are more influential predictors of emergency room use
among prostate cancer patients than predisposing factors and enabling factors.
Research Question 2: What is the relative importance of predisposing factors, enabling factors,
and need-for-care factors in accounting for the variability in hospital length of stay among
prostate cancer patients?
As mentioned above, the most important predictors of health service use are often need-
for-care factors. Previous research has found higher hospital usage in cancer patients with
multiple comorbid illnesses, and even when factors such as age and race were found to be
influential, comorbidity still had the greatest impact (Shayne, et al., 2013; Legler, Bradley &
Carlson, 2011). Hospital length of stay is likely to vary based on the illness level of prostate
cancer patients.
Hypothesis 2: Need-for-care factors are more influential predictors of hospital length of stay
among prostate cancer patients than predisposing factors and enabling factors.
Page 51
42
Research Question 3: To what degree does emergency room use have an effect on hospital length
of stay among prostate cancer patients?
Seeking emergency room care may be reflective of the level of illness level or degree to
which patients are in need of health services. Previous research has shown that among cancer
patients, emergency room visits can often result in hospital admission; even emergency room
visits within thirty days have been found to be associated with unplanned hospitalizations
(Mayer, et al., 2011; Manzano, et al., 2014). The utilization of emergency room services by
prostate cancer patients is likely to have an effect on patterns of inpatient hospitalization.
Hypothesis 3: Emergency room use is an influential predictor of hospital length of stay among
prostate cancer patients.
Research Question 4: Do predisposing, enabling, and need-for-care factors show any important
interaction effects accounting for the variability in the use of health services in specific
subgroups of prostate cancer patients?
While need-for-care factors are most often the strongest predictors of health services
utilization, predisposing and enabling factors have of course been important in explaining
variations in use. A more comprehensive understanding of such variations can be obtained if
there are subgroups characterized by specific influential demographic and social variables. Along
with comorbidity, older age and residing in a disadvantaged area have been shown to predict
hospitalization patterns among those who have had cancer (Treanor & Donnelly, 2012). When
Page 52
43
need-for-care factors were found to be the most influential predictors of emergency room service
use in Medicare patients, farther assessment of use patterns determined that rural area was highly
predictive of emergency room care that was not for life-threatening conditions and could have
instead been provided outside of the emergency room (Wolinsky, et al., 2008). In prostate cancer
research, interactions between factors such as age, race, and socioeconomic status have been
observed (Goovaerts, et al., 2015). Particular social and demographic variables may be predictive
of health service use patterns in subgroups of prostate cancer patients in this study.
Hypothesis 4: High users of health services are associated with certain predisposing factors,
enabling factors, need-for-care factors, and the interaction effects of these variables.
Research Question 5: To what degree do hospital attributes influence the utilization of health
services among prostate cancer patients?
Hospital characteristics may play an important role in the use of health services by
prostate cancer patients. Differences in health resource utilization, treatment, and quality of care
in prostate cancer patients can be influenced by factors such as hospital location, size, and
ownership (Jayadevappa, et al., 2011). According to Parsons, et al. (2010), patients in county
hospitals are more apt to undergo surgery due to the fact that the initial care provider in these
hospitals is typically a urologist, and these specialists are more likely to recommend surgery; in
private care facilities, however, the initial providers tend to be a mix of urologists, radiation
oncologists, and medical oncologists (Parsons, et al., 2010, pp.1382-1383). Furthermore, the
Page 53
44
average hospital stay for cancer patients has been reported to vary in studies that included
hospital case volume and teaching facilities (Inman, et al., 2011; Mitchell, et al., 2009).
Hypothesis 5: Hospital attributes are influential predictors on health services utilization by
prostate cancer patients.
Chapter Summary
In chapter three, the different approaches that have been used in prostate cancer service
utilization research were reviewed. The prevalent frameworks in these studies were broadly
categorized as psychological, sociological, and economic approaches. These studies have
contributed to what is known about the determinants of health service use for prostate cancer;
however, the limitations of using a single perspective have left gaps in the current level of
knowledge regarding factors that may contribute to the variations in use. The behavioral model
of health services use allows for examination of individual and societal factors as well as the
contextual environment to provide a more comprehensive understanding of the important
determinants of use. The contributions made by Andersen (1968), Wan and Soifer (1975), and
others to integrate individual, societal, and contextual attributes in a model for analyses and the
application of specific analytic techniques have enhanced the ability for research to facilitate a
more complete understanding of the utilization patterns of individuals and subgroups within the
population by determining the relative importance of predictors and their interaction effects,
which could be particularly beneficial for policy-related decisions. Although the relevant prostate
Page 54
45
cancer literature does not include an ample number of studies using this model, this research and
other analyses of health services utilization have provided empirical evidence to help guide the
selection of predictors. Several hypotheses were developed to address the aims of this study.
Page 55
46
CHAPTER THREE: RESEARCH METHODOLOGY
Research Design
A cross-sectional design is used for this study. Medicare claims data for care provided in
the inpatient setting are analyzed to determine the predictors of emergency room use and hospital
length of stay by prostate cancer patients. Existing differences in the study sample are examined,
as the research approach was not experimental. This type of design allows for the examination of
patient characteristics and relationships between variables to assess influential factors in the
variability of health services utilization. The claims data available is from a single year, therefore
it is not possible to conduct a longitudinal analysis to examine utilization patterns over time or
determine causal relationships. Inpatient procedures, diagnoses of conditions, types of services
used, and basic demographic and geographic information for each patient are included in the
claims data. Area-level data sources were linked to the claims data to provide additional
information regarding the counties in which patients reside so that important contextual factors
influencing the utilization of services could be analyzed as well.
Data Sources
Inpatient Medicare claims data are collected from hospitals and skilled nursing facilities
across the U.S. by the Centers for Medicare and Medicaid Services (CMS). The Surveillance,
Epidemiology, and End Results (SEER) Program of the National Cancer Institute (NCI) collects
Page 56
47
cancer incidence and mortality information from registries in 15 states. The SEER data is linked
with CMS data to provide detailed information about Medicare beneficiaries with cancer. The
linked SEER-Medicare data files are made available by the NCI. The linked data can be useful
for addressing research topics and questions across the cancer continuum. SEER-Medicare data
includes several Medicare files for types of services, such as hospital, physician, and outpatient,
and the Patient Entitlement and Diagnosis Summary File (PEDSF), which contains the detailed
cancer-specific information collected by the SEER registries and patient demographic
information such as race. Physician and outpatient services are covered by Part B Medicare,
while Part A covers hospital services. According to the NIC, 96% of Part A Medicare
beneficiaries choose to pay a monthly premium to enroll in Part B (NCI, 2015). Part A Medicare
is available for individuals age 65 and older, as well as those who are disabled and/or have end-
stage renal disease.
This study uses data from one of the Medicare files included in SEER-Medicare data, the
Medicare Provider Analysis Review (MEDPAR) file. The MEDPAR file contains all Medicare
Part A hospital stay and skilled nursing facility bills for a single calendar year. Thus, all patients
in this dataset have been admitted for inpatient care at least once. There is one summarized
record per admission, which contains detailed accommodation and departmental charge data,
days of care, entitlement data, basic beneficiary demographic characteristics, diagnosis and
surgery information, and use of hospital or skilled nursing facility resources. The MEDPAR File
is useful for research involving chronic diseases that may be prevalent in the elderly such as
cancer (U.S. Centers for Medicare and Medicaid Services, 2015).
This study also uses the Area Health Resources Files (AHRF) developed by the U.S.
Department of Health and Human Services, Health Resources and Services Administration
Page 57
48
(HRSA) in order to include valuable information concerning the contextual environment of
patients according to the counties in which they reside. The AHRF integrates multiple data
sources into a comprehensive set of data offering a broad range of health resources and
socioeconomic indicators which impact demand for health care. Key health and demographic
data, such as information on health facilities, health professions, measures of resource scarcity,
health status, economic activity, health training programs, and socioeconomic and environmental
characteristics, for each county in the nation are included in the AHRF (U.S. Department of
Health and Human Services, Health Resources and Services Administration, 2015). The data
used from this file is based on the 2010 U.S. Census. The geographic codes for counties included
in the AHRF data make it possible to link this file to the MEDPAR file.
American Hospital Association (AHA) Survey Data from 2008 is used for this analysis to
provide information pertaining to hospital attributes. Through an annual survey of more than
6,300 hospitals in the U.S., the AHA collects facility-level information regarding important
characteristics such as organizational structure, inpatient and outpatient utilization, expenses,
staffing, and affiliations (American Hospital Association, 2016).
Population and Sample Selection
The claims data available for this research include the population of Medicare enrollees
with inpatient records captured in the 2008 MEDPAR file. These records are from a single
calendar year, 2007. Given that this study focuses on only the utilization of health services by
prostate cancer patients, Medicare enrollees without a diagnosis of prostate cancer are excluded
Page 58
49
from the analysis. This study does not focus on skilled nursing facility visits. Therefore, records
with this type of stay are removed from the dataset. Patients who received inpatient care more
than once during the year will have multiple records in the file. For these cases, the record of the
most recent admission is included in the dataset used for analysis. These records still include the
pertinent information concerning patients given that the MEDPAR file allows for up to ten
diagnoses and six procedures using International Classification of Disease, 9th edition, Clinical
Modification (ICD-9-CM) codes.
Prostate cancer diagnosis is indicated by the ICD-9-CM diagnosis code 185. The first
diagnosis code provided in the MEDPAR file is the primary reason suspected for hospital
admission, while the codes in the remaining nine positions can be complications or comorbid
conditions associated with the patient’s health. In this analysis, prostate cancer patients are
identified by the presence of the ICD-9-CM diagnosis code 185 in any of the ten diagnosis fields.
All of these records are included in the dataset given that this analysis looks at the length of stay
for all-cause hospitalizations, not just those for which prostate cancer was the primary reason for
needing inpatient care.
There are 9,309 records for patients with a diagnosis of prostate cancer in the MEDPAR
file. Following the consolidation of multiple records for patients and the exclusion of skilled
nursing facility stays there are 5,754 individual patient observations. Therefore, the population of
patients in the dataset for this study includes 5,754 claims records for Medicare enrollees who
have been diagnosed with prostate cancer and hospitalized at least once for any reason during the
2007 calendar year. In this analysis, the hospitalizations from the MEDPAR file are evaluated in
terms of the number of days the hospital stay lasted.
Page 59
50
Medicare data uses Social Security Administration (SSA) coding system to identify the
geographic location of beneficiaries’ residences, while the additional data sources with area level
factors use Federal Information Processing Standard (FIPS) codes. A SSA and FIPS county code
crosswalk file is periodically produced by the Centers for Medicare and Medicaid Services,
which allows for Medicare data to be linked with data sources such as the AHRF data. This
crosswalk file makes it possible to link the MEDPAR file with the area-level data sources in this
study. Ten of the records in the MEDPAR file do not link to the AHRF data based on the county
coding information available, leaving 5,744 complete observations for analysis using these
variables.
Both the MEDPAR file and AHA Survey data include the Medicare Provider Code for
individual facilities. Analysis of hospital variables can only be performed in a subset of the
administrative claims data due to the fact that facility information in the hospital dataset match a
total of 556 Medicare records.
Measurement of Study Variables
The variables chosen for this study are based on the theoretical framework and existing
empirical evidence. The independent variables include individual-level and contextual factors to
identify the influential explanatory factors for variations in health services utilization among
prostate cancer patients. The individual variables pertain to the characteristics of individual
patients, while the contextual variables pertain to county-level characteristics of the geographic
area in which the patients live. The hospital variables included in the subset analysis using AHA
Page 60
51
Survey data pertain to the facility in which prostate cancer patients received the inpatient care
documented in the MEDPAR file. A description of the observed variables included in this study
and the sources used to derive their measurements is provided in Table 1.
Dependent Variables
The independent variables categorized as predisposing, enabling, and need-for-care
factors in this study are used as predictor variables of the utilization of two types of health
services: emergency room and hospital. These services are often included in research concerning
utilization, and can be beneficial to understanding prostate cancer care practices, treatment
patterns, resource use, and specific patient populations (Seal, et al., 2014; Yong, et al., 2014).
Many of the issues that cancer patients have can be addressed during the routine visits for their
ongoing care. While there may be instances in which cancer patients’ use of emergency room
services is necessary, such as for acute issues like fever or respiratory distress, seeking care
through the emergency room may also be reflective gaps in care or resource availability (Mayer,
et al., 2011, p. 2683; Bryant, et al., 2015, p. 406). Hospitalizations are not only costly, but longer
length of hospital stay has been found to be strongly associated with in-hospital mortality in
cancer patients (Shayne, et al., 2013). Assessing the factors influencing utilization patterns of
emergency room use and hospital length of stay by prostate cancer patients is applicable to
understanding and improving the health and delivery of care for these patients, as new
information can be used to inform future research efforts.
There are two dependent variables in this analysis: emergency room use and hospital
length of stay. The available information from individual patient records in the MEDPAR data
file can be used for the two dependent variables because both emergency room and hospital
Page 61
52
services are covered by Part A Medicare. The dependent variable emergency room use is
determined by the presence of charges for emergency room services in the claims record for each
patient. This variable is recoded to (0) “no” and (1) “yes.” Thus, not all patient records include
emergency room service use.
Hospital service use is measured by the number of days of the hospitalization for each
patient based on the most recent admission record in the 2007 calendar year. This dependent
variable is the length of stay for all-cause hospitalizations. Since the MEDPAR file consists of
only inpatient care claims, all patient records in the dataset include the use of hospital services,
with a minimum length of stay of one day.
Independent Variables
The independent variables selected for this study are categorized as predisposing factors,
enabling factors, and need-for-care factors based on the theoretical framework, and have been
used throughout the relevant literature. There are ten predisposing factors, five enabling factors,
and four need-for-care factors. In the data subset analysis including hospital characteristics, there
are nine enabling factors. The independent variables are explained in the following sections.
Predisposing Factors
Predisposing factors are demographic and social structure characteristics of the individual
and the individual’s social environment. These characteristics exist before care is needed and
their presence or absence can be an indicator of the likelihood that people will seek care based on
what is known about certain care patterns and behaviors associated with certain characteristics,
such as age and previous health services use (Andersen & Newman, 1973, pp. 110-111). Ten
variables are used as predisposing factors for this study.
Page 62
53
Two of the predisposing variables are from data in the MEDPAR file. These are age and
genetic factors. Age represents the number of years listed as the age of each patient in their
individual claims record at the time of inpatient care. Individual records from MEDPAR are also
used to provide the information regarding genetic factors. This variable is coded as (0) “no” and
(1) “yes” based on the presence of selected ICD-9-CM diagnosis codes indicating family and/or
personal history of cancer and other diseases. The selected ICD-9-CM codes are listed in
Appendix A.
The remaining predisposing factors in this study are based on data from the AHRF. These
variables are poverty, race/ethnicity, population age 65 and older, female head of household,
median household income, Medicaid eligible population, and uninsured population. These are
contextual factors of the counties in which patients live and often used to characterize social
structure. Population by race/ethnicity includes separate variables for percentage of the
population identifying as Black/ African American, percentage Hispanic/ Latino, and percentage
White. The remaining variables are also measured by percentage of the county population.
Enabling Factors
Like predisposing factors, enabling factors are characteristics of the individual or the
individual’s community. Enabling factors pertain to the available means or resources needed to
utilize health service. These include aspects such as an individual’s source of payment for care,
and the number of health care providers in a community. Utilization may be influenced by
community-level characteristics such as geographic region and rural-urban “because of local
norms concerning how medicine should be practiced or overriding community values which
influence the behavior of the individual living in the community” (Andersen & Newman, 1973,
Page 63
54
pp. 111-112). Additionally, in densely populated urban areas the number of contacts with
physicians has been shown to be higher, health resources can be relatively scares in rural areas,
and in the poorest sections of urban areas, residents may lack access to such resources
(Sundmacher & Busse, 2011, p. 59; Blumenthal & Kagen, 2002). In analysis of physician
utilization, urban residence and cost per physician visit were among the predictors found to be
influential (Wan & Soifer, 1975). Enabling factors can offer vital information regarding
characteristics of the patients, their communities and available resources which may impact their
ability to utilize health services.
There are nine independent variables categorized as enabling factors in this study. Four of
these variables are used only for a subset analysis of the MEDPAR linked with the AHA survey
data. These four variables include hospital size, hospital ownership, hospital cancer program, and
hospital resident training. Hospital size is measured by the number of hospital beds at the facility
providing care to patient, and is recoded as (1) small <100 beds, (2) medium 100-250 beds, and
(3) large >250 beds. Hospital ownership describes the type of organization responsible for
establishing policy concerning overall operation of the hospitals. Government-owned, coded as
(1), includes State, County, City, City-county, Hospital district or authority, and federal
government owned; Non-government, not-for-profit, coded as (2), includes operation by a
church or other non-for-profit; and For-profit, investor-owned, coded as (3), includes ownership
by individual, partnership, and corporations. Hospital cancer program is measured by whether or
not the facility has an American College of Surgeons (ACoS)-approved cancer program.
Hospital resident training is measured by whether or not residency training at the facility has
been approved by the Accreditation Council for Graduate Medical Education. For both of these
variables, “yes” is coded as (1) and “no” coded as (0).
Page 64
55
The enabling variable cost measures the amount each patient was responsible to pay for
the use inpatient services. Using the individual patient records in the MEDPAR file, this amount
is determined by Medicare Part A coinsurance liability and beneficiary inpatient deductible
liability. Each year, there is a set inpatient hospital deductible amount that Medicare
beneficiaries are responsible to pay during a benefit period, which begins with the first day of
inpatient care, and ends after sixty consecutive days without inpatient care. Coinsurance amounts
are charged to the patient after sixty days during a benefit period. Coinsurance per day is
equivalent to one-fourth of the deductible amount after sixty days, half of the deductible amount
after ninety days, and then full costs once lifetime reserve days have been exhausted. Some
Medicare beneficiaries receive supplemental coverage to help reduce or eliminate their liability
amounts through Medigap plans purchased from private insurance companies, employer
retirement health plans, Medicare Advantage plans, or Medicaid benefits for those who qualify
based on low income criteria. Cost sharing can affect health services utilization in that patients
who have to pay more will reduce their use. The standard cost sharing mechanisms for Medicare
beneficiaries may influence decisions to seek or continue care, or types of providers or
treatments patients choose (Medicare Payment Advisory Commission, 2012).
Four additional enabling factors used in this study are county-level variables found in the
AHRF data. They are: access to physician services, geographic area, rural/urban, and
underserved area. Access to physician services is measured by the ratio of physicians per
100,000 of the population in patients’ county of residence. This variable is calculated using the
2010 U.S. Census Bureau population estimates and total Non-Federal Primary Care Physician
data (M.D.s and D.O.s) for the same year.
Page 65
56
Geographic area is based on the U.S. Census Bureau Region in which the patient’s
county of residence is located. The U.S. Census Bureau identifies these Regions using codes 1
through 4. These codes are (1) Northeast, (2) Midwest, (3) South, and (4) West. In the data
subset, U.S. Census Bureau Divisions are used for this variable given that the subset file contains
a much smaller number of patient records and they are largely based in the West region. The
variable geographic area in the data subset is coded 1 through 9 based on the U.S. Census Bureau
Divisions: (1) New England, (2) Middle Atlantic, (3) East North Central, (4) West North Central,
(5) South Atlantic, (6) East South Central, (7) West South Central, (8) Mountain, and (9) Pacific.
The Rural/Urban Continuum Codes are metropolitan counties (1-3) and nonmetropolitan
counties (4-9). They are defined in the AHRF data as: (1) Counties of metro areas of 1 million
population or more; (2) Counties in metro areas of 250,000–1,000,000 population; (3) Counties
in metro areas of fewer than 250,000 population; (4) Urban population of 20,000 or more,
adjacent to a metro area; (5) Urban population of 20,000 or more, not adjacent to a metro area;
(6) Urban population of 2,500-19,999, adjacent to a metro area; (7) Urban population of 2,500-
19,999, not adjacent to a metro area; (8) Completely rural or less than 2,500 urban population,
adjacent to a metro area; (9) Completely rural or less than 2,500 urban population, not adjacent
to a metro area (AHRF, 2014-2015). The same coding is used for this analysis.
Underserved area is measured by the county’s designation as a Health Professional
Shortage Area (HPSA) for primary care. HPSAs are designated by HRSA using the codes: (0)
None of the county designated as a shortage area; (1) The whole county was designated as a
shortage area; (2) One or more parts of the county was designated as a shortage area. The same
coding is used for this analysis.
Page 66
57
For HPSA designation, HRSA defines primary care practitioners as “non-Federal doctors
of medicine (M.D.) and doctors of osteopathy (D.O.) providing direct patient care who practice
principally in one of the four primary care specialties-general or family practice, general internal
medicine, pediatrics, and obstetrics and gynecology. Those physicians engaged solely in
administration, research and teaching will be excluded.” HSPA designation for primary care in a
geographic area requires that the following criteria are met: 1) Be a rational area for the delivery
of primary medical care services, 2) Have a population to full-time-equivalent primary care
physician ratio of at least 3,500:1, or have a population to full-time equivalent primary care
physician ratio of less than 3,500:1 but greater than 3,000:1 and have unusually high needs for
primary care services or insufficient capacity of existing primary care providers, and 3)
demonstrate that primary medical professionals in contiguous areas are over utilized, excessively
distant, or inaccessible to the population under consideration (AHRF, 2014-2015).
Need-for-Care Factors
Need-for-care factors, often considered to be the most important predictors, represent
how individuals perceive their own health, such as functional status, symptoms, magnitude of
problems, as well as and the type and level of treatment patients receive once being evaluated by
a care provider (Andersen, 1995). In research concerning use of emergency room services and
hospitalizations, need-for-care factors have frequently been identified as major predictors (de
Boer, Wijker & de Haes, 1997, pg. 111; Wolinsky, et al., 2008, pg. 205). These factors directly
pertain to an individual’s illness level and can provide a strong indication of their propensity to
utilize health services. Increased disease burden has been shown to lead to greater service
utilization in prostate cancer. Research has observed higher use patterns in patients with later
Page 67
58
stage disease, complications from treatment, greater comorbidity, and poorer functional status
(Yong, et al., 2014, pp. 291-296). Additionally, previous health services utilization research for
cancer has found increased comorbidity to be an influential predictor of use, and particularly
important given that examining comorbidities in cancer patients over the age of 65 can lead to a
better understanding of the role that comorbid illnesses have in the utilization of health resources
and inform interventions or improvement efforts by highlighting aspects on which attention
should focus (Manzano, et al., 2014, p. 3528).
In this study, variables used to determine patients’ need for health services are all from
individual patient records in the MEDPAR data. Intensive care unit (ICU) indicates time that
patients spent receiving this type of care during the hospitalization. This variable is recoded as
(1) “yes” if the patient record indicates that ICU care was provided and (2) “no” if the record
indicates that patients did spend time in the ICU while hospitalized. The treatment patients
received for prostate cancer and complications experienced from these disease management
interventions are based on selected ICD-9-CM procedure and diagnosis codes recorded in patient
files. Treatment is measured by intervention program of disease management according to
selected ICD-9-CM procedure codes for surgery and radiation. This variable is coded as (1)
“yes” if the patient record indicates that patients received surgery, radiation, or both, and (0)
“no” if records indicate that patients had not received either procedure.
The variable complications is measured by the presence of ICD-9-CM codes for certain
conditions and procedures that could potentially be associated with prostate cancer treatment.
This variable is coded (1) “yes” if the patient record included any of these diagnoses or
procedures, and (0) “no” if none of these diagnoses or procedures were included in the patient
records. Appendix A includes the ICD-9-CM codes used for these two variables.
Page 68
59
Comorbidity scores are based on the Charlson comorbidity index. The Charlson
comorbidity index, initially developed in a cohort of breast cancer patients, includes nineteen
medical conditions assigned a weight based on its potential for influencing mortality, and
considers both the number conditions and the seriousness of these conditions. The sum of the
weighted comorbidities is the index score assigned to patients, thus, a greater burden of
comorbid illness is indicated by a higher score. Deyo, et al. adapted the Charlson index for use
with inpatient administrative datasets by searching patients’ claims for ICD-9-CM diagnostic and
procedure codes that correspond to the Charlson comorbid conditions. Patients’ outpatient
records of course could possibly include important comorbidities that will not be included
(Klabunde, Potosky, Legler & Warren, 2000, pp. 1258-1259). This is, however, a valid
comorbidity measure that is frequently employed by researchers, and is an appropriate variable
for this analysis given that inpatient hospital claims are the only data available and the valuable
information can be derived by including Charlson comorbidity index score to study service
utilization by prostate cancer patients enrolled in Medicare.
In this analysis, comorbidity index scores are calculated using a SAS macro made
available by the NCI to calculate Charlson comorbidity weights from certain ICD-9 codes in
MEDPAR file claims (NCI, 2015). Based on the data from patient records in the MEDPAR file,
the weights calculated range from 2 through 16. Thus, the variable comorbidity is measured by
the calculated comorbidity index scores.
Page 69
60
Table 1. Measurement of predictor variables selected for analysis of variations in health
services utilization by prostate cancer patients
Category Study Variable Description Source
Health Service Hospital Length
of Stay
Number of days of patient hospital stay; most recent
admission for patients with multiple 2007 records
MEDPAR
Health Service Emergency
Room
Patient received ER services, indicated by presence of ER
charges in claims data (yes coded as 1, no coded as 0)
MEDPAR
Predisposing Age Patient age recorded when inpatient care was received MEDPAR
Predisposing
Genetic Factors
Personal and/or family history of disease based on selected
ICD-9-CM codes for history of cancer and other diseases (yes
coded as 1, no coded as 0)
MEDPAR
Predisposing Female
Household
Percentage of families with female head of household in
patient county of residence
AHRF
Predisposing Average
Household
Income
Median household income (dollar amount) in patient county
of residence
AHRF
Predisposing Medicaid
Eligible
Percentage of population eligible for Medicaid in patient
county of residence
AHRF
Predisposing Population 65+ Percentage of population age 65+ in patient county of
residence
AHRF
Predisposing Poverty Percentage of population below poverty level in patient
county of residence
AHRF
Predisposing Race/ Ethnicity Percentage of population that is White, Black/African
American, and Hispanic/Latino in patient county of residence
AHRF
Predisposing Uninsured
Population
Percentage of population with no health insurance in patient
county of residence
AHRF
Enabling Access to
Physician
Services
Ratio of physicians per 100,000 of population in patient
county of residence
AHRF
Enabling Cost Amount patient is responsible to pay for services (Medicare
Part A coinsurance liability amount and beneficiary inpatient
deductible liability amount)
MEDPAR
Enabling Geographic
Region
Area of the country in which patient county of residence is
located based on U.S. Census Bureau Regions (coded as 1 for
Northeast, 2 Midwest, 3 South, 4 West)
AHRF
Enabling Rural/ Urban Patient county of residence classification based on
Rural/Urban Continuum Code (coded 1-9; metropolitan
counties are 1-3 and nonmetropolitan counties are 4-9)
AHRF
Enabling Underserved
Area
Health Professional Shortage Area (HPSA) code based on
specific criteria and guidelines for primary medical care
HPSA designation (none of the county designated coded as 0;
whole county designated coded as 1; one or more parts of
county designated coded as 2)
AHRF
Enabling Hospital Size Total number of hospital beds at facility providing care to
patient (<100 beds coded as 1, 100-250 coded as 2, >250
coded as 3; Subset analysis only)
AHA
Page 70
61
Category Study Variable Description Source
Enabling Hospital
Ownership
Type of organization responsible for establishing policy
concerning overall operation of the hospitals (government,
coded as 1; non-government, not-for-profit coded as 2; for-
profit, investor-owned coded as 3; Subset analysis only)
AHA
Enabling Hospital Cancer
Program
Cancer program approved by the ACoS at facility providing
care (yes coded as 1; no coded as 0; Subset analysis only)
AHA
Enabling Hospital
Resident
Training
Residency training approved by Accreditation Council for
Graduate Medical Education (yes coded as 1; no coded as 0;
Subset analysis only)
AHA
Need Comorbidity
Index Score
Charlson Comorbidity Index Score calculated using macro
from the NCI to assign comorbidity weights based on ICD-9-
CM procedure and diagnosis codes in claims data
MEDPAR
Need
Complications
Patient experienced complications related to treatment as
indicated by the presence of any ICD-9-CM codes for certain
conditions and procedures (yes coded as 1, no coded as 0)
MEDPAR
Need Intensive Care
Unit
Patient received care in ICU during hospital stay (yes coded
as 1, no coded as 0)
MEDPAR
Need
Treatment
Intervention program of disease management based on ICD-9-
CM procedure codes for surgery and radiation (patients have
received surgery, radiation, both coded as 1, patients have
received neither coded as 0)
MEDPAR
Methods of Data Analysis
Data analysis is performed in two stages, which includes automatic interaction detector
(AID) analysis to identify possible subgroups, and regression analysis. Previous research
regarding health services utilization has demonstrated that such analytical techniques can be an
effective method to identify any interaction between the independent variables, and to examine
the relative importance of utilization predictors within subgroups with homogeneous utilization
patterns as well as the total sample (Wan & Yates, 1975, pp. 147-148). Applying these methods
in this analysis of health services utilization among prostate cancer patients enrolled in Medicare
is an appropriate approach that enhances the potential value and usefulness of findings, as more
Page 71
62
precise information pertaining to the characteristics of individuals and subgroups which make
them more or less likely to use certain health services can provide the detail needed to inform the
development of policies, programs, and other health care-related plans.
Automatic Interaction Detector Analysis
The first stage of this analysis subdivides prostate cancer patients into clusters with
relatively homogeneous service use patterns through AID analysis using the predictive modeling
software DTREG. AID analysis involves subdividing the original sample into a number of
mutually exclusive subgroups through a series of dichotomous splits with regard to the predictor
variables; each observation then becomes a member of exactly one subgroup (Wan, 2002, pp.
47-48). The DTREG software generates predictor trees showing the relative importance of
indicators in accounting for variability in the use of health services and the interaction between
independent variables. The single-tree models include a node for each split, which contain
information regarding the predictor that was used to generate the node and the values of the split
point. A textual report for each analysis is also created by the software.
The trees built using DTREG are labeled as classification trees or regression trees based
on whether the dependent variable is categorical or continuous. The independent variables can be
categorical and continuous. Therefore, the software will generate a classification tree for the
dependent variable emergency room use because it is categorical and a regression tree for the
dependent variable hospital length of stay because it is continuous. Each of the independent
variables will be entered into DTREG once for each of the health service utilization measures,
emergency room use and hospital length of stay. The predictor trees generated consist of nodes,
which each represent a set of records, or rows, from the dataset. The nodes are referred to as the
Page 72
63
root node (top node with all of the records from the data), interior nodes (nodes that have child
nodes), and terminal nodes (nodes that do not have child nodes). Child nodes are created from
dividing records into two groups based the binary split selected by DTREG (Sherrod, 2014, p.
235). The trees constructed through this process of partitioning the dataset into non-overlapping
subgroups provide a visual illustration of the importance of independent variables and their
interaction effects in explaining variation in the outcome variables.
The independent variables used for this stage of analysis are the social and demographic
factors of patient age, race/ethnicity (county population percentage Black/ African American,
percentage Hispanic/ Latino, and percentage White), rural/ urban, and underserved area. These
are factors commonly employed to distinguish particular needs of communities and individuals.
They are selected from the categories of predisposing and enabling factors, and make it possible
to determine if there are distinct differences in how need-for-care factors operate within each
subgroup in the second stage of analysis.
In order to produce trees with information that is clearer and able to be more easily
interpreted, several of the predictor variables are recoded into variables with three categories.
Smaller trees are not only easier to understand, but the predictive accuracy for unseen data is
greater, as they do not model minor noise in the data in the way that larger trees can (Sherrod,
2014, p. 3.67). The continuous variables, patient age and the three race/ethnicity factors are
categorized as follows: Patient age coded as (1) under 75, (2) 75 to 85, and (3) higher than 85;
Black/African American population coded as (1) less than 9%, (2) 9% to 13%, and (3) more than
13%; Hispanic/Latino population coded as (1) less than 14%, (2) 14% to 32.0%, and (3) more
than 32.0%; and White population coded as (1) less than 50.0%, (2) 50.0% to 75.0%, and (3)
more than 75.0%.
Page 73
64
The nine codes indicating rural/urban classification of counties are condensed, and coded
as (1) rural/urban continuum codes 1-3 (counties in metro areas), (2) rural/urban continuum
codes 4-6 (urban population of 20,000 or more and either adjacent or not adjacent to metro areas,
and urban population of 2,500-19,999 adjacent to metro areas), and (3) rural/urban continuum
codes 7-9 (urban population of 2,500-19,999 and not adjacent to a metro area, and completely
rural or less than 2,500 urban population and either adjacent or not adjacent to a metro area).
Underserved area remains the same (codes zero to two indicating portion of county designated as
Health Professional Shortage Area).
To address the issue of missing values, the DTREG software manual recommends the use
of surrogate splitters to classify rows with missing values in the primary splitter as the most
accurate method. This is an estimation technique in which the software computes the association
between the primary splitter and each alternate predictor as a function of how closely the
alternate predictor matches the primary splitter. Surrogate splitters are described as “predictor
variables that are not as good at splitting a group as the primary splitter but which yield similar
splitting results; they mimic the splits produced by the primary splitter” (Sherrod, 2014, pp. 364-
365). This method is used for missing values in the analysis of both emergency room use and
hospital length of stay predictor trees.
Regression Analysis
The second stage of this analysis examines the relative contribution of each category of
the predictor variables (predisposing, enabling and need-for-care factors) in explaining the total
variance in the dependent variables using regression analysis. Multiple regression can be used
when there is one continuous dependent variable and two or more independent variables that can
Page 74
65
be continuous, categorical, or a combination of both. If the dependent variable is categorical,
then logistic regression must be used. The hierarchical procedure in regression analysis enables
the researcher to decide the order in which blocks of independent variables are entered into the
equation. The relative contribution of the variables in each step are assessed, as is the overall
model, for predicting the dependent variable (Pallant, 2007, pp. 147-169). The statistical
software IBM SPSS Statistics version 23 Premium Grad Pack is used to perform hierarchical
binary logistic regression for the dependent categorical variable emergency room use and
hierarchical multiple regression for the dependent continuous variable hospital length of stay.
In this study, regression is used to determine the probability of patients utilizing the two
types of health services based on specific factors which characterize individual patients and the
areas in which they reside. The hierarchical regression procedure makes it possible to examine
the influence of each group of independent variables categorized as predisposing, enabling, and
need domains, as well as their joint influence. Understanding the extent to which each category
of predictor influences the utilization of health services can be particularly useful for research
intended to inform policy matters. Ideally, individual illness level, or need-for-care, should be
the basis for a distribution of health care that is “equitable” as opposed to social and
demographic such as age, race or income. However, realistic public policy efforts aimed at
reducing problematic variations in service utilization must consider the extent to which certain
factors can actually be altered. Such factors would typically be those categorized as enabling
factors (Andersen & Newman, 1973, pp. 117-119). Thus, using the hierarchical technique to
observe the amount of variance that each category of predictors explains in the use of health
services provides the opportunity to determine which factors are influential, as well as how such
information may be applicable to meaningful change efforts.
Page 75
66
Regression makes several assumptions about the data. It is important for researchers to be
aware of these conditions and check the data set prior to performing either type of regression
analysis. Multicollinearity exists when there is high correlation among two or more of the
predictors, and can lead to difficulty in understanding the contributions of these variables to
account for variation in the dependent variable. Outliers are cases not explained well by the
model. These extremely high or low scores in a variable, or cases classified in a category not
strongly predicted by the model may also be problematic for interpreting results.
Several additional assumptions are made by multiple regression. These include: 1)
normal distribution of residuals about the predicted dependent variable scores (normality), 2)
relationship with residuals and predicted dependent variable scores is a straight line (linearity), 3)
residual variance is the same for all predicted dependent variable scores (homoscedasticity), and
4) independence of residuals. Logistic regression does not make these assumptions regarding
distribution (Pallant, 2007, pp. 149; 169). Procedures included in the SPSS Statistics software are
used to check these assumptions for regression analysis. Missing values are addressed using the
exclude cases pairwise option in SPSS, which will allow for cases to still be included for analysis
if they have the necessary information, and exclude the cases only if the data for a specific
analysis is missing (Pallant, 2007, p. 57).
In the hierarchical binary logistic regression models for analysis of emergency room use
and the hierarchical multiple regression models for hospital length of stay, variance in the
utilization behavior is explained by predisposing factors, enabling factors, and need-for-care
factors as individual groups of predictors and the combined effect as categories are added to the
model. The final model for hospital length of stay includes the indicators from each category of
predictor, as well as the impact of emergency room use to examine variations in utilization by
Page 76
67
prostate cancer patients. The analysis is performed in each of the subgroups identified through
AID analysis in step one, as well as the entire sample to determine the relative influence of the
independent variables, interaction effects, and the total variance explained by these factors for
the utilization of health services among older males with prostate cancer.
Hierarchical binary logistic regression models for analysis of emergency room use are
evaluated using pseudo R Square statistics, goodness of fit test statistics, and odds ratios (OR).
Cox & Snell R Square and Nagelkerke R Square values are pseudo R Square statistics used in
logistic regression analysis to determine the amount of variance in the dependent variable that
can be explained by the model as a whole. To assess the goodness of fit for each model,
statistical significance values provided by the Omnibus Test of Model Coefficients and Hosmer
and Lemeshow Test are used. These values indicate how well the model fits the data. Statistical
significance of model fit and independent variables is indicated by a p-value of 0.05 or less. For
the Hosmer and Lemeshow Test, a p-value less than 0.05 indicates a poor model fit.
In logistic regression, the “Exp(B)” value is the odds ratio (OR), which is used to assess
the contribution of each predictor variable. The odds ratios represent the likelihood of a patient
using the emergency room as the value of the predictor changes. The beta values (β), which are
the coefficients that would be used for constructing a regression equation, indicate whether a
predictor increases or decreases the likelihood of emergency room use bases on whether the
value is positive or negative. By comparing the odds ratios of statically significant variables, it is
possible to determine the relative importance of individual predictors in explaining variation in
emergency room utilization by prostate cancer patients in this analysis.
Hierarchical multiple regression models in the analysis of hospital length of stay are
evaluated using R Square (R2) values and standardized beta values (β). The F value included in
Page 77
68
the ANOVA table for the model at each step of the hierarchical multiple regression model is
used the assess whether or not the model fit as a whole is statistically significant. As with the
logistic regression models, statistical significance of model results and independent variables are
indicated by a p-value of 0.05 or less.
The R2 value indicates how much of the variance in the dependent variable can be
explained by the predictor variables. The R2 change value when each group of predictor
variables are entered into the model indicates the amount of additional variance explained by that
group of predictors after holding all other factors constant. The R2 value for the full model
indicates the total variance explained by these factors when taken into account together. This
makes it possible to determine for each group of predictor variables the amount of variance
accounted for predisposing, enabling, and need-for-care factors independently and collectively.
The contribution of each predictor is assessed using standardized beta values (β).
Standardized beta coefficients are values that indicate the importance of an independent variable
relative to the other independent variables included in the model, whereas the unstandardized
coefficient (B) would be used in developing a regression equation. Comparing the standardized
beta value (β) of statically significant variables makes it possible to determine the relative
importance of individual predictors in explaining variation in the length of hospital stay for
prostate cancer patients in this analysis.
Analysis of hospital variables, which are categorized as enabling factors, is performed in
a subset of the administrative claims data due to the fact that only a portion of records are able to
be matched with the facility information in the hospital dataset. The same methods of analysis
that are outlined for the full dataset are the methods used for analysis of emergency room use and
hospital length of stay for patient administrative records in the data subset.
Page 78
69
Hypothesis Testing and Model Validation
The results derived from the analysis of data are used to test the research hypotheses and
validate the overall model of the modified Andersen model developed for this study. AID
analysis makes it possible to identify how particular social and demographic factors and
interaction effects influence higher or lower health services utilization patterns by patients.
Hierarchical regression analysis makes it possible to determine the variance in health services
utilization that can be explained by the categories or predictors, as well as the relative influence
of individual predictors.
The independent variables are considered to be influential predictors of emergency room
use and hospital length of stay if they are statistically significant based on a p-value of 0.05 or
lower. The relative importance of predictor variables is determined by the OR values in logistic
regression and standardized β values in multiple regression, with higher OR and standardized β
values indicating that a predictor is more influential than the other predictors in the model with
lower values. For each of the subgroups identified by AID analysis, the importance of predictors
and relative influence of factors in the model are evaluated to determine whether the research
hypotheses are supported by the results of analysis.
The hierarchical procedure in regression analysis makes it possible to evaluate each
category of predictors to determine the amount of variance that predisposing, enabling, and need-
for-care factors explain in emergency room use and hospital length of stay by prostate cancer
patients. R2 values are used to report the amount of variance in health services utilization
explained by the categories of predictors. As each category of predictors is entered, the model is
evaluated according to goodness of fit test statistics and a p-value of 0.05 or less. Based on the
statistical significance of model fit and variance explained by the factors included in the model at
Page 79
70
each step, it is possible to see if the overall modified model for analysis of health services
utilization by prostate cancer patients is a valid model for examining emergency room use and
hospital length of stay by Medicare enrollees with prostate cancer.
Chapter Summary
This is a nonexperimental study that uses a cross-sectional design. The main data source
is the MEDPAR file, which includes inpatient administrative claims data for patients admitted to
the hospital in 2007. Data from the AHRF is used to provide information about the geographic
areas in which patients reside. AHA Survey Data from 2008 is used for a subset analysis to
examine influential hospital attributes. Only MEDPAR patient records that include the ICD-9-
CM code for prostate cancer diagnosis are included in this study. The two dependent variables
that are used to measure health services utilization are emergency room use and hospital length
of stay. The independent variables include ten predisposing factors, five enabling factors, and
four need-for-care factors. An additional four enabling factors are used in the data subset
analysis to examine the importance of hospital characteristics.
In the first stage of analysis, the predictive modeling software DTREG is used to perform
AID analysis with several social and demographic variables for each of the two dependent
variables. The sample is subdivided into a number of mutually exclusive subgroups through a
series of dichotomous splits with regard to the predictor variables to identify subgroups with
Page 80
71
similar use patterns. In the second stage of analysis, hierarchical logistic regression is performed
for the dependent categorical variable emergency room use and hierarchical multiple regression
for the dependent continuous variable hospital length of stay using the statistical software IBM
SPSS Statistics version 23 Premium Grad Pack. Regression analysis is performed in each of the
subgroups identified through AID analysis and the entire dataset. The purpose of this is to
determine the relative importance of the predisposing, enabling, and need-for-care factors in
predicting the use of health services, and any important interaction effects. This analysis is also
performed using a subset of the data to assess the importance of facility-related variables.
Page 81
72
CHAPTER FOUR: RESULTS
This chapter includes descriptive statistics for the full dataset and data subset, results of
AID analysis, results of hierarchical binary logistic regression for the analysis of emergency
room utilization, results of hierarchical multiple regression for the analysis of hospital length of
stay, and results of the data subset analysis including hospital characteristics. Chapter four
concludes with hypothesis testing to address the five research questions that this study aims to
answer regarding the utilization of health services by prostate cancer patients:
1. What is the relative importance of predisposing factors, enabling factors, and need-for-
care factors in accounting for variability in emergency room use among prostate cancer
patients?
2. What is the relative importance of predisposing factors, enabling factors, and need-for-
care factors in accounting for variability in hospital length of stay among prostate cancer
patients?
3. To what degree does emergency room use have an effect on hospital length of stay
among prostate cancer patients?
4. Do predisposing, enabling, and need-for-care factors show any important interaction
effects accounting for the variability in the use of health services in specific subgroups of
prostate cancer patients?
5. To what degree do hospital attributes influence the utilization of health services among
prostate cancer patients?
Page 82
73
Descriptive Statistics
Table 2 shows descriptive statistics for the variables used in this analysis of variations in
utilization of health services by prostate cancer patients. The dataset includes 5,754 patient
records, and there are ten missing values for several of the variables from the AHRF data in the
full dataset due to mismatched county coding information when the AHRF data and MEDPAR
files were merged. As discussed in Chapter 3, missing values were handled using the method of
surrogate splitters in DTREG for AID analysis and exclude cases pairwise option in SPSS for
regression analysis.
The average age of patients is 77.9 years. Emergency room services were used by 58% of
patients, and the average number of days spent in the hospital is 4.8. More than 57% of patients
resided in counties identified as being the most urban on the rural/urban continuum code, and
50.5% were from counties that had been wholly designated as an underserved area. Treatment
for prostate cancer is recorded in the claims record for 9.1% of patients. The categories for
comorbidity index scores 13 through 16 have been collapsed into one category because of the
limited number of patient observations (between 0 and 2) in those categories in the full dataset.
In the data subset, comorbidity index scores 10 through 16 have been collapsed because there are
fewer patient observations in those categories.
Page 83
74
Table 2. Descriptive statistics for all variables used in analysis of variations in utilization of
health services by prostate cancer patients (N=5,754)
Variable n Mean SD Range
Age 5,754 77.9 8.0 47-101
Female Head of Household % 5,744 20.0 5.5 6-46.6
Average Household Income 5,744 54,889 13,693 22,335-105,987
Population Medicaid Eligible % 5,744 22.3 9.4 0.2-58.1
Population Age 65+ % 5,744 13.0 3.0 6.5-34.1
Poverty % 5,744 15.0 5.5 3.2-42.2
Uninsured Population % 5,744 17.5 5.2 4.5-37.6
Population Black/ African American% 5,744 12.1 13.3 0-71.3
Population Hispanic/ Latino % 5,744 19.1 17.1 0.4-95.7
Population White % 5,744 68.0 17.0 15.2-98.9
Access to Physicians 5,744 75.3 26.4 0-195.8
Cost 5,754 750.2 618.5 0-22,140
Hospital Length of Stay 5,754 4.8 5.0 1-79
Variable N %
Genetic Factors No 5,185 90.1
Yes 569 9.9
Rural/Urban Metro >1 million 3,311 57.5
Metro 250,000–1 million 1,159 20.1
Metro <250,000 429 7.5
Urban >20,000, Metro adjacent 169 2.9
Urban >20,000, Not metro adjacent 128 2.2
Urban 2,500-19,999, Metro adjacent 233 4
Urban 2,500-19,999, Not metro adjacent 200 3.5
Rural or < 2,500 urban, Metro adjacent 52 0.9
Rural or <2,500 urban, Not metro adjacent 63 1.1
Missing 10 0.2
Underserved
Area
None of county is shortage area 448 7.8
Whole county is shortage area 2,921 50.8
Part of county is shortage area 2,375 41.3
Missing 10 0.2
Geographic
Region Northeast 1,386 24.1
Midwest 852 14.8
South 1,085 18.9
West 2,421 42.1
Missing 10 0.2
Comorbidity
Index Score*
Score 2 3,022 52.5
Score 3 433 7.5
Score 4 590 10.3
Score 5 176 3.1
Score 6 30 0.5
Score 7 4 0.1
Page 84
75
Variable N %
Score 8 1,030 17.9
Score 9 186 3.2
Score 10 190 3.3
Score 11 64 1.1
Score 12 23 0.4
Score 13 6 0.1
Complications No 5,288 91.9
Yes 466 8.1
Intensive Care
Unit No 4,542 78.9
Yes 1,212 21.1
Treatment No 5,228 90.9
Yes 526 9.1
Emergency
Room No 2,419 42
Yes 3,335 58
*Comorbidity Index Score 13 includes patients with scores 13 through 16
Descriptive statistics for the data subset used in the analysis including hospital factors are
shown in Table 3. There are 556 patient records and no missing values. Emergency room
services were used by 55.4% of patients in this sample, and the average number of days spent in
the hospital is 4.8. The average age of patients is 78.4 years. The data subset does not include
any patients from counties identified as being the most rural on the rural/urban continuum code,
and 69.2% were from counties identified as being the most urban on the rural/urban continuum
code. More than 77% resided in counties that had been wholly designated as an underserved
area. Although a smaller measure is used for the geographic area variable (U.S. Census Bureau
Divisions rather than Regions), approximately 94% of patients were still based in a single area,
the Pacific, which includes Alaska, California, Hawaii, Oregon and Washington. Treatment for
prostate cancer is recorded in the claims for 12.1% of patients. Comorbidity index scores 10
through 16 have been collapsed into one category because of the very small number of patient
observations (between 0 and 2) in those categories.
Page 85
76
Table 3. Descriptive statistics for variables used in analysis of variations in utilization of
health services by prostate cancer patients using data subset with hospital variables
(N=556)
Variable Mean SD Range
Age 78.4 8.1 47-97
Female Head of Household % 21.1 2.7 12.4-32.5
Average Household Income 5,2813 9,819 29,633-73,678
Population Medicaid Eligible % 33.3 8.0 11.6-58.1
Population Age 65+ % 11.7 2.3 7.9-24.1
Poverty % 17.7 4.5 9.3-34.5
Uninsured Population % 21.8 4.5 13.6-27.2
Population Black/ African American % 7.9 4.8 0.2-54.7
Population Hispanic/ Latino % 38.0 16.0 1-80.4
Population White % 56.4 12.3 23.3-89.3
Cost 737.1 665.9 0-10,912
Access to Physician 70.8 16.4 13.6-98.1
Hospital Length of Stay 4.8 5.2 1.0-60
Variable N %
Genetic
Factors No 500 89.9
Yes 56 10.1
Rural/Urban Metro >1 million 385 69.2
Metro 250,000–1 million 74 13.3
Metro <250,000 47 8.5
Urban >20,000, Metro adjacent 10 1.8
Urban >20,000, Not metro adjacent 14 2.5
Urban 2,500-19,999, Metro adjacent 15 2.7
Urban 2,500-19,999, Not metro adjacent 10 1.8
Rural or < 2,500 urban, Metro adjacent 1 0.2
Rural or <2,500 urban, Not metro adjacent 0 0
Underserved
Area None of county is shortage area 4 0.7
Whole county is shortage area 429 77.2
Part of county is shortage area 123 22.1
Geographic
Region
(Division)
East South Central 8 1.4
West South Central 4 0.7
Mountain 20 3.6
Pacific 524 94.2
Hospital Size Small (<100 beds) 219 39.5
Medium (100-250 beds) 150 27.0
Large (>250 beds) 186 33.5
Page 86
77
Variable N % Hospital
Ownership Government Owned 156 28.1
Non-Government, Not-For-Profit 324 58.3
Investor Owned, For-Profit 76 13.7
Hospital
Cancer
Program Cancer program not ACOS approved 338 60.8
Cancer program ACOS approved 218 39.2
Hospital
Resident
Training Residency program not ACGME approved 527 94.8
Residency program ACGME approved 29 5.2
Comorbidity
Index Score Score 2 303 54.5
Score 3 28 5
Score 4 51 9.2
Score 5 18 3.2
Score 6 2 0.4
Score 7 1 0.2
Score 8 103 18.5
Score 9 21 3.8
Score 10 29 3.5
Complications No 504 90.6
Yes 52 9.4
Intensive Care
Unit No 443 79.8
Yes 112 20.2
Treatment No 489 87.9
Yes 67 12.1
Emergency
Room No 248 44.6
Yes 308 55.4
*Comorbidity Index Score 10 includes patients with scores 10 through 14.
Results of Automatic Interaction Detector Analysis
AID analysis was performed using the predictive modeling software DTREG. The six
social and demographic variables used for this stage of analysis are: patient age, percentage of
Page 87
78
population Black/ African American, percentage of population Hispanic/ Latino, percentage of
population White, rural/urban, and underserved area. Table 4 shows the characteristics for these
independent variables and the two dependent variables.
Table 4. Characteristics, average hospital length of stay and percentage of emergency room
utilization by prostate cancer patients for six independent variables in automatic
interaction detector analysis
All Patients (N=5,754*) Data Subset (N=556)
Independent
Variable Category n %
Hospital
Days
ER
Use n %
Hospital
Days
ER
Use
Patient Age 1. <75 2,219 38.6 4.77 52.5 182 32.7 4.52 46.7
2. 75-85 2,504 43.5 4.68 58.3 262 47.1 4.97 54.6
3. >85 1,031 17.9 4.95 68.9 112 20.1 4.11 71.4
Black/ African
American
Population (%)
1. <9 2,887 50.2 4.40 55.1 184 33.1 4.10 56.0
2. 9-13 1,382 24.0 5.12 59.7 362 65.1 5.11 55.2
3. >13 1,475 25.6 5.10 61.8 10 1.8 6.00 50.0
Hispanic/
Latino
Population (%)
1. <14 2,955 51.4 4.70 57.6 50 9.0 4.22 50.0
2. 14-32 1,441 25.0 4.72 59.1 155 27.9 3.74 53.5
3. >32 1,348 23.4 4.92 57.4 351 63.1 5.34 57.0
White
Population (%)
1. <50 573 10.0 5.30 59.3 70 12.6 3.87 61.4
2. 50-75 3,267 56.8 4.91 58.8 416 74.8 5.17 55.5
3. >75 1,904 33.1 4.33 56.0 70 12.6 3.50 48.6
Rural/Urban 1. Urban 4,899 85.1 4.98 60.1 506 91.0 4.98 56.7
2. Urban Adjacent 530 9.2 4.19 46.8 39 7.0 3.92 43.6
3. Rural 315 5.5 3.97 43.2 11 2.0 3.45 36.4
Underserved
Area
0. No shortage 448 7.8 4.54 57.4 4 0.7 9.50 50.0
1. All shortage 2,921 50.8 4.68 57.1 429 77.2 4.99 54.5
2. Part shortage 2,375 41.3 4.88 59.1 123 22.1 3.95 58.5
TOTAL 4.76 58.0 4.79 55.4
*Total number for the dependent variables Hospital Days and Emergency Room Use and the independent variable Patient
Age; for the remaining independent variables N=5,744 due to 10 missing.
The number of missing values (ten) for several of the predictor values in the full dataset
is relatively small. Missing values are addressed using the surrogate splitters method described in
Page 88
79
Chapter 3. These independent variables were entered into DTREG once for emergency room use
and then again for hospital length of stay. Through the process of partitioning the dataset into
non-overlapping subgroups, two predictor trees were constructed showing the importance of
factors and their interaction effects in explaining variation in the dependent variables.
Emergency Room Use
The predictor tree for emergency room utilization by prostate cancer patients is shown in
Figure 3. A summary of the terminal nodes is provided in Appendix C. Rural/urban is the most
important predictor, and the only variable of importance for the split process out of the six
independent variables entered. The two terminal nodes indicate patterns of no emergency room
utilization existing in non-urban areas (n = 845, 14.7%), and patterns of emergency room
utilization existing in urban areas (n = 4,909, 85.3%). The number in each node corresponding to
the numbers in each of the three categories for this variable differs slightly from the descriptive
information in Table 2 due to the ten missing values for this variable in the dataset. The node
information for classification trees that are produced when the dependent variable is categorical
also includes misclassification percent which can be defined as “the percentage of the rows in
this node that had target variable categories different from the category that was assigned to the
node” (Sherrod, 2014, p. 242). Based on the results, there do not appear to be any important
interactions between these variables in predicting emergency room use by prostate cancer
patients.
Page 89
80
Group A Group B
Figure 3. Predictor tree for analysis of emergency room utilization by prostate cancer
patients
Hospital Length of Stay
The predictor tree showing the important factors in accounting for variation in hospital
length of stay by prostate cancer patients is displayed in Figure 4. Patient age is the only one of
the six social and demographic variables that showed no interaction effects in this analysis.
There are nine terminal nodes representing subgroups identified as having similar use patterns.
Three of the variables, rural/urban, Hispanic/ Latino population, and underserved area are each
found in three of the terminal nodes. The percentage of patients found in the rural/ urban
terminal nodes is 47.0%, followed by 34.5% and 18.5% in terminal nodes for Hispanic/ Latino
population and underserved area respectively. The highest percentage of patients (35%) fall into
node 7. Together, nodes 6 and 7 include nearly 47% of patients. In these subgroups, there is an
interaction between county characteristics of low Black/ African American population, higher
White population, and rural/urban.
Page 90
81
Figure 4. Predictor tree for analysis of hospital length of stay by prostate cancer patients
Page 91
82
A summary of the terminal nodes ranked according to the mean number of hospital stay
days is included in Appendix C. Underserved areas categorized as either all or part of the county
being designated a health professional shortage area are related to longer hospital length of stay.
The percentage of patients found in these three nodes (nodes 142, 143, and 149) is 18.5%, most
of which (17.4%) are found in node 149. With the exception of nodes 142 and 143, which
together account for only about 1% of patients, the average number of days spent in the hospital
is greater in subgroups identified by the interactions between higher Black/African American
population and underserved area (node 149) and higher Black/ African American population,
underserved area, and Hispanic/Latino population (node 151). The mean length of stay is lowest
in the subgroup identified by the interaction between low Black/ African American population,
higher White population, and non-urban (node 6).
Data Subset
The predictor trees for analysis using the data subset are shown in Figure 5 for
emergency room use and Figure 6 for hospital length of stay. A summary of the terminal nodes is
included in Appendix C. Patient age is the only variable of importance in the subset analysis of
emergency room use. There are three terminal nodes. The terminal node with patients classified
as non-users of emergency room services is the subgroup of patients younger than 75 (n = 206,
37.1%). Nearly 63% of patients are classified as users of emergency room services. These are the
subgroup of patients age 75-85 (n = 238, 42.8%) and patients older than 85 (n = 112, 20.1%).
Percentage of Hispanic/ Latino population is the only variable of importance in the subset
analysis of hospital length of stay. There are two terminal nodes, which show patterns of higher
average hospital length of stay in counties with more than 32% Hispanic/ Latino population (n =
Page 92
83
351, 63.1%) and patterns of lower average hospital length of stay in counties with less than 32%
Hispanic/Latino population (n = 205, 36.9%). There are no interaction effects between the
variables.
Group C
Group A Group B
Figure 5 . Predictor tree for analysis of emergency room utilization by prostate cancer
patients in data subset
Group A Group B
Figure 6. Predictor tree for analysis of hospital length of stay by prostate cancer patients in
data subset
Page 93
84
Table 5. Description of subgroups used for regression analysis of variations in health
services utilization by prostate cancer patients
N % ER
Use
Hospital
Days
Emergency Room Use
All Prostate Cancer Patients 5,754 100
A. Non-Urban County 845 14.7 No
B. Urban County 4,909 85.3 Yes
Hospital Length of Stay
All Prostate Cancer Patients 5,754 100 4.76
A. Black/AA Population <9%, White >75%, Non-urban 666 11.6 3.89
B. Black/AA Population <9%, White >75%, Urban 2,019 35.1 4.43
C. Black/AA Population <9%, White <50%,
Hispanic/Latino >14%
124 2.2 4.33
D. Black/AA Population <9%, White <50%,
Hispanic/Latino <14%, All/Part Underserved Area
78 1.4 8.32
E. Black/AA Population >9%, All/ None Underserved
Area, Hispanic/Latino <32%
1,274 22.2 4.75
F. Black/AA Population >9%, All/ None Underserved
Area, Hispanic/Latino >32%
582 10.1 5.32
G. Black/AA Population >9%, Part Underserved Area 1,001 17.4 5.45
Emergency Room Use – Data Subset
A. Patient Age <75 206 37.1 No
B. Patient Age 75-85 238 42.8 Yes
C. Patient Age >85 112 20.1 Yes
Hospital Length of Stay – Data Subset
A. Hispanic/Latino Population <32% 205 36.9 3.85
B. Hispanic/Latino Population >32% 351 63.1 5.34
Subgroups for Regression Analysis
Table 5 describes all of the subgroups that have been identified for inclusion in the
regression analysis of health services utilization by prostate cancer patients in the full dataset and
the data subset including hospital factors based on the influential variables and interaction effects
Page 94
85
found through AID analysis. Subgroups represent the terminal nodes in each predictor tree. Due
to the low number of patients in terminal node 134 (n = 16), node 142 (n = 55) and node 143 (n =
7) in the predictor tree for hospital length of stay by all prostate cancer patients, they have been
combined to create subgroup D (n = 78). The new mean number of days spent in the hospital by
patients in this subgroup is 8.32, which is the highest mean hospital length of stay out of all
subgroups.
Results of Regression Analysis in the Target Subgroups
Assumptions
Preliminary analyses have been conducted to evaluate the assumptions of
multicollinearity, normality, linearity, and homoscedasticity. Although the distribution
assumptions may not be problematic for larger samples, and logistic regression makes no
assumptions about distribution of residuals, two independent variables with a high bivariate
correlation and unusual cases considered to be outliers can be problematic for both multiple
regression and logistic regression. The values used to determine multicollinearity are correlation
of 0.8 or higher, Variance Inflation Factor (VIF) greater than 10, and Tolerance less than 0.10.
Correlation tables for the full dataset and data subset are included in Appendix B. There is a
correlation of at least 0.8 between the variables poverty and household income (-0.833), poverty
and Medicaid eligible (0.8), and population Black/African American and female head of
household (0.831). Only the variable female head of household exceeded the VIF and tolerance
Page 95
86
values (14.24, 0.07). Based on this, the variable female head of household is omitted from the
analysis.
In the data subset, there is a correlation of at least 0.8 between poverty and Medicaid
eligible population (0.828), average household income and poverty (-0.812), and average
household income and underserved area (0.807). The VIF and tolerance values for Medicaid
eligible population and average household income are 53.99, 0.019 and 45.89, 0.022
respectively. Additionally, the VIF and tolerance values for percentage of population uninsured
were 27.68 and 0.036, and for female head of household are 26.517 and 0.038. These four
independent variables have been removed from the analysis using the data subset.
Outliers are not uncommon for larger datasets. Both the full dataset with all prostate
cancer patients and the data subset have been evaluated for any extreme outlying or unusual
cases that might impact the results. The Casewise Diagnostics table generated by SPSS includes
cases with standardized residual values above 3.0 or below -3.0. It would be expected for 1% of
cases to fall outside of this range in a normally distributed sample (Pallant, 2007, p. 158). In the
full dataset for this analysis, the Casewise Diagnostics table requested (set to outliers outside of 3
standard deviations) included 110 cases, which is 1.9%. The Cook’s Distance value, which can
be used to assess whether or not the model results would be excessively influenced by these
unusual cases based on values greater than 1, is not higher than 0.483 for any of the cases.
Additionally, the Casewise List requested in logistic regression does not show any cases that
were found for which the model did not fit well. Therefore, no cases have been removed from
the dataset. In the data subset, 9 cases, or 1.61%, were included in the Casewise Diagnostics
table. The maximum Cook’s Distance value is 2.115, indicating that at least on case may have
undue influence on the results of the model. This is the only case with a value greater than 1.
Page 96
87
After removing this case from the data subset, the Casewise Diagnostics table included 7 cases,
or 1.26%, which is now closer to the 1% that would be expected in a normally distributed
sample.
Results of Hierarchical Logistic Regression Analysis for Emergency Room Use
Hierarchical binary logistic regression is performed to assess the impact of factors on the
likelihood that patients would utilize emergency room services. The model contains ten
predisposing factors, five enabling factors, and four need-for-care factors, which is a total of
nineteen independent variables. The independent variables that make a unique statistically
significant contribution at each step for all groups are reported in this section and identified
below in Table 10 following all regression analysis results. Appendix C includes full results for
each logistic regression model.
The fit of all models is statistically significant except for the model with only
predisposing factors for Emergency Room Group B based on values of the Hosmer and
Lemeshow Fit Test, chi-square = 23.708, p = 0.003, indicating that the model with only
predisposing factors for patients in urban areas is not able to distinguish between patients who
used the emergency room and those who did not. The fit for this model improves when the other
categories of predictors are added. All goodness of fit test values and pseudo R square statistics
are shown in Table 6.
All Prostate Cancer Patients
Predisposing factors explain between 2.5% (Cox & Snell R Square) and 3.4%
(Nagelkerke R Square) of the variance in emergency room use for all prostate cancer patients.
The statistically significant variables aree the predisposing factors age, average household
Page 97
88
income, percentage of county population over age 65, percentage of population with no health
insurance, percentage of population that is Black/ African American, percentage of population
that is Hispanic/ Latino, and percentage of population that is White.
Prostate cancer patients are more likely to use emergency room services as their age
increases (β = 0.028, OR = 1.029, p < 0.001). The likelihood of emergency room use by patients
is greater as there are increases in percentage of Black/ African American population (β = 0.018
OR = 1.019, p < 0.001), percentage Hispanic/ Latino (β = 0.009, OR = 1.009, p = 0.005) and
percentage White (β = 0.008, OR = 1.008, p = 0.006). Equal likelihood is indicated by county
average annual income (β = 0, OR = 1, p = 0.005). Emergency room use is less likely as there are
increases in county percentage of individuals over age 65 (β = -0.033, OR = 0.967, p = 0.005)
and percentage with no health insurance (β = -0.03, OR = 0.97, p = 0.002).
When enabling factors are added, the amount of variation explained is between 3.7%
(Cox & Snell R Square) and 5.0% (Nagelkerke R Square). The statistically significant variables
are the predisposing factors age and population below poverty level, and the enabling factors
cost, rural/ urban and geographic region. Patients are more likely to use the emergency room as
age increases (β = 0.029, OR = 1.03, p < 0.001), and the percentage of individuals living below
poverty level in the county increases (β = 0.04, OR = 1.041, p = 0.006). Equal likelihood is
indicated by cost (β = 0, OR = 1, p = 0.005). Compared to patients in counties with rural/ urban
continuum code 1, emergency room use is less likely by patients in counties with rural/ urban
continuum code 3 (β = -0.309, OR = .734, p = 0.012) through code 9 (β = -0.914, OR = 0.401, p
= 0.002), with the exception of rural/urban code 5. Patients living in the South (β = -0.361, OR =
0.697, p = 0.009) or West (β = -0.488, OR = 0.614, p < 0.001) regions of the U.S. are less likely
to use emergency room services than patients in the Northeast.
Page 98
89
The amount of variance explained when need-for-care factors are entered is between
13.1% (Cox & Snell R Square) and 17.6% (Nagelkerke R Square). The statistically significant
variables are the predisposing factors age and population below poverty level, the enabling
factors rural/ urban and geographic region, and the need-for-care factors comorbidity index
score, treatment, and intensive care unit. Patients are more likely to use the emergency room as
there are increases in age (β = 0.025, OR = 1.026, p < 0.001) and the percentage of individuals
living below poverty level in the county (β = 0.052, OR = 1.054, p = 0.001).
Compared to patients in counties with rural/ urban continuum code 1, considered to be
the most urban, emergency room use is less likely by patients in counties with rural/ urban
continuum code 3 (β = -0.316, OR = .729, p = 0.016) through code 9 (β = -0.837, OR = 0.433, p
= 0.006), with the exception of rural/ urban code 5. Patients living in the Midwest (β = -0.258,
OR = 0.773, p = 0.038), South (β = -0.366, OR = 0.694, p = 0.012) or West (β = -0.375, OR =
0.687, p = 0.002) are less likely to use emergency room services than patients in the Northeast.
Patients with more comorbid illnesses are more likely to use emergency room services,
with increased likelihood for nearly all comorbidity index scores from score 3 (β = 0.462, OR =
1.587, p < 0.001) to score 12 (β = 1.244, OR = 3.469, p = 0.021) when compared to the lowest
score, score 2. Patients receiving care in the intensive care unit are more likely to use emergency
room services than patients not receiving this type of care (β = 0.42, OR = 1.523, p < 0.001).
Patients receiving treatment for prostate cancer are less likely to use emergency room services
than patients who are not receiving treatment (β = -2.225, OR = 0.108, p < 0.001).
Page 99
90
Emergency Room Group A (Non-Urban County Residents)
Predisposing factors explain between 2.5% (Cox & Snell R Square) and 3.4%
(Nagelkerke R Square) of the variance in emergency room use for Emergency Room Group A.
This subgroup includes only patients who reside in non-urban counties and have patterns of less
emergency room use. The statistically significant variables are the predisposing factors average
household income, percentage of population that is Medicaid eligible, and percentage of White
population. Equal likelihood is indicated by county average household income (β = 0, OR = 1, p
= 0.004). Patients are more likely to use the emergency room with increases in the percentage of
Medicaid eligible population (β = 0.034, OR = 1.035, p = 0.021), and percentage of White
population (β = 0.02, OR = 1.02, p = 0.019).
When enabling factors are added, the amount of variation explained is between 5.5%
(Cox & Snell R Square) and 7.3% (Nagelkerke R Square). The statistically significant variables
are the predisposing factors average household income and percentage of population that is
Medicaid eligible, and the enabling factors cost and rural /urban. Patients are more likely to use
the emergency room with increases in the percentage of Medicaid eligible individuals in the
county (β = 0.038, OR = 1.039, p = 0.019). Equal likelihood is indicated by county average
household income (β = 0, OR = 1, p = 0.011) and cost (β = 0, OR = 1, p = 0.013). Compared to
patients in counties with rural/ urban continuum code 4, emergency room use is more likely by
patients in counties with rural/ urban continuum code 5 (β = 0.61, OR = 1.841, p = 0.023).
The amount of variance explained when need-for-care factors are entered is between
10.6% (Cox & Snell R Square) and 14.1% (Nagelkerke R Square). The statistically significant
variables are the predisposing factors average household income and percentage of population
Page 100
91
Medicaid eligible, the enabling factor rural/ urban, and the need-for-care factors comorbidity
index score and treatment.
Patients are more likely to use the emergency room as there are increases in the
percentage of Medicaid eligible individuals in the county (β = 0.036, OR = 1.037, p = 0.032).
Equal likelihood is indicated by county average income (β = 0, OR = 1, p = 0.022). Compared to
patients in counties with rural/ urban continuum code 4, emergency room use is more likely by
patients in counties with rural/ urban continuum code 5 (β = 0.687, OR = 1.988, p = 0.015).
Patients with comorbidity index score 10 are more likely (β = 1.526, OR = 4.599, p = 0.025) to
use emergency room services compared to the lowest index score. Patients receiving treatment
for prostate cancer are less likely to use emergency room services than patients who are not
receiving treatment (β = -1.826, OR = 0.161, p < 0.001).
Emergency Room Group B (Urban County Residents)
Predisposing factors explain between 2.4% (Cox & Snell R Square) and 3.3%
(Nagelkerke R Square) of the variance in emergency room use for Emergency Room Group B.
This subgroup includes only patients who reside in urban counties and have patterns of greater
emergency room use. The fit of this model is not statistically significant. The statistically
significant variables are the predisposing factors age, county population with no health
insurance, percentage of population that is Black/ African American, and percentage of
population that is Hispanic/ Latino.
Prostate cancer patients in urban counties are more likely to use emergency room services
as age increases (β = 0.035, OR = 1.036, p < 0.001). The likelihood of emergency room use by
patients is greater with increases in percentage of county population that is Black/ African
Page 101
92
American (β = 0.015, OR = 1.015, p < 0.001) and Hispanic/ Latino (β = 0.012, OR = 1.012, p =
0.003). Emergency room use is less likely as the percentage of county population with no health
insurance increases (β = -0.037, OR = 0.963, p = 0.001).
When enabling factors are added, the amount of variance explained is between 3.1%
(Cox & Snell R Square) and 4.2% (Nagelkerke R Square). The statistically significant variables
are the predisposing factors age and poverty, and the enabling factors cost, rural/ urban and
geographic region. Patients are more likely to use the emergency room with increases in age (β
= 0.035, OR = 1.036, p < 0.001), and the percentage of individuals living below poverty level (β
= 0.043, OR = 1.044, p = 0.021). Equal likelihood is indicated by cost (β = 0, OR = 1, p =
0.041). Compared to patients in counties with rural/ urban continuum code 1, emergency room
use is less likely by patients in counties with rural/ urban continuum code 3 (β = -0.302, OR =
.739, p = 0.019). Patients living in the South (β = -0.432, OR = 0.655, p = 0.006) or West (β = -
0.54, OR = 0.583, p < 0.001) regions of the U.S. are less likely to use the emergency room than
in the Northeast.
The amount of variance explained when need-for-care factors are entered is between
13.5% (Cox & Snell R Square) and 18.3% (Nagelkerke R Square). The statistically significant
variables are the predisposing factors age and percentage of county below poverty level, the
enabling factors rural/ urban and geographic region, and the need-for-care factors comorbidity
index score, treatment, and intensive care unit.
Patients are more likely to use the emergency room as there are increases in age (β =
0.031, OR = 1.032, p < 0.001) and the percentage of individuals living below poverty level in the
county (β = 0.058, OR = 1.060, p = 0.003). Compared to patients in counties with rural/ urban
continuum code 1, considered to be the most urban, emergency room use is less likely by
Page 102
93
patients in counties with rural/ urban continuum code 3 (β = -0.309, OR = .734, p = 0.024).
Patients living in the South (β = -0.45, OR = 0.637, p = 0.006) or West (β = -0.428, OR = 0.652,
p = 0.002) are less likely to use emergency room services than patients in the Northeast.
Patients with more comorbid illnesses are more likely to use emergency room services,
with increased likelihood for nearly all comorbidity index scores from score 3 (β = 0.48, OR =
1.616, p < 0.001) to score 12 (β = 1.407, OR = 4.083, p = 0.018) when compared to the lowest
index score. Patients receiving care in the intensive care unit are more likely to use emergency
room services than patients not receiving this type of care (β = 0.47, OR = 1.60, p < 0.001).
Patients who are receiving treatment for prostate cancer are less likely to use emergency room
services than patients who are not receiving treatment (β = -2.282, OR = 0.102, p < 0.001).
Table 6. Goodness of fit tests and variance in emergency room utilization by prostate
cancer patients explained by predisposing, enabling and need-for-care factors
Model Goodness of Fit Tests Pseudo R2 Statistics
Omnibus Tests
of Model
Coefficients
Hosmer &
Lemeshow Test
Cox &
Snell R
Square
Nagelkerke
R Square
Chi-
square Sig.
Chi-
square Sig.
All Patients
Predisposing Factors 145.423 0.000 9.704 0.286 0.025 0.034
Predisposing and Enabling Factors 215.802 0.000 14.958 0.060 0.037 0.05
Predisposing, Enabling, and Need Factors 804.648 0.000 7.794 0.454 0.131 0.176
Group A. Non-Urban Areas
Predisposing Factors 21.611 0.017 5.102 0.747 0.025 0.034
Predisposing and Enabling Factors 47.386 0.001 9.443 0.306 0.055 0.073
Predisposing, Enabling, and Need Factors 94.404 0.000 3.246 0.169 0.106 0.141
Group B. Urban Areas
Predisposing Factors 119.446 0.000 23.708 0.003 0.024 0.033
Predisposing and Enabling Factors 156.074 0.000 8.793 0.360 0.031 0.042
Predisposing, Enabling, and Need Factors 710.991 0.000 11.617 0.169 0.135 0.183
Page 103
94
Results of Hierarchical Multiple Regression Analysis for Hospital Length of Stay
Hierarchical multiple regression is used to evaluate the ability of predisposing factors,
enabling factors, need-for-care factors, and emergency room use to predict the length of stay for
all-cause hospitalization by prostate cancer patients. The “exclude cases pairwise” option
described in Chapter 3 is used to address missing values. For all patients and each of the
subgroups, ten predisposing factors are entered into the model at Step 1, five enabling factors are
entered at Step 2, four need-for-care factors are entered at Step 3, and emergency room use at
Step 4. Table 7 shows the amount of variance in hospital length of stay that is explained by each
group of predictors after holding all other factors constant and the total variance that is explained
at each step, and whether or not the model is a statistically significantly good fit for the data. The
independent variables that make a unique statistically significant contribution at each step for all
groups are reported in this section and identified in Table 10. Appendix D includes tables with
the coefficients for each model.
All Prostate Cancer Patients
In the group including all patients, predisposing factors alone explain 1.2% of the
variance in hospital length of stay, and the model fit is statistically significant, R2 = 0.012, F (10,
5,733) = 7.23, p < 0.001. Genetic factors and percentage of the population that is White are
statistically significant predictors, with White population having a higher standardized beta value
(β = -0.112, p < 0.001) than genetic factors (β = -0.058, p < 0.001).
Page 104
95
Table 7. Variation in hospital length of stay by prostate cancer patients explained by predisposing, enabling and need-for-care
factors, and emergency room use
R2
R2
Change
Sig. F
Change F Sig. R2
R2
Change
Sig. F
Change F Sig. R2
R2
Change
Sig. F
Change F Sig. R2
R2
Change
Sig. F
Change F Sig.
All Prostate Cancer
Patients0.012 0.012 0.000 7.23 0.000 0.027 0.014 0.000 10.48 0.000 0.061 0.034 0.000 19.43 0.000 0.061 0.001 0.047 18.67 0.000
A) High Concentration
White, Non-Urban
County Residents
0.022 0.022 0.134 1.50 0.134 0.033 0.010 0.227 1.47 0.111 0.071 0.038 0.000 2.60 0.000 0.071 0.000 0.791 2.47 0.000
B) High Concentration
White, Urban County
Residents
0.012 0.012 0.008 2.39 0.008 0.039 0.027 0.000 5.42 0.000 0.064 0.025 0.000 7.16 0.000 0.064 0.000 0.534 6.82 0.000
C) High Concentration
Hispanic County
Residents
0.020 0.020 0.650 0.62 0.650 0.029 0.008 0.316 0.70 0.626 0.108 0.079 0.045 1.53 0.146 0.122 0.014 0.184 1.56 0.126
D) Underserved Area
Residents
0.209 0.209 0.052 2.00 0.052 0.242 0.032 0.096 2.14 0.033 0.281 0.039 0.490 1.76 0.660 0.309 0.028 0.121 1.85 0.048
E) High Concentration
Black/AA, Low
Hispanic County
Residents
0.011 0.011 0.187 1.37 0.187 0.038 0.028 0.000 3.35 0.000 0.073 0.035 0.000 5.23 0.000 0.082 0.008 0.001 5.56 0.000
F) High Concentration
Black/AA and Hispanic
County Residents
0.017 0.017 0.120 1.69 0.120 0.060 0.042 0.000 5.20 0.000 0.099 0.039 0.000 5.69 0.000 0.111 0.012 0.005 5.95 0.000
G) High Concentration
Black/AA, Underserved
Area Residents
0.018 0.018 0.056 1.80 0.056 0.073 0.056 0.000 5.59 0.000 0.142 0.068 0.000 9.02 0.000 0.146 0.004 0.025 8.84 0.000
Predisposing Factors Entered Enabling Factors Entered Need Factors Entered Emergency Room Use Entered
Page 105
96
When enabling factors are entered, there is a statistically significant change in the amount
of variance explained, with enabling factors explaining an additional 1.4% of the variance, R2
change = 0.014, p < 0.001. The model with predisposing and enabling factors together is
statistically significant and explains 2.7% of the variance in hospital length of stay by all prostate
cancer patients, R2 = 0.027, F (15, 5,728) = 10.48, p < 0.001. The seven statistically significant
variables are the predisposing factors genetic factors, percentage of population with no health
insurance, and all three of the measures for county population race/ethnicity, and the enabling
factors cost and geographic region. Percentage of White population has the highest standardized
beta value (β = -0.184, p < 0.001), followed by geographic region (β = -0.132, p < 0.001), Black/
African American population (β = -0.112, p < 0.001), percentage of uninsured population (β =
0.102, p < 0.001), cost (β = 0.084, p < 0.001), Hispanic/ Latino population (β = -0.070, p =
0.017), and genetic factors (β = -0.058, p < 0.001).
When need-for-care factors are entered, an additional 3.4% of the variance is explained
after holding predisposing and enabling factors constant. The model with predisposing, enabling,
and need-for-care factors together explains 6.1% of the variance in hospital length of stay by all
prostate cancer patients. Both the change in variance explained, R2 change = 0.034, p < 0.001,
and the model fit with all three categories of predictors, R2 = 0.061, F (19, 5,724) = 19.432, p <
0.001, are statistically significant. The ten statistically significant variables are the predisposing
factors genetic factors, percentage of population with no health insurance, and all three of the
measures for county population race/ethnicity, the enabling factors cost and geographic region,
and the need-for-care factors comorbidity index score, treatment, and intensive care unit.
Percentage of White population has the highest standardized beta value (β = -0.184, p <
0.001), followed by comorbidity index score (β = 0.143, p < 0.001), geographic region (β = -
Page 106
97
0.124, p < 0.001), intensive care unit (β = 0.104, p < 0.001), Black/ African American population
(β = -0.103, p = 0.001), cost (β = 0.102, p < 0.001), population with no health insurance (β =
0.097, p < 0.001), Hispanic/ Latino population (β = -0.073, p = 0.011), genetic factors (β = -
0.051, p < 0.001), and treatment (β = -0.038, p = 0.004).
In the final step, emergency room use is added. The additional variance explained after
holding predisposing, enabling, and need-for-care factors constant is 0.1%. The final model with
all three categories of predictors and emergency room use explains 6.1% of the variance in
hospital length of stay by all prostate cancer patients. The change in variance explained, R2
change = 0.001, p = 0.047, and the final model, R2 = 0.061, F (20, 5,723) = 18.668, p < 0.001,
are statistically significant. The eleven significant variables include emergency room use, the
predisposing factors genetic factors, population with no health insurance, and all three of the
measures for county population race/ethnicity, the enabling factors of cost and geographic
region, and the need-for-care factors comorbidity index score, treatment, and intensive care unit.
Percentage of White population has the highest standardized beta value (β = -0.183, p <
0.001), followed by comorbidity index score (β = 0.146, p < 0.001), geographic region (β = -
0.126, p < 0.001), intensive care unit (β = 0.106, p < 0.001), Black/ African American population
(β = -0.103, p = 0.001), cost (β = 0.102, p < 0.001), population with no health insurance (β =
0.097, p < 0.001), Hispanic/ Latino population (β = -0.073, p = 0.011), genetic factors (β = -
0.051, p < 0.001), treatment (β = -0.045, p = 0.001), and emergency room use (β = -0.027, p =
0.047).
Page 107
98
Hospital Group A (High Concentration White, Non-Urban County Residents)
Hospital Group A includes patients residing in non-urban counties with a high percentage
of White population. The mean hospital length of stay for this subgroup (3.89 days) is lower than
the mean for all patients (4.76 days). Predisposing factors alone explain 2.2% of the variance in
hospital length of stay, and the race variable percentage of the population that is White is
statistically significant (β = 0.196, p = 0.026). The model, however, is not statistically
significant, R2 = 0.022, F (10, 655) = 1.5, p = 0.134.
The amount of additional variance explained when enabling factors are entered is 1.0%,
and access to physician services is the only statistically significant variable (β = -0.082, p =
0.05). The model with predisposing and enabling factors together explains 3.3% of the variance
in hospital length of stay by prostate cancer patients in this subgroup. Neither the change in
variation, R2 change = 0.01, p = 0.227, nor the model as a whole, R2 = 0.033, F (15, 650) = 1.47,
p = 0.111 are statistically significant.
When need-for-care factors are entered, an additional 3.8% of the variance is explained
after holding predisposing and enabling factors constant. The model with predisposing, enabling,
and need-for-care factors together explains 7.1% of the variance in hospital length of stay by
prostate cancer patients in Hospital Group A. Both the change in explained variance, R2 change =
0.038, p < 0.001, and the model with all three categories of predictors, R2 = 0.071, F (19, 646) =
2.6, p < 0.001, are statistically significant. The three statistically significant independent
variables are the enabling factor access to physician services and need-for-care factors
comorbidity index score and intensive care unit. Intensive care unit has the highest standardized
beta value (β = 0.149, p < 0.001), followed by comorbidity index score (β = 0.121, p = 0.002),
and access to physician services (β = -0.081, p = 0.049).
Page 108
99
There is no additional variance explained when emergency room use is entered into the
model. The total variance in hospital length of stay explained by the final model as a whole is
7.1%, and the model fit is statistically significant, R2 = 0.071, F (20, 645) = 2.47, p < 0.001. The
enabling factor access to physician services and the need-for-care factors comorbidity index
score and intensive care unit remained the only statistically significant variables, with intensive
care unit (β = 0.149, p < 0.001) having a higher standardized beta value than comorbidity index
score (β = 0.121, p = 0.002) and access to physician services (β = -0.081, p = 0.049).
Hospital Group B (High Concentration White, Urban County Residents)
Hospital Group B includes patients residing in urban counties with a high percentage of
White population. The mean hospital length of stay for this subgroup (4.43 days) is lower than
the mean for all patients (4.76 days). Predisposing factors alone explain 1.2% of the variance in
hospital length of stay and the model fit is statistically significant, R2 = 0.012, F (10, 2,008) =
2.39, p = 0.008. The statistically significant variables are genetic factors and percentage of the
population that is Black/ African American, with percentage Black/ African American
population having a higher standardized beta value (β = -0.074, p = 0.004) than genetic factors (β
= -0.065, p = 0.003).
When enabling factors are entered, there is a statistically significant change in the amount
of variance explained, with enabling factors explaining an additional 2.7% of the variance, R2
change = 0.027, p < 0.001. The model with predisposing and enabling factors together is
statistically significant and explains 3.9% of the variation in hospital length of stay by prostate
cancer patients in Hospital Group B, R2 = 0.039, F (15, 2,003) = 5.42, p < 0.001. The statistically
significant variables are the predisposing factor genetic factors and the enabling factor cost, with
Page 109
100
cost having a higher standardized beta value (β = -0.152, p < 0.001) than genetic factors (β = -
0.050, p = 0.015).
When need-for-care factors are entered, an additional 2.5% of the variance is explained
after holding predisposing and enabling factors constant. The model with predisposing, enabling,
and need-for-care factors together explains 6.4% of the variance in hospital length of stay by
prostate cancer patients in this subgroup. Both the change in variance explained and the model
with all three categories of predictors are statistically significant, R2 change = 0.025, p < 0.001,
and R2 = 0.064, F (19, 1,999) = 7.158, p < 0.001. The five statistically significant variables are
the predisposing factor genetic factors, the enabling factor cost, and the need-for-care factors,
comorbidity index score, treatment, and intensive care unit. Cost has the highest standardized
beta value (β = -0.126, p < 0.001), followed by comorbidity index score (β = 0.105, p < 0.001),
treatment (β = -0.093, p < 0.001), genetic factors (β = -0.056, p = 0.01), and intensive care unit
(β = 0.055, p = 0.015).
No additional variance explained by emergency room use when it is added to the model
in Step 4. The final model with all three categories of predictors and emergency room use
explains 6.4% of the variance in hospital length of stay by prostate cancer patients in Hospital
Group B, and is statistically significant, R2 = 0.064, F (20, 1,998) = 6.817, p < 0.001. The five
variables that are statistically significant when need-for-care factors are added to the model
remained the significant variables in the final model. Cost has the highest standardized beta
value (β = -0.125, p < 0.001), followed by comorbidity index score (β = 0.107, p < 0.001),
treatment (β = -0.097, p < 0.001), genetic factors (β = -0.057, p = 0.009), and intensive care unit
(β = 0.056, p = 0.013).
Page 110
101
Hospital Group C (High Concentration Hispanic County Residents)
Hospital Group C includes patients residing in counties with a high percentage of
Hispanic/ Latino population. The mean hospital length of stay for this subgroup (4.33 days) is
lower than the mean for all patients (4.76 days). Predisposing factors alone explain 2% of the
variance in hospital length of stay, but the model fit is not statistically significant, R2 = 0.02, F
(4, 119) = 0.619, p = 0.650. None of the variables are statistically significant. When enabling
factors are entered, there is not a statistically significant change in variance explained by these
factors, R2 change = 0.008, p = 0.316, the fit of the whole model with predisposing and enabling
factors, R2 = 0.029, F (5, 118) = 0.698, p = 0.626, or any of the variables.
Need-for-care factors entered at Step 3 explain an additional 7.9% of the variance in
hospital length of stay by prostate cancer patients in Hospital Group C and the total amount of
variance explained by the model with predisposing, enabling, and need-for-care factors together
is 10.8%. The change in explained variance is statistically significant, R2 change = 0.079, p =
0.045. However, the model with all three categories of predictors is not statistically significant
R2 = 0.108, F (9, 114) = 1.564, p = 0.126. The need-for-care factors comorbidity index score is
the only statistically significant variable (β = 0.185, p = 0.049).
The additional variance explained by emergency room use in Step 4 is not statistically
significant, R2 change = 0.014, p = 0.184. The final model with all three categories of predictors
and emergency room use is also not statistically significant, R2 = 0.122, F (10, 113) = 1.564, p =
0.126. Again, the only statistically significant variable is comorbidity index score (β = 0.201, p =
0.033).
Page 111
102
Hospital Group D (Underserved Area Residents)
Hospital Group D includes patients residing in counties that are all or partially designated
as an underserved area. The mean hospital length of stay for this subgroup (8.32 days) is higher
than the mean for all patients (4.76 days). Predisposing factors alone explain 20.9% of the
variance in hospital length of stay, but the model fit is not statistically significant, R2 = 0.209, F
(9, 68) = 2.001, p = 0.052. Percentage of county population age 65 and older is the only variable
that is statistically significant (β = -1.035, p = 0.008).
The additional amount of variance explained by enabling factors at Step 2 is not
statistically significant, R2 change = 0.032, p = 0.096. The full model with predisposing and
enabling factors explains 24.2% of the variance and is statistically significant, R2 = 0.242, F (10,
67) = 2.136, p = 0.033. Percentage of county population age 65 and older is still the only
statistically significant variable (β = -1.075, p = 0.006).
When need-for-care factors are entered into the model, neither the amount of additional
variance explained nor the total variance explained by the model with predisposing, enabling,
and need-for-care factors together are statistically significant, R2 change = 0.039, p = 0.49 and R2
= 0.281, F (14, 63) = 1.76, p = 0.066. Again, the only statistically significant variable is
percentage of county population age 65 and older (β = -1.181, p = 0.011).
In the final model for Hospital Group D, the additional variance in hospital length of stay
explained by emergency room use after holding all other factors constant is not statistically
significant, R2 change = 0.028, p = 0.121). The whole model with all three categories of
predictors and emergency room use is statistically significant, R2 = 0.309, F (15, 62) = 1.846, p =
0.048 and explains 30.9% of the variance in hospital length of stay by prostate cancer patients.
The statistically significant variables are the predisposing factor percentage of county population
Page 112
103
age 65 and older and the enabling factor cost, with percentage of county population age 65 and
older (β = -1.181, p = 0.005) having a higher beta value than cost (β = -0.264, p = 0.032).
Hospital Group E (High Concentration Black/ AA, Low Hispanic County Residents)
Hospital Group E includes patients residing in counties with a high percentage of
Black/African American population and low Hispanic/ Latino population. The mean hospital
length of stay for this subgroup (4.75 days) is only slightly less than the mean for all patients
(4.76 days). Predisposing factors explain 1.1% of the variance in hospital length of stay, but the
model fit is not statistically significant, R2 = 0.011, F (10, 1,263) = 1.373, p = 0.187. The
statistically significant variables are the three race/ethnicity factors, percentage of the population
that is Black/ African American (β = 0.299, p = 0.048), Hispanic/ Latino (β = 0.136, p = 0.029),
and White (β = 0.294, p = 0.04).
When enabling factors are entered, there is a statistically significant change in the amount
of variance explained, with enabling factors explaining an additional 2.8% of the variance, R2
change = 0.028, p < 0.001. The model with predisposing and enabling factors together is
statistically significant and explains 3.9% of the variance in hospital length of stay by prostate
cancer patients in this subgroup, R2 = 0.038, F (15, 1,258) = 3.35, p < 0.001. The only
statistically significant variable is the enabling factor cost (β = -0.165, p < 0.001).
Need-for-care factors are entered at Step 3, explaining an additional 3.5% of the variance
after holding predisposing and enabling factors constant. The model with predisposing, enabling,
and need-for-care factors together explains 7.3% of the variance in hospital length of stay by
prostate cancer patients in Hospital Group E. The change in variance, R2 change = 0.035, p <
0.001, and the model with all three categories of predictors, R2 = 0.073, F (19, 1,254) = 5.227, p
Page 113
104
< 0.001, are statistically significant. The three statistically significant variables are the enabling
factor cost, and the need-for-care factors of comorbidity index score, and intensive care unit,
with cost having the highest standardized beta value (β = 0.176, p < 0.001), followed by
comorbidity index score (β = 0.139, p < 0.001), and intensive care unit (β = 0.110, p < 0.001).
The additional variance explained by emergency room use is 0.8%, and the amount of
variance explained by the whole model is 8.2%. Both the change in explained variance and the
final model fit are statistically significant, R2 change = 0.008, p < 0.001 and R2 = 0.082, F (20,
1,253) = 5.564, p < 0.001. The five statistically significant variables are the emergency room use,
the enabling factor cost, and the need-for-care factors comorbidity index score, treatment, and
intensive care unit. Cost has the highest standardized beta value (β = 0.173, p < 0.001), followed
by comorbidity index score (β = 0.147, p < 0.001), intensive care unit (β = 0.115, p < 0.001),
emergency room use (β = -0.096, p = 0.001), and treatment (β = -0.064, p = 0.025).
Hospital Group F (High Concentration Black/AA and Hispanic County Residents)
Hospital Group F includes patients in counties with a high percentage of Black/ African
American and Hispanic/ Latino population. The mean hospital length of stay for this subgroup
(5.32 days) is higher than the mean for all patients (4.76 days). Predisposing factors alone
explain 1.7% of the variance in hospital length of stay, but the model fit is not statistically
significant, R2 = 0.017, F (6, 575) = 1.69, p =0.12. The only statistically significant variable is
genetic factors (β = -0.099, p = 0.017).
Enabling factors are entered at Step 2, explaining an additional 4.2% of the variance after
holding predisposing factors constant. The total amount of variance explained by the model with
both categories of predictors is 6%. The change in variance, R2 change = 0.042, p < 0.001, and
Page 114
105
the whole model, R2 = 0.060, F (7, 574) = 5.20, p < 0.001, are statistically significant. The
statistically significant variables are the predisposing factor genetic factors and the enabling
factor cost, with cost (β = 0.206, p < 0.001) having a higher standardized beta value than genetic
factors (β = -0.103, p = 0.012).
Need-for-care factors explain an additional 3.9% of the variance in hospital length of stay
by prostate cancer patients in this subgroup. The total variance explained by the model as a
whole with all three categories of predictors is 9.9%. The change in variance, R2 change = 0.039,
p < 0.001, and the model, R2 = 0.099, F (11, 570) = 5.694, p < 0.001, are both statistically
significant. The four statistically significant variables are the predisposing factor genetic factors,
the enabling factor cost, and the need-for-care factors comorbidity index score and intensive care
unit. Cost has the highest standardized beta value (β = 0.216, p < 0.001), followed by
comorbidity index score (β = 0.178, p < 0.001), intensive care unit (β = 0.081, p = 0.048), and
genetic factors (β = -0.079, p = 0.05).
In the final step, emergency room use is entered, explaining an additional 1.2% of the
variance after holding predisposing, enabling, and need-for-care factors constant. The final
model as a whole explains a total of 11.1% of the variance in hospital length of stay by prostate
cancer patients in Hospital Group F. Both the change in explained variance and the final model
are statistically significant, R2 change = 0.012, p = 0.005 and R2 = 0.111, F (12, 569) = 5.946, p <
0.001. The four statistically significant variables are emergency room use, the enabling factor
cost, and the need-for-care factors comorbidity index score and intensive care unit. Cost has the
highest standardized beta value (β = 0.215, p < 0.001), followed by comorbidity index score (β =
0.192, p < 0.001), emergency room use (β = -0.119, p = 0.005) and intensive care unit (β = 0.09,
p = 0.027).
Page 115
106
Hospital Group G (High Concentration Black/AA, Underserved Area Residents)
Hospital Group G includes patients residing in counties with a high percentage of Black/
African American population and partial designation as an underserved area. The mean hospital
length of stay for this subgroup (5.45 days) is higher than the mean for all patients (4.76 days).
Predisposing factors explain 1.8% of the variance in hospital length of stay, but the model is not
statistically significant, R2 = 0.018, F (10, 990) = 1.373, p = 0.056. The only statistically
significant variable is percentage of population uninsured (β = 0.152, p = 0.008).
Enabling factors are entered at Step 2. There is a statistically significant change in the
amount of variance explained, with enabling factors explaining an additional 5.6% of the
variance, R2 change = 0.056, p < 0.001. The model with predisposing and enabling factors
together is statistically significant and explains 7.3% of the variance in hospital length of stay by
prostate cancer patients in Hospital Group G, R2 = 0.073, F (14, 986) = 5.59, p < 0.001. There are
five statistically significant variables, which include the predisposing factors percentage of
population with no health insurance, percentage population Black/ African America, and
population Hispanic/Latino, and the enabling factors cost and geographic region. Percentage of
county population that is uninsured has the highest standardized beta value (β = 0.205, p =
0.002), followed by cost (β = 0.203, p < 0.001), Hispanic/ Latino population (β = 0.-184, p =
0.019), Black/ African American population (β = 0.-183, p = 0.028), and geographic region (β =
0.-174, p < 0.001).
After holding predisposing and enabling factors constant, the need-for-care factors
entered at Step 3 explain an additional 6.8% of the variance, R2 change = 0.068, p < 0.001. The
total variance explained by all three categories of predictors is 14.2%, R2 = 0.142, F (18, 982) =
9.010, p < 0.001. The seven independent variables that are statistically significant are the
Page 116
107
predisposing factors age, percentage of population uninsured and Hispanic/ Latino population,
the enabling factors cost and geographic region, and the need-for-care factors comorbidity and
intensive care unit. Cost has the highest standardized beta value (β = 0.226, p < 0.001), followed
by comorbidity index score (β = 0.191, p < 0.001), percentage of population uninsured (β =
0.189, p = 0.003), intensive care unit (β = 0.172, p < 0.001), percentage of Hispanic/ Latino
population (β = -0.172, p = 0.024), geographic region (β = -0.153, p = 0.001), and age (β = 0.06,
p = 0.044).
The additional variance explained by emergency room use is 0.4% and the change is
statistically significant, R2 change = 0.004, p = 0.025. The final model is statistically significant
and the total amount of variation explained for hospital length of stay by prostate cancer patients
in this subgroup is 14.6%, R2 = 0.146, F (19, 981) = 8.843, p < 0.001. The seven statistically
significant variables are emergency room use, the predisposing factors percentage of population
uninsured and Hispanic/ Latino population, the enabling factors cost and geographic region, and
the need-for-care factors comorbidity and intensive care unit. Cost has the highest standardized
beta value (β = 0.228, p < 0.001), followed by percentage of population uninsured (β = 0.185, p
= 0.003), comorbidity index score (β = 0.182, p < 0.001), percentage of Hispanic/ Latino
population (β = -0.173, p = 0.022), intensive care unit (β = 0.165, p < 0.001), geographic region
(β = -0.145, p = 0.001), and emergency room use (β = 0.071, p = 0.025).
Subset Analysis Results of Hierarchical Logistic Regression Analysis for Emergency Room Use
Hierarchical binary logistic regression is performed in a subset of the data for which
hospital characteristics were available to assess the impact of factors on the likelihood of prostate
cancer patients utilizing emergency room services. This analysis is conducted for all patients,
Page 117
108
and the subgroups identified through AID analysis: Group A, patients under age 75 (n = 206),
Group B, patients age 75 to 85 (n = 237), and Group C, patients over age 85 (n = 112). The
model contains seven predisposing factors, nine enabling factors, and four need-for-care factors,
which is a total of twenty independent variables. The independent variables that made a unique
statistically significant contribution at each step for all groups are reported in this section and
identified in Table 10. Appendix E includes tables with the coefficients for each model.
For each of the subgroups, goodness of fit was not statistically significant based on
values of the Omnibus Test of Model Coefficients until need-for-care factors were entered in the
final step. Goodness of fit test values and pseudo R square statistics for the groups in the subset
analysis are reported in this section and shown in Table 8.
All Prostate Cancer Patients
Predisposing factors explain between 4.8% (Cox & Snell R Square) and 6.4%
(Nagelkerke R Square) of the variance in emergency room use for all prostate cancer patients.
For this model, goodness of fit is statistically significant based on Omnibus Test of Model
Coefficients and Hosmer and Lemeshow Test. The statistically significant variables are the
predisposing factors age and percentage of county population over age 65. Prostate cancer
patients are more likely to use emergency room services as their age increases (β = 0.047, OR =
1.048, p < 0.001). Emergency room use is less likely as there are increases in county percentage
of individuals over age 65 (β = -0.144, OR = 0.866, p = 0.045).
When enabling factors are added, the amount of variance explained is between 7.7%
(Cox & Snell R Square) and 10.3% (Nagelkerke R Square). For this model, goodness of fit is
statistically significant based on Omnibus Test of Model Coefficients and Hosmer and
Page 118
109
Lemeshow Test. The statistically significant variables are the predisposing factor age and the
enabling factor hospital ownership. Patients are more likely to use the emergency room as age
increases (β = 0.049, OR = 1.05, p < 0.001). Compared to patients staying in government-owned
hospitals, patients staying in hospitals that are not for profit/ not government-owned are less
likely to use emergency room services (β = -0.505, OR = 0.603, p = 0.048).
The amount of variance explained when need-for-care factors are entered is between
21.6% (Cox & Snell R Square) and 29.0% (Nagelkerke R Square). The model fit is statistically
significant based on Omnibus Test of Model Coefficients and Hosmer and Lemeshow Test. The
four statistically significant variables are the predisposing factor age, the enabling factor hospital
ownership, and the need-for-care factors comorbidity index score and treatment.
Patients are more likely to use the emergency room as age increases (β = 0.048, OR =
1.050, p < 0.001). Compared to patients staying in government-owned hospitals, patients staying
in hospitals that are not for profit/ not government-owned are less likely to use emergency room
services (β = -0.702, OR = 0.495, p = 0.014). The likelihood of emergency room use is greater
by patients with the highest comorbidity index score compared to those with the lowest score (β
= 1.067, OR = 2.906, p = 0.033). Compared to patients who are no receiving treatment for
prostate cancer, patients who are receiving treatment are less likely to use emergency room
services (β = -3.132, OR = 0.044 p < 0.001).
Page 119
110
Table 8. Goodness of fit tests and variation in emergency room utilization by prostate
cancer patients explained by predisposing, enabling and need-for-care factors in subset
analysis
Model Goodness of Fit Tests Pseudo R2 Statistics
Omnibus Tests of
Model
Coefficients
Hosmer &
Lemeshow
Test
Cox & Snell
R Square
Nagelkerke
R Square
Chi-
square Sig.
Chi-
square Sig.
All Prostate Cancer Patients
Predisposing Factors 27.393 0.000 7.246 0.510 0.048 0.064
Predisposing and Enabling Factors 44.365 0.019 10.31 0.244 0.077 0.103
Predisposing, Enabling, and Need Factors 135.316 0.000 9.089 0.335 0.216 0.29
Group A. Patients Age <75
Predisposing Factors 5.689 0.577 8.435 0.392 0.027 0.036
Predisposing and Enabling Factors 20.418 0.771 6.652 0.575 0.094 0.126
Predisposing, Enabling, and Need Factors 59.798 0.008 3.828 0.872 0.252 0.337
Group B. Patients Age 75 to 85
Predisposing Factors 9.521 0.217 4.159 0.843 0.039 0.053
Predisposing and Enabling Factors 26.883 0.415 7.944 0.439 0.107 0.144
Predisposing, Enabling, and Need Factors 85.232 0.000 9.013 0.341 0.302 0.405
Group C. Patients Age >85
Predisposing Factors 8.854 0.263 7.413 0.493 0.076 0.109
Predisposing and Enabling Factors 37.253 0.055 4.463 0.813 0.283 0.406
Predisposing, Enabling, and Need Factors 52.167 0.031 5.296 0.726 0.372 0.534
Emergency Room Subset Group A (Patients Under Age 75)
Predisposing factors explain between 2.7% (Cox & Snell R Square) and 3.6%
(Nagelkerke R Square) of the variance in emergency room use for Emergency Room Subset
Group A, patients under the age of 75 with similar patterns of less emergency room use. For this
model, goodness of fit is not statistically significant based on values of the Omnibus Test of
Model Coefficients. None of the variables are statistically significant.
Page 120
111
When enabling factors are added, the amount of variance explained is between 9.4%
(Cox & Snell R Square) and 12.6% (Nagelkerke R Square). For this model, goodness of fit is not
statistically significant based on values of the Omnibus Test of Model Coefficients. None of the
variables are statistically significant.
The amount of variance explained when need-for-care factors are entered is between
25.2% (Cox & Snell R Square) and 33.7% (Nagelkerke R Square). For this model, goodness of
fit is statistically significant based on Omnibus Test of Model Coefficients and Hosmer and
Lemeshow Test. The need-for-care factor treatment is the only statistically significant variable,
indicating that in this subgroup of patients under age 75, patients receiving treatment for prostate
cancer are less likely to use emergency room services than patients who are not receiving
treatment (β = -3.199, OR = 0.041, p < 0.001).
Emergency Room Subset Group B (Patients Age 75 to 85)
Predisposing factors explain between 3.9% (Cox & Snell R Square) and 5.3%
(Nagelkerke R Square) of the variance in emergency room use for Emergency Room Subset
Group B, which includes only patients age 75 to 85 who have similar patterns of greater
emergency room use. For this model, goodness of fit is not statistically significant based on
values of the Omnibus Test of Model Coefficients. Age is the only statistically significant
variable, with prostate cancer patients being more likely to use emergency room services as their
age increases (β = 0.098, OR = 1.103, p = 0.046).
When enabling factors are added, the amount of variance explained is between 10.7%
(Cox & Snell R Square) and 14.4% (Nagelkerke R Square). For this model, goodness of fit is not
statistically significant based on values of the Omnibus Test of Model Coefficients. The
Page 121
112
predisposing factor age is the only statistically significant variable, with prostate cancer patients
being more likely to use emergency room services as age increases (β = 0.109, OR = 1.115, p =
0.041).
The amount of variance explained when need-for-care factors are entered is between
30.2% (Cox & Snell R Square) and 40.5% (Nagelkerke R Square). The model fit is statistically
significant based on Omnibus Test of Model Coefficients and Hosmer and Lemeshow Test. The
enabling factor hospital ownership is the only statistically significant variable. In this subgroup
of prostate cancer patients between the age of 75 and 85, those staying in hospitals that are not
for profit/ not government owned are less likely to use emergency room services than patients
staying in government-owned hospitals (β = -1.042, OR = 0.353, p = 0.042).
Emergency Room Subset Group C (Patients Over Age 85)
Predisposing factors explain between 7.6% (Cox & Snell R Square) and 10.9%
(Nagelkerke R Square) of the variance in emergency room use for Emergency Room Subset
Group C, which includes only patients over the age of 85 who have similar patterns of greater
emergency room use. The model fit is not statistically significant based on values of the
Omnibus Test of Model Coefficients. None of the variables are statistically significant.
When enabling factors are added, the amount of variance explained is between 28.3%
(Cox & Snell R Square) and 40.6% (Nagelkerke R Square). For this model, goodness of fit is not
statistically significant based on values of the Omnibus Test of Model Coefficients. The enabling
factors cost and hospital ownership are statistically significant. Patients are less likely to use the
emergency room with increases in cost (β = -0.002, OR = 0.998, p = 0.021). Compared to
patients staying in government-owned hospitals, patients staying in hospitals that are not for
Page 122
113
profit/ not government owned are less likely to use emergency room services (β = -1.742, OR =
0.175, p = 0.036).
The amount of variance explained when need-for-care factors are entered is between
37.2% (Cox & Snell R Square) and 53.4% (Nagelkerke R Square). The model fit is statistically
significant based on Omnibus Test of Model Coefficients and Hosmer and Lemeshow Test. The
enabling factor hospital ownership and the need-for-care factor treatment are statistically
significant, indicating that in this subgroup of patients over age 85, patients receiving treatment
for prostate cancer are less likely (β = -3.298, OR = 0.037, p = 0.028) to use emergency room
services than patients who are not receiving treatment. Compared to patients staying in
government-owned hospitals, patients staying in hospitals that are not for profit/ not government
owned are less likely to use emergency room services (β = -2.157, OR = 0.116, p = 0.038).
Subset Analysis Results of Hierarchical Multiple Regression Analysis for Hospital Length of Stay
Hierarchical multiple regression is used to evaluate the ability of predisposing factors,
enabling factors, need-for-care factors, and emergency room use to predict hospital length of stay
by prostate cancer patients in a subset of the data for which hospital characteristics were
available. There are no missing values in the data subset (n = 555). The same procedure used in
the full dataset is conducted in the subset analysis. For all patients and the subgroups, Hospital
Subset Group A (patients in counties with Hispanic/ Latino population <32%, n = 205) and
Hospital Subset Group B (patients in counties with Hispanic/ Latino population > 32%, n = 350),
seven predisposing factors are entered at Step 1, nine enabling factors entered at Step 2, four
need-for-care factors at Step 3, and emergency room use at Step 4. The independent variables
that made a unique statistically significant contribution at each step for all groups are reported in
Page 123
114
this section and identified in Table 10. Appendix F includes tables with the coefficients for each
model. The amount of variance in hospital length of stay explained by each group of predictors
after holding all other factors constant and total variance explained at each step, and statistical
significance of variance change and model fit are reported in this section and shown in Table 9.
Table 9. Variation in hospital length of stay by prostate cancer patients explained by
predisposing, enabling and need-for-care factors, and emergency room use in subset
analysis
All Prostate Cancer Patients
In the group including all patients, predisposing factors alone explain 3.1% of the
variance in hospital length of stay, and the model fit is statistically significant, R2 = 0.031, F (7,
547) = 2.501, p = 0.016. Genetic factors and percentage of the population that is Hispanic/
Latino are the only two statistically significant predisposing factors, with percentage Hispanic/
R2
R2
Change
Sig. F
Change F Sig. R2
R2
Change
Sig. F
Change F Sig. R2
R2
Change
Sig. F
Change F Sig.
Predisposing
Factors
Entered 0.031 0.031 0.016 2.50 0.016 0.033 0.033 0.462 0.96 0.462 0.014 0.014 0.680 0.69 0.680
Enabling
Factors
Entered 0.063 0.032 0.035 2.25 0.004 0.182 0.149 0.000 2.61 0.001 0.036 0.022 0.456 0.86 0.615
Need Factors
Entered 0.087 0.024 0.007 2.55 0.000 0.235 0.054 0.014 2.83 0.000 0.055 0.018 0.181 1.01 0.448
Emergency
Room Use
Entered 0.100 0.013 0.005 2.83 0.000 0.242 0.007 0.201 2.79 0.000 0.072 0.017 0.015 1.27 0.194
All Prostate Cancer Patients
A) Low Concentration Hispanic
County Residents
B) Hight Concentration
Hispanic County Residents
Page 124
115
Latino population having a higher standardized beta value (β = -0.191, p = 0.006) than genetic
factors (β = -0.087, p = 0.039).
When enabling factors are entered, an additional 3.2% of the variance is explained and
the change is statistically significant, R2 change = 0.032, p = 0.035. The model with predisposing
and enabling factors together is statistically significant and explains 6.3% of the variance in
hospital length of stay by all prostate cancer patients, R2 = 0.063, F (16, 538) = 2.25, p = 0.004.
The four statistically significant variables are the predisposing factor genetic factors, and the
enabling factors underserved area, hospital size, and hospital cancer program. Hospital size has
the highest standardized beta value (β = 0.192, p = 0.004), followed by underserved area (β = -
0.154, p = 0.034), hospital cancer program (β = -0.134, p = 0.026), and genetic factors (β = -
0.092, p = 0.029).
When need-for-care factors are entered, an additional 2.4% of the variance is explained
after holding predisposing and enabling factors constant. The model with predisposing, enabling,
and need-for-care factors together explains 8.7% of the variance in hospital length of stay by all
prostate cancer patients. Both the change in explained variance, R2 change = 0.024, p = 0.007,
and the fit of the model with all three categories of predictors, R2 = 0.087, F (20, 534) = 2.545, p
< 0.001, are statistically significant. The six statistically significant variables are the predisposing
factor genetic factors, the enabling factors access to physician services, hospital size and hospital
cancer program, and the need-for-care factors comorbidity index score and treatment. Access to
physician services has the highest standardized beta value (β = -0.185, p = 0.047), followed by
hospital size (β = 0.182, p = 0.006), hospital cancer program (β = -0.139, p = 0.029), treatment (β
= -0.107, p = 0.003), comorbidity index score (β = 0.093, p = 0.031) and genetic factors (β = -
0.088, p = 0.035).
Page 125
116
In the final step, emergency room use is entered into the model. The additional variance
explained after holding predisposing, enabling, and need-for-care factors constant is 1.3%. The
final model with all three categories of predictors and emergency room use explains 10.0% of the
variance in hospital length of stay by all prostate cancer patients. The change in variance
explained, R2 change = 0.013, p = 0.005, and the final model, R2 = 0.10, F (21, 533) = 2.829, p <
0.001, are statistically significant. The seven statistically significant variables include emergency
room use, the predisposing factor genetic factors, the enabling factors access to physician
services, hospital size, and hospital cancer program, and the need-for-care factors comorbidity
index score and treatment. Access to physician services has the highest standardized beta value
(β = -0.194, p = 0.037), followed by hospital size (β = 0.190, p = 0.004), treatment (β = -0.149, p
= 0.001), hospital cancer program (β = -0.141, p = 0.026), emergency room use (β = -0.128, p =
0.005), comorbidity index score (β = 0.107, p = 0.014) and genetic factors (β = -0.092, p =
0.028).
Hospital Subset Group A (Low Concentration Hispanic County Residents)
Hospital Subset Group A includes patients residing in counties with a lower percentage
of Hispanic/ Latino population. The mean hospital length of stay for this subgroup (3.85 days) is
lower than the mean for all patients (4.79 days). Predisposing factors alone explain 3.3% of the
variance in hospital length of stay. The model, however, is not statistically significant, R2 =
0.033, F (7, 197) = 0.96, p = 0.462. None of the variables are statistically significant.
The amount of additional variance explained when enabling factors are entered is 14.9%,
and the model with predisposing and enabling factors explains 18.2% of the variance in hospital
length of stay by prostate cancer patients in this subgroup. Both the change in explained
Page 126
117
variance, R2 change = 0.149, p < 0.001, and the model as a whole, R2 = 0.182, F (16, 188) = 2.61,
p = 0.001, are statistically significant. The six statistically significant variables are the
predisposing factors percentage of population below poverty level and Black/ African American
population, and the enabling factors access to physician services, underserved area, geographic
region, and hospital size. Underserved area has the highest standardized beta value (β = -0.553, p
= 0.001), followed by geographic region (β = 0.445, p = 0.002), access to physician services (β =
-0.415, p = 0.003), Black/ African American population (β = 0.398, p = 0.016), hospital size (β =
0.333, p = 0.007) and percentage of population poverty (β = -0.275, p = 0.037).
When need-for-care factors are entered, an additional 5.4% of the variance is explained
after holding predisposing and enabling factors constant. The model with predisposing, enabling,
and need-for-care factors explains 23.5% of the variance in hospital length of stay by prostate
cancer patients in this subgroup. Both the change in variance explained, R2 change = 0.054, p =
0.014, and the model with all three categories of predictors, R2 = 0.235, F (20, 184) = 2.832, p <
0.001, are statistically significant. The seven statistically significant variables are the
predisposing factor Black/ African American population, the enabling factors access to
physicians, rural/ urban, underserved area, geographic region, and hospital size, and the need-
for-care factor treatment. Underserved area has the highest standardized beta value (β = -0.531, p
= 0.002), followed by geographic region (β = 0.48, p = 0.001), access to physician services (β = -
0.429, p = 0.002), Black/ African American population (β = 0.418, p = 0.01), hospital size (β =
0.374, p = 0.002), rural/ urban (β = -0.279, p = 0.031), and treatment (β = -0.222, p = 0.002).
The additional variance explained when emergency room use is entered into the model is
0.7%. The change is not statistically significant. The total variance in hospital length of stay
explained by the final model as a whole is 24.2% and the model fit is statistically significant, R2
Page 127
118
= 0.242, F (21, 183) = 2.786, p < 0.001. The seven statistically significant variables are the
predisposing factor Black/African American population, the enabling factors access to physician
services, rural/ urban, underserved area, geographic region, and hospital size, and the need-for-
care factor treatment. Underserved area has the highest standardized beta value (β = -0.521, p =
0.002), followed by geographic region (β = 0.492, p = 0.001), access to physician services (β = -
0.432, p = 0.001), Black/ African American population (β = 0.427, p = 0.009), hospital size (β =
0.379, p = 0.002), rural/ urban (β = -0.295, p = 0.023), and treatment (β = -0.259, p = 0.001).
Hospital Subset Group B (High Concentration Hispanic County Residents)
Hospital Subset Group B includes patients residing in counties with a higher Hispanic/
Latino population. The mean hospital length of stay for this subgroup (5.34 days) is higher than
the mean for all patients (4.79 days). Predisposing factors alone explain 1.4% of the variance in
hospital length of stay. The model is not statistically significant. None of the variables are
statistically significant.
When enabling factors are entered into the model, the amount of additional variance
explained is 2.2%, and the full model with predisposing and enabling factors together explains
3.6% of the variance in hospital length of stay by prostate cancer patients in this subgroup.
Neither the change in variance, nor the model as a whole are statistically significant. The
enabling factor hospital cancer program is the only statistically significant variable (β = -0.163, p
= 0.036).
The amount of additional variance explained when need-for-care factors are entered into
the model is 1.8%. The change is not statistically significant, R2 change = 0.018, p = 0.181. The
model with predisposing, enabling, and need-for-care factors together explains 5.5% of the
Page 128
119
variance. The model is not statistically significant, R2 = 0.055, F (19, 330) = 1.011, p = 0.448.
None of the independent variables are statistically significant.
The additional variance explained when emergency room use is entered into the model
after holding predisposing, enabling and need-for-care factors constant is 1.7%, and the change is
statistically significant, R2 change = 0.017, p = 0.015. The total variance in hospital length of
stay explained by the final model as a whole is 7.2%. The model is not statistically significant,
R2 = 0.072, F (20, 329) = 1.274, p = 0.194. The only statistically significant variable is
emergency room use (β = -0.144, p = 0.015).
Table 10 provides a summary of the variables that are statistically significant in the
hierarchical regression models including predisposing factors, predisposing and enabling factors,
and predisposing, enabling and need-for-care factors. Emergency room use was added in the
final models for analysis of hospital length of stay. Each of the groups used for regression
analysis are listed across the top row of Table 10. An ‘X’ in the corresponding row for each
predictor indicates that the variable was statistically significant.
Page 129
120
Table 10. Statistically significant predictors from regression analysis of emergency room utilization and hospital length of stay
by prostate cancer patients
Emergency Room
Use Hospital Length of Stay
Emergency Room
Subset Analysis
Hospital Subset
Analysis
Group* All A B All A B C D E F G All A B C All A B
Model 1. Predisposing Factors Age X X X X
Genetic Factors X X X X
Average Household Income X X
Medicaid Eligible X
Population Age 65+ X X X
Poverty
Uninsured Population X X X
Race/Ethnicity - % Black/AA X X X X
Race/Ethnicity - % Hispanic X X X X
Race/Ethnicity - % White X X X X X
Model 2. Predisposing & Enabling Factors Age X X X X
Genetic Factors X X X X
Average Household Income X
Medicaid Eligible X
Population Age 65+ X
Poverty X X X
Uninsured Population X X
Race/Ethnicity - % Black/AA X X X
Race/Ethnicity - % Hispanic X X
Race/Ethnicity - % White X
Cost X X X X X X X X X
Access to Physicians X X
Rural/ Urban X X X
Underserved Area X X
Geographic Region X X X X X
Hospital Size X X
Hospital Ownership X X
Hospital Cancer Program X X
Hospital Resident Training
Page 130
121
Emergency Room
Use Hospital Length of Stay
Emergency Room
Subset Analysis
Hospital Subset
Analysis
All A B All A B C ϯ D E F G All A B C All A B
Model 3. Predisposing, Enabling and Need Factors Age X X X X
Genetic Factors X X X X
Average Household Income X
Medicaid Eligible X
Population Age 65+ X
Poverty X X
Uninsured Population X X
Race/Ethnicity - % Black/AA X X
Race/Ethnicity - % Hispanic X X
Race/Ethnicity - % White X
Cost X X X X X
Access to Physicians X X X
Rural/ Urban X X X X
Underserved Area X
Geographic Region X X X X X
Hospital Size X X
Hospital Ownership X X X
Hospital Cancer Program X
Hospital Resident Training
Comorbidity Index Score X X X X X X X X X X X X
Complications
Treatment X X X X X X X X X X
Intensive Care Unit X X X X X X X X
Model 4. Predisposing, Enabling and Need Factors, and Emergency Room Use Age
Genetic Factors X X X
Average Household Income
Medicaid Eligible
Population Age 65+ X
Poverty
Uninsured Population X X
Race/Ethnicity - % Black/AA X X
Race/Ethnicity - % Hispanic X X
Race/Ethnicity - % White X
Page 131
122
Emergency Room
Use Hospital Length of Stay
Emergency Room
Subset Analysis
Hospital Subset
Analysis
All A B All A B C ϯ D E F G All A B C All A B ϯ
Cost X X X X X X
Access to Physicians X X X
Rural/ Urban X
Underserved Area X
Geographic Region X X X
Hospital Size X X
Hospital Ownership
Hospital Cancer Program X
Hospital Resident Training
Comorbidity Index Score X X X X X X X X
Complications
Treatment X X X X X
Intensive Care Unit X X X X X X
Emergency Room Use X X X X X X
*Refer to analysis results sections for group labels ϯ Final model fit is not statistically significant
Page 132
123
Results of Hypothesis Testing and the Overall Model Validation
Results of the statistical analyses are used to test the five hypotheses developed for this
study. Each hypothesis is either rejected (i.e., fail to reject the null hypothesis) or supported (i.e.,
reject the null hypothesis and fail to reject the corresponding alternative) for each group in both
the full dataset and data subset.
H1: Need-for-care factors are more influential predictors of emergency room use among prostate
cancer patients than predisposing factors and enabling factors.
The need-for-care factor comorbidity index score has the highest odds ratio in analysis of
the group of all prostate cancer patients, both of the subgroups, Emergency Room Group A
(Non-Urban County Residents) and Emergency Room Group B (Urban County Residents), and
the group of all prostate cancer patients in the data subset. The logistic regression results indicate
that patients with higher comorbidity index scores are more likely to use the emergency room
that patients with the lowest score. In the group of all patients and Emergency Room Group B
(Urban County Residents), the need-for-care factor intensive care unit has the second highest
odds ratio.
The need-for-care factor treatment is the only statistically significant variable in the
analysis of Emergency Room Subset Group A (Patients Under Age 75). This variable is also
among the statistically significant predictors in all emergency room use analysis groups except
for Emergency Room Subset Group B (Patients Age 75 to 85). In all groups, the results indicate
that the likelihood of emergency room use decreases by patients who are receiving treatment for
Page 133
124
prostate cancer. The need-for-care factor measuring patient complications is not statistically
significant is any of the patient groups analyzed.
Therefore, for all groups in the full dataset, and the group of all patients and Emergency
Room Subset Group A (Patients Under Age 75) in the data subset, the findings support to reject
the null hypothesis and fail to reject the alternative hypothesis that need-for-care for care factors
are more influential predictors of emergency room use by prostate cancer patients than
predisposing and enabling factors. For Emergency Room Subset Group B (Patients Age 75 to
85) and Emergency Room Subset Group C (Patients Over Age 85), the findings support to fail to
reject the null hypothesis.
H2: Need-for-care factors are more influential predictors of hospital length of stay among
prostate cancer patients than predisposing factors and enabling factors.
The need-for-care factor intensive care unit has the highest standardized beta value of all
the statistically significant predictors in the hospital length of stay analysis of patients in Hospital
Group A (High Concentration White, Non-Urban County Residents). This variable, as well as
the need-for-are factor treatment, are statistically significant predictors in approximately half of
the groups for which regression analysis has been conducted to study hospital length of stay, but
only has the highest standardized beta value in Hospital Group A. The results indicate that
having received care in the intensive care unit is associated with increased hospital length of
stay, while having received treatment for prostate cancer is associated with decreased hospital
length of stay.
Comorbidity index score is a statistically significant predictor of hospital length of stay in
more than 85% of the groups included in this analysis. This variable is the only statistically
Page 134
125
significant predictor in Hospital Group C (High Concentration Hispanic County Residents);
however, the overall model fit is not statistically significant. The results indicate that increased
comorbidity index score is associated with increased hospital length of stay. The need-for-care
factor measuring patient complications is not statistically significant is any of the patient groups
analyzed.
Based on these results, for Hospital Group A (High Concentration White, Non-Urban
County Residents), the findings support rejecting the null hypothesis and failing to reject the
alternative hypothesis that need-for-care factors are more influential predictors of hospital length
of stay by prostate cancer patients than predisposing and enabling factors, and failing to reject
the null hypothesis for all other groups analyzed.
H3: Emergency room use is an influential predictor of hospital length of stay among prostate
cancer patients.
Emergency room use is a statistically significant predictor in the analysis of all patients in
both the full dataset and the data subset, as well as Hospital Group E (High Concentration Black/
AA, Low Hispanic County Residents), Hospital Group F (High Concentration Black/AA and
Hispanic County Residents), and Hospital Group G (High Concentration Black/ AA,
Underserved Area Residents). Emergency room use is the only statistically significant predictor
in the analysis of Hospital Subset Group B (High Concentration Hispanic County Residents);
however, the overall model fit is not statistically significant. In analysis for Hospital Group G
(High Concentration Black/ AA, Underserved Area Residents), the use of emergency room
services is associated with increased hospital length of stay; for all other groups, emergency
room use is associated with decreased length of stay.
Page 135
126
Based on the results showing that emergency room use is a statistically significant
predictor, for all patients in both the full dataset and the data subset, and the subgroups Hospital
Group E (High Concentration Black/ AA, Low Hispanic County Residents), Hospital Group F
(High Concentration Black/AA and Hispanic County Residents), and Hospital Group G (High
Concentration Black/ AA, Underserved Area Residents), the findings support rejecting the null
hypothesis and failing to reject the alternative hypothesis that emergency room use is an
influential predictor of hospital length of stay among prostate cancer patients, and fail to reject
the null hypothesis for all other groups.
H4: High users of health services are associated with certain predisposing factors, enabling
factors, need-for-care factors, and the interaction effects of particular variables.
Patterns of higher utilization of health services by prostate cancer patients are associated
with the interaction effects of several county characteristics, including race/ ethnicity,
underserved area, and rural/ urban. AID analysis results show that, compared to mean length of
stay for the group of all patients, the mean hospital length of stay is higher among patients in
Hospital Group F (High Concentration Black/ AA and Hispanic County Residents) and Hospital
Group G (High Concentration Black/ AA, Underserved Area Residents). The interaction
between all or part of the county being designated as a health professional shortage area,
characterized as urban, and lower percentages of all three race/ ethnicity measures in this study is
also shown to be associated with a higher mean hospital length of stay by patients (Hospital
Group D).
In evaluation of emergency room use by prostate cancer patients, AID analysis results
show patterns of higher use to be associated with patients residing in urban counties in the full
Page 136
127
dataset (Emergency Room Group B: Non-Urban Residents), and with patient age in the data
subset (Emergency Room Subset Group B: Patients Age 75 to 85 and Emergency Room Subset
Group C: Patients Over Age 85). Patterns of longer hospital length of stay are associated with a
higher Hispanic/ Latino population in counties in the data subset (Hospital Subset Group B). The
results of AID analysis do not indicate any interaction effects between predictors in emergency
room use in the both the full dataset and subset, or hospital length of stay in the data subset.
Based on these results, the findings support rejecting the null hypothesis for Hospital
Group D (Underserved Area Residents), Hospital Group F (High Concentration Black/AA and
Hispanic County Residents), Hospital Group G (High Concentration Black/AA, Underserved
Area Residents), and Emergency Room Group B (Urban County Residents), Emergency Room
Subset Group B (Patients Age 75 to 85), Emergency Room Subset Group C (Patients Over Age
85), and Hospital Subset Group B (High Concentration Hispanic County Residents).
H5: Hospital attributes are influential predictors of health services utilization by prostate cancer
patients.
Hospital ownership is a statistically significant predictor in analysis of emergency room
use in the subset analysis of the group of all patients, and the two subgroups identified as having
similar patterns of higher emergency room use, Emergency Room Subset Group B (Patients Age
75 to 85), and Emergency Room Subset Group C (Patients Over Age 85). For Emergency Room
Subset Group C, hospital ownership has the highest odds ratio, and it is the only statistically
significant predictor in the final model for Emergency Room Subset Group B. The regression
analysis results indicate that, compared to patients receiving care at a government-owned
hospital, patients receiving care at a hospital that is non-profit/ non-government-owned are less
Page 137
128
likely to use emergency room services. Hospital ownership is also a statistically significant
predictor of emergency room use for Emergency Room Subset Group A (Patients Under Age 75)
in the model containing only predisposing and enabling factors; however, this model is not
statistically significant and treatment is the only statistically significant predictor in the final
model when need-for-care factors are added to the model.
Hospital size is a statistically significant predictor in analysis of hospital length of stay in
analysis of the group of all patients, as well as the subgroup identified as having patterns of
shorter hospital length of stay, Hospital Subset Group A (Low Concentration Hispanic County
Residents). In the group of all patients, the standardized beta value for hospital size is only
slightly less than access to physician services, which has the highest value. For both of these
groups, the association shows hospital length of stay increasing as hospital size increases.
Hospital cancer program approved by the ACoS is a statistically significant predictor of
hospital length of stay in the group of all patients, with increasing hospital length of stay in
facilities that do not have an ACoS approved cancer program. This variable is also a statistically
significant predictor of hospital length of stay in the model containing only predisposing and
enabling factors for Hospital Subset Group B (High Concentration Hispanic County Residents);
however, this model fit is not statistically significant, and this predictor is no longer statistically
significant when need-for-care factors are entered into the model. Hospital resident training
program is the only one of the four hospital variables that is not shown to be a statistically
significant predictor for any of the groups included in this analysis.
Therefore, for all patients and Emergency Room Subset Group B (Patients Age 75 to 85)
in the analysis of emergency room use, and all patients and Hospital Subset Group A (Low
Concentration Hispanic County Residents) in the analysis of hospital length of stay, the findings
Page 138
129
support rejecting the null hypothesis and failing to reject the alternative hypothesis that hospital
attributes are influential predictors of health services utilization by prostate cancer patients, and
failing to reject the null hypothesis for Emergency Room Subset Group A (Patients Under Age
75) and Hospital Subset Group B (High Concentration Hispanic County Residents).
Page 139
130
CHAPTER FIVE: DISCUSSION AND CONCLUSIONS
Introduction to Discussion
The purpose of this study was to examine the determinants of health services utilization
by prostate cancer patients using administrative claims data for inpatient care. Based on the
information available in the Part A Medicare data file, it was possible to study the variability in
use of two types of service: emergency room and hospital (measured by length of stay).
Outpatient care records and longitudinal data were not available for this analysis, therefore the
study did not assess quality differences and the causal relationships among predictors. The
theoretical framework used to guide this analysis was Andersen’s behavioral model of health
services utilization. This framework provided for an integrated approach to exploring the
research problem through the inclusion of personal and social characteristics categorized as
predisposing, enabling and need-for-care factors. The relative influence of predictors and
interaction effects associated with differential use patterns were obtained through statistical
analysis. This section includes a summary of hypothesis testing, and discussion of results,
contributions and limitations of this research. Recommendations for future research are also
provided at the end of this chapter.
Page 140
131
Summary of Major Findings: Hypothesis Testing and Model Validation
The results of hypothesis testing are summarized in Table 11. Two types of health
services were examined: emergency room use and hospital (use measured by length of stay).
Through AID analysis, two subgroups were identified for the study of emergency room use, and
seven subgroups were identified for the study of hospital length of stay. A subset of the data was
used to examine the influence of hospital attributes. In the subset analysis, there were three
subgroups for emergency room use and two subgroups for hospital length of stay. Regression
analysis was performed using the full dataset and subset for all patients as well as each of the
subgroups. These groups are listed across the top row of Table 11, and an ‘X’ in the
corresponding row for each hypothesis indicates that the hypothesis was supported by results of
statistical analysis for the group.
The overall modified model Andersen’s behavioral model of health services utilization
that was used for this study confirmed that an integrated approach including personal and social
factors is useful for analyzing the determinants of health services use by prostate cancer patients
enrolled in the Medicare program. The relative importance of these factors varied to some degree
based on the characteristics of patient subgroups. While both personal and social factors were
statistically significant predictors for most groups, for several groups, the final model included
only either characteristics of the individual or social aspects. In addition to understanding the
unique contribution of each independent variable in predicting service use, categorizing the
predictors as predisposing, enabling, and need-for-care factors provided a framework that made
it possible to evaluate how each group of variables influences the variability in emergency room
use and length of stay for all-cause hospitalizations by patients with prostate cancer.
Page 141
132
Table 11. Results of hypothesis testing for utilization of health services by prostate cancer patients
Emergency Room Hospital Length of Stay
Emergency Room
Subset
Hospital Length
of Stay Subset
Group* All A B All A B C D E F G All A B C All A B
H1: Need-for-care factors are
more influential predictors of
emergency room use among
prostate cancer patients than
predisposing factors and
enabling factors.
X X X X X
H2: Need-for-care factors are
more influential predictors of
hospital length of stay among
prostate cancer patients than
predisposing factors and
enabling factors.
X
H3: Emergency room use is
an influential predictor of
hospital length of stay among
prostate cancer patients.
X X X X X
H4: High users of health
services are associated with
certain predisposing factors,
enabling factors, need-for-care
factors, and the interaction
effects of particular variables.
X X X X X X X
H5: Hospital attributes are
influential predictors on health
services utilization by prostate
cancer patients.
X X X X X
*Refer to text in results of analysis and hypothesis testing for group labels
Page 142
133
Implications
Predisposing Factors
Predisposing factors include and demographics and social structure characteristics. Many
studies have identified patient age to be an influential determinant of health services utilization
by cancer patients (Hagiwara, et al., 2013; Shayne, et al., 2013; Treanor & Donnelly, 2012;
Yong, et al., 2014). In this analysis, the predisposing factor of age was statistically significant in
more groups than any of the other predisposing factors for analysis of emergency room use. Age
was also statistically significant in the model including all three categories of predictors for
analysis of hospital length of stay in Hospital Group G, which included patients with similar
patterns of longer hospital stays who reside in counties that are considered to be underserved
areas and have a high Black/ African American population. The predisposing factor percentage
of county population aged 65 and older was the most influential predictor in one of the
hospitalization analysis subgroups, with decreased aging population being associated with
increased length of stay. This subgroup was identified by the interaction between all three
measures of race/ ethnicity and underserved area, and patients in this group were shown to have
similar patterns of longer hospital length of stay.
Age and an aging population are considered to be particularly important aspects for
cancer-related issues. With increased age comes a greater risk of developing cancer. The health
care system will face additional challenges to provide the screenings and care required to meet
the needs of these patients, while also managing a population that is aging with more chronic
conditions than in the past. Growing demand for resources and the lack of a sufficient supply of
Page 143
134
medical professionals, particularly in low income areas, could add to the problem of cancer-
related health disparities (Rapkin in Elk & Landrin, 2009, pp. 498-499). For prostate cancer
patients included in this study, the age of individuals and the population were found to be
influential.
Enabling Factors
Enabling factors represent the availability of resources or conditions which make the use
of health services possible. In this analysis, enabling factors were influential predictors for many
groups. Access to physicians, measured by the ratio of physicians to population, underserved
area, and geographic region were among the statistically significant variables with the highest
beta value in analysis of hospital length of stay. For analysis of both types of health services,
geographic region was statistically significant in the final model including all three categories of
predictors for more groups than any other enabling factor (along with cost). The hospital
attributes size, type of ownership, and cancer program were also highly influential. Previous
studies of prostate cancer and health service use have also identified these factors as being
influential. Geographic region has been associated with variations in the type of treatments
prostate cancer patients receive, which may reflect the uneven distribution of care providers and
specialists across the U.S. (Harlan, et al., 2001; Roberts, et al., 2011). Studies have cited hospital
attributes such as case volume and academic teaching status when reporting variations between
1.3 days and 3.8 days for the average length of hospital stay following surgical treatment for
prostate cancer using radical prostatectomy (Inman, et al., 2011; Mitchell, et al., 2009).
The enabling factor of cost had the highest standardized beta value in the final models for
hospital length of stay analysis for four subgroups, and was one of only two statistically
Page 144
135
significant predictors in another subgroup. For the subgroups identified as patients with hospitals
stays that are shorter than the average length for all patients, increased cost was associated with
increased hospital length of stay for Hospital Group E (High Concentration Black/ AA, Low
Hispanic County Residents) and decreased length of stay for Hospital Group B (High
Concentration White, Urban County Residents). For the subgroups of patients with similar
patterns of longer hospital stays increased cost was associated with increased hospital length of
stay for Hospital Group F (High Concentration Black/ AA and Hispanic County Residents) and
Hospital Group G (High Concentration Black/ AA, Underserved Area Residents), and decreased
length of stay for Hospital Group D (Underserved Area Residents). Although it is not possible to
determine causality in this analysis, it has been reported that out of pocket costs overall are
higher for Medicare patients with cancer compared to those without cancer, and that factors such
as being dually eligible for Medicaid or having a supplemental health insurance plan can greatly
reduce or eliminate the inpatient care costs for which patients are responsible to pay (American
Cancer Society Cancer Action Network, 2012; Medicare Payment Advisory Commission, 2012).
Need-for-Care Factors
Need-for-care factors represent the level of illness that causes an individual to seek care.
Many studies have identified need-for-care factors as the most influential predictors of health
services utilization, and found factors such as treatment complications, comorbidity and
conditions requiring specialized care through the intensive care unit to be particularly influential
in cancer patients (Kostakou, et al., 2014; Legler, Bradley & Carlson, 2011; Shayne, et al., 2013;
Wolinsky, et al., 2008). The results of this analysis were consistent with the literature in that
need-for-care factors were among the statistically significant predictors of health services
Page 145
136
utilization by prostate cancer patients in all but two of the groups examined. In analysis of
emergency room service use, need-for-care factors were not found to make a statistically
significant contribution in Emergency Room Subset Group B (Patients Age 75 to 85), nor were
these factors statistically significant predictors for Hospital Group D (Underserved Area
Residents) in analysis of length of stay for all-cause hospitalization. Need-for-care factors were
shown to be the most influential predictors in one-third of the groups in this analysis.
In the final model including all three categories of predictors, the need-for-care factor
comorbidity index score was a statistically significant predictor of health services use for twelve
of the eighteen groups analyzed in this study; treatment was statistically significant for ten
groups, and intensive care unit for eight groups. For emergency room service utilization,
comorbidity index score had the highest odds ratio in all three groups of the full dataset and one
of the four groups in the subset analysis. The variable treatment had the highest odds ratio for
one of the emergency room groups in the subset analysis. Intensive care unit had the highest beta
value in one of the subgroups for analysis of hospital length of stay. For all models in which
these variables were statistically significant, higher utilization by patients was associated greater
comorbidity, receiving care in the intensive care unit, and not receiving treatment for prostate
cancer.
While it was not possible to determine the causal relationships among these predictors,
these findings do demonstrate the complex disease burden of prostate cancer, and the need for
informed care practices and interventions. The importance of understanding the distinct health
needs of individuals has been emphasized in other relevant studies, such as those focused on
tailored symptom-management education programs for prostate cancer patients, and policies that
provide for consideration of disease and individual patient characteristics when determining
Page 146
137
whether or not patients should be admitted to the intensive care unit (Latini, et al. in Elk &
Landrine, 2009; Kostakou, 2014). As treatment options evolve, and new information becomes
available regarding the immediate and long term complications and conditions prostate cancer
patients may encounter, it is important for relevant practices to be reevaluated or developed in
order to meet the needs of these patients.
High Users of Health Services
Several subgroups identified through AID analysis were shown to have similar patterns
of higher utilization. Higher emergency room use was found in patients living in counties
considered to be the most urban in nature. In the data subset, patients over the age of 85 showed
patterns of higher emergency room use, as did patients between the ages of 75 and 85. Prostate
cancer patients with patterns of longer hospital length of stay were associated with the interaction
effects of several county characteristics, including race/ ethnicity, underserved area, and rural/
urban. Race/ ethnicity was the only factor found to influence homogenous use patterns in the
data subset, with a higher mean hospital length of stay in counties with more than 32% Hispanic/
Latino population. The interactions of variables in the subgroups and the predictors that were
found to be most influential in each of these groups through regression analysis provide a more
in-depth indication personal and social factors associated with the utilization of health services
by prostate cancer patients.
Emergency Room Use
Higher use of health services in urban areas as compared to rural areas where there may
be fewer resources available has been identified in the literature (Sundmacher & Busse, 2011;
Blumenthal & Kagen, 2002). The literature has also identified comorbidity as an influential
Page 147
138
predictor of emergency room use by cancer patients (Legler, Bradley & Carlson, 2011). In this
study, higher of emergency room use patterns were identified in patients living in the most urban
counties compared to counties classified as less-urban or rural. The most influential predictor of
emergency room utilization for patients in urban counties, as well as those in rural counties and
the group of all patients, was comorbidity index score.
As mentioned previously, increasing age has been found to be an important predictor of
health services use by cancer patients in numerous studies have (Hagiwara, et al., 2013; Shayne,
et al., 2013; Treanor & Donnelly, 2012; Yong, et al., 2014). In this the data subset of this
analysis, patterns of increased emergency room were found in patients aged 75 to 85 and the
group of patients over age 85. The amount of variance explained in the final logistic regression
models for each of these two groups was among the highest out of all groups for both emergency
room use and hospital length of stay analysis. The final logistic regression model explained
between 30.2% and 40.5% of the variance in emergency room use for the group of patients aged
75 to 85 and between 37.2% and 53.4% of the variance for patients over the age of 85. In both of
these groups, the interaction effect of age and hospital attributes is shown, as hospital ownership
had the highest odds ratio, with patients receiving care at a non-profit hospital being less likely to
use the emergency room than patients receiving care at a government-owned hospital.
Hospital Length of Stay
In addition to meeting specific physician to population ratio criteria, a geographic area
must be able to demonstrate that medical professionals are inaccessible to the population,
excessively distant, or over utilized in order to be designated as an underserved area (HRSA,
2015). Patients living in poor inner-city communities, patients may lack access to medical care
Page 148
139
due to unequal distribution of services (Blumenthal & Kagen, 2002). In this study, patterns of
longer length of stay for all-cause hospitalizations were identified in urban counties that have
been wholly or partially designated as underserved areas. Analysis of this group of patients
showed that increased hospital length of stay was associated with decreases in population over
the age of 65 and costs.
Several of the other patient groups with relatively homogeneous patterns of longer
hospital length of stay were identified by the county characteristics of underserved area and
racial/ ethnic minority population. Population characteristics such as socioeconomic status, race,
ethnicity, and geographic area often they overlap, which can make it difficult to determine
specific disease-related factors and develop effective interventions to address disparities
(Brawley in Elk and Landrin, 2011, pp. xxvi-xxix). Analysis of the group of patients with
patterns of longer hospital stays in counties with Black/ African American population over 9%
and at least one area that has been designated as an underserved area showed that influential
predictors associated with hospital length of stay were cost, comorbidity, intensive care unit care,
percentage of uninsured population, age, Hispanic/ Latino population, and geographic area.
Additional contextual factors were not among the statistically significant variables
associated with length of hospitalization by patients with similar patterns of longer hospital
length of stay in counties with Black/ African American population over 9% and Hispanic/
Latino populations over 32%, and that may be considered underserved areas. Analysis of this
subgroup of high-service-users showed increased hospital length of stay to be associated with
increases in cost, level of comorbidity, intensive care unit care, and decreases in emergency
room use.
Page 149
140
Contributions
This research made several notable contributions. First, the theoretical framework used in
this analysis provided for a detailed understanding of the influence and interaction effects of
personal and social factors associated with the use of health services by prostate cancer patients.
In previous research, need-for-care factors were often shown to be more influential predictors
than predisposing and enabling factors (de Boer, Wijker & de Haes, 1997; Wolinsky, et al.,
2008). The results of this analysis were generally consistent with the literature in finding that
need-for-care factors were consistently influential predictors of use for most groups of patients.
However, for certain groups of patients, social factors were shown to be the strongest predictors.
Thus, the integrated approach of the behavioral model of health services utilization to examine
predisposing, enabling, and need-for-care factors allowed for a more precise understanding
through the inclusion of both individual and societal determinants.
Additionally, the use of a large national administrative claims dataset with patient
information, and a national dataset capturing contextual factors with the statistical techniques
employed in this analysis made it possible to identify patterns of health services use by
individuals and groups. Previous studies have highlighted the importance of considering the
contextual environment and potential limitations of data sources that do not capture area-level
characteristics (Litaker & Love, 2005; Miller, et al., 2008; Mayer, et al., 2011). In this analysis, a
higher level of detail was able to be obtained using a large number of patient records to examine
influential predictors and the interaction effects of predictors. Subgroups with both higher and
lower propensity for using services add to the current level of understanding and could be
applied to efforts aimed at addressing disparities in prostate cancer care and outcomes. While
Page 150
141
there was still a fair amount of unexplained variance in the final models in this study, particularly
in the analysis of hospital length of stay, using the behavioral model of health services utilization
and two-stage analytic approach was beneficial for understanding use patterns of health services
by Medicare enrollees with prostate cancer.
Furthermore, the literature provides that understanding the specific factors associated
with the use of health services by patients enables the development of appropriate interventions
to improve care, eliminate unplanned or unnecessary service use, and reduce costs (Bryant, et al.,
2015; de Boer, Wijket, & de Haes, 1997; Lang, et al., 2009; Manzano, et al., 2014). In this
analysis, there were statistically significant associations between service utilization and
individual factors, such as comorbidity, need for intensive care and age, and social factors, such
as underserved area designation and high percentages of minority population. These findings
offer an indication of prostate cancer patient populations that may be at higher risk for
emergency room visits and/or longer hospital length of stay. This information can be applied to
future research efforts to help policy makers and cancer care providers in work to address the
needs of patients and communities, and to ensure that the health care delivery system is equipped
to effectively and efficiently meet these needs.
Study Limitations
There are several potential limitations in this analysis. First, although Medicare claims
data provided the opportunity to study a relatively large number of patient records in a broad
population, the possibility exists that records include inaccurate or incomplete information due to
Page 151
142
the coding process of diagnoses and procedures. A number of previous studies using similar data
have also cited this potential limitation (Jayadevappa, et al., 2011; Lang, et al., 2009; Yong, et
al., 2014). Errors may occur throughout the process of assigning ICD codes, such as
miscommunication between patients and clinicians, miscommunication between clinicians and
coders, the experience of coders, and quality-control efforts of facilities (O’Mally, et al., 2005).
In this analysis, potential problems in the coding process could limit the complete accuracy of
information captured for the variables based on ICD-9-CM codes from individual patient records
in the MEDPAR data.
A second potential limitation is that this analysis only included Medicare Part A records,
thus not making it possible to also take into account care patients received in an outpatient
setting. Many of the types of complications that prostate cancer patients may experience, such as
urinary and bowel issues, are conditions that would not necessarily require inpatient care. If
patients reported these complications during outpatient checkups or visits included in the
bundled payment to surgeons for post-surgery routine care, this information would likely not be
included in the MEDPAR records. Radiation therapy for prostate cancer is also often provided in
an outpatient setting. While this information was present for some patients in the MEDPAR file,
it is likely to have been unavailable for all patients who were actually receiving this type of
treatment. Outpatient records also could have provided an indication of continuity of care.
Cancer patients may be at greater risk for unplanned inpatient service use if follow-up care and
illness management are not sufficient, and gaps exist in the coordination of care by primary care
physicians, oncologists and other care providers (Manzano, et al., 2014). The availability of data
to include outpatient records could improve the accuracy of complication and treatment
measures, and allow for a more complete understanding of the care patients received.
Page 152
143
Third, the lack of available data pertaining to important information such as stage of
cancer, cause of death, utilization from previous years or different settings, race/ ethnicity and
other demographic characteristics, cancer specialty, and continuity of care limited the ability to
thoroughly examine certain patient and provider characteristics and identify patient response
trajectories over time. Including this type of information would provide the opportunity to obtain
a greater level of understanding of factors influencing differential use and care patterns of
prostate cancer patients, as well as potential causes for observed variations in service use and
care quality. This limitation could be addressed in future analyses through the availability of data
for multiple years, as longitudinal data would make it possible to assess the care patients
received over time and their responses to care. Additional data sources, such as the remaining
SEER-Medicare data files that can be linked, could also help to address this limitation. The
PEDSF includes information about providers and cancer-specific details from SEER registries,
and Medicare Part B claims files capture physician visits and outpatient care.
Finally, because longitudinal data was not available for this analysis, it was not possible
to test the model fit for Andersen’s initial behavioral model of health services utilization.
Andersen’s model, shown previously in Figure 1, assumes a sequential relationship among the
three categories of predictors, with service use dependent upon predisposing factors first,
followed by enabling factors, and then need-for-care factors. According to Andersen and
Newman (1973), “the expectations about causal relationships among the predictors can have
major implications for attempts at social change” (p. 120). The modified model of Andersen’s
model developed for this study, shown previously in Figure 2, is not a causal model; it instead
assumes that all three categories of predictors are directly related to the utilization of health
services by patients with prostate cancer, which allowed for its use with the cross-sectional data
Page 153
144
that was available. Structural equation modeling is an analytic technique that can be used to
“validate the plausibility of a theoretically assumed structure of a set of the study variables,” and
can be beneficial for research efforts to evaluate factors influencing the use of health services, as
well as for determining the “causal processes” of variables (Wan, 2002, p. 85). The use of
structural equation modeling to analyze longitudinal data would have allowed for examination of
the causal relationships among predisposing, enabling, and need-for-care factors according to the
initial Andersen model.
Future Research
Although there were limitations in this study, the results suggest several ways in findings
can be applied to benefit future research. The relative importance of predisposing, enabling, and
need-for-care factors associated with the utilization of health services by Medicare beneficiaries
with prostate cancer provided a better understanding of variance in use patterns by patients and
subgroups of patients. This information can be useful for further examinations of the significant
determinants and causal relationships among predictors, with the ultimate goal of developing
strategies and practices aimed at reducing health disparities in care and outcome to improve the
lives of older men faced with disease.
First, additional research is needed to better understand the reasons for emergency room
visits and the specific factors associated with emergency room admissions resulting in
hospitalization by Medicare beneficiaries with prostate cancer. In this analysis, the association
between comorbidity and emergency room use was consistent across all groups in the full
Page 154
145
dataset, and the group of all patients in the data subset. However, when emergency room use was
added in the final models for hospital length of stay analysis, it was not a statistically significant
predictor for all patient groups; when it was statistically significant, the relationship was
negative, indicating that emergency room visit were associated with shorter hospital length of
stay. Results of this analysis also showed that, despite higher emergency room use patterns in
urban areas, comorbidity was a significant predictor of use for patients in rural areas, too. This
could indicate that patients in rural areas are in need of emergency room services, but lack of
access to these facilities.
Emergency room visits by cancer patients have been attributed to numerous factors,
including patients with comorbid illnesses having difficulty managing a symptom crisis,
problems not being addressed during routine care, hospital discharge before patients have been
adequately educated or evaluated, and advanced-stage cancer (Hagiwara, et al., 2013; Inman, et
al., 2011; Legler, Bradley & Carlson, 2011; Mayer, et al., 2011). Given what is known about the
potential reasons that cancer patients visit the emergency room, it is possible that additional
education on how to manage symptoms and prevent worsening conditions, and improvements in
the overall quality of care patients receive are needed. A thorough understanding of the structural
and process elements of care in relation to patient outcomes could be achieved through future
research efforts that include data from the PEDSF and Medicare Part B files, as these sources
would provide information concerning prostate cancer stage, disease management, follow-up
care practices, and outpatient care patterns.
Second, along with the inclusion of additional data sources, the analysis of longitudinal
data would provide the opportunity to delineate the causal relationship among the factors
influencing the use of services. In this analysis, variations in the utilization of health services
Page 155
146
were associated with individual and contextual characteristics. Results showed that receiving
cancer treatment was associated with lower likelihood of using the emergency room and shorter
length of stay for all-cause hospitalizations. Despite the possible limitations with this variable
capturing all treatments to manage prostate cancer in this study, the observed relationship
between treatment and service use is relevant given the numerous opinions and recommendations
regarding when and which prostate cancer patients should receive treatment. It may be that the
patients receiving treatment in this dataset used fewer health services because they were in more
frequent contact with medical professionals through outpatient care, and, in-turn, received more
advice for managing symptoms and/or acute illnesses. Alternatively, patients receiving treatment
could have been sicker, and used fewer of the health services examined in this analysis due to
admission to nursing homes or hospice, or death. The analysis of longitudinal data may have
resulted in determining how patient care before and after prostate cancer treatment influences the
utilization of health services.
Results of this analysis also showed that groups of patients with longer hospital length of
stay were identified in counties that are underserved and/or have high racial/ethnic minority
populations in this study. According to Brawley (2012), finding interventions to effectively
tackle disparities requires adequate categorization of populations, identifying and measuring
disparate outcomes, and defining what the causes of disparities are. Socioeconomic status, race,
ethnicity, and area of geographic origin are often to categorize populations, and often they
overlap, adding to the difficulty of identifying particular causes associated with disease (Brawley
in Elk and Landrin, 2012, pp. xxvi-xxix). While the population characteristics of groups of high
users of services found in this analysis could be used to inform future research by providing an
indication of county attributes upon which to focus efforts, the use of longitudinal data could
Page 156
147
have made it possible to observe the ways in which differential use patterns were influenced by
temporal changes in social and contextual factors. Additional research using longitudinal data
would make it possible to better understand the causal relationships between the use of health
services and aspects of patient health, care patterns, and societal factors.
Third, future research to better understand the influence of Part A Medicare cost sharing
on the use of health services by prostate cancer patients would be beneficial given that cost can
be a considerable concern for Medicare patients with cancer. In 2011, the out of pocket
expenditures for Medicare beneficiaries was estimated to be approximately 14% of total
expenses; for prostate cancer patients, out of pocket expenses were approximately 18% of total
expenses, which was the second highest for all cancers after breast cancer (American Cancer
Society Cancer Action Network, 2012, pg. 15). The Medicare Payment Advisory Commission
has reported on the complexity of using of cost sharing as a tool to reduce unnecessary use of
services, and potential financial consequences for patients who need greater care and do not have
supplemental coverage (2012).
In this analysis, cost, which included the amounts patients were liable for paying based
on deductible or coinsurance, was statistically significant in the final models for five of the eight
subgroups in analysis of hospital length of stay. However, for three groups, increased cost was
associated with increased hospital length of stay, and for two of these groups, increased cost was
associated with decreased hospital length of stay. The amounts for which patients were liable
could have been related to a number of factors, such as being dually eligible for Medicaid,
whether or not they had a supplemental coverage plan, or previous payment towards the required
deductible from prior hospitalization(s) during the Medicare benefit period. The use of data from
additional sources and multiple years in future research would provide the opportunity to better
Page 157
148
understand the costs for which Medicare beneficiaries with prostate cancer were responsible and
its relationship to the utilization of health services.
Conclusions
The reduction of disparities in health and healthcare for cancer patients has been, and
remains, a major priority by many in the U.S. public health arena. In a health policy brief
published by Health Affairs/Robert Wood Johnson Foundation, improvement of the overall
health of the population, and improving the overall quality of healthcare and reaching
underserved populations were cited as two main focus areas of efforts aimed at reducing health
disparities. It states that continued progress in the reduction of disparities necessitates
comprehensive quality of care improvements in the U.S. health care system, increased focus on
eliminating social factors that can cause poor health, such as poverty, education, and
neighborhood characteristics, vigilance in ensuring the viability of safety-net facilities, and
additional research, particularly that which will increase the understanding of variations in health
outcomes even when care differences are improved (Health Affairs/Robert Wood Johnson
Foundation, 2011, pp. 5-6).
Disparities in healthcare are the product of the intricate reciprocal influences of numerous
factors and events encountered during the entire healthcare experience, such as those stemming
from differences in patients, healthcare providers’ actions and decisions, or the design of the
healthcare system (Greenberg, Weeks, & Stain, 2008, p. 523). Additional research to examine
the causal relationships between genetic, environmental, social, and behavioral factors, and
Page 158
149
cancer care and survival will continue to enhance the understanding of how to reduce disparities
based on the individual/genetic and social/system factors that are most influential for distinct
patient groups. Understanding the sources of variation leading to inequalities in the utilization of
services can be used to inform such research.
Findings from this study showed that the interactions of personal, social, and health
system factors are important to consider when assessing the variability in health service use by
prostate cancer patients. Thus, there are no simple answers to explain why differences in the use
of health services exist. A “one size fits all” approach to ensure that the utilization of health
services for patients with prostate cancer is equitable and appropriate may not be the most
efficient or effective approach, as subgroups within the population of patients may have distinct
needs. The complex interplay of attributes highlights the importance for there to be some degree
of versatility in the development and implementation of policies and interventions aimed at
improving care and outcomes for patients with prostate cancer.
The dominance of need-for-care factors as influential predictors in this analysis indicates
that the use of emergency room and hospital services by prostate cancer patients was strongly
associated with the level of illness. While increased disease burden was predictive of service use
for most patients, many of the factors related to the accessibility of services, categorized as
enabling factors, were also highly influential for the various patient subgroups. Access to care is
often identified as a one of the most influential predictors of disparities. There are a number of
spatial and/or non-spatial factors that can affect the ability of individuals and populations to
obtain the amount and quality of care needed. Given that these factors contributing to inequities
in access can lead to variations in care and treatment patterns, and then differential outcomes for
Page 159
150
patients, continued efforts to remedy access to care challenges can improve the health and
healthcare for individuals and/or patient populations in need of quality health services.
In conclusion, the behavioral model of health services utilization was a useful framework
for this research. Examining the importance of categories of predictors and relative influence of
both personal and social factors made it possible to identify various factors associated with
emergency room use and hospital length of stay by prostate cancer patients enrolled in Medicare.
The identification of subgroups with homogeneous use patterns provided a greater level of
specification to understanding factors that are more or less influential based on certain social or
demographic aspects. The importance of need-for-care factors in this analysis suggests that for
most patients with prostate cancer, illness level is highly influential in the use health services.
However, enabling factors such as geographic area and access to physician services are also
important determinants of use for some patient groups. Future research is needed to enhance the
understanding of factors contributing to patients’ illness level, and address the specific needs of
patients to work towards eliminating disparities in care and outcomes for prostate cancer
patients.
Page 160
151
APPENDIX A: ICD-9-CM CODES USED FOR VARIABLES
Page 161
152
ICD-9-CM Codes Used for Variables
Variable ICD-9-CM Code
Genetic
Factors
V10.0-V10.9 Personal history of malignant neoplasm
V12.0-V13.9 Personal history of other diseases
V15.0-V15.9 Other personal history presenting hazards to health
V16.0-16.9 Family history of malignant neoplasm
V17.0-V18.8 Family history of certain other conditions
Complications
288.0 Neutropenia
457.1 Lymphedema
556.2 Proctitis - ulcerative (chronic) proctitis
558.1; 558.9 Gastroenteritis & colitis due to radiation, other & unspecified
569.2-569.3 Stricture of anus, hemorrhage of rectum & anus
569.42-569.49 Anal or rectal pain, Proctitis NOS
593.3-593.4 Stricture or kinking of ureter, other ureteric obstruction
595.0-595.9 Cystitis
598.0-598.9 Urethral stricture
599.8-599.9 Other disorders of urethra & urinary tract other specified & unspecified
601.0-602.9 Inflammatory diseases of prostate & other disorders of prostate
606.8-606.9 Infertility due to extratesticular causes, drug therapy, radiation, systemic
disease & unspecified
607.84 Disorders of penis - impotence
608.8-608.9 Other disorders of male genital organs
788.30-788.39 Urinary incontinence
790.93 Nonspecific findings on examination of blood - elevated PSA
867.0-867.7 Injury to pelvic organs
909.2-909.5 Late effects of radiation, surgical & medical care complications, adverse effect
of drug, medicinal & biological substance
990.0 Effects of radiation, complication of radiation therapy
995.2 Unspecified adverse effect of drug, medicinal & biological substance
997.4-997.5 Complications digestive system & urinary
998.5 Postoperative infection
V58.0-V58.1 Encounter for procedures & aftercare - radiotherapy, chemotherapy
V58.8-V58.89 Encounter for procedures & aftercare - other
60.81-60.82 Incision or excision of periprostatic tissue
60.93-60.95 Other operations on prostate: repair of, control postoperative hemorrhage of,
transurethral balloon dilation of
Treatment
92.2-92.29 Therapeutic radiology & nuclear medicine
92.3-92.39 Stereotactic radiosurgery
60.0-60.69 Operations on prostate & seminal vesicles
Page 162
153
APPENDIX B: TABLES OF CORRELATIONS
Page 163
154
Table of correlations of variables used in analysis of health services utilization by prostate cancer patients
Hosp
LOS ER Age
Female
HH
Genetic
Factors Income
Medi-
caid
Pop
65+
Black/
AA
Hisp-
anic White Poverty
Un-
insured Cost Access
Rur/
Urb
Under-
served Region
Comor-
bidity
Comp-
lication ICU
Treat-
ment
Hosp
LOS 1 0.021 0.009 0.058 -0.059 0.013 0.006 -0.035 0.051 0.022 -0.082 0.002 0.032 0.083 -0.001 -0.042 0.023 -0.033 0.136 -0.005 0.109 -0.064
ER 0.021 1 0.107 0.058 -0.025 0.054 -0.023 -0.063 0.051 0.004 -0.037 -0.021 -0.031 -0.04 0.034 -0.111 0.017 -0.084 0.117 -0.034 0.108 -0.287
Age 0.009 0.107 1 -0.043 0.014 0.029 -0.003 0.017 -0.05 0.012 0.009 -0.028 -0.031 0.004 0.011 -0.002 -0.004 0.017 -0.058 -0.055 -0.013 -0.096
Female
HH 0.058 0.058 -0.043 1 -0.035 -0.469 0.534 -0.338 0.831 0.103 -0.649 0.639 0.443 0.008 -0.091 -0.238 -0.033 -0.076 0.006 -0.025 0.003 -0.023
Genetic
Factors -0.059 -0.025 0.014 -0.035 1 0.014 -0.032 0.015 -0.021 -0.008 0.029 -0.03 -0.016 0.01 -0.004 0.012 -0.01 -0.003 -0.031 -0.004 -0.024 0.012
Income 0.013 0.054 0.029 -0.469 0.014 1 -0.596 -0.14 -0.309 0.08 -0.052 -0.833 -0.478 -0.013 0.53 -0.506 0.106 -0.167 -0.006 0.027 0.013 0.002
Medicaid 0.006 -0.023 -0.003 0.534 -0.032 -0.596 1 -0.237 0.175 0.523 -0.441 0.8 0.704 0.008 -0.374 0.122 -0.178 0.498 0.008 -0.03 0.016 0.021
Pop 65+ -0.035 -0.063 0.017 -0.338 0.015 -0.14 -0.237 1 -0.235 -0.405 0.549 -0.163 -0.344 0 -0.065 0.507 -0.003 -0.277 -0.034 -0.007 -0.009 -0.028
Black/
AA 0.051 0.051 -0.05 0.831 -0.021 -0.309 0.175 -0.235 1 -0.257 -0.51 0.408 0.215 0.014 -0.004 -0.182 -0.008 -0.262 -0.013 -0.026 -0.03 -0.045
Hispanic 0.022 0.004 0.012 0.103 -0.008 0.08 0.523 -0.405 -0.257 1 -0.451 0.167 0.594 -0.019 -0.107 -0.292 -0.056 0.459 0.014 0.011 0.075 0.05
White -0.082 -0.037 0.009 -0.649 0.029 -0.052 -0.441 0.549 -0.51 -0.451 1 -0.289 -0.454 -0.015 -0.127 0.463 -0.019 -0.296 -0.006 0.002 0.001 -0.011
Poverty 0.002 -0.021 -0.028 0.639 -0.03 -0.833 0.8 -0.163 0.408 0.167 -0.289 1 0.653 0.011 -0.416 0.297 -0.119 0.318 0.003 -0.032 -0.006 0.01
Un-
insured 0.032 -0.031 -0.031 0.443 -0.016 -0.478 0.704 -0.344 0.215 0.594 -0.454 0.653 1 0 -0.355 -0.005 -0.1 0.537 0 -0.003 0.051 0.018
Cost 0.083 -0.04 0.004 0.008 0.01 -0.013 0.008 0 0.014 -0.019 -0.015 0.011 0 1 0.005 -0.003 0.009 0.023 -0.112 0.008 -0.004 0.054
Access -0.001 0.034 0.011 -0.091 -0.004 0.53 -0.374 -0.065 -0.004 -0.107 -0.127 -0.416 -0.355 0.005 1 -0.351 0.049 -0.117 -0.007 0.013 -0.039 0.01
Rur/ Urb -0.042 -0.111 -0.002 -0.238 0.012 -0.506 0.122 0.507 -0.182 -0.292 0.463 0.297 -0.005 -0.003 -0.351 1 -0.075 0.049 -0.011 -0.021 -0.044 -0.014
Under-
served 0.023 0.017 -0.004 -0.033 -0.01 0.106 -0.178 -0.003 -0.008 -0.056 -0.019 -0.119 -0.1 0.009 0.049 -0.075 1 -0.053 0.005 0.002 0 0.009
Region -0.033 -0.084 0.017 -0.076 -0.003 -0.167 0.498 -0.277 -0.262 0.459 -0.296 0.318 0.537 0.023 -0.117 0.049 -0.053 1 0.003 0.002 0.021 0.079
Comor-
bidity 0.136 0.117 -0.058 0.006 -0.031 -0.006 0.008 -0.034 -0.013 0.014 -0.006 0.003 0 -0.112 -0.007 -0.011 0.005 0.003 1 -0.038 0 -0.074
Comp-
lication -0.005 -0.034 -0.055 -0.025 -0.004 0.027 -0.03 -0.007 -0.026 0.011 0.002 -0.032 -0.003 0.008 0.013 -0.021 0.002 0.002 -0.038 1 -0.056 0.085
ICU 0.109 0.108 -0.013 0.003 -0.024 0.013 0.016 -0.009 -0.03 0.075 0.001 -0.006 0.051 -0.004 -0.039 -0.044 0 0.021 0 -0.056 1 -0.117
Treat-
ment -0.064 -0.287 -0.096 -0.023 0.012 0.002 0.021 -0.028 -0.045 0.05 -0.011 0.01 0.018 0.054 0.01 -0.014 0.009 0.079 -0.074 0.085 -0.117 1
Page 164
155
Table of correlations of variables used in analysis of health services utilization by prostate cancer patients in subset
analysis including hospital factors
Hosp
LOS ER Age
Female
HH
Genetic
Factors Income
Medi-
caid
Pop
65+
Black/
AA
Hisp-
anic White Poverty
Un-
insured Cost Access
Rur/
Urb
Under-
served Region Size
Owner-
ship
Cancer
Prog
Train-
ing
Comor-
bidity
Comp-
lication ICU
Treat-
ment
Hosp
LOS 1 -0.038 0.027 0.099 -0.091 -0.01 0.078 -0.078 0.057 0.126 -0.088 0.031 0.131 -0.061 -0.063 -0.078 -0.1 -0.026 0.089 0.03 -0.005 0.017 0.126 0.02 0.072 -0.139
ER -0.038 1 0.185 0.029 -0.049 0.03 0.016 -0.112 0.019 0.062 -0.069 0.038 -0.002 -0.062 0.008 -0.077 0.034 0.016 0.035 -0.058 0.022 -0.018 0.145 -0.06 0.044 -0.358
Age 0.027 0.185 1 0.041 -0.035 0.021 0.016 -0.042 0.025 0.035 -0.06 -0.003 0.059 0.025 0.027 -0.057 -0.005 -0.01 0.031 0.007 -0.009 0.023 -0.089 -0.159 -0.033 -0.135
Female
HH 0.099 0.029 0.041 1 0.013 -0.357 0.751 -0.63 0.383 0.652 -0.62 0.596 0.688 -0.023 -0.174 -0.266 -0.489 -0.128 -0.051 0.036 -0.122 -0.168 0.082 -0.005 -0.018 -0.037
Genetic -0.091 -0.049 -0.035 0.013 1 -0.01 -0.011 0.025 0.047 -0.047 0.008 -0.003 -0.01 0.005 0.026 0.009 -0.014 -0.032 -0.012 0.068 0 0.029 -0.012 0.036 -0.049 0.023
Income -0.01 0.03 0.021 -0.357 -0.01 1 -0.693 -0.158 0.322 -0.218 -0.415 -0.812 -0.471 -0.001 0.768 -0.607 0.808 0.225 0.215 0.111 0.215 0.331 -0.01 -0.011 0.063 -0.011
Medi-
caid 0.078 0.016 0.016 0.751 -0.011 -0.693 1 -0.42 -0.238 0.708 -0.2 0.829 0.795 0.006 -0.52 0.052 -0.775 0.156 -0.125 0.019 -0.141 -0.276 0.078 -0.019 -0.038 0.012
Pop 65+ -0.078 -0.112 -0.042 -0.63 0.025 -0.158 -0.42 1 -0.264 -0.663 0.756 -0.246 -0.368 -0.018 -0.06 0.571 0.042 -0.201 -0.037 -0.055 0.013 0.033 -0.099 0.016 -0.001 -0.003
Black/ 0.057 0.019 0.025 0.383 0.047 0.322 -0.238 -0.264 1 -0.096 -0.572 -0.152 -0.071 -0.027 0.353 -0.277 0.306 -0.61 0.099 0.04 0.026 0.092 0.039 0.022 -0.016 -0.065
Hispanic 0.126 0.062 0.035 0.652 -0.047 -0.218 0.708 -0.663 -0.096 1 -0.497 0.439 0.753 -0.035 -0.407 -0.387 -0.5 0.315 0.021 0.003 -0.02 -0.128 0.073 -0.055 0.065 -0.015
White -0.088 -0.069 -0.06 -0.62 0.008 -0.415 -0.2 0.756 -0.572 -0.497 1 0.006 -0.296 -0.006 -0.362 0.644 -0.17 -0.12 -0.09 -0.07 -0.011 -0.006 -0.089 0.033 -0.009 0.04
Poverty 0.031 0.038 -0.003 0.596 -0.003 -0.812 0.829 -0.246 -0.152 0.439 0.006 1 0.449 0.007 -0.612 0.309 -0.661 -0.13 -0.18 -0.124 -0.177 -0.288 0.064 -0.032 -0.122 0.046
Un-
insured 0.131 -0.002 0.059 0.688 -0.01 -0.471 0.795 -0.368 -0.071 0.753 -0.296 0.449 1 -0.026 -0.416 -0.208 -0.782 0.093 0.013 0.085 -0.055 -0.243 0.065 -0.004 0.063 -0.055
Cost -0.061 -0.062 0.025 -0.023 0.005 -0.001 0.006 -0.018 -0.027 -0.035 -0.006 0.007 -0.026 1 0.026 0.026 0.006 0.041 -0.002 0.042 -0.011 -0.048 -0.157 0.064 -0.01 0.134
Access -0.063 0.008 0.027 -0.174 0.026 0.768 -0.52 -0.06 0.353 -0.407 -0.362 -0.612 -0.416 0.026 1 -0.47 0.662 0.149 0.158 0.117 0.125 0.201 -0.005 0.011 0 -0.008
Rur/ Urb -0.078 -0.077 -0.057 -0.266 0.009 -0.607 0.052 0.571 -0.277 -0.387 0.644 0.309 -0.208 0.026 -0.47 1 -0.236 -0.297 -0.206 -0.101 -0.15 -0.103 -0.016 0.008 -0.051 0.017
Under-
served -0.1 0.034 -0.005 -0.489 -0.014 0.808 -0.775 0.042 0.306 -0.5 -0.17 -0.661 -0.782 0.006 0.662 -0.236 1 0.046 0.109 0.009 0.14 0.261 -0.041 -0.046 0 0.008
Region -0.026 0.016 -0.01 -0.128 -0.032 0.225 0.156 -0.201 -0.61 0.315 -0.12 -0.13 0.093 0.041 0.149 -0.297 0.046 1 -0.054 0.044 0.018 -0.021 -0.019 -0.037 0.044 0.055
Size 0.089 0.035 0.031 -0.051 -0.012 0.215 -0.125 -0.037 0.099 0.021 -0.09 -0.18 0.013 -0.002 0.158 -0.206 0.109 -0.054 1 0.145 0.732 0.273 0.048 0.03 0.056 -0.007
Owner- 0.03 -0.058 0.007 0.036 0.068 0.111 0.019 -0.055 0.04 0.003 -0.07 -0.124 0.085 0.042 0.117 -0.101 0.009 0.044 0.145 1 -0.025 0.055 0.033 -0.053 0.017 0.024
Cancer
Prog -0.005 0.022 -0.009 -0.122 0 0.215 -0.141 0.013 0.026 -0.02 -0.011 -0.177 -0.055 -0.011 0.125 -0.15 0.14 0.018 0.732 -0.025 1 0.275 0.04 0.02 0.009 0.008
Training 0.017 -0.018 0.023 -0.168 0.029 0.331 -0.276 0.033 0.092 -0.128 -0.006 -0.288 -0.243 -0.048 0.201 -0.103 0.261 -0.021 0.273 0.055 0.275 1 0.051 0.036 0.003 0.012
Comor-
bidity 0.126 0.145 -0.089 0.082 -0.012 -0.01 0.078 -0.099 0.039 0.073 -0.089 0.064 0.065 -0.157 -0.005 -0.016 -0.041 -0.019 0.048 0.033 0.04 0.051 1 -0.048 0.034 -0.151
Comp-
lication 0.02 -0.06 -0.159 -0.005 0.036 -0.011 -0.019 0.016 0.022 -0.055 0.033 -0.032 -0.004 0.064 0.011 0.008 -0.046 -0.037 0.03 -0.053 0.02 0.036 -0.048 1 -0.023 0.071
ICU 0.072 0.044 -0.033 -0.018 -0.049 0.063 -0.038 -0.001 -0.016 0.065 -0.009 -0.122 0.063 -0.01 0 -0.051 0 0.044 0.056 0.017 0.009 0.003 0.034 -0.023 1 -0.159
Treat-
ment -0.139 -0.358 -0.135 -0.037 0.023 -0.011 0.012 -0.003 -0.065 -0.015 0.04 0.046 -0.055 0.134 -0.008 0.017 0.008 0.055 -0.007 0.024 0.008 0.012 -0.151 0.071 -0.159 1
Page 165
156
APPENDIX C: SUMMARY OF PREDICTOR TREE TERMINAL NODES
Page 166
157
Terminal nodes summary of social and demographic variables in predicting emergency
room use and ranking of mean hospital length of stay by prostate cancer patients
Node by
Node
Cumulative
Nodes
Node Variable n % n %
ER
Use Hospital
Days
Emergency Room
2 Rural/ Urban 2, 3 (Urban adjacent & Rural) 845 14.7 845 14.7 No
3 Rural/ Urban 1 (Urban) 4,909 85.3 5,754 100 Yes
Hospital Length of Stay
6 Rural/Urban 2, 3 (Urban adjacent & Rural) 666 11.6 666 11.6 3.9
134 Rural/Urban 2, 3 (Urban adjacent & Rural) 16 0.3 682 11.9 4.2
124 Hispanic/ Latino 2, 3 (> 14) 124 2.2 806 14.0 4.3
7 Rural/Urban 1 (Urban) 2,019 35.1 2,825 49.2 4.4
150 Hispanic/ Latino 1, 2 (< 32) 1,274 22.2 4,099 71.4 4.7
151 Hispanic/ Latino 3 (> 32) 582 10.1 4,681 81.5 5.3
149 Underserved 2 (Part shortage area) 1,001 17.4 5,682 98.9 5.5
142 Underserved 2 (Part shortage area) 55 1.0 5,737 99.9 7.5
143 Underserved 1 (All shortage area) 7 0.1 5,754 100 23.9
Terminal node summary of social and demographic variables in predicting emergency
room utilization and hospital length of stay by prostate cancer patients in data subset
Node Variable n %
ER
Use
Hospital
Days
Emergency Room
4 Age 1 (<75) 206 37.1 No
3 Age 3 (>85) 112 20.1 Yes
5 Age 2 (75-85) 238 42.8 Yes
Hospital Length of Stay
2 Hispanic/Latino Population 1, 2 (<32%) 205 36.9 3.9
3 Hispanic/Latino Population 3 (>32%) 351 63.1 5.3
Page 167
158
APPENDIX D: LOGISTIC REGRESSION RESULTS
Page 168
159
Hierarchical logistic regression analysis for emergency room utilization by all prostate
cancer patients (n = 5754)
All Patients
1. Predisposing Factors
B S.E. Sig. OR 95% CI for OR
Lower Upper
Age 0.028 0.003 0.000 1.029 1.022 1.036
Genetic Factors -0.167 0.090 0.063 0.846 0.709 1.009
Average Household Income 0.000 0.000 0.005 1.000 1.000 1.000
Medicaid Eligible -0.002 0.007 0.734 0.998 0.985 1.011
Population Age 65+ -0.033 0.012 0.005 0.967 0.945 0.990
Poverty 0.025 0.014 0.079 1.025 0.997 1.054
Uninsured Population -0.030 0.010 0.002 0.970 0.952 0.989
Race/Ethnicity - % Black/ AA 0.018 0.004 0.000 1.019 1.011 1.026
Race/Ethnicity - % Hispanic 0.009 0.003 0.005 1.009 1.003 1.016
Race/Ethnicity - % White 0.008 0.003 0.006 1.008 1.002 1.014
Constant -2.944 0.693 0.000 0.053
2. Predisposing and Enabling Factors
B S.E. Sig. OR 95% CI for OR
Lower Upper
Age 0.029 0.003 0.000 1.030 1.023 1.037
Genetic Factors -0.155 0.091 0.088 0.856 0.717 1.023
Average Household Income 0.000 0.000 0.163 1.000 1.000 1.000
Medicaid Eligible 0.002 0.007 0.784 1.002 0.988 1.016
Population Age 65+ -0.022 0.013 0.097 0.978 0.952 1.004
Poverty 0.040 0.015 0.006 1.041 1.011 1.071
Uninsured Population -0.005 0.013 0.685 0.995 0.970 1.020
Race/Ethnicity - % Black/ AA 0.000 0.005 0.950 1.000 0.990 1.010
Race/Ethnicity - % Hispanic -0.002 0.004 0.641 0.998 0.990 1.006
Race/Ethnicity - % White 0.003 0.004 0.388 1.003 0.996 1.010
Cost 0.000 0.000 0.005 1.000 1.000 1.000
Access to Physicians -0.001 0.001 0.599 0.999 0.997 1.002
Rural/Urban 1 0.000
Rural/Urban 2 -0.059 0.081 0.463 0.942 0.804 1.104
Rural/Urban 3 -0.309 0.123 0.012 0.734 0.577 0.935
Rural/Urban 4 -0.487 0.180 0.007 0.615 0.432 0.874
Rural/Urban 5 -0.211 0.206 0.305 0.810 0.541 1.212
Rural/Urban 6 -0.766 0.170 0.000 0.465 0.333 0.648
Rural/Urban 7 -0.779 0.188 0.000 0.459 0.317 0.664
Rural/Urban 8 -0.695 0.311 0.025 0.499 0.271 0.918
Rural/Urban 9 -0.914 0.294 0.002 0.401 0.225 0.713
Underserved Area - No 0.652
Underserved Area - All -0.066 0.121 0.589 0.937 0.738 1.188
Underserved Area - Part -0.006 0.113 0.957 0.994 0.796 1.241
Geographic Region-Northeast 0.000
Geographic Region-Midwest -0.208 0.118 0.077 0.812 0.645 1.023
Geographic Region-South -0.361 0.138 0.009 0.697 0.531 0.914
Page 169
160
Geographic Region-West -0.488 0.112 0.000 0.614 0.493 0.765
Constant -2.176 0.779 0.005 0.114
3. Predisposing, Enabling and Need Factors
B S.E. Sig. OR 95% CI for OR
Lower Upper
Age 0.025 0.004 0.000 1.026 1.018 1.033
Genetic Factors -0.092 0.096 0.335 0.912 0.756 1.100
Average Household Income 0.000 0.000 0.182 1.000 1.000 1.000
Medicaid Eligible -0.002 0.008 0.771 0.998 0.983 1.013
Population Age 65+ -0.026 0.014 0.068 0.975 0.948 1.002
Poverty 0.052 0.015 0.001 1.054 1.022 1.086
Uninsured Population -0.017 0.014 0.215 0.983 0.958 1.010
Race/Ethnicity - % Black/ AA 0.001 0.005 0.819 1.001 0.991 1.012
Race/Ethnicity - % Hispanic 0.000 0.004 0.911 1.000 0.991 1.008
Race/Ethnicity - % White 0.004 0.004 0.230 1.004 0.997 1.012
Cost 0.000 0.000 0.299 1.000 1.000 1.000
Access to Physicians 0.000 0.001 0.951 1.000 0.997 1.003
Rural/Urban 1 0.000
Rural/Urban 2 -0.078 0.086 0.361 0.925 0.782 1.094
Rural/Urban 3 -0.316 0.131 0.016 0.729 0.565 0.942
Rural/Urban 4 -0.557 0.187 0.003 0.573 0.397 0.826
Rural/Urban 5 -0.178 0.219 0.415 0.837 0.545 1.284
Rural/Urban 6 -0.776 0.177 0.000 0.460 0.325 0.651
Rural/Urban 7 -0.845 0.195 0.000 0.429 0.293 0.629
Rural/Urban 8 -0.673 0.320 0.035 0.510 0.272 0.955
Rural/Urban 9 -0.837 0.304 0.006 0.433 0.239 0.786
Underserved Area - No 0.880
Underserved Area - All -0.003 0.126 0.978 0.997 0.778 1.277
Underserved Area - Part 0.030 0.117 0.801 1.030 0.818 1.297
Geographic Region-Northeast 0.007
Geographic Region-Midwest -0.258 0.124 0.038 0.773 0.606 0.985
Geographic Region-South -0.366 0.145 0.012 0.694 0.522 0.922
Geographic Region-West -0.375 0.119 0.002 0.687 0.545 0.867
Comorbidity Index Score 2 0.000
Comorbidity Index Score 3 0.462 0.113 0.000 1.587 1.272 1.980
Comorbidity Index Score 4 0.468 0.100 0.000 1.597 1.313 1.942
Comorbidity Index Score 5 0.461 0.173 0.008 1.586 1.130 2.225
Comorbidity Index Score 6 0.734 0.444 0.098 2.084 0.872 4.979
Comorbidity Index Score 7 0.662 1.162 0.569 1.939 0.199 18.909
Comorbidity Index Score 8 0.492 0.080 0.000 1.635 1.399 1.911
Comorbidity Index Score 9 0.966 0.181 0.000 2.628 1.843 3.748
Comorbidity Index Score 10 0.572 0.167 0.001 1.773 1.277 2.461
Comorbidity Index Score 11 0.408 0.277 0.141 1.504 0.873 2.590
Comorbidity Index Score 12 1.244 0.538 0.021 3.469 1.209 9.958
Comorbidity Index Score 13 0.572 0.878 0.515 1.771 0.317 9.897
Complications 0.021 0.107 0.843 1.021 0.828 1.261
Treatment -2.225 0.135 0.000 0.108 0.083 0.141
Intensive Care Unit 0.420 0.073 0.000 1.523 1.320 1.756
Constant -2.236 0.826 0.007 0.107
Page 170
161
Hierarchical logistic regression analysis for emergency room utilization by prostate cancer
patients in Group A (n = 845)
Emergency Room Group A
1. Predisposing Factors
B S.E. Sig. OR 95% CI for OR
Lower Upper
Age -0.004 0.009 0.638 0.996 0.979 1.013
Genetic Factors -0.015 0.232 0.949 0.985 0.625 1.553
Average Household Income 0.000 0.000 0.004 1.000 1.000 1.000
Medicaid Eligible 0.034 0.015 0.021 1.035 1.005 1.065
Population Age 65+ -0.025 0.026 0.328 0.975 0.927 1.026
Poverty 0.023 0.029 0.438 1.023 0.966 1.084
Uninsured Population 0.027 0.023 0.233 1.027 0.983 1.074
Race/Ethnicity - % Black/ AA 0.015 0.009 0.110 1.015 0.997 1.034
Race/Ethnicity - % Hispanic 0.001 0.007 0.835 1.001 0.988 1.015
Race/Ethnicity - % White 0.020 0.008 0.019 1.020 1.003 1.037
Constant -5.186 1.989 0.009 0.006
2. Predisposing and Enabling Factors
B S.E. Sig. OR 95% CI for OR
Lower Upper
Age 0.000 0.009 0.983 1.000 0.983 1.018
Genetic Factors 0.000 0.236 0.999 1.000 0.630 1.587
Average Household Income 0.000 0.000 0.011 1.000 1.000 1.000
Medicaid Eligible 0.038 0.016 0.019 1.039 1.006 1.072
Population Age 65+ 0.026 0.031 0.405 1.026 0.966 1.090
Poverty 0.014 0.033 0.669 1.014 0.951 1.081
Uninsured Population 0.028 0.035 0.419 1.028 0.961 1.101
Race/Ethnicity - % Black/ AA 0.009 0.011 0.404 1.009 0.987 1.032
Race/Ethnicity - % Hispanic 0.004 0.008 0.626 1.004 0.989 1.019
Race/Ethnicity - % White 0.014 0.009 0.137 1.014 0.996 1.033
Cost 0.000 0.000 0.013 1.000 0.999 1.000
Access to Physicians -0.003 0.003 0.391 0.997 0.990 1.004
Rural/Urban 4 0.047
Rural/Urban 5 0.610 0.269 0.023 1.841 1.086 3.121
Rural/Urban 6 -0.238 0.239 0.320 0.788 0.493 1.260
Rural/Urban 7 -0.076 0.253 0.764 0.927 0.565 1.520
Rural/Urban 8 -0.200 0.371 0.590 0.819 0.396 1.694
Rural/Urban 9 -0.363 0.350 0.300 0.696 0.350 1.382
Underserved Area - No 0.299
Underserved Area - All -0.379 0.258 0.142 0.685 0.413 1.135
Underserved Area - Part -0.181 0.240 0.452 0.834 0.521 1.337
Geographic Region-Northeast 0.152
Page 171
162
Geographic Region-Midwest -0.611 0.616 0.321 0.543 0.162 1.814
Geographic Region-South -0.024 0.696 0.972 0.976 0.249 3.819
Geographic Region-West -0.599 0.619 0.333 0.549 0.163 1.847
Constant -5.024 2.559 0.050 0.007
3. Predisposing, Enabling and Need Factors
B S.E. Sig. OR 95% CI for OR
Lower Upper
Age -0.002 0.009 0.816 0.998 0.979 1.017
Genetic Factors 0.042 0.245 0.863 1.043 0.646 1.686
Average Household Income 0.000 0.000 0.022 1.000 1.000 1.000
Medicaid Eligible 0.036 0.017 0.032 1.037 1.003 1.071
Population Age 65+ 0.027 0.032 0.406 1.027 0.964 1.095
Poverty 0.018 0.034 0.588 1.019 0.953 1.089
Uninsured Population 0.019 0.036 0.593 1.020 0.949 1.095
Race/Ethnicity - % Black/ AA 0.012 0.012 0.303 1.012 0.989 1.036
Race/Ethnicity - % Hispanic 0.008 0.008 0.313 1.008 0.992 1.025
Race/Ethnicity - % White 0.018 0.01 0.074 1.018 0.998 1.038
Cost 0.000 0.000 0.067 1.000 0.999 1.000
Access to Physicians -0.003 0.004 0.448 0.997 0.99 1.004
Rural/Urban 4 0.038
Rural/Urban 5 0.687 0.283 0.015 1.988 1.141 3.464
Rural/Urban 6 -0.202 0.247 0.414 0.817 0.503 1.326
Rural/Urban 7 -0.118 0.262 0.653 0.889 0.532 1.485
Rural/Urban 8 -0.153 0.38 0.688 0.858 0.408 1.808
Rural/Urban 9 -0.325 0.363 0.370 0.722 0.355 1.471
Underserved Area - No 0.411
Underserved Area - All -0.351 0.266 0.186 0.704 0.418 1.185
Underserved Area - Part -0.213 0.249 0.392 0.808 0.496 1.316
Geographic Region-Northeast 0.180
Geographic Region-Midwest -0.629 0.625 0.314 0.533 0.157 1.815
Geographic Region-South 0.034 0.708 0.962 1.035 0.258 4.149
Geographic Region-West -0.484 0.632 0.444 0.616 0.179 2.126
Comorbidity Index Score 2 0.452
Comorbidity Index Score 3 0.5 0.295 0.090 1.648 0.925 2.937
Comorbidity Index Score 4 0.231 0.243 0.342 1.260 0.782 2.031
Comorbidity Index Score 5 -0.029 0.436 0.948 0.972 0.414 2.283
Comorbidity Index Score 6 1.339 1.291 0.300 3.814 0.304 47.854
Comorbidity Index Score 9 0.306 0.204 0.134 1.358 0.91 2.026
Comorbidity Index Score 10 1.526 0.681 0.025 4.599 1.211 17.464
Comorbidity Index Score 11 0.077 0.444 0.863 1.080 0.452 2.58
Comorbidity Index Score 12 0.32 0.685 0.640 1.378 0.36 5.27
Comorbidity Index Score 13 0.288 1.452 0.843 1.333 0.077 22.975
Complications -0.215 0.312 0.491 0.806 0.437 1.487
Treatment -1.826 0.384 0.000 0.161 0.076 0.342
Intensive Care Unit -0.003 0.191 0.986 0.997 0.685 1.451
Constant -5.158 2.675 0.054 0.006
Page 172
163
Hierarchical logistic regression analysis for emergency room utilization by prostate cancer
patients in Group B (n = 4909)
Emergency Room Group B
1. Predisposing Factors
B S.E. Sig. OR 95% CI for OR
Lower Upper
Age 0.035 0.004 0.000 1.036 1.028 1.043
Genetic Factors -0.181 0.098 0.065 0.834 0.688 1.011
Average Household Income 0.000 0.000 0.450 1.000 1.000 1.000
Medicaid Eligible -0.013 0.008 0.096 0.987 0.971 1.002
Population Age 65+ -0.002 0.015 0.889 0.998 0.970 1.027
Poverty 0.032 0.018 0.077 1.032 0.997 1.069
Uninsured Population -0.037 0.011 0.001 0.963 0.943 0.984
Race/Ethnicity - % Black/ AA 0.015 0.004 0.000 1.015 1.007 1.024
Race/Ethnicity - % Hispanic 0.012 0.004 0.003 1.012 1.004 1.020
Race/Ethnicity - % White 0.006 0.003 0.093 1.006 0.999 1.012
Constant -2.847 0.801 0.000 0.058
2. Predisposing and Enabling Factors
B S.E. Sig. OR 95% CI for OR
Lower Upper
Age 0.035 0.004 0.000 1.036 1.028 1.043
Genetic Factors -0.169 0.099 0.087 0.845 0.696 1.025
Average Household Income 0.000 0.000 0.508 1.000 1.000 1.000
Medicaid Eligible -0.005 0.009 0.548 0.995 0.978 1.012
Population Age 65+ -0.022 0.016 0.167 0.978 0.948 1.009
Poverty 0.043 0.019 0.021 1.044 1.007 1.083
Uninsured Population -0.006 0.015 0.675 0.994 0.965 1.023
Race/Ethnicity - % Black/ AA -0.004 0.006 0.469 0.996 0.984 1.008
Race/Ethnicity - % Hispanic -0.001 0.005 0.840 0.999 0.989 1.009
Race/Ethnicity - % White -0.001 0.004 0.789 0.999 0.991 1.007
Cost 0.000 0.000 0.041 1.000 1.000 1.000
Access to Physicians -0.001 0.002 0.573 0.999 0.996 1.002
Rural/Urban 1 0.064
Rural/Urban 2 -0.057 0.083 0.493 0.945 0.803 1.112
Rural/Urban 3 -0.302 0.129 0.019 0.739 0.574 0.952
Underserved Area - No 0.717
Underserved Area - All -0.018 0.141 0.898 0.982 0.746 1.294
Underserved Area - Part 0.041 0.131 0.754 1.042 0.806 1.346
Geographic Region-Northeast 0.000
Geographic Region-Midwest -0.082 0.140 0.559 0.922 0.701 1.212
Geographic Region-South -0.423 0.153 0.006 0.655 0.485 0.885
Geographic Region-West -0.540 0.130 0.000 0.583 0.451 0.752
Constant -2.024 0.864 0.019 0.132
3. Predisposing, Enabling and Need Factors
B S.E. Sig. OR 95% CI for OR
Page 173
164
Lower Upper
Age 0.031 0.004 0.000 1.032 1.024 1.040
Genetic Factors -0.104 0.105 0.322 0.901 0.734 1.107
Average Household Income 0.000 0.000 0.503 1.000 1.000 1.000
Medicaid Eligible -0.010 0.009 0.303 0.990 0.972 1.009
Population Age 65+ -0.027 0.017 0.110 0.973 0.941 1.006
Poverty 0.058 0.020 0.003 1.060 1.020 1.102
Uninsured Population -0.018 0.016 0.253 0.982 0.953 1.013
Race/Ethnicity - % Black/ AA -0.003 0.006 0.634 0.997 0.984 1.010
Race/Ethnicity - % Hispanic 0.000 0.005 0.968 1.000 0.989 1.010
Race/Ethnicity - % White 0.000 0.004 0.962 1.000 0.992 1.008
Cost 0.000 0.000 0.799 1.000 1.000 1.000
Access to Physicians 0.000 0.002 0.951 1.000 0.997 1.003
Rural/Urban 1 0.079
Rural/Urban 2 -0.071 0.088 0.418 0.931 0.783 1.107
Rural/Urban 3 -0.309 0.137 0.024 0.734 0.561 0.960
Underserved Area - No 0.756
Underserved Area - All 0.037 0.147 0.803 1.037 0.777 1.384
Underserved Area - Part 0.080 0.137 0.558 1.083 0.829 1.416
Geographic Region-Northeast 0.003
Geographic Region-Midwest -0.148 0.148 0.318 0.863 0.646 1.153
Geographic Region-South -0.450 0.162 0.006 0.637 0.464 0.876
Geographic Region-West -0.428 0.139 0.002 0.652 0.496 0.855
Comorbidity Index Score 2 0.000
Comorbidity Index Score 3 0.480 0.123 0.000 1.616 1.269 2.057
Comorbidity Index Score 4 0.507 0.111 0.000 1.660 1.336 2.064
Comorbidity Index Score 5 0.608 0.196 0.002 1.837 1.251 2.696
Comorbidity Index Score 6 0.628 0.466 0.178 1.873 0.751 4.669
Comorbidity Index Score 8 0.516 0.087 0.000 1.675 1.412 1.987
Comorbidity Index Score 9 0.935 0.189 0.000 2.547 1.757 3.692
Comorbidity Index Score 10 0.656 0.183 0.000 1.927 1.345 2.760
Comorbidity Index Score 11 0.405 0.302 0.180 1.499 0.830 2.707
Comorbidity Index Score 12 1.407 0.594 0.018 4.083 1.273 13.092
Comorbidity Index Score 13 0.622 0.885 0.482 1.863 0.329 10.550
Complications 0.055 0.115 0.631 1.057 0.843 1.325
Treatment -2.282 0.145 0.000 0.102 0.077 0.136
Intensive Care Unit 0.470 0.080 0.000 1.600 1.368 1.871
Constant -2.106 0.922 0.022 0.122
Page 174
165
APPENDIX E: MULTIPLE REGRESSION RESULTS
Page 175
166
Hierarchical multiple regression analysis for hospital length of stay by all prostate cancer
patients (n=5754)
All Patients
1. Predisposing Factors
B SE Beta Sig.
(Constant) 7.996 1.665 0.000
Age 0.007 0.008 0.011 0.386
Genetic Factors -0.976 0.219 -0.058 0.000
Average Household Income 0.000 0.000 -0.046 0.151
Medicaid Eligible -0.027 0.016 -0.050 0.104
Population Age 65+ 0.015 0.028 0.009 0.590
Poverty -0.047 0.034 -0.051 0.172
Uninsured Population 0.034 0.023 0.036 0.139
Race/Ethnicity - % Black/AA 0.000 0.009 0.001 0.982
Race/Ethnicity - % Hispanic -0.002 0.008 -0.008 0.756
Race/Ethnicity - % White -0.033 0.007 -0.112 0.000
2. Predisposing and Enabling Factors
B SE Beta Sig.
(Constant) 10.536 1.767 0.000
Age 0.007 0.008 0.012 0.364
Genetic Factors -0.970 0.218 -0.058 0.000
Average Household Income 0.000 0.000 -0.050 0.134
Medicaid Eligible -0.018 0.017 -0.035 0.267
Population Age 65+ -0.028 0.031 -0.017 0.356
Poverty -0.037 0.035 -0.040 0.293
Uninsured Population 0.098 0.025 0.102 0.000
Race/Ethnicity - % Black/AA -0.042 0.011 -0.112 0.000
Race/Ethnicity - % Hispanic -0.020 0.009 -0.070 0.017
Race/Ethnicity - % White -0.054 0.008 -0.184 0.000
Cost 0.001 0.000 0.084 0.000
Access to Physicians -0.003 0.003 -0.015 0.353
Rural/Urban 0.015 0.054 0.005 0.788
Underserved Area 0.088 0.109 0.011 0.420
Geographic Region -0.538 0.085 -0.132 0.000
3. Predisposing, Enabling and Need Factors
B SE Beta Sig.
(Constant) 8.356 1.754 0.000
Age 0.011 0.008 0.018 0.163
Genetic Factors -0.848 0.214 -0.051 0.000
Average Household Income 0 0 -0.042 0.205
Medicaid Eligible -0.018 0.016 -0.033 0.281
Population Age 65+ -0.021 0.03 -0.013 0.481
Poverty -0.032 0.034 -0.035 0.355
Uninsured Population 0.093 0.025 0.097 0.000
Page 176
167
Race/Ethnicity - % Black/AA -0.039 0.011 -0.103 0.001
Race/Ethnicity - % Hispanic -0.021 0.008 -0.073 0.011
Race/Ethnicity - % White -0.054 0.008 -0.184 0.000
Cost 0.001 0 0.102 0.000
Access to Physicians -0.002 0.003 -0.01 0.535
Rural/Urban 0.036 0.054 0.013 0.498
Underserved Area 0.085 0.107 0.011 0.426
Geographic Region -0.508 0.084 -0.124 0.000
Comorbidity Index Score 0.253 0.023 0.143 0.000
Complications 0.147 0.236 0.008 0.532
Treatment -0.661 0.227 -0.038 0.004
Intensive Care Unit 1.276 0.159 0.104 0.000
4. Predisposing, Enabling and Need Factors, and Emergency Room Use
B SE Beta Sig.
(Constant) 8.376 1.754 0.000
Age 0.013 0.008 0.021 0.115
Genetic Factors -0.855 0.214 -0.051 0.000
Average Household Income 0 0 -0.04 0.221
Medicaid Eligible -0.018 0.016 -0.033 0.279
Population Age 65+ -0.023 0.03 -0.014 0.449
Poverty -0.029 0.034 -0.031 0.402
Uninsured Population 0.091 0.025 0.096 0.000
Race/Ethnicity - % Black/AA -0.039 0.011 -0.103 0.001
Race/Ethnicity - % Hispanic -0.021 0.008 -0.073 0.011
Race/Ethnicity - % White -0.054 0.008 -0.183 0.000
Cost 0.001 0 0.102 0.000
Access to Physicians -0.002 0.003 -0.01 0.535
Rural/Urban 0.028 0.054 0.01 0.597
Underserved Area 0.088 0.107 0.011 0.412
Geographic Region -0.516 0.084 -0.126 0.000
Comorbidity Index Score 0.258 0.023 0.146 0.000
Complications 0.148 0.236 0.008 0.531
Treatment -0.783 0.235 -0.045 0.001
Intensive Care Unit 1.302 0.16 0.106 0.000
Emergency Room -0.275 0.138 -0.027 0.047
Page 177
168
Hierarchical multiple regression analysis for hospital length of stay by prostate cancer
patients in Group A (n=666)
Hospital Group A
1. Predisposing Factors
B SE Beta Sig.
(Constant) -6.612 5.123 0.197
Age 0.003 0.017 0.007 0.864
Genetic Factors -0.819 0.442 -0.072 0.064
Average Household Income 0.000 0.000 0.033 0.687
Medicaid Eligible -0.009 0.035 -0.024 0.796
Population Age 65+ 0.047 0.049 0.046 0.332
Poverty 0.033 0.066 0.059 0.621
Uninsured Population 0.036 0.050 0.050 0.465
Race/Ethnicity - % Black/AA 0.066 0.105 0.029 0.534
Race/Ethnicity - % Hispanic 0.025 0.017 0.103 0.159
Race/Ethnicity - % White 0.085 0.038 0.196 0.026
2. Predisposing and Enabling Factors
B SE Beta Sig.
(Constant) -5.839 5.324 0.273
Age 0.003 0.017 0.008 0.843
Genetic Factors -0.790 0.443 -0.070 0.075
Average Household Income 0.000 0.000 0.069 0.440
Medicaid Eligible -0.010 0.036 -0.026 0.783
Population Age 65+ 0.076 0.052 0.073 0.144
Poverty 0.048 0.068 0.086 0.481
Uninsured Population 0.033 0.062 0.045 0.594
Race/Ethnicity - % Black/AA 0.085 0.109 0.038 0.438
Race/Ethnicity - % Hispanic 0.020 0.018 0.085 0.267
Race/Ethnicity - % White 0.070 0.043 0.160 0.105
Cost 0.000 0.000 -0.021 0.600
Access to Physicians -0.011 0.006 -0.082 0.050
Rural/Urban -0.005 0.109 -0.002 0.966
Underserved Area 0.297 0.194 0.062 0.127
Geographic Region -0.056 0.284 -0.015 0.843
3. Predisposing, Enabling and Need Factors
B SE Beta Sig.
(Constant) -6.72 5.261 0.202
Age 0.007 0.017 0.015 0.695
Genetic Factors -0.749 0.435 -0.066 0.086
Average Household Income 0 0 0.051 0.560
Medicaid Eligible -0.017 0.035 -0.045 0.631
Population Age 65+ 0.081 0.051 0.078 0.114
Poverty 0.052 0.067 0.093 0.435
Uninsured Population 0.023 0.061 0.032 0.706
Page 178
169
Race/Ethnicity - % Black/AA 0.059 0.108 0.026 0.582
Race/Ethnicity - % Hispanic 0.02 0.018 0.084 0.267
Race/Ethnicity - % White 0.07 0.042 0.161 0.099
Cost 0 0 0.013 0.746
Access to Physicians -0.011 0.006 -0.081 0.049
Rural/Urban -0.018 0.108 -0.008 0.869
Underserved Area 0.319 0.192 0.066 0.098
Geographic Region -0.014 0.28 -0.004 0.961
Comorbidity Index Score 0.156 0.051 0.121 0.002
Complications -0.075 0.539 -0.005 0.890
Treatment -0.737 0.478 -0.06 0.124
Intensive Care Unit 1.351 0.352 0.149 0.000
4. Predisposing, Enabling, and Need Factors, and Emergency Room Use
B SE Beta Sig.
(Constant) -6.846 5.287 0.196
Age 0.007 0.017 0.015 0.693
Genetic Factors -0.75 0.436 -0.066 0.086
Average Household Income 0 0 0.054 0.542
Medicaid Eligible -0.016 0.035 -0.042 0.649
Population Age 65+ 0.081 0.051 0.078 0.114
Poverty 0.052 0.067 0.094 0.433
Uninsured Population 0.024 0.062 0.033 0.695
Race/Ethnicity - % Black/AA 0.061 0.108 0.027 0.571
Race/Ethnicity - % Hispanic 0.02 0.018 0.085 0.262
Race/Ethnicity - % White 0.071 0.043 0.163 0.096
Cost 0 0 0.013 0.751
Access to Physicians -0.011 0.006 -0.081 0.049
Rural/Urban -0.019 0.108 -0.008 0.860
Underserved Area 0.32 0.193 0.066 0.097
Geographic Region -0.015 0.28 -0.004 0.958
Comorbidity Index Score 0.157 0.051 0.121 0.002
Complications -0.074 0.54 -0.005 0.890
Treatment -0.762 0.488 -0.062 0.119
Intensive Care Unit 1.351 0.353 0.149 0.000
Emergency Room -0.074 0.279 -0.011 0.791
Page 179
170
Hierarchical multiple regression analysis for hospital length of stay by prostate cancer
patients in Group B (n=2019)
Hospital Group B
1. Predisposing Factors
B SE Beta Sig.
(Constant) 2.584 3.118 0.407
Age -0.009 0.012 -0.016 0.460
Genetic Factors -0.917 0.312 -0.065 0.003
Household Income 0.000 0.000 0.020 0.721
Medicaid Eligible 0.004 0.029 0.008 0.896
Population Age 65+ 0.043 0.038 0.030 0.267
Poverty -0.018 0.064 -0.021 0.781
Uninsured Population -0.023 0.047 -0.025 0.626
Race/Ethnicity - % Black/AA 0.141 0.049 0.074 0.004
Race/Ethnicity - % Hispanic 0.022 0.013 0.090 0.088
Race/Ethnicity - % White 0.016 0.017 0.049 0.352
2. Predisposing and Enabling Factors
B SE Beta Sig.
(Constant) 6.097 3.604 0.091
Age -0.007 0.012 -0.013 0.553
Genetic Factors -0.884 0.309 -0.063 0.004
Household Income 0.000 0.000 -0.009 0.895
Medicaid Eligible 0.002 0.030 0.005 0.942
Population Age 65+ 0.005 0.044 0.003 0.913
Poverty -0.048 0.067 -0.057 0.469
Uninsured Population 0.024 0.053 0.026 0.649
Race/Ethnicity - % Black/AA 0.118 0.060 0.062 0.051
Race/Ethnicity - % Hispanic 0.013 0.013 0.052 0.335
Race/Ethnicity - % White -0.003 0.019 -0.009 0.884
Cost -0.001 0.000 -0.152 0.000
Access to Physicians 0.003 0.005 0.019 0.550
Rural/Urban 0.291 0.200 0.049 0.146
Underserved Area -0.002 0.149 0.000 0.989
Geographic Region -0.268 0.148 -0.080 0.070
3. Predisposing, Enabling and Need Factors
B SE Beta Sig.
(Constant) 4.755 3.592 0.186
Age -0.009 0.012 -0.017 0.447
Genetic Factors -0.789 0.306 -0.056 0.010
Household Income 0 0 0.006 0.926
Medicaid Eligible 0.002 0.03 0.005 0.935
Population Age 65+ 0.006 0.043 0.005 0.881
Poverty -0.037 0.066 -0.043 0.576
Uninsured Population 0.02 0.052 0.022 0.700
Page 180
171
Race/Ethnicity - % Black/AA 0.111 0.06 0.059 0.062
Race/Ethnicity - % Hispanic 0.012 0.013 0.05 0.357
Race/Ethnicity - % White -0.002 0.019 -0.006 0.924
Cost -0.001 0 -0.126 0.000
Access to Physicians 0.004 0.005 0.023 0.461
Rural/Urban 0.307 0.198 0.052 0.121
Underserved Area -0.002 0.147 0 0.987
Geographic Region -0.227 0.147 -0.068 0.122
Comorbidity Index Score 0.155 0.033 0.105 0.000
Complications 0.219 0.336 0.014 0.515
Treatment -1.273 0.309 -0.093 0.000
Intensive Care Unit 0.555 0.227 0.055 0.015
4. Predisposing, Enabling and Need Factors, and Emergency Room Use
B SE Beta Sig.
(Constant) 4.672 3.595 0.194
Age -0.008 0.012 -0.015 0.503
Genetic Factors -0.795 0.306 -0.057 0.009
Household Income 0 0 0.008 0.905
Medicaid Eligible 0.003 0.03 0.006 0.929
Population Age 65+ 0.006 0.043 0.004 0.894
Poverty -0.035 0.066 -0.041 0.593
Uninsured Population 0.02 0.052 0.022 0.703
Race/Ethnicity - % Black/AA 0.113 0.06 0.06 0.058
Race/Ethnicity - % Hispanic 0.012 0.013 0.05 0.354
Race/Ethnicity - % White -0.001 0.019 -0.004 0.942
Cost -0.001 0 -0.125 0.000
Access to Physicians 0.004 0.005 0.022 0.475
Rural/Urban 0.305 0.198 0.051 0.125
Underserved Area 0 0.147 0 0.998
Geographic Region -0.229 0.147 -0.069 0.119
Comorbidity Index Score 0.157 0.033 0.107 0.000
Complications 0.223 0.336 0.015 0.508
Treatment -1.334 0.325 -0.097 0.000
Intensive Care Unit 0.569 0.228 0.056 0.013
Emergency Room -0.127 0.204 -0.015 0.534
Page 181
172
Hierarchical multiple regression analysis for hospital length of stay by prostate cancer
patients in Group C (n=124)
Hospital Group C
1. Predisposing Factors
B SE Beta Sig.
(Constant) -5.671 16.857 0.737
Age -0.055 0.046 -0.110 0.233
Genetic Factors 0.343 1.324 0.024 0.796
Medicaid Eligible 0.035 0.166 0.019 0.832
Race/Ethnicity - % White 0.284 0.327 0.080 0.386
2. Predisposing and Enabling Factors
B SE Beta Sig.
(Constant) -3.419 17.004 0.841
Age -0.056 0.046 -0.113 0.222
Genetic Factors 0.107 1.345 0.007 0.937
Medicaid Eligible 0.036 0.166 0.020 0.831
Race/Ethnicity - % White 0.258 0.328 0.072 0.433
Cost -0.001 0.001 -0.093 0.316
3. Predisposing, Enabling and Need Factors
B SE Beta Sig.
(Constant) -11.118 16.845 0.511
Age -0.045 0.047 -0.091 0.338
Genetic Factors -0.349 1.336 -0.024 0.795
Medicaid Eligible 0.079 0.163 0.043 0.631
Race/Ethnicity - % White 0.355 0.324 0.1 0.275
Cost -0.001 0.001 -0.085 0.351
Comorbidity Index Score 0.285 0.143 0.185 0.049
Complications 0.491 1.251 0.035 0.695
Treatment -1.463 1.186 -0.116 0.220
Intensive Care Unit 1.512 0.973 0.14 0.123
4. Predisposing, Enabling and Need Factors, and Emergency Room Use
B SE Beta Sig.
(Constant) -11.552 16.791 0.493
Age -0.051 0.047 -0.102 0.281
Genetic Factors -0.104 1.344 -0.007 0.939
Medicaid Eligible 0.064 0.163 0.035 0.697
Race/Ethnicity - % White 0.391 0.324 0.11 0.230
Cost -0.001 0.001 -0.072 0.428
Comorbidity Index Score 0.31 0.144 0.201 0.033
Complications 0.555 1.247 0.04 0.657
Treatment -2.174 1.296 -0.172 0.096
Intensive Care Unit 1.633 0.974 0.151 0.096
Emergency Room -1.145 0.857 -0.135 0.184
Page 182
173
Hierarchical multiple regression analysis for hospital length of stay by prostate cancer
patients in Group D (n=78)
Hospital Group D
1. Predisposing Factors
B SE Beta Sig.
(Constant) 51.244 66.526 0.444
Age 0.181 0.157 0.134 0.252
Genetic Factors 1.162 5.819 0.022 0.842
Medicaid Eligible 3.625 2.290 2.527 0.118
Population Age 65+ -10.276 3.775 -1.035 0.008
Poverty -6.448 3.705 -3.327 0.086
Uninsured Population 0.076 1.389 0.034 0.957
Race/Ethnicity - % Black/AA 13.663 12.843 0.808 0.291
Race/Ethnicity - % Hispanic 2.810 1.938 0.385 0.152
Race/Ethnicity - % White 2.022 1.247 1.135 0.110
2. Predisposing and Enabling Factors
B SE Beta Sig.
(Constant) 92.153 69.960 0.192
Age 0.130 0.158 0.096 0.412
Genetic Factors 2.455 5.792 0.047 0.673
Medicaid Eligible 2.907 2.299 2.026 0.211
Population Age 65+ -10.672 3.732 -1.075 0.006
Poverty -5.182 3.732 -2.673 0.170
Uninsured Population -0.586 1.425 -0.266 0.683
Race/Ethnicity - % Black/AA 9.181 12.946 0.543 0.481
Race/Ethnicity - % Hispanic 2.515 1.920 0.344 0.195
Race/Ethnicity - % White 1.570 1.259 0.881 0.217
Cost -0.007 0.004 -0.198 0.096
3. Predisposing, Enabling and Need Factors
B SE Beta Sig.
(Constant) 84.71 70.851 0.236
Age 0.22 0.167 0.163 0.192
Genetic Factors 2.279 6.014 0.043 0.706
Medicaid Eligible 2.495 2.373 1.739 0.297
Population Age 65+ -10.433 3.996 -1.051 0.011
Poverty -4.278 3.829 -2.207 0.268
Uninsured Population -0.826 1.46 -0.375 0.574
Race/Ethnicity - % Black/AA 9.219 13.771 0.545 0.506
Race/Ethnicity - % Hispanic 2.2 2.055 0.301 0.288
Race/Ethnicity - % White 1.432 1.337 0.804 0.288
Cost -0.008 0.004 -0.23 0.059
Comorbidity Index Score 0.446 0.452 0.114 0.327
Complications 4.044 3.943 0.122 0.309
Treatment 5.29 4.587 0.139 0.253
Page 183
174
Intensive Care Unit 1.816 4.294 0.048 0.674
4. Predisposing, Enabling and Need Factors, and Emergency Room Use
B SE Beta Sig.
(Constant) 65.388 71.112 0.361
Age 0.253 0.166 0.187 0.134
Genetic Factors 1.579 5.962 0.03 0.792
Medicaid Eligible 3.324 2.404 2.317 0.172
Population Age 65+ -11.724 4.035 -1.181 0.005
Poverty -5.404 3.853 -2.788 0.166
Uninsured Population -0.809 1.444 -0.367 0.577
Race/Ethnicity - % Black/AA 15.928 14.267 0.941 0.269
Race/Ethnicity - % Hispanic 3.225 2.134 0.441 0.136
Race/Ethnicity - % White 2.098 1.388 1.177 0.136
Cost -0.009 0.004 -0.264 0.032
Comorbidity Index Score 0.506 0.448 0.13 0.263
Complications 4.42 3.905 0.133 0.262
Treatment 4.46 4.565 0.117 0.332
Intensive Care Unit 1.264 4.259 0.033 0.768
Emergency Room -4.362 2.777 -0.188 0.121
Hierarchical multiple regression analysis for hospital length of stay by prostate cancer
patients in Group E (n=1274)
Hospital Group E
1. Predisposing Factors
B SE Beta Sig.
(Constant) -7.315 5.902 0.215
Age 0.006 0.017 0.010 0.729
Genetic Factors -0.605 0.452 -0.038 0.180
Household Income 0.000 0.000 0.038 0.645
Medicaid Eligible -0.061 0.042 -0.104 0.150
Population Age 65+ -0.059 0.105 -0.022 0.574
Poverty 0.089 0.080 0.114 0.268
Uninsured Population 0.084 0.049 0.081 0.090
Race/Ethnicity - % Black/AA 0.097 0.049 0.299 0.048
Race/Ethnicity - % Hispanic 0.105 0.048 0.136 0.029
Race/Ethnicity - % White 0.107 0.052 0.294 0.040
2. Predisposing and Enabling Factors
B SE Beta Sig.
(Constant) -11.530 9.120 0.206
Age 0.009 0.017 0.014 0.615
Genetic Factors -0.628 0.447 -0.039 0.160
Page 184
175
Household Income 0.000 0.000 0.054 0.551
Medicaid Eligible -0.072 0.049 -0.122 0.142
Population Age 65+ -0.032 0.117 -0.012 0.782
Poverty 0.105 0.087 0.133 0.230
Uninsured Population 0.037 0.086 0.036 0.665
Race/Ethnicity - % Black/AA 0.129 0.071 0.399 0.068
Race/Ethnicity - % Hispanic 0.129 0.067 0.166 0.056
Race/Ethnicity - % White 0.136 0.073 0.373 0.062
Cost 0.001 0.000 0.165 0.000
Access to Physicians -0.001 0.007 -0.009 0.844
Rural/Urban -0.035 0.134 -0.011 0.796
Underserved Area 0.012 0.583 0.001 0.983
Geographic Region 0.306 0.418 0.057 0.464
3. Predisposing, Enabling and Need Factors
B SE Beta Sig.
(Constant) -11.617 9.005 0.197
Age 0.008 0.017 0.013 0.638
Genetic Factors -0.623 0.441 -0.039 0.157
Household Income 0 0 0.07 0.438
Medicaid Eligible -0.056 0.048 -0.095 0.245
Population Age 65+ -0.059 0.116 -0.022 0.610
Poverty 0.084 0.086 0.107 0.329
Uninsured Population 0.033 0.084 0.032 0.695
Race/Ethnicity - % Black/AA 0.121 0.069 0.375 0.081
Race/Ethnicity - % Hispanic 0.114 0.066 0.147 0.085
Race/Ethnicity - % White 0.123 0.072 0.338 0.087
Cost 0.001 0 0.176 0.000
Access to Physicians -0.001 0.007 -0.007 0.872
Rural/Urban 0.024 0.132 0.007 0.857
Underserved Area 0.185 0.574 0.011 0.748
Geographic Region 0.254 0.411 0.047 0.537
Comorbidity Index Score 0.238 0.047 0.139 0.000
Complications 0.6 0.5 0.033 0.230
Treatment -0.733 0.518 -0.039 0.157
Intensive Care Unit 1.404 0.352 0.11 0.000
4. Predisposing, Enabling, and Need Factors, and Emergency Room Use
B SE Beta Sig.
(Constant) -9.585 8.99 0.287
Age 0.012 0.017 0.019 0.483
Genetic Factors -0.657 0.439 -0.041 0.134
Household Income 0 0 0.056 0.531
Medicaid Eligible -0.056 0.048 -0.095 0.242
Population Age 65+ -0.07 0.115 -0.027 0.542
Poverty 0.084 0.085 0.107 0.327
Uninsured Population 0.04 0.084 0.038 0.635
Race/Ethnicity - % Black/AA 0.106 0.069 0.328 0.127
Page 185
176
Race/Ethnicity - % Hispanic 0.101 0.066 0.13 0.126
Race/Ethnicity - % White 0.112 0.072 0.306 0.120
Cost 0.001 0 0.173 0.000
Access to Physicians -0.001 0.007 -0.005 0.914
Rural/Urban 0.001 0.132 0 0.996
Underserved Area 0.181 0.572 0.011 0.752
Geographic Region 0.16 0.411 0.03 0.698
Comorbidity Index Score 0.251 0.047 0.147 0.000
Complications 0.517 0.498 0.028 0.300
Treatment -1.202 0.535 -0.064 0.025
Intensive Care Unit 1.468 0.351 0.115 0.000
Emergency Room -0.953 0.285 -0.096 0.001
Hierarchical multiple regression analysis for hospital length of stay by prostate cancer
patients in Group F (n=582)
Hospital Group F
1. Predisposing Factors
B SE Beta Sig.
(Constant) -34.246 148.367 0.818
Age 0.017 0.029 0.024 0.556
Genetic Factors -1.938 0.811 -0.099 0.017
Household Income 0.001 0.002 0.088 0.799
Poverty 1.286 3.571 0.126 0.719
Race/Ethnicity - % Hispanic -0.084 0.556 -0.014 0.879
Race/Ethnicity - % White -0.172 0.123 -0.070 0.163
2. Predisposing and Enabling Factors
B SE Beta Sig.
(Constant) -36.262 145.267 0.803
Age 0.014 0.029 0.019 0.637
Genetic Factors -2.012 0.794 -0.103 0.012
Household Income 0.001 0.002 0.086 0.800
Poverty 1.303 3.497 0.128 0.709
Race/Ethnicity - % Hispanic -0.032 0.545 -0.005 0.953
Race/Ethnicity - % White -0.193 0.121 -0.079 0.110
Cost 0.002 0.000 0.206 0.000
3. Predisposing, Enabling and Need Factors
B SE Beta Sig.
(Constant) 10.278 143.012 0.943
Age 0.031 0.029 0.043 0.293
Genetic Factors -1.548 0.787 -0.079 0.050
Household Income 0 0.002 -0.033 0.920
Page 186
177
Poverty 0.172 3.442 0.017 0.960
Race/Ethnicity - % Hispanic 0.136 0.536 0.022 0.800
Race/Ethnicity - % White -0.177 0.119 -0.072 0.136
Cost 0.002 0 0.216 0.000
Comorbidity Index Score 0.346 0.079 0.178 0.000
Complications 0.24 0.848 0.011 0.777
Treatment -0.579 0.762 -0.031 0.447
Intensive Care Unit 1.034 0.522 0.081 0.048
4. Predisposing, Enabling and Need Factors, and Emergency Room Use
B SE Beta Sig.
(Constant) 42.485 142.606 0.766
Age 0.045 0.029 0.063 0.128
Genetic Factors -1.391 0.784 -0.071 0.077
Household Income -0.001 0.002 -0.112 0.737
Poverty -0.639 3.434 -0.063 0.852
Race/Ethnicity - % Hispanic 0.245 0.534 0.04 0.647
Race/Ethnicity - % White -0.142 0.119 -0.058 0.232
Cost 0.002 0 0.215 0.000
Comorbidity Index Score 0.372 0.079 0.192 0.000
Complications 0.167 0.843 0.008 0.843
Treatment -1.099 0.78 -0.059 0.159
Intensive Care Unit 1.154 0.521 0.09 0.027
Emergency Room -1.334 0.473 -0.119 0.005
Hierarchical multiple regression analysis for hospital length of stay by prostate cancer
patients in Group G (n=1001)
Hospital Group G
1. Predisposing Factors
B SE Beta Sig.
(Constant) -5.806 7.214 0.421
Age 0.032 0.023 0.043 0.171
Genetic Factors -1.116 0.622 -0.057 0.073
Average Household Income 0.000 0.000 0.116 0.329
Medicaid Eligible 0.027 0.057 0.028 0.636
Population Age 65+ -0.120 0.103 -0.045 0.245
Poverty 0.031 0.123 0.026 0.802
Uninsured Population 0.212 0.080 0.152 0.008
Race/Ethnicity - % Black/AA 0.003 0.032 0.006 0.928
Race/Ethnicity - % Hispanic -0.007 0.027 -0.015 0.781
Race/Ethnicity - % White 0.044 0.035 0.093 0.213
2. Predisposing and Enabling Factors
B SE Beta Sig.
Page 187
178
(Constant) -1.807 8.458 0.831
Age 0.035 0.023 0.048 0.118
Genetic Factors -1.004 0.606 -0.051 0.098
Household Income 0.000 0.000 0.177 0.203
Medicaid Eligible 0.020 0.063 0.021 0.751
Population Age 65+ -0.124 0.104 -0.047 0.237
Poverty 0.169 0.156 0.143 0.280
Uninsured Population 0.286 0.091 0.205 0.002
Race/Ethnicity - % Black/AA -0.084 0.038 -0.183 0.028
Race/Ethnicity - % Hispanic -0.091 0.039 -0.184 0.019
Race/Ethnicity - % White -0.022 0.040 -0.045 0.591
Cost 0.002 0.000 0.203 0.000
Access to Physicians -0.014 0.014 -0.045 0.319
Rural/Urban -0.079 0.296 -0.016 0.789
Geographic Region -0.861 0.231 -0.174 0.000
3. Predisposing, Enabling and Need Factors
B SE Beta Sig.
(Constant) -5.64 8.182 0.491
Age 0.044 0.022 0.06 0.044
Genetic Factors -0.682 0.586 -0.035 0.245
Household Income 0 0 0.187 0.164
Medicaid Eligible -0.008 0.061 -0.008 0.893
Population Age 65+ -0.095 0.101 -0.036 0.347
Poverty 0.215 0.151 0.183 0.154
Uninsured Population 0.263 0.088 0.189 0.003
Race/Ethnicity - % Black/AA -0.069 0.037 -0.149 0.064
Race/Ethnicity - % Hispanic -0.084 0.037 -0.172 0.024
Race/Ethnicity - % White -0.017 0.039 -0.037 0.654
Cost 0.002 0 0.226 0.000
Access to Physicians -0.018 0.014 -0.059 0.177
Rural/Urban -0.123 0.286 -0.024 0.667
Geographic Region -0.756 0.225 -0.153 0.001
Comorbidity Index Score 0.399 0.063 0.191 0.000
Complications -0.676 0.622 -0.033 0.278
Treatment 0.636 0.655 0.029 0.332
Intensive Care Unit 2.328 0.409 0.172 0.000
4. Predisposing, Enabling and Need Factors, and Emergency Room Use
B SE Beta Sig.
(Constant) -5.321 8.166 0.515
Age 0.04 0.022 0.054 0.072
Genetic Factors -0.656 0.585 -0.033 0.263
Household Income 0 0 0.183 0.173
Medicaid Eligible -0.014 0.061 -0.015 0.815
Population Age 65+ -0.099 0.101 -0.037 0.328
Poverty 0.214 0.15 0.182 0.156
Uninsured Population 0.257 0.088 0.185 0.003
Page 188
179
Race/Ethnicity - % Black/AA -0.067 0.037 -0.146 0.071
Race/Ethnicity - % Hispanic -0.085 0.037 -0.173 0.022
Race/Ethnicity - % White -0.017 0.039 -0.037 0.652
Cost 0.002 0 0.228 0.000
Access to Physicians -0.02 0.014 -0.065 0.137
Rural/Urban -0.107 0.286 -0.021 0.707
Geographic Region -0.718 0.225 -0.145 0.001
Comorbidity Index Score 0.38 0.063 0.182 0.000
Complications -0.738 0.621 -0.036 0.235
Treatment 1.014 0.675 0.047 0.133
Intensive Care Unit 2.235 0.411 0.165 0.000
Emergency Room 0.844 0.377 0.071 0.025
Page 189
180
APPENDIX F: SUBSET ANALYSIS LOGISTIC REGRESSION RESULTS
Page 190
181
Hierarchical logistic regression analysis for emergency room utilization by all prostate
cancer patients in subset analysis (n = 555)
All Patients
1. Predisposing Factors
B S.E. Sig. OR 95% CI for OR
Lower Upper
Age 0.047 0.011 0.000 1.048 1.025 1.071
Genetic Factors -0.283 0.29 0.329 0.753 0.427 1.33
Population Age 65+ -0.144 0.072 0.045 0.866 0.752 0.997
Poverty 0.008 0.023 0.747 1.008 0.962 1.055
Race/Ethnicity - % Black/AA -0.002 0.026 0.946 0.998 0.948 1.051
Race/Ethnicity - % Hispanic -0.005 0.009 0.579 0.995 0.977 1.013
Race/Ethnicity - % White 0.007 0.015 0.664 1.007 0.977 1.037
Constant -2.008 1.452 0.167 0.134
2. Predisposing and Enabling Factors
B S.E. Sig. OR 95% CI for OR
Lower Upper
Age 0.049 0.011 0.000 1.05 1.027 1.074
Genetic Factors -0.188 0.299 0.528 0.828 0.461 1.487
Population Age 65+ -0.121 0.113 0.284 0.886 0.709 1.106
Poverty -0.017 0.073 0.813 0.983 0.852 1.134
Race/Ethnicity - % Black/AA 0.001 0.059 0.985 1.001 0.891 1.124
Race/Ethnicity - % Hispanic -0.007 0.019 0.706 0.993 0.957 1.03
Race/Ethnicity - % White 0.003 0.032 0.930 1.003 0.942 1.068
Cost 0.00 0.00 0.094 1.00 0.999 1.00
Access to Physicians -0.008 0.018 0.664 0.992 0.957 1.028
Rural/ Urban 1 0.972
Rural/ Urban 2 0.511 0.681 0.454 1.666 0.438 6.335
Rural/ Urban 3 0.275 0.685 0.689 1.316 0.343 5.042
Rural/ Urban 4 0.052 1.141 0.964 1.053 0.112 9.861
Rural/ Urban 5 -0.066 0.819 0.936 0.936 0.188 4.665
Rural/ Urban 6 -0.584 1.18 0.620 0.558 0.055 5.627
Rural/ Urban 7 -0.463 0.982 0.637 0.629 0.092 4.315
Rural/ Urban 8 -20.363 40192.97 1.000 0.00 0.00 .
Underserved Area - No 0.836
Underserved Area -All -0.404 1.552 0.795 0.668 0.032 13.992
Underserved Area - Part -0.074 1.565 0.962 0.929 0.043 19.956
Geographic Area-E S Central 0.543
Geographic Area-W S Central 1.497 1.683 0.374 4.47 0.165 120.917
Geographic Area-Mountain 0.372 1.725 0.829 1.45 0.049 42.633
Geographic Area-Pacific 1.025 1.697 0.546 2.786 0.1 77.472
Hospital Size-Small 0.255
Hospital Size-Medium 0.039 0.275 0.888 1.039 0.607 1.78
Hospital Size-Large 0.471 0.345 0.173 1.602 0.814 3.153
Page 191
182
Hospital Type-Government 0.140
Hospital Type-Non Profit -0.505 0.256 0.048 0.603 0.366 0.996
Hospital Type-For Profit -0.276 0.329 0.400 0.759 0.398 1.444
Hospital Cancer Program -0.018 0.283 0.949 0.982 0.564 1.708
Hospital Resident Training -0.491 0.449 0.275 0.612 0.254 1.477
Constant -1.477 4.908 0.764 0.228
3. Predisposing, Enabling and Need Factors
B S.E. Sig. OR 95% CI for OR
Lower Upper
Age 0.048 0.013 0.000 1.050 1.023 1.076
Genetic Factors -0.135 0.329 0.680 0.873 0.458 1.664
Population Age 65+ -0.184 0.12 0.123 0.832 0.658 1.051
Poverty 0.028 0.081 0.725 1.029 0.878 1.205
Race/Ethnicity - % Black/AA 0.007 0.062 0.906 1.007 0.893 1.137
Race/Ethnicity - % Hispanic -0.011 0.02 0.592 0.989 0.951 1.029
Race/Ethnicity - % White 0.02 0.034 0.563 1.020 0.954 1.09
Cost 0 0 0.856 1.000 1.000 1.000
Access to Physicians -0.006 0.019 0.766 0.994 0.958 1.032
Rural/ Urban 1 0.957
Rural/ Urban 2 0.431 0.752 0.566 1.539 0.353 6.712
Rural/ Urban 3 0.285 0.754 0.705 1.330 0.304 5.826
Rural/ Urban 4 -0.052 1.211 0.966 0.950 0.089 10.187
Rural/ Urban 5 -0.28 0.92 0.761 0.756 0.124 4.588
Rural/ Urban 6 -0.589 1.213 0.627 0.555 0.051 5.974
Rural/ Urban 7 -0.72 1.119 0.520 0.487 0.054 4.360
Rural/ Urban 8 -20.931 40192.97 1.000 0.000 0.000 .
Underserved Area - No 0.616
Underserved Area -All -0.253 1.553 0.871 0.776 0.037 16.303
Underserved Area - Part 0.373 1.573 0.813 1.452 0.067 31.691
Geographic Area-E S Central 0.467
Geographic Area-W S Central 1.305 1.73 0.450 3.689 0.124 109.458
Geographic Area-Mountain 0.731 1.782 0.682 2.077 0.063 68.212
Geographic Area-Pacific 1.553 1.751 0.375 4.727 0.153 146.316
Hospital Size-Small 0.176
Hospital Size-Medium 0.053 0.303 0.862 1.054 0.582 1.91
Hospital Size-Large 0.574 0.375 0.127 1.775 0.85 3.704
Hospital Type-Government 0.047
Hospital Type-Non Profit -0.702 0.285 0.014 0.495 0.283 0.866
Hospital Type-For Profit -0.401 0.368 0.276 0.670 0.326 1.377
Hospital Cancer Program 0.045 0.307 0.884 1.046 0.573 1.907
Hospital Resident Training -0.462 0.486 0.342 0.630 0.243 1.634
Comorbidity Index Score 2 0.374
Comorbidity Index Score 3 0.34 0.446 0.446 1.405 0.586 3.371
Comorbidity Index Score 4 0.43 0.353 0.222 1.538 0.770 3.069 Comorbidity Index Score 5 0.681 0.591 0.249 1.977 0.620 6.297
Comorbidity Index Score 6 -0.151 1.477 0.918 0.860 0.048 15.555
Page 192
183
Comorbidity Index Score 7 -21.767 40192.97 1.000 0.000 0.000 .
Comorbidity Index Score 8 0.432 0.268 0.108 1.540 0.910 2.605
Comorbidity Index Score 9 0.803 0.569 0.158 2.233 0.732 6.811
Comorbidity Index Score 10 1.067 0.5 0.033 2.906 1.092 7.739
Complications -0.06 0.35 0.864 0.942 0.474 1.872
Treatment -3.132 0.502 0.000 0.044 0.016 0.117
Intensive Care Unit 0.02 0.242 0.935 1.020 0.634 1.640
Constant -3.333 5.151 0.518 0.036
Hierarchical logistic regression analysis for emergency room utilization by prostate cancer
patients in Group A in subset analysis (n = 206)
Emergency Room Subset Group A
1. Predisposing Factors
B S.E. Sig. OR 95% CI for OR
Lower Upper
Age 0.076 0.085 0.373 1.079 0.913 1.275
Genetic Factors -0.91 0.788 0.248 0.402 0.086 1.886
Population Age 65+ 0.002 0.152 0.988 1.002 0.744 1.351
Poverty 0.116 0.08 0.150 1.123 0.959 1.314
Race/Ethnicity - % Black/AA 0.261 0.169 0.123 1.298 0.932 1.806
Race/Ethnicity - % Hispanic 0.014 0.019 0.448 1.014 0.978 1.053
Race/Ethnicity - % White 0.051 0.043 0.238 1.053 0.967 1.146
Constant -13.216 9.443 0.162 0
2. Predisposing and Enabling Factors
B S.E. Sig. OR 95% CI for OR
Lower Upper
Age 0.097 0.105 0.354 1.102 0.897 1.355
Genetic Factors -0.944 0.945 0.318 0.389 0.061 2.479
Population Age 65+ -13.711 3744.722 0.997 0.00 0.00 .
Poverty 15.113 1970.433 0.994 3661154.987 0.00 .
Race/Ethnicity - % Black/AA 31.325 3760.155 0.993 4.01879E+13 0.00 .
Race/Ethnicity - % Hispanic -0.759 338.08 0.998 0.468 0.00 2.79E+287
Race/Ethnicity - % White 9.371 1297.91 0.994 11737.722 0.00 .
Cost -0.002 0.001 0.021 0.998 0.997 1.00
Access to Physicians -2.595 613.821 0.997 0.075 0 .
Rural/ Urban 1 1.000
Rural/ Urban 2 -114.67 15388.092 0.994 0.00 0.00 .
Rural/ Urban 3 -84.73 13574.242 0.995 0.00 0.00 .
Rural/ Urban 4 -91.22 24445.615 0.997 0.00 0.00 .
Page 193
184
Rural/ Urban 5 -49.459 6800.114 0.994 0.00 0.00 .
Rural/ Urban 6 12.24 30099.12 1.000 206867.234 0.00 .
Rural/ Urban 7 225.722 50497.53 0.996 1.07E+98 0.00 .
Underserved Area - No 63.012 8808.757 0.994 2.32122E+27 0.00 .
Geographic Area-E S Central 1.000
Geographic Area-W S Central 230.875 144110.367 0.999 1.85E+100 0.00 .
Geographic Area-Mountain 589.519 155726.251 0.997 1.06E+256 0.00 .
Geographic Area-Pacific 478.452 147888.143 0.997 6.15E+207 0.00 .
Hospital Size-Small 0.181
Hospital Size-Medium 0.125 0.77 0.871 1.134 0.251 5.128
Hospital Size-Large 1.794 1.211 0.138 6.016 0.56 64.608
Hospital Type-Government 0.106
Hospital Type-Non Profit -1.742 0.83 0.036 0.175 0.034 0.891
Hospital Type-For Profit -0.861 0.911 0.345 0.423 0.071 2.521
Hospital Cancer Program -0.608 0.856 0.477 0.544 0.102 2.913
Hospital Resident Training 17.645 3055.407 0.995 46025655.52 0.00 .
Constant -1125.045 200654.291 0.996 0
3. Predisposing, Enabling and Need Factors
B S.E. Sig. OR 95% CI for OR
Lower Upper
Age 0.002 0.038 0.959 1.002 0.93 1.08
Genetic Factors -0.414 0.577 0.473 0.661 0.213 2.048
Population Age 65+ 0.087 0.257 0.736 1.09 0.659 1.805
Poverty 0.194 0.271 0.474 1.214 0.714 2.064
Race/Ethnicity - % Black/AA 0.68 0.631 0.281 1.974 0.573 6.8
Race/Ethnicity - % Hispanic 0.013 0.061 0.832 1.013 0.899 1.142
Race/Ethnicity - % White 0.155 0.195 0.427 1.167 0.797 1.71
Cost 0.000 0.000 0.904 1.000 0.999 1.001
Access to Physicians -0.072 0.058 0.215 0.93 0.83 1.043
Rural/ Urban 1 0.92
Rural/ Urban 2 -0.302 1.621 0.852 0.739 0.031 17.724
Rural/ Urban 3 -1.653 1.912 0.387 0.191 0.005 8.120
Rural/ Urban 4 -2.349 2.782 0.398 0.095 0.000 22.273
Rural/ Urban 5 1.696 1.55 0.274 5.452 0.261 113.78
Rural/ Urban 6 -2.076 2.684 0.439 0.125 0.001 24.184
Rural/ Urban 7 -21.694 24776.67 0.999 0.000 0.000 .
Underserved Area - No 0.519
Geographic Area-E S Central 0.369
Geographic Area-W S Central
Geographic Area-Mountain -30.78 40192.97 0.999 0.000 0.000 .
Geographic Area-Pacific -1.904 1.349 0.158 0.149 0.011 2.095
Hospital Size-Small 0.59
Hospital Size-Medium 0.244 0.605 0.687 1.276 0.390 4.173
Hospital Size-Large 0.657 0.692 0.343 1.929 0.496 7.491
Page 194
185
Hospital Type-Government 0.555
Hospital Type-Non Profit -0.552 0.523 0.291 0.576 0.206 1.606
Hospital Type-For Profit -0.613 0.755 0.416 0.542 0.123 2.377
Hospital Cancer Program 0.365 0.561 0.516 1.440 0.479 4.327
Hospital Resident Training -0.389 0.875 0.656 0.678 0.122 3.763
Comorbidity Index Score 2 0.572
Comorbidity Index Score 3 0.041 0.619 0.947 1.042 0.310 3.501
Comorbidity Index Score 4 -0.964 0.734 0.189 0.382 0.091 1.608
Comorbidity Index Score 5 0.523 1.01 0.605 1.687 0.233 12.226
Comorbidity Index Score 6 -21.41 40192.97 1 0.000 0.000 .
Comorbidity Index Score 8 0.063 0.438 0.885 1.065 0.451 2.515
Comorbidity Index Score 9 0.043 0.993 0.965 1.044 0.149 7.314
Comorbidity Index Score 10 1.227 0.714 0.086 3.411 0.842 13.819
Complications 0.176 0.498 0.724 1.192 0.449 3.164
Treatment -3.199 0.807 0 0.041 0.008 0.198
Intensive Care Unit 0.031 0.421 0.941 1.032 0.452 2.354
Constant -25.262 32.898 0.443 0.000
Hierarchical logistic regression analysis for emergency room utilization by prostate cancer
patients in Group B in subset analysis (n = 238)
Emergency Room Subset Group B
1. Predisposing Factors
B S.E. Sig. OR 95% CI for OR
Lower Upper
Age 0.098 0.049 0.046 1.103 1.002 1.215
Genetic Factors 0.018 0.433 0.967 1.018 0.435 2.38
Population Age 65+ -0.161 0.119 0.174 0.851 0.675 1.074
Poverty 0.057 0.039 0.143 1.059 0.981 1.142
Race/Ethnicity - % Black/AA -0.034 0.041 0.406 0.967 0.892 1.047
Race/Ethnicity - % Hispanic -0.028 0.016 0.087 0.973 0.943 1.004
Race/Ethnicity - % White -0.007 0.027 0.788 0.993 0.942 1.046
Constant -5.088 4.387 0.246 0.006
2. Predisposing and Enabling Factors
B S.E. Sig. OR 95% CI for OR
Lower Upper
Age 0.109 0.053 0.041 1.115 1.005 1.237
Genetic Factors 0.203 0.475 0.670 1.225 0.483 3.107
Population Age 65+ -0.357 0.258 0.167 0.7 0.422 1.161
Poverty -0.068 0.211 0.748 0.934 0.618 1.413
Race/Ethnicity - % Black/AA 0.207 0.439 0.637 1.23 0.521 2.906
Page 195
186
Race/Ethnicity - % Hispanic -0.007 0.044 0.868 0.993 0.911 1.082
Race/Ethnicity - % White 0.08 0.13 0.536 1.084 0.84 1.397
Cost 0.00 0.00 0.361 1.00 0.999 1.00
Access to Physicians 0.015 0.03 0.614 1.015 0.957 1.078
Rural/ Urban 1 0.950
Rural/ Urban 2 1.619 1.606 0.313 5.05 0.217 117.51
Rural/ Urban 3 1.156 1.453 0.427 3.176 0.184 54.821
Rural/ Urban 4 23.067 40192.97 1.000 1041535597 0.00 .
Rural/ Urban 5 -0.564 1.457 0.699 0.569 0.033 9.899
Rural/ Urban 6 0.232 2.162 0.915 1.261 0.018 87.224
Rural/ Urban 7 0.327 1.717 0.849 1.386 0.048 40.127
Underserved Area - No 0.947
Underserved Area -All -2.847 56842.541 1.000 0.058 0.00 .
Underserved Area - Part -3.33 56842.541 1.000 0.036 0.00 .
Geographic Area-E S Central 1.000
Geographic Area-W S Central 45.537 46229.393 0.999 5.97403E+19 0.00 .
Geographic Area-Mountain 29.32 22839.878 0.999 5.4152E+12 0.00 .
Geographic Area-Pacific 29.365 22839.878 0.999 5.66478E+12 0.00 .
Hospital Size-Small 0.454
Hospital Size-Medium 0.217 0.447 0.627 1.242 0.517 2.983
Hospital Size-Large 0.695 0.587 0.236 2.004 0.635 6.331
Hospital Type-Government 0.219
Hospital Type-Non Profit -0.624 0.434 0.151 0.536 0.229 1.255
Hospital Type-For Profit 0.072 0.511 0.888 1.074 0.395 2.925
Hospital Cancer Program -0.136 0.443 0.759 0.873 0.366 2.081
Hospital Resident Training -1.269 0.747 0.089 0.281 0.065 1.214
Constant -36.459 61259.267 1.000 0.00
3. Predisposing, Enabling and Need Factors
B S.E. Sig. OR 95% CI for OR
Lower Upper
Age 0.097 0.063 0.124 1.102 0.974 1.246
Genetic Factors 0.537 0.589 0.362 1.711 0.539 5.431
Population Age 65+ -0.568 0.312 0.068 0.566 0.307 1.043
Poverty 0.009 0.29 0.977 1.009 0.571 1.78
Race/Ethnicity - % Black/AA 0.189 0.575 0.743 1.208 0.391 3.731
Race/Ethnicity - % Hispanic 0.001 0.054 0.98 1.001 0.902 1.112
Race/Ethnicity - % White 0.120 0.178 0.499 1.128 0.796 1.597
Cost 0.000 0.000 0.655 1.000 0.999 1.000
Access to Physicians 0.038 0.037 0.31 1.038 0.965 1.117
Rural/ Urban 1 0.963
Rural/ Urban 2 1.229 2.059 0.551 3.417 0.06 193.234
Rural/ Urban 3 1.068 1.827 0.559 2.909 0.081 104.415
Rural/ Urban 4 23.471 40192.97 1 1.6E+10 0 .
Rural/ Urban 5 -1.389 1.921 0.47 0.249 0.006 10.773 Rural/ Urban 6 1.245 2.418 0.607 3.473 0.03 397.388
Rural/ Urban 7 -0.014 2.318 0.995 0.986 0.01 92.64
Page 196
187
Underserved Area - No 0.989
Underserved Area -All -3.263 56841.76 1 0.038 0.000 .
Underserved Area - Part -2.967 56841.76 1 0.051 0.000 .
Geographic Area-E S Central 0.977
Geographic Area-W S Central 45.239 46352.12 0.999 4.4E+19 0.000 .
Geographic Area-Mountain 29.158 23086.97 0.999 4.6E+12 0.000 .
Geographic Area-Pacific 28.361 23086.97 0.999 2.1E+12 0.000 .
Hospital Size-Small 0.272
Hospital Size-Medium 0.465 0.541 0.39 1.592 0.552 4.598
Hospital Size-Large 1.112 0.702 0.113 3.04 0.769 12.027
Hospital Type-Government 0.102
Hospital Type-Non Profit -1.042 0.513 0.042 0.353 0.129 0.964
Hospital Type-For Profit -0.271 0.602 0.653 0.763 0.234 2.484
Hospital Cancer Program -0.301 0.517 0.56 0.74 0.268 2.039
Hospital Resident Training -0.906 0.84 0.281 0.404 0.078 2.095
Comorbidity Index Score 2 0.733
Comorbidity Index Score 3 1.287 1.066 0.227 3.623 0.449 29.253
Comorbidity Index Score 4 1.091 0.63 0.083 2.976 0.866 10.229
Comorbidity Index Score 5 20.999 21607.38 0.999 1.3E+09 0 .
Comorbidity Index Score 6 21.788 40192.97 1 2.9E+09 0 .
Comorbidity Index Score 8 0.272 0.451 0.547 1.312 0.542 3.174
Comorbidity Index Score 9 0.205 0.838 0.807 1.227 0.237 6.345
Comorbidity Index Score 10 0.612 0.763 0.422 1.845 0.414 8.223
Complications -0.337 0.679 0.620 0.714 0.189 2.705
Treatment -22.239 7461.696 0.998 0.000 0.000 .
Intensive Care Unit 0.147 0.415 0.724 1.158 0.513 2.611
Constant -37.059 61351.737 1.000 0.000
Hierarchical logistic regression analysis for emergency room utilization by prostate cancer
patients in Group C in subset analysis (n = 112)
Emergency Room Subset Group C
1. Predisposing Factors
B S.E. Sig. OR 95% CI for OR
Lower Upper
Age -0.01 0.032 0.750 0.99 0.931 1.053
Genetic Factors -0.359 0.476 0.451 0.699 0.275 1.776
Population Age 65+ -0.152 0.13 0.244 0.859 0.666 1.109
Poverty -0.039 0.043 0.360 0.962 0.885 1.046
Race/Ethnicity - % Black/AA -0.034 0.063 0.582 0.966 0.855 1.092
Race/Ethnicity - % Hispanic -0.002 0.015 0.906 0.998 0.968 1.029
Race/Ethnicity - % White -0.004 0.028 0.882 0.996 0.942 1.053
Page 197
188
Constant 3.6 3.097 0.245 36.596
2. Predisposing and Enabling Factors
B S.E. Sig. OR 95% CI for OR
Lower Upper
Age -0.005 0.035 0.884 0.995 0.929 1.065
Genetic Factors -0.39 0.523 0.456 0.677 0.243 1.888
Population Age 65+ 0.098 0.247 0.692 1.103 0.68 1.789
Poverty 0.065 0.242 0.789 1.067 0.664 1.713
Race/Ethnicity - % Black/AA 0.284 0.579 0.624 1.328 0.427 4.133
Race/Ethnicity - % Hispanic 0.009 0.057 0.876 1.009 0.902 1.129
Race/Ethnicity - % White 0.041 0.18 0.819 1.042 0.732 1.484
Cost 0.00 0.00 0.188 1.00 0.999 1.00
Access to Physicians -0.047 0.054 0.386 0.954 0.857 1.061
Rural/ Urban 1 0.906
Rural/ Urban 2 -0.054 1.427 0.970 0.948 0.058 15.531
Rural/ Urban 3 -0.959 1.747 0.583 0.383 0.012 11.767
Rural/ Urban 4 -0.785 2.563 0.759 0.456 0.003 69.227
Rural/ Urban 5 2.00 1.448 0.167 7.387 0.432 126.206
Rural/ Urban 6 -1.627 2.54 0.522 0.197 0.001 28.531
Rural/ Urban 7 -20.949 28319.02 0.999 0.00 0.00 .
Rural/ Urban 8 -28.739 40192.97 0.999 0.00 0.00 .
Underserved Area - No 0.640
Underserved Area -All 3.533 10.455 0.735 34.231 0.00 271301398
Underserved Area - Part 4.868 11.6 0.675 130.076 0.00 9.72684E+1
Geographic Area-E S Central 0.841
Geographic Area-W S Central -26.653 40192.97 0.999 0.00 0.00 .
Geographic Area-Pacific -0.704 1.198 0.557 0.494 0.047 5.176
Hospital Size-Small 0.724
Hospital Size-Medium -0.031 0.509 0.951 0.969 0.358 2.626
Hospital Size-Large 0.323 0.588 0.583 1.382 0.436 4.379
Hospital Type-Government 0.729
Hospital Type-Non Profit -0.201 0.441 0.648 0.818 0.345 1.94
Hospital Type-For Profit -0.494 0.623 0.428 0.61 0.18 2.072
Hospital Cancer Program 0.448 0.488 0.358 1.565 0.602 4.074
Hospital Resident Training -0.209 0.806 0.795 0.811 0.167 3.939
Constant -6.957 30.25 0.818 0.001
3. Predisposing, Enabling and Need Factors
B S.E. Sig. OR 95% CI for OR
Lower Upper
Age 0.157 0.129 0.225 1.17 0.908 1.507
Genetic Factors -0.883 1.09 0.418 0.414 0.049 3.505
Population Age 65+ -14.539 3867.844 0.997 0.000 0.000 .
Poverty 15.163 2048.802 0.994 3846676.88 0.000 .
Race/Ethnicity - % Black/AA 31.415 3902.396 0.994 4.3999E+13 0.000 .
Race/Ethnicity - % Hispanic -0.727 350.063 0.998 0.483 0.000 5.E+297
Race/Ethnicity - % White 9.521 1341.597 0.994 13643.8 0.000 .
Page 198
189
Cost -0.001 0.001 0.166 0.999 0.997 1.001
Access to Physicians -2.492 637.669 0.997 0.083 0.000 .
Rural/ Urban 1 1.000
Rural/ Urban 2 -114.286 15983.12 0.994 0.000 0.000 .
Rural/ Urban 3 -81.991 14154.48 0.995 0.000 0.000 .
Rural/ Urban 4 -85.336 25452.51 0.997 0.000 0.000 .
Rural/ Urban 5 -51.885 7040.902 0.994 0.000 0.000 .
Rural/ Urban 6 18.593 31193.19 1.000 118846630 0.000 .
Rural/ Urban 7 228.494 51136.8 0.996 1.71E+99 0.000 .
Rural/ Urban 8
Underserved Area - No 62.303 9172.969 0.995 1.1424E+27 0.000 .
Underserved Area -All
Underserved Area - Part
Geographic Area-E S Central 1.000
Geographic Area-W S Central 232.332 118347.8 0.998 7.95E+100 0.000 .
Geographic Area-Pacific 596.384 133570.9 0.996 1.02E+259 0.000 .
Hospital Size-Small 480.865 123768.6 0.997 6.87E+208 0.000 .
Hospital Size-Medium 0.167
Hospital Size-Large 0.33 0.948 0.728 1.391 0.217 8.912
Hospital Type-Government 2.254 1.446 0.119 9.525 0.56 162.015
Hospital Type-Non Profit 0.114
Hospital Type-For Profit -2.157 1.037 0.038 0.116 0.015 0.884
Hospital Cancer Program -0.924 1.022 0.366 0.397 0.054 2.939
Hospital Resident Training -0.067 0.935 0.942 0.935 0.150 5.837
Comorbidity Index Score 2 16.99 3185.209 0.996 23913395.6 0.000 .
Comorbidity Index Score 3 0.966
Comorbidity Index Score 4 0.019 1.54 0.990 1.019 0.05 20.843
Comorbidity Index Score 5 1.378 1.205 0.253 3.967 0.374 42.106
Comorbidity Index Score 6 -0.159 1.077 0.883 0.853 0.103 7.037
Comorbidity Index Score 8 -18.4 40192.97 1.000 0.000 0.000 .
Comorbidity Index Score 9 0.796 0.988 0.420 2.217 0.32 15.374
Comorbidity Index Score 10 17.286 40192.97 1.000 32158943 0.000 .
Complications 0.33 1.89 0.861 1.391 0.034 56.516
Treatment -3.298 1.499 0.028 0.037 0.002 0.698
Intensive Care Unit 0.211 0.847 0.804 1.235 0.235 6.499
Constant -1142.71 187269.2 0.995 0.000
Page 199
190
APPENDIX G: SUBSET ANALYSIS MULTIPLE REGRESSION RESULTS
Page 200
191
Hierarchical multiple regression analysis for hospital length of stay by all prostate cancer
patients in subset analysis (n=555)
All Patients
1. Predisposing Factors
B SE Beta Sig.
(Constant) -0.344 3.245 0.916
Age 0.010 0.024 0.018 0.670
Genetic Factors -1.358 0.656 -0.087 0.039
Population Age 65+ 0.099 0.155 0.049 0.522
Poverty -0.026 0.052 -0.025 0.614
Race/Ethnicity - % Black/AA 0.104 0.059 0.107 0.081
Race/Ethnicity - % Hispanic 0.056 0.020 0.191 0.006
Race/Ethnicity - % White 0.013 0.033 0.034 0.703
2. Predisposing and Enabling Factors
B SE Beta Sig.
(Constant) -0.359 10.560 0.973
Age 0.007 0.024 0.012 0.778
Genetic Factors -1.431 0.654 -0.092 0.029
Population Age 65+ 0.058 0.166 0.029 0.725
Poverty -0.056 0.074 -0.054 0.451
Race/Ethnicity - % Black/AA 0.137 0.093 0.142 0.138
Race/Ethnicity - % Hispanic -0.024 0.034 -0.083 0.474
Race/Ethnicity - % White -0.020 0.045 -0.051 0.663
Cost -0.001 0.000 -0.055 0.195
Access to Physician -0.052 0.027 -0.181 0.055
Rural/Urban -0.358 0.263 -0.107 0.173
Underserved Area -1.681 0.793 -0.154 0.034
Geographic Region 1.268 0.869 0.117 0.145
Hospital Size 1.052 0.362 0.192 0.004
Hospital Type -0.128 0.329 -0.017 0.699
Hospital Cancer Program -1.366 0.614 -0.143 0.026
Hospital Resident Training 0.638 0.961 0.030 0.507
3. Predisposing, Enabling and Need Factors
B SE Beta Sig.
(Constant) -2.794 10.512 0.79
Age 0.007 0.025 0.012 0.778
Genetic Factors -1.372 0.649 -0.088 0.035
Population Age 65+ 0.085 0.165 0.042 0.608
Poverty -0.028 0.075 -0.027 0.706
Race/Ethnicity - % Black/AA 0.135 0.092 0.139 0.143
Race/Ethnicity - % Hispanic -0.025 0.034 -0.085 0.464
Race/Ethnicity - % White -0.014 0.044 -0.037 0.754 Cost 0.000 0.000 -0.027 0.522
Access to Physician -0.053 0.027 -0.185 0.047
Page 201
192
Rural/Urban -0.420 0.261 -0.125 0.108
Underserved Area -1.407 0.795 -0.129 0.077
Geographic Region 1.313 0.863 0.121 0.129
Hospital Size 0.998 0.360 0.182 0.006
Hospital Type -0.054 0.332 -0.007 0.872
Hospital Cancer Program -1.330 0.609 -0.139 0.029
Hospital Resident Training 0.587 0.955 0.028 0.539
Comorbidity Index Score 0.154 0.071 0.093 0.031
Complications 0.483 0.688 0.03 0.483
Treatment -1.530 0.625 -0.107 0.015
Intensive Care Unit 0.401 0.501 0.034 0.424
4. Predisposing, Enabling and Need Factors, and Emergency Room Use
B SE Beta Sig.
(Constant) -4.626 10.466 0.659
Age 0.018 0.025 0.031 0.473
Genetic Factors -1.424 0.645 -0.092 0.028
Population Age 65+ 0.056 0.165 0.027 0.735
Poverty -0.010 0.075 -0.01 0.891
Race/Ethnicity - % Black/AA 0.143 0.091 0.148 0.117
Race/Ethnicity - % Hispanic -0.027 0.034 -0.094 0.419
Race/Ethnicity - % White -0.007 0.044 -0.018 0.878
Cost 0.000 0.000 -0.028 0.507
Access to Physician -0.055 0.027 -0.194 0.037
Rural/Urban -0.469 0.260 -0.14 0.072
Underserved Area -1.237 0.793 -0.113 0.119
Geographic Region 1.467 0.859 0.135 0.088
Hospital Size 1.044 0.358 0.19 0.004
Hospital Type -0.111 0.330 -0.015 0.736
Hospital Cancer Program -1.356 0.605 -0.141 0.026
Hospital Resident Training 0.504 0.949 0.024 0.596
Comorbidity Index Score 0.176 0.071 0.107 0.014
Complications 0.478 0.684 0.03 0.485
Treatment -2.142 0.658 -0.149 0.001
Intensive Care Unit 0.405 0.498 0.035 0.417
Emergency Room -1.206 0.430 -0.128 0.005
Page 202
193
Hierarchical multiple regression analysis for hospital length of stay by all prostate cancer
patients in Group A in subset analysis (n=205)
Hospital Subset Group A
1. Predisposing Factors
B SE Beta Sig.
(Constant) 1.975 4.064 0.627
Age -0.002 0.029 -0.005 0.948
Genetic Factors -1.327 0.791 -0.119 0.095
Population Age 65+ 0.040 0.137 0.032 0.771
Poverty -0.038 0.062 -0.050 0.545
Race/Ethnicity - % Black/AA 0.089 0.050 0.192 0.076
Race/Ethnicity - % Hispanic 0.016 0.057 0.029 0.785
Race/Ethnicity - % White 0.018 0.030 0.091 0.542
2. Predisposing and Enabling Factors
B SE Beta Sig.
(Constant) 2.918 9.358 0.756
Age 0.005 0.028 0.012 0.862
Genetic Factors -1.210 0.753 -0.109 0.110
Population Age 65+ -0.016 0.143 -0.013 0.911
Poverty -0.210 0.100 -0.275 0.037
Race/Ethnicity - % Black/AA 0.184 0.076 0.398 0.016
Race/Ethnicity - % Hispanic -0.116 0.067 -0.220 0.083
Race/Ethnicity - % White -0.059 0.038 -0.294 0.126
Cost -0.001 0.001 -0.084 0.215
Access to Physician -0.077 0.025 -0.415 0.003
Rural/Urban -0.440 0.235 -0.242 0.063
Underserved Area -3.652 1.113 -0.553 0.001
Geographic Region 2.326 0.752 0.445 0.002
Hospital Size 1.352 0.492 0.333 0.007
Hospital Type -0.520 0.401 -0.094 0.196
Hospital Cancer Program -0.605 0.864 -0.084 0.485
Hospital Resident Training 0.261 0.881 0.023 0.767
3. Predisposing, Enabling and Need Factors
B SE Beta Sig.
(Constant) 0.004 9.219 1
Age -0.009 0.028 -0.023 0.741
Genetic Factors -1.283 0.738 -0.115 0.084
Population Age 65+ 0.005 0.141 0.004 0.974
Poverty -0.171 0.099 -0.224 0.086
Race/Ethnicity - % Black/AA 0.194 0.075 0.418 0.01
Race/Ethnicity - % Hispanic -0.105 0.066 -0.198 0.116
Race/Ethnicity - % White -0.050 0.038 -0.249 0.187
Cost 0.000 0.001 -0.033 0.634
Access to Physician -0.080 0.025 -0.429 0.002
Page 203
194
Rural/Urban -0.507 0.233 -0.279 0.031
Underserved Area -3.509 1.120 -0.531 0.002
Geographic Region 2.511 0.747 0.48 0.001
Hospital Size 1.518 0.491 0.374 0.002
Hospital Type -0.353 0.396 -0.064 0.374
Hospital Cancer Program -0.941 0.851 -0.131 0.271
Hospital Resident Training 0.406 0.872 0.036 0.642
Comorbidity Index Score 0.057 0.090 0.044 0.525
Complications 0.025 0.792 0.002 0.975
Treatment -2.309 0.723 -0.222 0.002
Intensive Care Unit 0.549 0.629 0.059 0.384
4. Predisposing, Enabling and Need Factors, and Emergency Room Use
B SE Beta Sig.
(Constant) -0.778 9.223 0.933
Age -0.005 0.028 -0.013 0.852
Genetic Factors -1.377 0.741 -0.124 0.065
Population Age 65+ -0.003 0.141 -0.002 0.983
Poverty -0.165 0.099 -0.217 0.096
Race/Ethnicity - % Black/AA 0.198 0.075 0.427 0.009
Race/Ethnicity - % Hispanic -0.104 0.066 -0.197 0.117
Race/Ethnicity - % White -0.046 0.038 -0.231 0.221
Cost 0.000 0.001 -0.034 0.618
Access to Physician -0.080 0.025 -0.432 0.001
Rural/Urban -0.538 0.234 -0.295 0.023
Underserved Area -3.444 1.119 -0.521 0.002
Geographic Region 2.576 0.747 0.492 0.001
Hospital Size 1.539 0.490 0.379 0.002
Hospital Type -0.354 0.395 -0.064 0.372
Hospital Cancer Program -0.997 0.851 -0.139 0.243
Hospital Resident Training 0.342 0.872 0.03 0.696
Comorbidity Index Score 0.078 0.091 0.06 0.393
Complications 0.071 0.792 0.006 0.929
Treatment -2.693 0.781 -0.259 0.001
Intensive Care Unit 0.513 0.628 0.055 0.415
Emergency Room -0.672 0.524 -0.095 0.201
Page 204
195
Hierarchical multiple regression analysis for hospital length of stay by all prostate cancer
patients in Group B in subset analysis (n=350)
Hospital Subset Group B
1. Predisposing Factors
B SE Beta Sig.
(Constant) -13.461 27.247 0.622
Age 0.011 0.036 0.016 0.769
Genetic Factors -1.436 0.957 -0.081 0.134
Population Age 65+ 0.303 0.441 0.049 0.492
Poverty 0.095 0.202 0.062 0.640
Race/Ethnicity - % Black/AA 0.615 0.847 0.212 0.468
Race/Ethnicity - % Hispanic 0.057 0.072 0.066 0.431
Race/Ethnicity - % White 0.102 0.266 0.080 0.701
2. Predisposing and Enabling Factors
B SE Beta Sig.
(Constant) -21.147 58.286 0.717
Age 0.004 0.036 0.007 0.903
Genetic Factors -1.437 0.969 -0.081 0.139
Population Age 65+ 2.391 1.501 0.388 0.112
Poverty 0.811 0.501 0.529 0.106
Race/Ethnicity - % Black/AA 1.538 1.759 0.532 0.383
Race/Ethnicity - % Hispanic -0.227 0.299 -0.262 0.447
Race/Ethnicity - % White 0.040 0.422 0.031 0.925
Cost 0.000 0.001 -0.032 0.559
Access to Physician -0.468 0.389 -1.057 0.230
Rural/Urban -5.057 5.564 -0.742 0.364
Underserved Area 18.806 15.383 0.194 0.222
Hospital Size 0.734 0.497 0.119 0.141
Hospital Type 0.177 0.490 0.022 0.718
Hospital Cancer Program -1.735 0.826 -0.163 0.036
Hospital Resident Training 0.211 2.044 0.006 0.918
3. Predisposing, Enabling and Need Factors
B SE Beta Sig.
(Constant) -24.075 58.143 0.679
Age 0.012 0.038 0.019 0.742
Genetic Factors -1.328 0.973 -0.075 0.173
Population Age 65+ 2.488 1.500 0.404 0.098
Poverty 0.862 0.501 0.562 0.086
Race/Ethnicity - % Black/AA 1.601 1.756 0.553 0.363
Race/Ethnicity - % Hispanic -0.230 0.299 -0.264 0.443
Race/Ethnicity - % White 0.028 0.422 0.022 0.947
Cost 0.000 0.001 -0.01 0.851 Access to Physician -0.480 0.389 -1.084 0.218
Rural/Urban -5.085 5.553 -0.746 0.36
Page 205
196
Underserved Area 19.148 15.334 0.197 0.213
Hospital Size 0.649 0.502 0.106 0.197
Hospital Type 0.252 0.500 0.03 0.615
Hospital Cancer Program -1.614 0.827 -0.152 0.052
Hospital Resident Training 0.194 2.043 0.005 0.925
Comorbidity Index Score 0.176 0.100 0.098 0.08
Complications 0.379 1.029 0.021 0.713
Treatment -0.962 0.930 -0.059 0.302
Intensive Care Unit 0.648 0.714 0.052 0.365
4. Predisposing, Enabling and Need Factors, and Emergency Room Use
B SE Beta Sig.
(Constant) -28.197 57.733 0.626
Age 0.029 0.038 0.043 0.451
Genetic Factors -1.291 0.966 -0.073 0.182
Population Age 65+ 2.388 1.490 0.388 0.11
Poverty 0.899 0.498 0.587 0.072
Race/Ethnicity - % Black/AA 1.765 1.744 0.61 0.312
Race/Ethnicity - % Hispanic -0.215 0.296 -0.248 0.468
Race/Ethnicity - % White 0.065 0.419 0.051 0.876
Cost 0.000 0.001 -0.01 0.851
Access to Physician -0.470 0.386 -1.062 0.224
Rural/Urban -4.840 5.513 -0.71 0.381
Underserved Area 18.344 15.223 0.189 0.229
Hospital Size 0.721 0.499 0.117 0.15
Hospital Type 0.149 0.498 0.018 0.766
Hospital Cancer Program -1.604 0.821 -0.151 0.052
Hospital Resident Training 0.039 2.029 0.001 0.985
Comorbidity Index Score 0.195 0.100 0.109 0.052
Complications 0.291 1.022 0.016 0.776
Treatment -1.696 0.970 -0.104 0.081
Intensive Care Unit 0.705 0.709 0.056 0.321
Emergency Room -1.506 0.615 -0.144 0.015
Page 206
197
APPENDIX H: IRB APPROVAL
Page 208
199
REFERENCES
Aday, L. and Andersen, R. (1974). A framework for the study of access to medical care. Health
Services Research, 9, 208-220.
Aday, L. and Awe, W.C. (1997). Health services utilization models. In D.S. Gochman (Ed.),
Handbook of health behavior research I: personal and social determinants (pp. 153-
177). New York, NY: Plenum Press.
American Hospital Association, AHA Annual Survey Database. Chicago, IL.
American Cancer Society. Cancer Facts & Figures 2015. Atlanta: American Cancer Society;
2015.
American Cancer Society Cancer Action Network. Lifeline: Why Cancer Patients Depend on
Medicare for Critical Coverage. Washington, D.C.; 2012.
Andersen, R. M. (1995). Revisiting the behavioral model and access to medical care: does it
matter?. Journal of Health and Social Behavior, 36, 1-10.
Andersen, R. and Aday, L. (1978). Access to medical care in the U.S.: realized and potential.
Medical Care, 16(7), 533-546.
Andersen, R. and Newman, J.F. (1973). Societal and individual determinants of medical care
utilization in the United States. The Milbank Memorial Fund Quarterly: Health and
Society, 51(1), 95-124.
Area Health Resources Files (AHRF). 2014-2015. US Department of Health and Human
Services, Health Resources and Services Administration, Bureau of Health Workforce,
Rockville, MD.
Blankart, C.R. (2012). Does healthcare infrastructure have an impact on delay in diagnosis and
survival. Health Policy, 105, 128-137.
Blumenthal, S.J. and Kagen, J. (2002. The effects of socioeconomic status on health in rural and
urban America. Journal of the American Medical Association, 287(1), 109.
Brawley, O.W. (2012). Cancer disparities: the scope of the problem and possible solutions. In R.
Elk, R. and H. Landrine (Eds.), Cancer Disparities: Causes and Evidence-Based
Solutions. New York, NY: Springer Publishing Company, LLC.
Brawley, O.W. and Jani, A.B. (2007). Race and disparities in health. Current Problems in
Cancer, 31, 114-122.
Page 209
200
Brawley, O.W. and Jani, A.B. (2007). Prostate cancer and race. Current Problems in Cancer, 31,
211-225.
Bryant, A.L., Deal, A.M., Walton, A., Wood, W.A., Muss, H., and Mayer, D.K. (2015). Use of
ED and hospital services for patients with acute leukemia after induction therapy: one
year follow-up. Leukemia Research, 39, 406-410.
Chan, M.F. and Wong, F.K.Y. (2014). The risk factors for hospital re-admission in medical
patients in Singapore. Health and Social Care in the Community, 22(5), 488-496.
de Boer, A.G.E.M, Wijker, W. and de Haes, H.C.J.M. (1997). Predictors of health care
utilization in the chronically ill: a review of the literature. Health Policy, 42, 101-115.
DeChello, L.M., Gregorio, D.I. and Samociuk, H. (2006). Race-specific geography of prostate
cancer incidence. International Journal of Health Geographics, 5, 59.
Freeman, V.L., Durazo-Arvizu, R., Arozullah, A.M., and Keys, L.C. (2003). Determinants of
mortality following a diagnosis of prostate cancer in Veterans Affairs and private sector
health care systems. American Journal of Public Health, 93(10), 1706-1712.
Gochman, D.S. (1997). Handbook of Health Behavior Research 1: Personal and Social
Determinants. D.S. Gochman (Ed.) New York, NY: Plenum Press.
Goovaerts, P., Xiao, H., Gwede, C.K., Tan, F., Huang, Y., Adunlin, G. and Ali, A. (2015).
Impact of age, race and socio-economic status on temporal trends in late-stage prostate
cancer diagnosis in Florida. Spatial Statistics, 14, 321-337.
Greenberg, C., Weeks, J. and Stain, S. (2008). Disparities in oncologic surgery. World Journal of
Surgery, 32, 522-528.
Hagiwara, M., Delea, T.E., Saville, M.W. and Chung, K. (2013). Healthcare utilization and costs
associated with skeletal-related events in prostate cancer patients with bone metastases.
Prostate Cancer and Prostatic Disease, 16, 23-27.
Harlan, L.C., Potosky, A., Gilliand, F.D., Hoffman, R., Albertsen, P.C., Hamilton, A.S., Eley,
J.W., Stanford, J.L. and Stephenson, R.A. (2001). Factors associated with initial therapy
for clinically localized prostate cancer: prostate cancer study outcomes. Journal of the
National Cancer Institute, 93(24), 1864-1871.
Health Affairs/Robert Wood Johnson Foundation Health Policy Brief: Achieving Equity in
Health. (2011).
IBM Corp. Released 2015. IBM SPSS Statistics for Windows, Version 23.0. Armonk, NY: IBM
Corp.
Page 210
201
Inman, D.M., Maxson, P.M., Johnson, K.M., Myers, R.P. and Holland, D.E. (2011). The impact
of follow-up educational telephone calls on patients after radical prostatectomy: finding
value in low-margin activities. Urologic Nursing, 31(2), 83-91.
Jayadevappa, R., Schwartz, J. S., Chhatre, S., Wein, A. J. and Malkowicz, S. B. (2010).
Association between utility and treatment among patients with prostate cancer. Quality
Of Life Research: An International Journal Of Quality Of Life Aspects Of Treatment,
Care & Rehabilitation, 19(5), 711-720.
Jayadevappa, R., Chhatre, S., Johnson, J.C. and Malkowicz, S.B. (2011). Association between
ethnicity and prostate cancer outcomes across hospital and surgeon volume groups.
Health Policy, 99, 97-106.
Klabunde, C.N., Potosky, A.L., Legler, J.M. and Warren, J.L. (2000). Development of a
comorbidity index using physician claims data. Journal of Clinical Epidemiology, 53,
1258-1267.
Kantarjian, H.M., Steensma, D.P. and Light, D.W. (2014). The Patient Protection and Affordable
Care Act: is it good or bad for oncology. Cancer (11), 1600-1602.
Kostakou, E., Rovina, N., Kyriakopoulou, M., Koulouris, N.G. and Koutsoukou, A. (2014).
Critically ill cancer patient in intensive care unit: Issues that arise. Journal of Critical
Care, 29(5), 817-822.
Krupski, T.L., et al. (2006). Spirituality influences health-related quality of life in men with
prostate cancer. Psycho-Oncology, 15, 121-131.
Lang, K., Lines, L.M., Lee, D.W., Korn, J.R., Earle, C.C. and Menzin, J. (2009). Trends in
healthcare utilization among older Americans with colorectal cancer: A retrospective
database analysis. BMC Health Services Research, 9, 227-234.
Latini, D.M., Hart, S.L., Goltz, H.H., Lepore, S.J. and Schover, L.R. (2012). Prostate cancer
patient education project: prostate cancer symptom management in low-literacy men. In
R. Elk, R. and H. Landrine (Eds.), Cancer Disparities: Causes and Evidence-Based
Solutions (pp. 393-414). New York, NY: Springer Publishing Company, LLC.
Legler, A., Bradley, E.H. and Carlson, M.D.A. (2011). The effect of comorbidity burden on
health care utilization for patients with cancer using hospice. Journal of Palliative
Medicine, 14(6), 751-756.
Litaker, D. and Love, T.E. (2005). Health care resource allocation and individuals’ health care
needs: examining the degree of fit. Health Policy, 73, 183-193.
Page 211
202
Manzano, J.M., Lou, R., Elting, L.S., George, M. and Saurez-Almazor, M.E. (2014). Patterns
and predictors of unplanned hospitalization in a population-based cohort of elderly
patients with GI cancer. Journal of Clinical Oncology, 32(31), 3527-3534.
Mayer, D.K., Travers, D., Wyss, A., Leak, A. and Waller, A. (2011). Why do patients with
cancer visit emergency departments? Results of a 2008 population study in North
Carolina. Journal of Clinical Oncology, 29(19), 2683-2688.
Medicare Payment Advisory Commission. (June, 2012). Report to the Congress: Medicare and
the Health Care Delivery System. Washington, D.C.
Miller, D.C., Gelberg, L., Kwan, L., Stepanian, S., Fink, A., Andersen, R.M. and Litwin, M.S.
(2008). Racial disparities in access to care for men in a public assistance program for
prostate cancer. Journal of Community Health, 33, 318-335.
Mitchell, R.E., Lee, B.T., Cookson, M.S., Barocas, D.A., Herrell, S.D., … Chang, S.S. (2009).
Immediate surgical outcomes for radical prostatectomy in the University HealthSystem
Consortium Clinical Data Base; the impacts of hospital case volume, hospital size, and
geographical region on 48000 patients. BJU International, 104(10), 1442-1445.
Nakash, O., Nagar, M., Alon, R., Gottfried, M. and Levav, I. (2012). Ethnic differentials in
mental health needs and service utilization among persons with cancer. Support Cancer
Care, 20, 2217-2221.
National Cancer Institute, Center to Reduce Cancer Health Disparities. Cancer Health Disparities
Factsheet.
National Cancer Institute, Division of Cancer Control and Population Sciences, Healthcare
Delivery Research Program. Data Resources and Research Initiatives. SEER-Medicare:
Calculation of Comorbidity Weights.
O’Mally, K.J., Cook, K.F., Price, M.D., Wildes, K.R, Hurdle, J.F. and Ashton, C.M. (2005).
Measuring diagnoses: ICD code accuracy. Health Services Research, 40(5), 1620-1693.
Onega, T., et al. (2010). Race versus place of service in mortality among Medicare beneficiaries
with cancer. Cancer, 116(11), 2698-2701.
Onukwugha, E., Osteen, P., Jayasekera, J., Mullins, C.D., Mair, C.A. and Hussain, A. (2014).
Racial disparities in urologist visits among elderly men with prostate cancer: a cohort
analysis of residence-related factors. Cancer (21), 3385-3392.
Painter, J.E., Borba, C.P.C., Hynes, M., Mays, D. and Glanz, K. (2008). The use of a theory in
health behavior research from 2000 to 2005: a systematic review. Annals of Behavioral
Medicine, 35, 358-362.
Page 212
203
Pallant, J. (2007). SPSS Survival Manual: A Step by Step Guide to Data Analysis Using SPSS
for Windows Third Edition. New York, NY; McGraw Hill Open University Press.
Parsons, J.K., et al. (2010). Prostate cancer treatment for economically disadvantaged men: a
comparison of county hospitals and private providers. Cancer, 116(5), 1378-1384.
Phillips, K.A., Morrison, K.R., Andersen, R. and Aday, L.A. (1998). Understanding the context
of healthcare utilization: assessing environmental and provider-related variables in the
behavioral model of utilization. Health Services Research, 33(3), 571-596.
Price, R.A., Stranges, E. and Elixhauser, A. Cancer Hospitalizations for Adults, 2009: Statistical
Brief #125. 2012 Feb. In: Healthcare Cost and Utilization Project (HCUP) Statistical
Briefs [Internet]. Rockville (MD): Agency for Health Care Policy and Research (US);
2006 Feb. Available from: http://www.ncbi.nlm.nih.gov/books/NBK92614/
Roberts, C.B., Albertsen, P.C., Shao, Y.H., Moore, D.F., Mehta, R.A., Stein, MN. and Lu-Yao,
G.L. (2011). Patterns and correlates of prostate cancer treatment in older men. American
Journal of Medicine, 124(3), 235-243.
Rapiti, E. et al. (2009). Impact of socioeconomic status on prostate cancer diagnosis, treatment,
and prognosis. Cancer, 115(23), 5556-5565.
Rapkin, B.D. (2012). Paths for the future: using what we’ve learned to eliminate cancer
disparities. In R. Elk, R. and H. Landrine (Eds.), Cancer Disparities: Causes and
Evidence-Based Solutions (pp. 497-524). New York, NY: Springer Publishing Company,
LLC.
Ross, L.E., Taylor, Y.J. and Howard, D.L. (2011). Trends in prostate-specific antigen test use,
2000-2005. Public Health Reports, 126(2), 228-239.
Seal, B., Sullivan, S.D., Ramsey, S.D., Asche, C.V., Shermock, K., Sarma, S., …Eaddy, M.
(2014). Comparing hospital-based resource utilization and costs for prostate cancer
patients with and without bone metastases, Applied Health Economics in Health Policy,
12, 547-557.
Shayne, M., Culakova, E., Poniewierski, M.S., Dale, D.C., Crawford, J., Wogu, A.F. and Lyman,
G.H. (2013). Risk factors for in-hospital mortality and prolonged length of stay in older
patients with solid tumor malignancies. Journal of Geriatric Oncology, 4, 310-318.
Sherrod, P.H. (2014). DTREG Predictive Modeling Software: DTREG Program Manual.
Retrieved on February 17, 2016 from:
https://www.dtreg.com/uploaded/downloadfile/DownloadFile_5.pdf.
Spencer, B.A., et al. (2008). Variations in quality of care for men with early-stage prostate
cancer. Journal of Clinical Oncology, 26(22), 3735-3742.
Page 213
204
Staudt, M.M. (2000). Correlates of recommended aftercare service use after intensive family
preservation services. Social Work Research, 24(1), 40-50.
Sundmacher, L. and Busse, R. (2011). The impact of physician supply on avoidable cancer
deaths in Germany: a spatial analysis. Health Policy, 103, 53-62.
Treanor, C., and Donnelly, M. (2012). An international review of the patterns and determinants
of health service utilization by adult cancer survivors. BMC Health Services Research,
12(316), 1-20.
U.S. Centers for Medicare and Medicaid Services, Medicare Provider Analysis and Review
(MEDPAR) File. Retrieved on July 14, 2015 from: http://www.cms.gov/Research-
Statistics-Data-and-Systems/Files-for-
Order/IdentifiableDataFiles/MedicareProviderAnalysisandReviewFile.html
U.S. Department of Economics, CMS' SSA to FIPS State and County Crosswalk. Retrieved on
June 8, 2016 from: http://www.nber.org/data/ssa-fips-state-county-crosswalk.html.
U.S. Department of Health and Human Services, Health Resources and Services Administration.
Area Health Resources File (AHRF) Overview. Retrieved on July 14, 2015 from:
http://ahrf.hrsa.gov/overview.htm
Wan, T.T.H. (2002). Evidence-Based Health Care Management: Multivariate Modeling
Approaches. Norwell, MA: Kluwer Academic Publishers.
Wan, T.T.H. and Sofier, S.J. (1975). A multivariate analysis of the determinants of physician
utilization. Socio-Economic Planning Sciences, 9(5), 229-237.
Wan, T.T.H. and Yates, A.S. (1975). Prediction of dental services utilization: a multivariate
approach. Inquiry, 12(2), 143-156.
Wang, F., Luo, L. and McLafferty, S. (2010). Healthcare access, socioeconomic factors and late-
stage cancer diagnosis: an exploratory spatial analysis and public policy implication.
International Journal of Public Policy, 5(2/3), 237-258.
Wang, F. and Onega, T. (2015). Accessibility of cancer care: disparities, outcomes and
mitigation. Annals of GIS, 21(2), 119-125.
Wolinsky, F.D., Liu, L., Miller, T.R., An, H., Geweke, J.F., Kaskie, B., …Wallace, R.B., (2008).
Emergency department utilization patterns among older adults. Journal of Gerontology:
Medical Sciences, 63A(2), 204-209.
Page 214
205
Yong, C., Onukwugha, E., Mullins, C.D., Seal, B., and Hussain, A. (2014). The use of health
services among elderly patients with stage IV prostate cancer in the initial period
following diagnosis. Journal of Geriatric Oncology, 290-298.