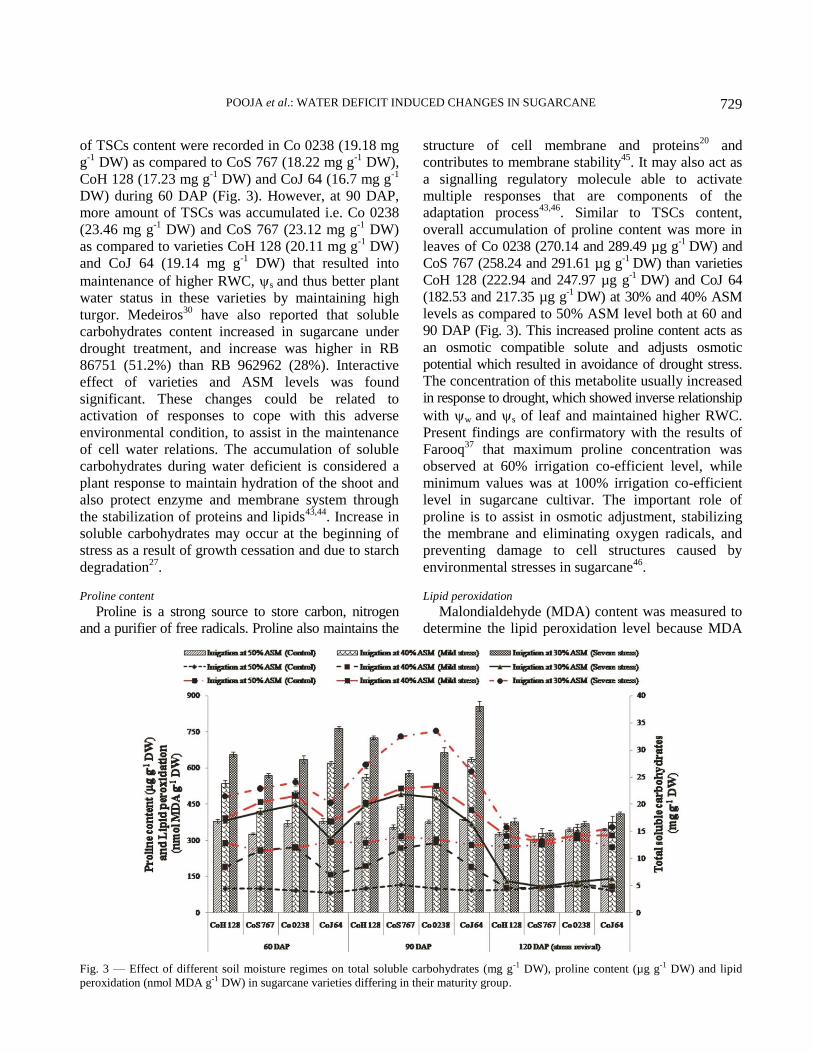
Indian Journal of Experimental Biology
Vol. 57, October 2019, pp. 721-732
Varietal variation in physiological and biochemical attributes of
sugarcane varieties under different soil moisture regimes
Pooja1,*, Nandwal AS
1, Chand M
2, Singh K
3, Mishra AK
3, Kumar A
3, Kumari A
1 & Rani B
1
1CCS Haryana Agricultural University, Hisar-1250 04, Haryana, India 2Regional Research Station, CCS Haryana Agricultural University, Karnal-132 001, Haryana, India
3ICAR-Central Soil Salinity Research Institute, Karnal-132 001, Haryana, India
Received 07 September 2017; revised 18 June 2018
Physiological and biochemical changes in response to deficit irrigation (drought stress) were studied at three moisture
regimes based on available soil moisture (ASM) and four commercial sugarcane varieties differing in their maturity i.e. CoS
767 (Mid late), CoH128 (Mid late), CoJ 64 (Early) and Co 0238 (Early) Plant water status was affected significantly with
duration and severity of stress with maximum reduction at 30% ASM level at 90 DAP. The water potential (from 0.62 to
1.16 MPa), osmotic potential (from 0.88 to 1.77 MPa) and relative water content (from 87.59 to 65.51%) decreased
significantly at 30% ASM level than at 50% ASM in all the varieties. After stress revival, a remarkable recovery was
recorded in all the varieties at all the ASM levels with maximum recovery in varieties Co 0238 and CoS 767. Higher
membrane injury was recorded in CoJ 64 followed by CoH 128, Co 0238 and CoS 767at 30% ASM at 60 and 90 DAP.
Remarkable decrease were observed in gaseous exchange parameters in leaves viz. photosynthetic rate, transpiration rate and
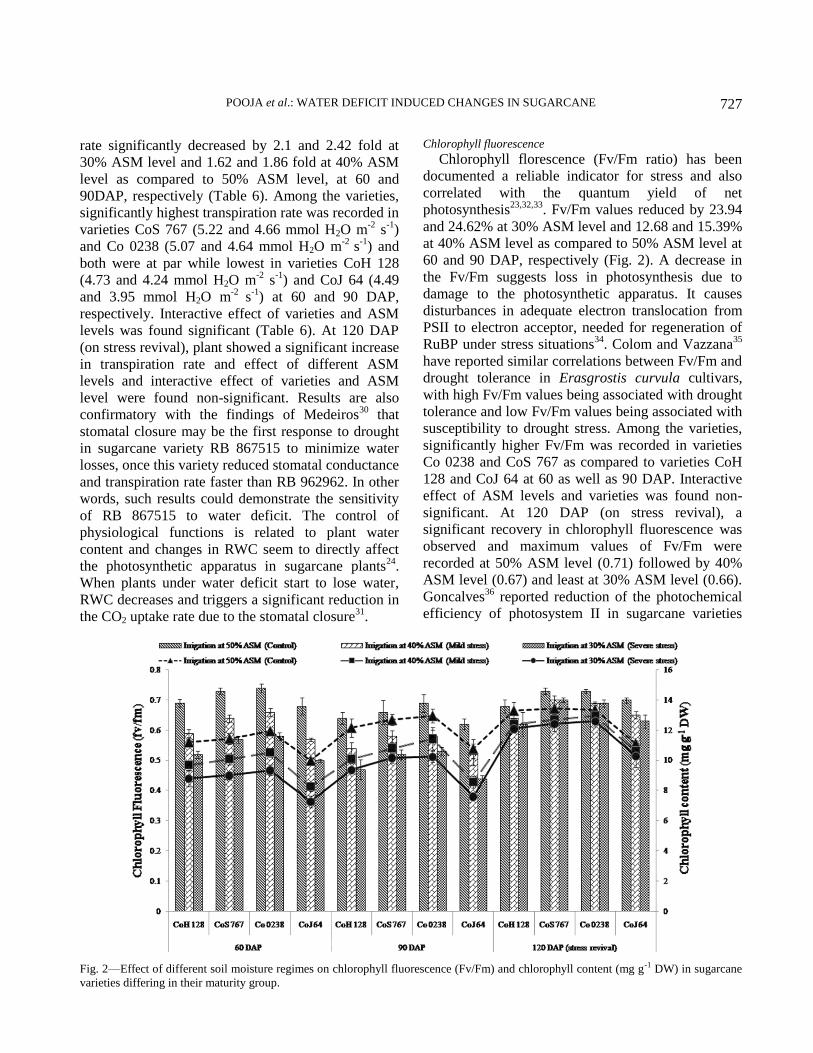
stomatal conductance at 30 and 40% ASM levels in all the varieties. Significant reduction was also recorded in chlorophyll
fluorescence (Fv/Fm). Severe stress conditions of 30% ASM led to approx. two fold increase in total soluble carbohydrates,
four folds in proline and two fold increase in lipid peroxidation. ASM levels of 40% and 30% also significantly reduced
total chlorophyll content. From the results, it can be concluded that varieties Co 0238 and CoS 767 are relatively more tolerant at moderate stress to severe stress than CoH 128 and CoJ 64.
Keywords: Abiotic stress, Available soil moisture (ASM), Drought stress, Gas exchange attributes, Osmoprotectants,
Saccharum spp., Sugarcane, Water relations
Sugarcane (Saccharum spp.) is the world's largest
crop in terms of production1. In many countries it
plays an important role in improving rural livelihoods.
Sugarcane, an important source of sugar and ethanol,
is a relatively high water-demanding crop and its
growth is highly sensitive to water deficit2-4
. Drought
is the most important constraint to sugarcane
production in many areas. Drought, a period of
abnormally dry weather, results in soil-water deficit
and subsequently plant-water deficit. Water deficit is
the single largest abiotic stress affecting sugarcane
productivity and the development of water use
efficient and drought tolerant cultivars is an
imperative for all major sugarcane producing
countries5. Scarcity of irrigation water is one of the
major constraint of low cane yield and it is mostly
restricted the sugarcane growing areas in the world. In
sugarcane, four distinct growth stages (i.e.,
germination, tillering, grand growth and maturity)
have been characterized. The tillering and grand
growth stages, known as the sugarcane formative
phase, have been identified as the critical water
demand period. Water stress during formative phase
(tillering phase) has negative impact on growth and
yield. This is mainly because 70-80% of cane yield is
produced during this phase6.
Plants have evolved various drought tolerance
strategies, such as changes in life cycle, modulation of
growth and development to match with water supply,
regulation of whole plant functions to balance
resource allocation for growth and stress adaptation,
and evolution of stress signal perception for rapid and
long term expression of stress tolerance7-9
. To achieve
that, a better understanding of the stress induced
responses and the interrelationships of physiological
and biochemical traits can prove to be useful10
. The
increasing incidence, duration and intensity of severe
water deficit, has prompted many large sugarcane
———— E-mail: [email protected] #Present add.: ICAR-Sugarcane Breeding Institute, Regional
Center, Karnal, Haryana, India
INDIAN J EXP BIOL, OCTOBER 2019
722
crop improvement programs to invest in water use-
efficient and water stress tolerant varieties and water
use-efficient crop productions systems. In this
context, quantifying plant water status, leaf
photosynthetic components and accumulation of
osmolytes during the formative phase may be useful,
and here, we studied sugarcane plant response to
water-deficit stress as well as suitable sugarcane
genotype which can tolerate the drought conditions
with minimum yield and sugar losses.
Materials and Methods
Experimental details
Present study was carried out on four sugarcane
varieties of different maturity group. Two budded
setts of four sugarcane varieties were planted during
Spring season of the year 2014-15 and 2015-16 in the
field conditions at Regional Research Station,
Chaudhary Charan Singh, Haryana Agricultural
University, Uchani, Karnal-132001, Haryana, India.
Average rainfall is 600 mm and 70-80 per cent of it is
received from July to September. To study the effect
of irrigations at different available soil moisture
(ASM) levels on four sugarcane varieties, an
experiment was conducted in split plot design with
3 replications. Two budded setts of four sugarcane
varieties, two under mid late group viz., CoH 128,
CoS 767 and two under early group viz., Co 0238 and
CoJ 64 were planted by half ridge irrigation method in
Spring season. After complete germination (40 days
after planting) three levels of available soil moisture
(ASM) regimes were created i.e. irrigation at 50%
ASM level (control), irrigation at 40% ASM level
(mild stress) and irrigation at 30% ASM level (severe
stress). These ASM levels were created only during
pre-monsoon (in the month of April, May and June)
period by withholding irrigation and later on i.e. post
monsoon period (in the month of July), the crop was
irrigated for stress revival as per requirement.
Plant material and growth conditions
Planting was done in Spring season during the year
2014-15 and 2015-16 by half ridge irrigation method
of planting i.e. planting of two budded setts (seed rate
87.5 q ha-1
) in dry furrows followed by irrigation upto
half of the ridge and then planking after 3-4 days of
planting. All necessary managements i.e. fertilizer,
irrigation, weed and insect pest were done at proper
timing. Different physico-chemical properties of the
experimental field soil before sowing of the crop are
given in Table 1.
Physiological parameters
Physiological and biochemical parameters were
studied after 60, 90 and 120 days after the imposition
of stress treatments. Relative water content
(RWC %)11
, membrane stability12
, osmotic potential
(s) using 5100-B Vapour Pressure Osmometer and
water potential (w) with the help of pressure
chamber (Model 3005, Soil Moisture Equipment
Corporation, Santa Barbara, CA, USA), between 7:00
AM to 9:00 AM were measured of first TVD leaf.
Photosynthetic rate, stomatal conductance and transpiration rate
Photosynthetic rate (µmol CO2 m-2
s-1), transpiration
(mmol H2O m-2
s-1), stomatal conductance (mmol H2O
m-2
s-1) of TVD leaf were measured with an Infrared
Open Gas Exchange System (LI-6400, LICOR Inc.,
Lincoln, NE, USA) between 9:00 AM to 10:00 AM.
Chlorophyll fluorescence
The photochemical efficiency of plants was
obtained from the fluorescent analysis of chlorophyll
between 9:00 AM to 10:00 AM. The measurements
were made on the same leaves that were evaluated for
gas exchange. The maximum photochemical
efficiency (Fv/Fm) of photosystem II was determined
using a Portable Pulse Modulated Fluorescence
Measurer (Junior PAM Chlorophyll Fluorometer,
Germany) after adapting the leaves to the dark for
5 min via special leaf clips. The readings were made
after saturating one second light pulses to promote the
closing of the photosystem II reaction centers.
Biochemical parameters
Chlorophyll content13
, total soluble carbohydrates14
,
proline content15
and lipid peroxidation16
were analyzed
from fresh TVD leaves.
Statistical analysis
All the data were subjected to variance analysis
using the SAS (Version 9.3, SAS Institute Inc., Cary,
Table 1—Soil characteristics of the experimental field
2014-15 2015-16
1. Mechanical Analysis
(i) Sand 55.3% 54.6%
(ii) Fine Sand 15.4% 15.8%
(iii) Silt 15.50% 16.2%
(iv) Clay 13.7% 13.4%
2. Texture Sandy loam Sandy loam
3. Saturation capacity 34.2% 35.5%
4. pH (1: 2) 7.7 7.9
5. EC2 (at 25°C) 0.36 dSm-1 0.32 dSm-1
6. Available nutrients (kg ha-1)
(i) N 125.44 129.36
(ii) P 11.8 11.5
(iii) K 172.1 168.5
7. Organic carbon 0.42% 0.46%
POOJA et al.: WATER DEFICIT INDUCED CHANGES IN SUGARCANE
723
NC, USA). Least significant difference test was
applied at 5 per cent probability level to compare the
mean differences.
Results and Discussion
Physiological parameters
Plant water relations (RWC, OP and WP)
Plants under water deficit conditions show
modifications in their metabolism to tolerate water
loss. Our results showed that when all the four studied
varieties were exposed to decreasing level of available
soil moisture (30 and 40%), a significant decline in
leaf RWC (Table 2), leaf osmotic potential and leaf
water potential was observed as compared to 50%
ASM level at 60 and 90 DAP (Figure 1). Substantial
variations of plant water status of leaves were
observed in four varieties. It is suggested that under
identical situations, change in w of leaf may reflect
change in s and can be used in screening of
sugarcane genotypes for difference in osmotic
adjustment. In Co 0238 and CoS 767 less negative
values of w of leaf and s of leaf resulted in better
water status (RWC%) as compared to varieties CoH
128 and CoJ 64. The proposed mechanism for
decreasing s potential might be that plants adjust
under low available soil moisture condition to
maintain the turgor. Decrease in s may be due to
accumulation of osmolytes viz., proline and total
soluble carbohydrates content.
RWC significantly decreased with average values
of 67.8 and 65.51% at 30% ASM level and 71.15 and
71.49% at 40% ASM level as compared to at 50%
ASM level (87.52 and 87.59%) at 60 and 90 DAP,
respectively (Table 2). Varieties CoS 767 (78.24 and
79.18%) and Co 0238 (77.42 and 77.12%) were at par
and significantly maintained higher RWC as
compared to varieties CoH 128 (73.18 and 70.97%)
and CoJ 64 (73.09 and 72.18%) at 60 and 90 DAP,
respectively. On stress revival (at 120 DAP), a
significant increase in RWC was recorded by 19.2 and
23.37% at 30% ASM level and 16.79 and 15.93% at
40% ASM level as compared to their values at 60 and
90 DAP, respectively whereas among varieties no
significant differences were observed after 120 DAP
(stress revival).
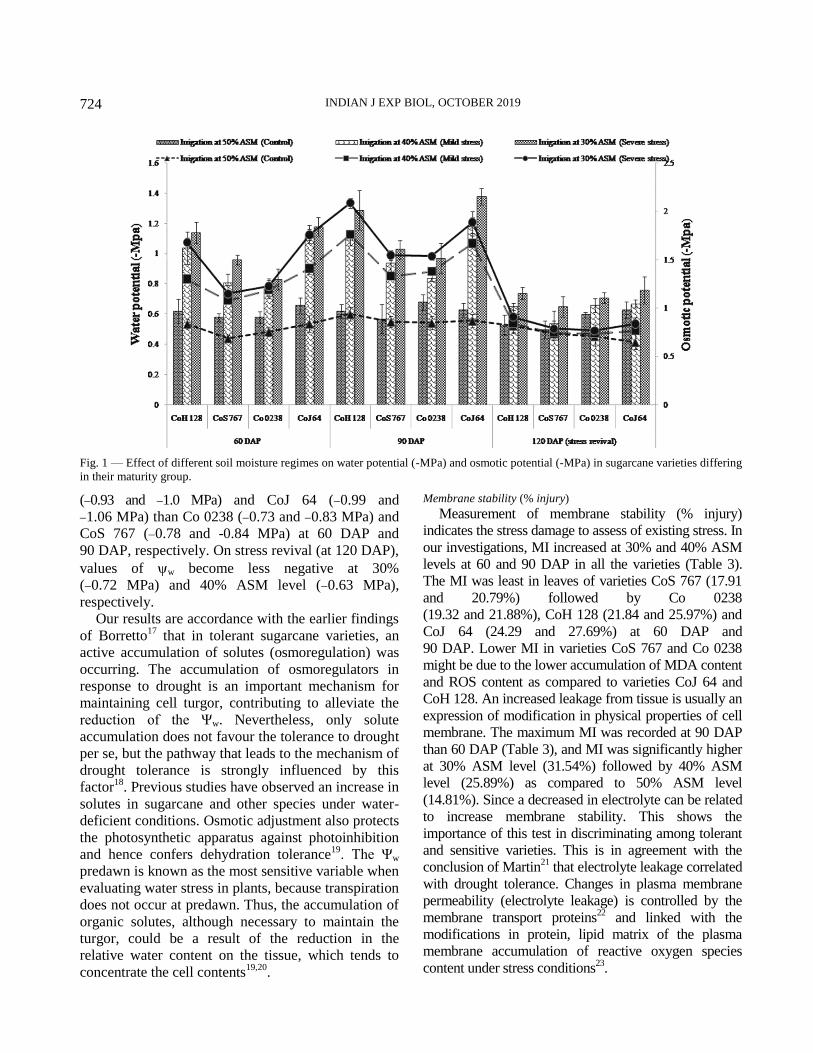
Osmotic potential (s) of leaves declined
progressively with the advancement of stage of
sampling and also with the decrease in ASM levels
(Fig. 1). A significant reductions in s was recorded
at 30% ASM level (1.45 and 1.77 MPa) and
(1.24 and 1.53 MPa) at 40% ASM level as
compared to 50% ASM level (0.78 and 0.88 MPa)
at 60 DAP and 90 DAP, respectively. On average
values, varieties CoS 767 (0.97 and 1.24 MPa) and
Co 0238 (1.06 and 1.26 MPa) showed lowest
negative values of s as compared to varieties CoH
128 (1.27 and -1.6 MPa) and CoJ 64 (1.34 and
1. 84 MPa) at 60 and 90 DAP, respectively. On
stress revival (120 DAP), a recovery of the plant
water status was observed. An increase in s by 43.45
and 53.67% at 30% ASM level and 33.87 and 46.41%
at 40% ASM level was observed over their values at
60 and 90 DAP, respectively
Water potential (w) of leaves become more
negative with decrease in available soil moisture
levels (Fig. 1). The more negative values of w was
recorded at 90 DAP than 60 DAP. Reduction
percentage was significantly higher at 30% ASM
level (1.16 MPa) than 40% ASM level (1.01 MPa)
as compared to 50% ASM level (0.62 MPa) at
90 DAP. Among the varieties, more negative
values of w were noticed in varieties CoH 128
Table 2—Effect of different soil moisture regimes on relative water content (%) in sugarcane varieties differing in their maturity group
Varieties/
Treatments
CoH
128
CoS
767
Co
0238
CoJ
64
Mean CoH
128
CoS
767
Co
0238
CoJ
64 Mean
CoH
128
CoS
767
Co
0238
CoJ
64 Mean
RWC after 60 DAP RWC after 90 DAP RWC after 120 DAP (stress revival) Irrigation at 50%
ASM (Control) 85.03 88.98 87.78 88.27 87.52A 83.30 89.75 88.38 88.92 87.59A 86.10 88.55 88.75 88.15 87.89A
Irrigation at 40%
ASM (Mild stress) 68.65 73.91 74.70 67.32 71.15B 67.35 77.03 74.30 67.27 71.49B 80.60 85.00 83.10 82.80 82.88B
Irrigation at 30%
ASM (Severe stress) 65.87 71.83 69.78 63.70 67.8C 62.27 70.75 68.68 60.35 65.51C 78.32 81.42 82.39 81.13 80.82C
Mean 73.18B 78.24A 77.42A 73.09B 70.97C 79.18A 77.12B 72.18C 81.67B 84.99A 84.75A 84.03A
CV Varieties, 2.488; Treatments, 2.241 Varieties, 2.814; Treatments, 2.101 Varieties, 2.123; Treatments, 2.021
LSD V, 1.78 T, 1.92 T×V, 3.25 V×T, 3.07 V, 1.99 T, 1.78 T×V, 3.45 V×T, 3.45 V, 1.68 T, 1.92 T×V, NS V×T, NS
[Least significant difference test was applied at 5 per cent probability level to compare the mean differences. ASM, Available Soil
Moisture; V, Varieties; T, Treatments; T × V, Treatments at the same level of varieties; and V × T, Varieties at the same level of treatments]
INDIAN J EXP BIOL, OCTOBER 2019
724
(0.93 and 1.0 MPa) and CoJ 64 (0.99 and
1.06 MPa) than Co 0238 (0.73 and 0.83 MPa) and
CoS 767 (0.78 and -0.84 MPa) at 60 DAP and
90 DAP, respectively. On stress revival (at 120 DAP),
values of w become less negative at 30%
(0.72 MPa) and 40% ASM level (0.63 MPa),
respectively.
Our results are accordance with the earlier findings
of Borretto17
that in tolerant sugarcane varieties, an
active accumulation of solutes (osmoregulation) was
occurring. The accumulation of osmoregulators in
response to drought is an important mechanism for
maintaining cell turgor, contributing to alleviate the
reduction of the Ψw. Nevertheless, only solute
accumulation does not favour the tolerance to drought
per se, but the pathway that leads to the mechanism of
drought tolerance is strongly influenced by this
factor18
. Previous studies have observed an increase in
solutes in sugarcane and other species under water-
deficient conditions. Osmotic adjustment also protects
the photosynthetic apparatus against photoinhibition
and hence confers dehydration tolerance19
. The Ψw
predawn is known as the most sensitive variable when
evaluating water stress in plants, because transpiration
does not occur at predawn. Thus, the accumulation of
organic solutes, although necessary to maintain the
turgor, could be a result of the reduction in the
relative water content on the tissue, which tends to
concentrate the cell contents19,20
.
Membrane stability (% injury)
Measurement of membrane stability (% injury)
indicates the stress damage to assess of existing stress. In
our investigations, MI increased at 30% and 40% ASM
levels at 60 and 90 DAP in all the varieties (Table 3).
The MI was least in leaves of varieties CoS 767 (17.91
and 20.79%) followed by Co 0238
(19.32 and 21.88%), CoH 128 (21.84 and 25.97%) and
CoJ 64 (24.29 and 27.69%) at 60 DAP and
90 DAP. Lower MI in varieties CoS 767 and Co 0238
might be due to the lower accumulation of MDA content
and ROS content as compared to varieties CoJ 64 and
CoH 128. An increased leakage from tissue is usually an
expression of modification in physical properties of cell
membrane. The maximum MI was recorded at 90 DAP
than 60 DAP (Table 3), and MI was significantly higher
at 30% ASM level (31.54%) followed by 40% ASM
level (25.89%) as compared to 50% ASM level
(14.81%). Since a decreased in electrolyte can be related
to increase membrane stability. This shows the
importance of this test in discriminating among tolerant
and sensitive varieties. This is in agreement with the
conclusion of Martin21
that electrolyte leakage correlated
with drought tolerance. Changes in plasma membrane
permeability (electrolyte leakage) is controlled by the
membrane transport proteins22
and linked with the
modifications in protein, lipid matrix of the plasma
membrane accumulation of reactive oxygen species
content under stress conditions23
.
Fig. 1 — Effect of different soil moisture regimes on water potential (-MPa) and osmotic potential (-MPa) in sugarcane varieties differing
in their maturity group.
POOJA et al.: WATER DEFICIT INDUCED CHANGES IN SUGARCANE
725
Photosynthetic rate, stomatal conductance and transpiration rate
Our results reveal that gas exchange parameters
viz., photosynthetic rate (Table 4), stomatal
conductance (Table 5) and transpiration rate (Table 6)
reduced significantly at 30% and 40% ASM levels.
The performance of sugarcane varieties regarding gas
exchange parameters was in the order of CoS 767
> Co 0238 > CoH 128 > CoJ 64. At 30% and 40%
ASM levels gas exchange parameters were inhibited
mainly by the reduction in RWC, w, chlorophyll
content, MI and leaf area.
Photosynthetic rate significantly decreased by
49.93% at 30% ASM level and 34.73% at 40% ASM
level as compared to 50% ASM level, at 60 DAP.
However, at 90 DAP reduction percentage was more
and average values decreased by 51.86% at 30%
ASM level and 39.53% at 40% ASM level as
compared to 50% ASM level (Table 4). Significantly
highest photosynthetic rate was recorded in variety Co
0238 (18.84 and 17.59 µmol CO2 m-2
s-1
) and CoS 767
(17.95 and 16.72 µmol CO2 m-2
s-1
) than varieties CoH
128 (14.85 and 13.31 µmol CO2 m-2
s-1
) and CoJ 64
Table 3—Effect of different soil moisture regimes on membrane injury (%) in sugarcane varieties differing in their maturity group
Varieties/
Treatments
CoH
128
CoS
767
Co
0238
CoJ
64 Mean
CoH
128 CoS 767
Co
0238
CoJ
64 Mean
CoH
128
CoS
767
Co
0238
CoJ
64 Mean
MI after 60 DAP MI after 90 DAP MI after 120 DAP (stress revival)
Irrigation at 50 %
ASM (Control)
15.17 13.03 12.60 14.10 13.73C 16.88 14.58 13.99 13.81 14.81
C 14.80 12.60 13.20 13.92 13.63
Irrigation at 40 %
ASM (Mild stress)
22.63 19.69 20.53 25.38 22.06B 26.75 21.90 23.65 31.25 25.89
B 15.20 13.52 13.51 14.16 14.10
Irrigation at 30 %
ASM (Severe stress)
27.71 21.02 24.82 33.40 26.74A 34.29 25.88 27.99 38.01 31.54
A 15.63 13.30 14.15 14.88 14.49
Mean 21.84B 17.91
D 19.32
C 24.29
A 25.97
B 20.79
D 21.88
C 27.69
A 15.21
A 13.14
C 13.62
C 14.32
B
CV Varieties, 3.831; Treatments, 5.781 Varieties, 3.228; Treatments, 3.987 Varieties, 5.588; Treatments, 8.991
LSD V, 0.75 T, 1.37 T×V, 1.75 V×T,1.31 V, 0.73 T, 1.09 T×V, 1.53 V×T, 1.27 V, 0.74 T, NS T×V, NS V×T, NS
[Least significant difference test was applied at 5 per cent probability level to compare the mean differences. ASM, Available Soil Moisture;
V, Varieties; T, Treatments; T × V, Treatments at the same level of varieties; and V × T, Varieties at the same level of treatments]
Table 4—Effect of different soil moisture regimes on photosynthetic rate (µmol CO2 m-2
s-1
) in sugarcane varieties
differing in their maturity group
Varieties/
Treatments
CoH
128
CoS
767
Co
0238
CoJ
64 Mean
CoH
128
CoS
767
Co
0238
CoJ
64 Mean
CoH
128
CoS
767
Co
0238
CoJ
64 Mean
Pn after 60 DAP Pn after 90 DAP Pn after 120 DAP (stress revival)
Irrigation at 50%
ASM (Control)
21.82 22.77 24.63 22.57 22.95A 20.47 21.85 22.86 20.76 21.48
A 21.95 24.19 24.87 23.43 23.61
A
Irrigation at 40%
ASM (Mild stress)
12.81 17.59 18.12 11.39 14.98B 11.22 15.38 16.22 9.16 12.99
B 19.97 23.55 23.88 20.73 22.03
B
Irrigation at 30%
ASM (Severe stress)
9.91 13.48 13.78 8.80 11.49C 8.24 12.93 13.69 6.50 10.34
C 18.95 22.33 22.74 19.44 20.87
C
Mean 14.85C 17.95
B 18.84
A 14.25
D 13.31
C 16.72
B 17.59
A 12.14
D 20.29
C 23.36
A 23.83
A 21.2
B
CV Varieties, 5.239; Treatments, 3.13 Varieties, 6.936; Treatments, 6.074 Varieties, 5.098; Treatments, 3.424
LSD V, 0.82 T, 0.58 T×V, 1.35 V×T, 1.41 V, 0.98 T, 1.03 T×V, 3.45 V×T, 1.7 V, 1.07 T, 0.86 T×V, NS V×T, NS
[Least significant difference test was applied at 5 per cent probability level to compare the mean differences. ASM, Available Soil Moisture; V,
Varieties; T, Treatments; T × V, Treatments at the same level of varieties; and V × T, Varieties at the same level of treatments]
Table 5—Effect of different soil moisture regimes on stomatal conductance (mmol H2O m-2
s-1
) in sugarcane varieties
differing in their maturity group
Varieties/
Treatments
CoH
128
CoS
767
Co
0238
CoJ
64 Mean
CoH
128
CoS
767
Co
0238
CoJ
64
Mean CoH
128
CoS
767
Co
0238
CoJ
64 Mean
gS after 60 DAP gS after 90 DAP gS after 120 DAP (stress revival)
Irrigation at 50%
ASM (Control)
0.30 0.33 0.35 0.33 0.32A 0.32 0.33 0.37 0.34 0.34
A 0.38 0.45 0.44 0.38 0.41
A
Irrigation at 40%
ASM (Mild stress)
0.14 0.18 0.19 0.13 0.16B 0.11 0.14 0.16 0.11 0.13
B 0.31 0.40 0.42 0.32 0.36
B
Irrigation at 30%
ASM (Severe stress)
0.11 0.12 0.12 0.11 0.11C 0.10 0.11 0.14 0.09 0.11
C 0.29 0.38 0.38 0.29 0.33
C
Mean 0.18C 0.21
B 0.22
A 0.19
C 0.18
C 0.19
B 0.22
A 0.18
C 0.33
B 0.41
A 0.41
A 0.33
B
CV Varieties, 5.804; Treatments, 6.402 Varieties, 7.201; Treatments, 7.996 Varieties, 5.401; Treatments, 11.441
LSD V, 0.01 T, 0.01 T×V, 0.02 V×T, 0.02 V, 0.01 T, 0.02 T×V, 0.03 V×T, 0.02 V, 0.04 T, 0.02 T×V, NS V×T, NS
[Least significant difference test was applied at 5 per cent probability level to compare the mean differences. ASM, Available Soil Moisture; V,
Varieties; T, Treatments; T × V, Treatments at the same level of varieties; and V × T, Varieties at the same level of treatments]
INDIAN J EXP BIOL, OCTOBER 2019
726
(14.25 and 12.14 µmol CO2 m-2
s-1
) at 60 and 90 DAP,
respectively (Table 4). Interactive effect of varieties
and ASM levels was found significant at 60 and 90
DAP. At 120 DAP (on stress revival), plant exhibited
increase in photosynthetic rate from 10.34 to
20.87 µmol CO2 m-2
s-1
at 30% ASM level, 12.99 to
22.03 µmol CO2 m-2
s-1
at 40% ASM level and 21.48
to 23.61 µmol CO2 m-2
s-1
at 50% ASM level over
their values at 90 DAP. After rehydration,
significantly highest photosynthetic rate was recorded
in all the varieties. Sage and Kubien24
have also
reported that damages in photosynthetic apparatus are
more closely related to changes in membrane
properties and with the decoupling of the mechanisms
of energy transfer in chloroplasts than to protein
denaturation. Decrease in photosynthesis under low
relative water content is caused by impaired
metabolism (shortage of ATP, limiting RuBP
synthesis without or with less inhibition of
photosynthetic enzyme) including Rubisco.
Photosynthesis is particularly sensitive to water
deficit because the stomata tend to close to conserve
water under deficit conditions, reducing CO2 diffusion
to the fixation sites in the leaf mesophyll in the
vicinity of the enzyme Rubisco, which causes
diminished photosynthesis and consequently
reduced productivity24-26
.
Monitoring gas exchange in plants is a common
approach, with stomatal conductance (gs) reported as
one of the most sensitive indicators of stress. Data
presented in Table 5 showed that the rate of stomatal
conductance decreased significantly with average
value 0.11 and 0.11 mmol H2O m-2
s-1
at 30% ASM
level and 0.16 and 0.13 mmol H2O m-2
s-1
at 40%
ASM level as compared to 50% ASM level (0.32 and
0.34 mmol H2O m-2
s-1
) at 60 and 90 DAP,
respectively. Varieties Co 0238 (0.22 and 0.22 mmol
H2O m-2
s-1
) and CoS 767 (0.21 and 0.19 mmol H2O
m-2
s-1
) maintained higher stomatal conductance as
compared to varieties CoH 128 (0.18 and 0.18 mmol
H2O m-2
s-1) and CoJ 64 (0.19 and 0.18 mmol H2O m
-2 s
-1)
at 60 and 90 DAP, respectively. Interactive effect of
ASM levels and varieties was found significant
(Table 5). On stress revival (at 120 DAP), stomatal
conductance was at par at all the ASM levels,
respectively over their values at 90 DAP. The
maximum values of stomatal conductance were
recorded in variety CoS 767 (0.41 mmol H2O m-2
s-1
)
followed by Co 0238 (0.41 mmol H2O m-2
s-1
) and
both were at par and the lowest in CoH 128
(0.33 mmol H2O m-2
s-1
) and CoJ 64 (0.33 mmol H2O
m-2
s-1
) and latter two were also at par with each other
(Table 5). Stomatal closure and the resulting CO2
deficit in the chloroplasts is the main cause of
decreased photosynthesis under mild and moderate
stresses28
. Possible reasons for decrease in gas
exchange parameters include stomatal closure,
feedback inhibition due to reduced sink activity,
decreased efficiency of Rubisco, displacement of
essential cations from the endomembrane structure
(leading to changes in permeability), and swelling and
disorganization of the grana, or due to the direct
effects of salt on stomatal conductance via a reduction
in guard cell turgor and intercellular CO2
partial pressure29
.
Transpiration rate in leaves of sugarcane varieties
were significantly affected at 30% and 40% ASM
levels as compared to 50% ASM level. Transpiration
Table 6—Effect of different soil moisture regimes on transpiration rate (mmol H2O m-2 s-1) in sugarcane varieties
differing in their maturity group
Varieties/
Treatments
CoH
128
CoS
767
Co
0238
CoJ
64 Mean
CoH
128
CoS
767
Co
0238
CoJ
64
Mean CoH
128
CoS
767
Co
0238
CoJ
64 Mean
E after 60 DAP Pn after 90 DAP Pn after 120 DAP (stress revival)
Irrigation at 50%
ASM (Control)
6.79 7.13 7.31 7.03 7.06A 6.52 6.93 7.05 6.47 6.74A 6.50 7.05 7.11 6.69 6.84A
Irrigation at 40%
ASM (Mild stress)
4.24 4.84 4.75 3.70 4.38B 3.43 3.99 3.86 3.18 3.62B 6.02 6.65 6.80 6.09 6.39B
Irrigation at 30%
ASM (Severe stress)
3.17 3.69 3.15 2.93 3.23C 2.76 3.07 3.02 2.32 2.79C 5.93 6.57 6.71 5.86 6.26B
Mean 4.73B 5.22A 5.07A 4.55B 4.24B 4.66A 4.64A 3.99C 6.15B 6.76A 6.87A 6.21B
CV Varieties, 6.308; Treatments, 4.627 Varieties, 7.043; Treatments, 8.926 Varieties, 5.377; Treatments, 3.635
LSD V, 0.29 T, 0.26 T×V, 0.50 V×T, 0.51 V, 0.29 T, 0.44 T×V, NS V×T, NS V, 0.33 T, 0.27 T×V, NS V×T, NS
[Least significant difference test was applied at 5 per cent probability level to compare the mean differences. ASM, Available Soil
Moisture; V, Varieties; T, Treatments; T × V, Treatments at the same level of varieties; and V × T, Varieties at the same level of treatments]
POOJA et al.: WATER DEFICIT INDUCED CHANGES IN SUGARCANE
727
rate significantly decreased by 2.1 and 2.42 fold at
30% ASM level and 1.62 and 1.86 fold at 40% ASM
level as compared to 50% ASM level, at 60 and
90DAP, respectively (Table 6). Among the varieties,
significantly highest transpiration rate was recorded in
varieties CoS 767 (5.22 and 4.66 mmol H2O m-2
s-1
)
and Co 0238 (5.07 and 4.64 mmol H2O m-2
s-1
) and
both were at par while lowest in varieties CoH 128
(4.73 and 4.24 mmol H2O m-2
s-1
) and CoJ 64 (4.49
and 3.95 mmol H2O m-2
s-1
) at 60 and 90 DAP,
respectively. Interactive effect of varieties and ASM
levels was found significant (Table 6). At 120 DAP
(on stress revival), plant showed a significant increase
in transpiration rate and effect of different ASM
levels and interactive effect of varieties and ASM
level were found non-significant. Results are also
confirmatory with the findings of Medeiros30
that
stomatal closure may be the first response to drought
in sugarcane variety RB 867515 to minimize water
losses, once this variety reduced stomatal conductance
and transpiration rate faster than RB 962962. In other
words, such results could demonstrate the sensitivity
of RB 867515 to water deficit. The control of
physiological functions is related to plant water
content and changes in RWC seem to directly affect
the photosynthetic apparatus in sugarcane plants24
.
When plants under water deficit start to lose water,
RWC decreases and triggers a significant reduction in
the CO2 uptake rate due to the stomatal closure31
.
Chlorophyll fluorescence
Chlorophyll florescence (Fv/Fm ratio) has been
documented a reliable indicator for stress and also
correlated with the quantum yield of net
photosynthesis23,32,33
. Fv/Fm values reduced by 23.94
and 24.62% at 30% ASM level and 12.68 and 15.39%
at 40% ASM level as compared to 50% ASM level at
60 and 90 DAP, respectively (Fig. 2). A decrease in
the Fv/Fm suggests loss in photosynthesis due to
damage to the photosynthetic apparatus. It causes
disturbances in adequate electron translocation from
PSII to electron acceptor, needed for regeneration of
RuBP under stress situations34
. Colom and Vazzana35
have reported similar correlations between Fv/Fm and
drought tolerance in Erasgrostis curvula cultivars,
with high Fv/Fm values being associated with drought
tolerance and low Fv/Fm values being associated with
susceptibility to drought stress. Among the varieties,
significantly higher Fv/Fm was recorded in varieties
Co 0238 and CoS 767 as compared to varieties CoH
128 and CoJ 64 at 60 as well as 90 DAP. Interactive
effect of ASM levels and varieties was found non-
significant. At 120 DAP (on stress revival), a
significant recovery in chlorophyll fluorescence was
observed and maximum values of Fv/Fm were
recorded at 50% ASM level (0.71) followed by 40%
ASM level (0.67) and least at 30% ASM level (0.66).
Goncalves36
reported reduction of the photochemical
efficiency of photosystem II in sugarcane varieties
Fig. 2—Effect of different soil moisture regimes on chlorophyll fluorescence (Fv/Fm) and chlorophyll content (mg g-1 DW) in sugarcane
varieties differing in their maturity group.
INDIAN J EXP BIOL, OCTOBER 2019
728
when plants were submitted to 20% of field capacity.
This reduction was expressive for SP79- 1011,
RB72454, and RB98710, except for RB92579,
showing that the radiation intercepted by this variety
was used in the photochemical phase of
photosynthesis, with no damage of photosystem II
under drought stress. Keeping Fv/Fm values under
water stress similar to those values in sugarcane
plants under suitable water conditions indicates high
efficiency on the use of radiation, possibly by the
reactions of carbon assimilation30
.
Water use efficiency
Results shows that maximum water use efficiency
was recorded at 30% ASM level as compared to 40%
and 50% ASM levels at 60 and 90 DAP (Table 7).
Among the varieties, maximum water use efficiency was
recorded in Co 0238 and CoS 767 than CoH 128 and
CoJ 64. The higher water use efficiency in varieties
Co 0238 and CoS 767 might be due to lower
transpiration rate and higher photosynthetic rate under
low available soil moisture. The present findings are
confirmatory with the conclusion of Farooq37
that
maximum water use efficiency was observed under 60%
irrigation coefficient as compared to 80% and 100%
irrigation coefficient and under 60% irrigation
coefficient maximum water use efficiency was recorded
in sugarcane variety NSG than HSF-240. Jangpromma38
reported high water use efficiency in sugarcane cultivar
03-4-425 and phill66-07 and it was due to higher root
system to capture soil water. As water use efficiency
was well-associated with root traits for transpiration as
indicated by high and significant correlation. Crop that
maintain high water use efficiency under drought or
well–irrigated conditions are considered to be drought
tolerance in term of total dry matter production and
higher yield39,40
.
Biochemical parameters
Total chlorophyll content
Chlorophyll content of leaf reduced significantly at
30% ASM level (22.85 and 22.96%) followed by 40%
ASM level (13.53 and 15.72%) as compared to 50%
ASM level at 60 and 90 DAP (Fig. 2) in all the
varieties. The maximum reduction was recorded in
varieties CoJ 64 and CoH 128 than varieties Co 0238
and CoS 767. The corresponding decrease in
chlorophyll content with increasing stress conditions
implies a lower capacity of leaf tissues for light
harvesting and production of reactive oxygen species
which is mainly driven by excess energy absorption in
the photosynthetic apparatus; this might be avoided
by degrading the absorbing pigments41
. At 30% ASM
level, variety CoJ 64 showed lowest chlorophyll
content (8.99 mg g-1
DW) followed by CoH 128
(10.55 mg g-1
DW) and highest in CoS 767 (10.23 mg
g-1
DW) and Co 0238 (11.55 mg g-1
DW) at 90 DAP.
After stress revival (at 120 DAP), chlorophyll content
increased at 30, 40 and 50% ASM level, respectively
over their values recorded at 90 DAP. The present
results are in accordance with the earlier findings in
sugarcane30,42
. The deleterious effect on total
chlorophyll content due to drought has been ascribed
to its adverse effect on photosynthetic apparatus like
suppression of chloroplast development and changes
in its lamellar structure due to instability of bonds
between chlorophyll, protein lipid complex and
destruction of pigment due to oxidative damage43
.
Total soluble carbohydrates content
Total soluble carbohydrates (TSCs) content in
leaves of sugarcane varieties showed significant
increase with increase in stress intensity and sampling
time. Among the varieties, significantly higher value
Table 7—Effect of different soil moisture regimes on water use efficiency in sugarcane varieties differing in their maturity group
Varieties/
Treatments
CoH
128
CoS
767
Co
0238 CoJ 64
Mean CoH
128
CoS
767
Co
0238
CoJ
64
Mean CoH
128
CoS
767
Co
0238
CoJ
64 Mean
Chl content after 60 DAP Chl after 90 DAP Chl after 120 DAP (stress revival)
Irrigation at 50%
ASM (Control)
3.22 3.20 3.37 3.21 3.25C 2.92 3.07 3.15 2.84 3.0B 3.39 3.44 3.50 3.51 3.46
Irrigation at 40%
ASM (Mild stress)
3.05 3.66 3.85 3.11 3.42B 3.25 3.86 4.23 3.01 3.59A 3.32 3.56 3.52 3.41 3.45
Irrigation at 30%
ASM (Severe stress)
3.14 3.54 4.38 3.01 3.52A 3.01 4.25 4.64 2.73 3.66A 3.21 3.42 3.40 3.33 3.34
Mean 3.14C 3.46B 3.87A 3.11C 3.06C 3.73B 4.01A 2.86C 3.31 3.47 3.47 3.41
CV Varieties, 11.026; Treatments, 1.866 Varieties, 9.222; Treatments, 7.314 Varieties, 7.636; Treatments, 6.774
LSD V, 0.07 T, 0.35 T×V, 0.54 V×T,0.61 V, 0.30 T, 0.28 T×V, 0.52 V×T, 0.52 V, NS T, NS T×V, NS V×T, NS
[Least significant difference test was applied at 5 per cent probability level to compare the mean differences. ASM, Available Soil
Moisture; V, Varieties; T, Treatments; T × V, Treatments at the same level of varieties; and V × T, Varieties at the same level of treatments]
POOJA et al.: WATER DEFICIT INDUCED CHANGES IN SUGARCANE
729
of TSCs content were recorded in Co 0238 (19.18 mg
g-1
DW) as compared to CoS 767 (18.22 mg g-1
DW),
CoH 128 (17.23 mg g-1
DW) and CoJ 64 (16.7 mg g-1
DW) during 60 DAP (Fig. 3). However, at 90 DAP,
more amount of TSCs was accumulated i.e. Co 0238
(23.46 mg g-1
DW) and CoS 767 (23.12 mg g-1
DW)
as compared to varieties CoH 128 (20.11 mg g-1
DW)
and CoJ 64 (19.14 mg g-1
DW) that resulted into
maintenance of higher RWC, s and thus better plant
water status in these varieties by maintaining high
turgor. Medeiros30
have also reported that soluble
carbohydrates content increased in sugarcane under
drought treatment, and increase was higher in RB
86751 (51.2%) than RB 962962 (28%). Interactive
effect of varieties and ASM levels was found
significant. These changes could be related to
activation of responses to cope with this adverse
environmental condition, to assist in the maintenance
of cell water relations. The accumulation of soluble
carbohydrates during water deficient is considered a
plant response to maintain hydration of the shoot and
also protect enzyme and membrane system through
the stabilization of proteins and lipids43,44
. Increase in
soluble carbohydrates may occur at the beginning of
stress as a result of growth cessation and due to starch
degradation27
.
Proline content
Proline is a strong source to store carbon, nitrogen
and a purifier of free radicals. Proline also maintains the
structure of cell membrane and proteins20
and
contributes to membrane stability45
. It may also act as
a signalling regulatory molecule able to activate
multiple responses that are components of the
adaptation process43,46
. Similar to TSCs content,
overall accumulation of proline content was more in
leaves of Co 0238 (270.14 and 289.49 µg g-1
DW) and
CoS 767 (258.24 and 291.61 µg g-1
DW) than varieties
CoH 128 (222.94 and 247.97 µg g-1
DW) and CoJ 64
(182.53 and 217.35 µg g-1
DW) at 30% and 40% ASM
levels as compared to 50% ASM level both at 60 and
90 DAP (Fig. 3). This increased proline content acts as
an osmotic compatible solute and adjusts osmotic
potential which resulted in avoidance of drought stress.
The concentration of this metabolite usually increased
in response to drought, which showed inverse relationship
with w and s of leaf and maintained higher RWC.
Present findings are confirmatory with the results of
Farooq37
that maximum proline concentration was
observed at 60% irrigation co-efficient level, while
minimum values was at 100% irrigation co-efficient
level in sugarcane cultivar. The important role of
proline is to assist in osmotic adjustment, stabilizing
the membrane and eliminating oxygen radicals, and
preventing damage to cell structures caused by
environmental stresses in sugarcane46
.
Lipid peroxidation
Malondialdehyde (MDA) content was measured to
determine the lipid peroxidation level because MDA
Fig. 3 — Effect of different soil moisture regimes on total soluble carbohydrates (mg g-1 DW), proline content (µg g-1 DW) and lipid
peroxidation (nmol MDA g-1 DW) in sugarcane varieties differing in their maturity group.
INDIAN J EXP BIOL, OCTOBER 2019
730
is a by-product of lipid peroxidation. The content of
MDA has been considered as an indicator of oxidative
injury. MDA content showed increasing trend over
the sampling stage as well as increasing stress
intensity. Significantly higher values of MDA content
were recorded at 30% ASM level (656.69 and 706.69
nmole MDA g-1
DW) followed by 40% ASM level
(519.82 and 539.66 nmole MDA g-1
DW) and least at
50% ASM level (364.59 and 374.22 nmole MDA g-1
DW) at 60 and 90 DAP, respectively (Fig. 3).
However, extent of increment was less in varieties
CoS 767 and Co 0238 as compared to varieties CoJ
64 and CoH 128. It may be due to formation of
reactive oxygen species and increased MI. After stress
revival (at 120 DAP), the interactive effect of
varieties and ASM levels was found non-significant
and lower values were recorded in varieties CoS 767
and Co 0238 than varieties CoJ 64 and CoH 128 for
MDA content. Our results are confirmatory with the
earlier findings of Abbas47
who reported that drought
stress imposed at various stages of sugarcane crop
growth resulted in an increase in lipid peroxidation
and decrease in membrane stability. In the present
study, lower level of lipid peroxidation in varieties
CoS 767 and Co 0238 may be due to increased
activity of antioxidative enzyme APX, POX and CAT
which act as a damage control system and thus
provide protection from oxidative stress. Sairam &
Tyagi48
have also reported that antioxidative enzymes
provide protection from oxidative stress which would
otherwise cause destruction of cell membranes and
protein, DNA structure and inhibit the photosynthesis
under water stress condition.
Cane yield and Sugar yield
Water deficits during formative phase significantly
reduced cane yield and sugar yield in all the four
varieties. Among the varieties, Co 0238 produced
significantly highest cane yield (83.05 t ha-1
) followed
by CoS 767 (68.23 t ha-1
), CoH 128 (66.59 t ha-1
) and
lowest in CoJ 64 (60.43 t ha-1
). A significant decrease
in cane yield at 30% ASM level (36.18%) and 40%
ASM level (27.5%) was recorded as compared to 50%
ASM level (Fig. 4). Sugar yield is the product of cane
yield and sugar recovery. Sugar yield decreased
significantly at 30 and 40% ASM levels as compared
to 50% ASM level in all varieties. Among the
varieties, Co 0238 and CoS 767 produced higher
sugar yield as compared to CoH 128 and CoJ 64
(Fig. 4). It might be due to that reduction in sugar
Fig. 4 — Effect of different soil moisture regimes on cane yield (t ha-1) and Sugar yield (t ha-1) in sugarcane varieties differing in their
maturity group.
POOJA et al.: WATER DEFICIT INDUCED CHANGES IN SUGARCANE
731
yield contributing factors viz., cane length, single cane
weight, NMC and cane yield were less affected in
these varieties (Co 0238 and CoS 767). Similar
findings of reduction in sugar yield of different
sugarcane varieties under water stress conditions had
been reported49,50
.
Conclusion
Based upon the physiological and biochemical
analysis, it is concluded that varieties Co 0238 and
CoS 767 are identified relatively more tolerant at 40%
(moderate stress) and 30% (severe stress) ASM levels
than CoH 128 and CoJ 64, because these varieties
maintained better plant water status, higher amount of
osmoptrotectant to maintain cell turgor, membrane
integrity, canopy temperature, chlorophyll content and
gas exchange parameters, which ultimately
contributed towards higher dry matter production and
yield in these varieties. Moreover, after stress revival,
Co 0238 and CoS 767 was able to recover faster than
CoJ 64 and CoH 128, a characteristic that qualifies
these varieties to support short periods of drought
without major losses in the initial phase of its
development.
Acknowledgement
The authors are thankful to Regional Director, CCS
HAU, Uchani, Karnal for providing the required
research facilities and Director, ICAR-SBI, Coimbatore
to the senior author is duly acknowledged.
Conflict of interest
The authors declare that they have no conflict of
interest.
References 1 FAOSTAT, (The Statistics Division of the Food and
Agriculture Organization of the United Nations), 2013.
2 Lakshmanan P & Robinson N, Stress physiology: Abiotic
stresses in Sugarcane: Physiology, Biochemistry, and
Functional Biology, (Ed. Moore PH & Botha FC; Publisher
and place of publication?), 2014, 411.
3 Santillán-Fernández A, Santoyo-Cortés VH, García-Chávez LR,
Covarrubias-Gutiérrez I & Merino A, Influence of drought
and irrigation on sugarcane yields in different agroecoregions
in Mexico. Agric Syst, 143 (2016) 126.
4 Pooja, Nandwal AS, Chand M, Kumari A, Rani B, Goel V &
Singh S, Genotypic differences in growth behavior and
quality parameters of sugarcane (Saccharum officinarum)
varieties under moisture stress conditions. Indian J Agric Sci,
89 (2019) 65.
5 Ferreira THS, Tsunada MS, Bassi D, Araújo P, Mattiello L,
Guidelli GV, Righetto GL, Gonçalves VR, Lakshmanan P &
Menossi M, Sugarcane water stress tolerance mechanisms
and its implications on developing biotechnology solutions.
Front Plant Sci, 8 (2017) 1077. DOI: 10.3389/fpls.2017.01077.
6 Zingaretti SM, Rodrigues FA, da Graca JP, de Matos Pereira L
& Lourenco MV, Sugarcane responses at water deficit
conditions, water stress, (Ed. Ismail Md. Mofizur Rahman;
Water Stress, IntechOpen) (2012), DOI: 10.5772/30986.
7 Hirayama T & Shinozaki K, Research on plant abiotic stress
responses in the post-genome era: past, present and
future. Plant J, 61 (2010) 1041. DOI: 10.1111/j.
1365-313X.2010.04124.x
8 Hu H & Xiong L, Genetic engineering and breeding of
drought-resistant crops. Annu Rev Plant Biol, 65 (2014) 715.
DOI: 10.1146/annurev-arplant-050213-040000
9 You J & Chan Z, ROS regulation during abiotic stress
responses in crop plants. Front Plant Sci, 6 (2015) 1092.
DOI: 10.3389/fpls.2015.01092
10 Pooja, Nandwal AS, Chand M, Kumar A, Rani B, Kumari A
& Kulshrestha N, Comparative evaluation of changes in
protein profile of sugarcane varieties under different soil
moisture regimes. Int J Curr Microbiol Appl Sci, 6 (2017)
1203.
11 Weatherley PE, Studies in the water relation of cotton plants.
The field measurement of water deficit in leaves. New
Phytol, 49 (1950) 81.
12 Dionisio-Sese ML & Tobita S, Antioxidant responses of rice
seedlings to salinity stress. Plant Sci, 135 (1998) 1.
13 Hiscox JD & Israelstam GF, A method for the extraction of
chlorophyll from leaf tissue without maceration. Can J Bot,
57 (1979) 1332.
14 Yemm EW & Willis AJ, The estimation of carbohydrates in
plant extract by anthrone. Biochem J. 57 (1954) 508-514.
15 Bates LS, Waldren RP & Teare ID, Raid determination of
free proline for water stress studies. Plant Soil, 39
(1973) 205.
16 Heath RL & Packer L, Photoperoxidation in isolated
chloroplasts. I. Kinetics and stoichiometry of fatty acid
peroxidation. Arch Biochem Biophys, 125 (1968) 189.
17 Boaretto LF, Carvalho G, Borgo L, Creste S, Landell MGA,
Mazzafera P & Azevedo RA, Water stress reveals
differential antioxidant responses of tolerant and non-tolerant
sugarcane genotypes. Plant Physiol Biochem, 7 (2014) 165.
18 Medeiros DB, Silva EC, Santos HRB, Pacheco CM, Musser RS
& Nogueira RJMC, Physiological and biochemical response
to drought stress in the Barbados cherry. Braz J Plant
Physiol, 24 (2012) 181.
19 Flower DJ & Ludlow MM, Contribution of osmotic
adjustment to the dehydration tolerance of water stressed
pigeon pea (Cajanus cajan L.) leaves. Plant Cell Env,
9 (1986) 33.
20 Silva MA, Jifon JL, dos Santos CM, Jadoski CJ & da Silva JAG,
Photosynthetic capacity and water use efficiency in
sugarcane genotypes subject to water deficit during early
growth phase. Braz Arch Biol Tech, 56 (2013) 735.
21 Martin U, Alladru SG & Bahari ZA, Dehydration tolerance
of leaf tissues of six woody angiosperm species. Physiol
Plant, 69 (1987), 182.
22 Jacobs A, Ford K, Kretschmer J & Tester M, Rice plants
expressing the moss sodium pumping ATPase PpENA1
maintain greater biomass production under salt stress. Plant
Biotech J, 9 (2011) 838.
INDIAN J EXP BIOL, OCTOBER 2019
732
23 Graca JP, Rodrigues FA, Farias JRB, Oliveira MCN,
Hoffmann-Campo CB & Zingaretti SM, Physiological
parameters in sugarcane cultivars submitted to water deficit.
Braz J Plant Physiol, 22 (2010) 189.
24 Sage R & Kubien DS, The temperature response of C3 and
C4 photosynthesis. Plant Cell Env, 30 (2007) 1086.
25 Lawlor DW & Tezara W, Causes of decreased
photosynthetic rate and metabolic capacity in water deficient
leaf cells: a critical evaluation of mechanisms and integration
of processes. Ann Bot, 103 (2009) 561.
26 Kumar A, Kumar A, Kumar P, Lata C & Kumar S, Effect of
individual and interactive alkalinity and salinity on
physiological, biochemical and nutritional traits of marvel
grass. Indian J Expt Biol, 56 (2018a) 573.
27 Galmes J, Ribas-Carbo M, Medrano H & Flexas J, Rubisco
activity in Mediterranean species is regulated by the
chloroplastic CO2 concentration under water stress. J Expt
Bot, 62 (2011) 653.
28 Flexas J & Medrano H, Drought inhibition of photosynthesis
in C3 plants: Stomatal and non stomatal limitation revisited.
Ann Bot, 89 (2002) 183.
29 Dionisio-Sese ML & Tobita S, Effects of salinity on sodium
content and photosynthetic responses of rice seedlings
differing in salt tolerance. J Plant Physiol, 157 (2000) 54.
30 Medeiros DB, da Silva EC, Nogueira RJMC, Teixeira MM &
Buckeridge MS, Physiological limitations in two sugarcane
varieties under water suppression and after recovering. Theo
Expt Plant Physiol, 25 (2013) 213.
31 Buckley TN, The control of stomata by water balance. New
Phytol, 168 (2005) 275.
32 Kumar A, Kumar A, Lata C & Kumar S, Eco-physiological
responses of Aeluropus lagopoides (grass halophyte) and Suaeda
nudiflora (non-grass halophyte) under individual and interactive
sodic and salt stress. South Afr J Bot, 105 (2016) 36.
33 Silva MA, Jifon JL, Sharma V, da Silva JAG, Caputo MM &
Damaj MB, Use of physiological parameters in screening
drought tolerance in sugarcane genotypes. Sugar Tech,
13 (2011) 178.
34 Kafi M, The effects of salinity and light on photosynthesis,
respiration and chlorophyll fluorescence in salt-tolerant and
salt-sensitive wheat (Triticum aestivum L.) cultivars. J Agr
Sci Tech, 11 (2009) 535.
35 Colom MR & Vazzana C, Photosynthesis and PSII
functionality of drought-resistant and drought sensitive
weeping lovegrass plants. Env Expt Bot, 49 (2003) 135.
36 Goncalves ER, Ferreira VM, Silva JV, Endres L, Barbosa TP
& Duarte WG, Gas exchange and chlorophyll a fluorescence
of sugarcane varieties submitted to water stress. Rev Bras
Eng Agric, 14 (2010) 378.
37 Farooq U, Mehmood S, Afghan S, Shahzad A & Asad M,
Comparative study on agro-physiology of sugarcane
(Saccharum officinarum L.) genotypes at different irrigation
co-efficient values. Pak J Bot, 47 (2015) 527.
38 Jangpromma N, Thammasirirak S, Jaisil P & Songsri P,
Effects of drought and recovery from drought stress on above
ground and root growth, and water use efficiency in
sugarcane (Saccharum officinarum L.). Aust J Crop Sci,
6 (2012) 1298.
39 Jongrunklang N, Toomsan B, Vorasoot N, Jogloy S, Kesmala T
& Patanothai A, Identification of peanut genotypes with
water use efficiency under drought stress conditions from
peanut germplasm of diverse origins. Asian J Plant Sci, 7
(2008) 628.
40 Songsri P, Jogloy S, Holbrook CC, Kesmala T, Vorasoot N,
Akkasaeng C & Patanothai A, Association of root, specific
leaf area and SPAD chlorophyll meter reading to water use
efficiency of peanut under different available soil water. Agr
Water Manage, 96 (2009) 790.
41 Herbinger K, Tausz M, Wonisch A, Soja G, Sorger A & Grill D,
Complex interactive effects of drought and ozone stress on
the antioxidant defence systems of two wheat cultivars. Plant
Physiol Biochem, 40 (2002) 691.
42 Cha-um S, Wangmoon S, Mongkolsiriwatana C, Ashraf M &
Kirdmanee C, Evaluating sugarcane (Saccharum sp.)
cultivars for water deficit tolerance using some key
physiological markers. Plant Biotech, 29 (2012) 431.
43 Kumar A, Krishnamurthy SL, Lata C, Kumar P, Devi R,
Kulshrestha N, Yadav RK & Sharma SK, Effect of dual
stress (salinity and drought) on gas exchange attributes and
chlorophyll fluorescence characteristics in rice. Indian J
Agric Sci, 86 (2016) 19.
44 Lawlor DW, Limitation to photosynthesis in water stressed
leaves: stomata versus metabolism and the role of ATP. Ann
Bot, 89 (2002) 1.
45 Zhou Q & Yu B, Plant physiology and biochemistry changes
in content of free, conjugated and bound polyamines and
osmotic adjustment in adaptation of vetiver grass to water
deficit. Plant Physiol Biochem, 48 (2010) 417.
46 Lata C, Kumar A, Sharma SK, Singh J, Sheokand S, Pooja,
Mann A & Rani B, Tolerance to combined boron and salt
stress in wheat varieties: Biochemical and molecular
characterization. Indian J Expt Biol, 55 (2017) 321.
47 Abbas SR, Ahmad SD, Sabir SM, Wajid A, Aiya B, Abbas
MR & Sabir HS, Screening of drought tolerant genotypes of
sugarcane through biochemical markers against polyethylene
glycol. Int J Sci Eng Res, 4 (2013) 980.
48 Sairam RK &Tyagi A, Physiology and molecular biology of
salinity stress tolerance in plants. Curr Sci, 86 (2004) 407.
49 da Silva ALC & da Costa WAJM, Varietal variation in
growth, physiology and yield of sugarcane under two
contrasting water regimes. Trop Agr Res, 16 (2004) 1.
50 Khan IA, Bibi S, Yasmin S, Khatri A & Seema N,
Phenotypic and genotypic diversity investigations in
sugarcane for drought tolerance and sucrose content. Pak J
Bot, 45 (2013) 359.