24
Varma’s Interim Report 1 January–30 June 2016 15 August 2016 15 August 2016 | Varma's Interim Report 1 January–30 June 2016 1
| Date post: | 16-Apr-2017 |
| Category: |
Presentations & Public Speaking |
| Upload: | tyoeelaekeyhtioe-varma |
| View: | 1,012 times |
| Download: | 0 times |
Varma’s Interim Report
1 January–30 June 201615 August 2016
15 August 2016 | Varma's Interim Report 1 January–30 June 20161
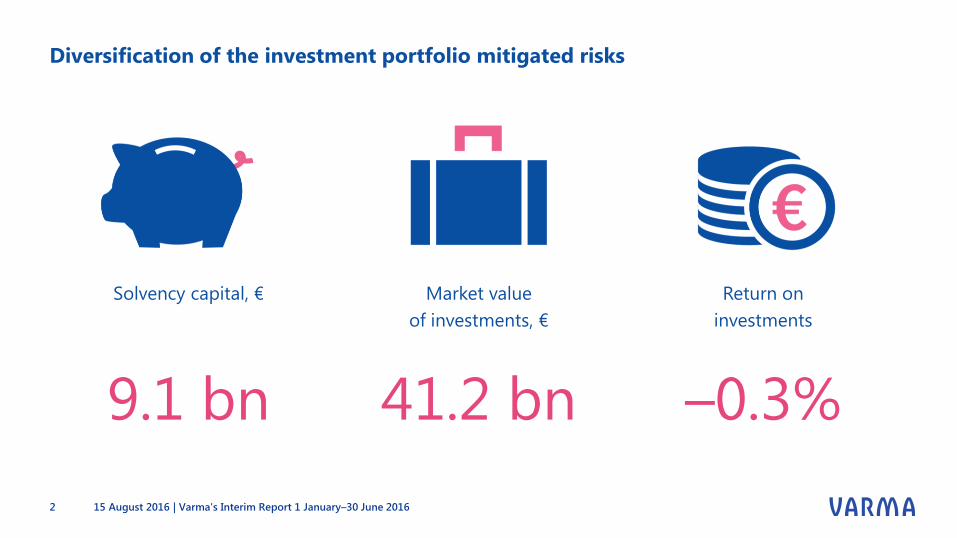
Diversification of the investment portfolio mitigated risks
Market value
of investments, €
41.2 bn
Return on
investments
–0.3%
Solvency capital, €
9.1 bn
15 August 2016 | Varma's Interim Report 1 January–30 June 20162
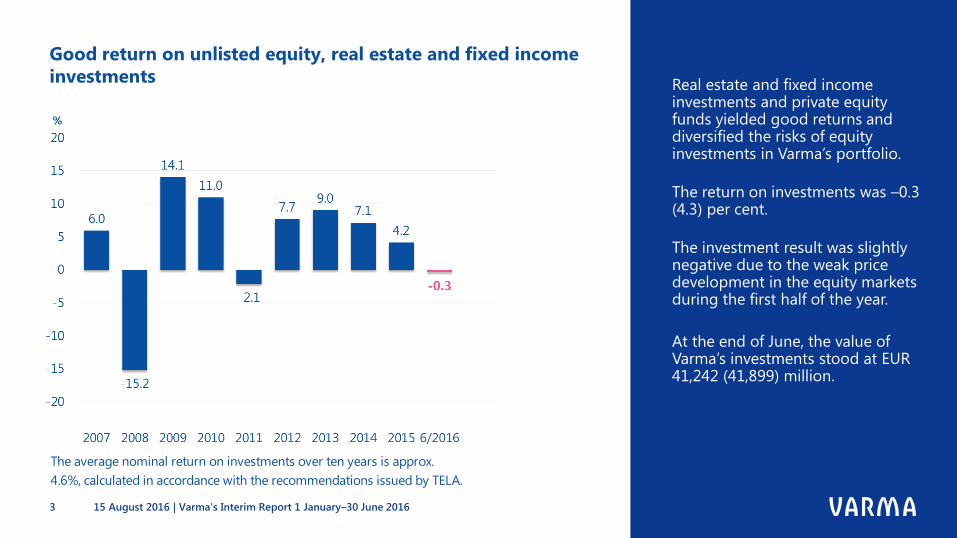
Good return on unlisted equity, real estate and fixed income
investments Real estate and fixed income investments and private equity funds yielded good returns and diversified the risks of equity investments in Varma’s portfolio.
The return on investments was –0.3 (4.3) per cent.
The investment result was slightly negative due to the weak price development in the equity markets during the first half of the year.
At the end of June, the value of Varma’s investments stood at EUR 41,242 (41,899) million.
15 August 2016 | Varma's Interim Report 1 January–30 June 20163
The average nominal return on investments over ten years is approx.
4.6%, calculated in accordance with the recommendations issued by TELA.

1-6/2016 1-12/2015 24 mReturn Return
MWR MWR Vola-€ mill. % € mill. % % % tility
14,614 35 12,268 30 2.2 -0.4
Loan receivables 1,345 3 1,361 3 1.9 2.4
Bonds 11,238 27 8,757 21 3.0 -0.9 2.9
Public bonds 4,649 11 2,653 6 3.2 -2.5
Other bonds 6,589 16 6,105 15 2.9 0.4
Other money-market instruments and deposits 2,031 5 2,151 5 -0.4 0.5
15,266 37 18,465 45 -3.1 8.8
Listed equities 11,848 29 14,938 36 -5.5 8.0 12.6
Private equity 2,592 6 2,617 6 4.0 7.8
Unlisted equities 826 2 909 2 13.5 21.2
3,855 9 3,906 9 2.6 3.3
Direct real estates 3,154 8 3,313 8 2.6 2.3
Real estate funds 701 2 593 1 2.9 9.9
6,808 17 6,991 17 -0.8 3.5
Hedge funds 6,505 16 6,663 16 -0.6 3.9 2.9
Commodities 315 1 352 1
Other investments -13 0 -24 0
40,544 98 41,630 101 -0.3 4.2 5.2
Impact of derivatives 698 2 -336 -1
41,242 100 41,293 100
The modified duration for all the bonds is 4.11)
Includes accrued interest
Real estate investments
Other investments
Total investments
Investment allocation at fair value
30-June-2016 31-December-2015
Risk position Risk positionMarket valueMarket value
Fixed-income investments 1)
Equity investments
Investments classified according to risk
15 August 2016 | Varma's Interim Report 1 January–30 June 20164

Return development since 2009, cumulative return roughly 62.0%, i.e. €16 bn
15 August 2016 | Varma's Interim Report 1 January–30 June 20165
The capital markets recovered in Q2 from the major market plummet of the first quarter
90
100
110
120
130
140
150
160
170
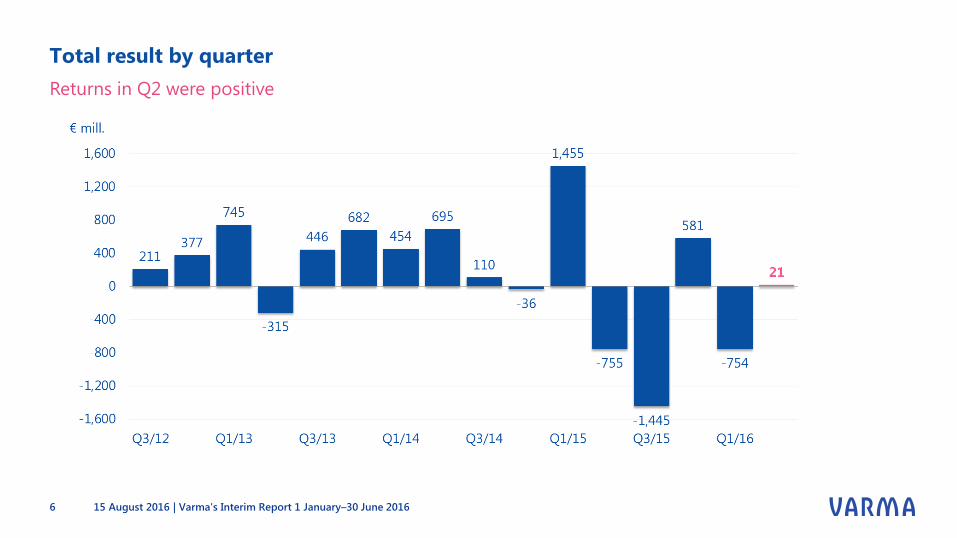
Total result by quarter
15 August 2016 | Varma's Interim Report 1 January–30 June 20166
Returns in Q2 were positive
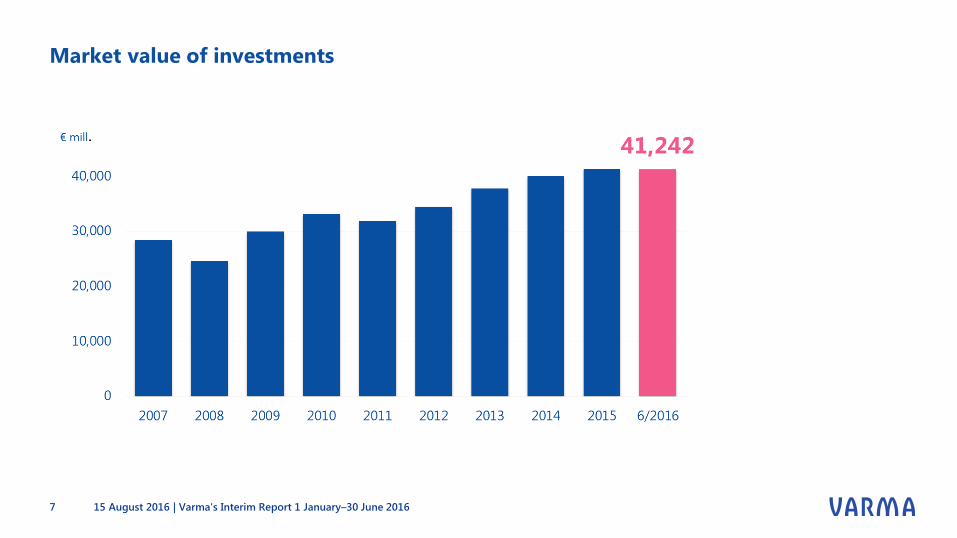
Market value of investments
15 August 2016 | Varma's Interim Report 1 January–30 June 20167

Investment allocation
15 August 2016 | Varma's Interim Report 1 January–30 June 20168

Investment returns for Varma and the markets
15 August 2016 | Varma's Interim Report 1 January–30 June 20169
Q2 nominal return 1.0%
% Varma
Finnish
equities
European
equities US equities
Euro
government
bonds
Euro
corporate
bonds
6/2016 -0.3 -1.0 -7.8 3.8 5.7 4.1
2015 4.2 15.9 9.6 1.4 1.6 -0.7
Average nominal return
5 years 4.8 9.0 6.9 12.1 7.3 5.4
10 years 4.6 6.2 3.3 7.4 5.5 4.7
Since 1999 *
5.4 7.9 3.6 5.1 5.1 4.6
Average real return
5 years 3.6 7.9 5.8 10.9 6.2 4.3
10 years 2.9 4.5 1.6 5.7 3.8 3.0
Since 1999 *
3.7 6.2 2.0 3.4 3.4 2.9
* Varma, as it is today, was founded in mid-1998, so comparison data earlier than 1999 is not available.
Finnish equities = OMX Helsinki Cap Index Euro government bonds = IBOXX Eurozone EUR (Total Return)
European equities = Stoxx 600 Total Return Index EUR Euro corporate bonds = IBOXX Corporate Overall Performance Index EUR (Total Return)
US equities= S&P500 Total Return Index
Solvency and efficiency
15 August 2016 | Varma's Interim Report 1 January–30 June 201610

Solvency capital
Solvency remained high, at 28.3%
15 August 2016 | Varma's Interim Report 1 January–30 June 201611

Solvency
Solvency capital was strong
• EUR 9,136 (10,956) million
• 28.3 (35.3) per cent of the
technical provisions
• 2.0 (2.1) times the solvency
limit
15 August 2016 | Varma's Interim Report 1 January–30 June 201612

Loading profit
• We handle pension cover cost-
effectively.
• We used 75 per cent of the expense
loading included in the insurance
contributions for operating
expenses.
• The loading profit was EUR 17 (17)
million.
• Earnings-related pension insurance
companies have agreed that the
expense loading included in
insurance contributions, determined
by the common calculation
principles, will be cut by roughly
7 per cent at the start of 2017.
15 August 2016 | Varma's Interim Report 1 January–30 June 201613
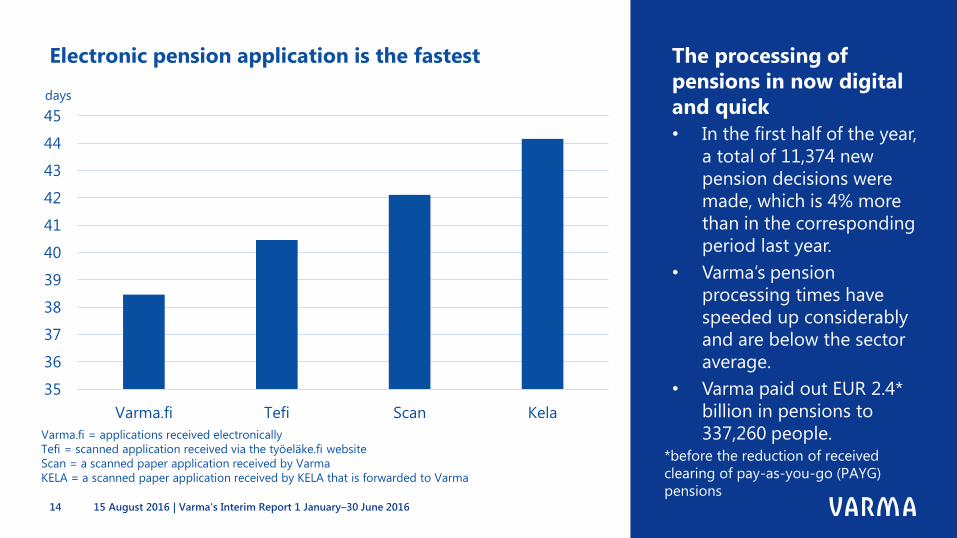
Electronic pension application is the fastest The processing of
pensions in now digital
and quick
• In the first half of the year,
a total of 11,374 new
pension decisions were
made, which is 4% more
than in the corresponding
period last year.
• Varma’s pension
processing times have
speeded up considerably
and are below the sector
average.
• Varma paid out EUR 2.4*
billion in pensions to
337,260 people.
15 August 2016 | Varma's Interim Report 1 January–30 June 201614
Varma.fi = applications received electronically
Tefi = scanned application received via the työeläke.fi website
Scan = a scanned paper application received by Varma
KELA = a scanned paper application received by KELA that is forwarded to Varma
35
36
37
38
39
40
41
42
43
44
45
Varma.fi Tefi Scan Kela
days
*before the reduction of received
clearing of pay-as-you-go (PAYG)
pensions
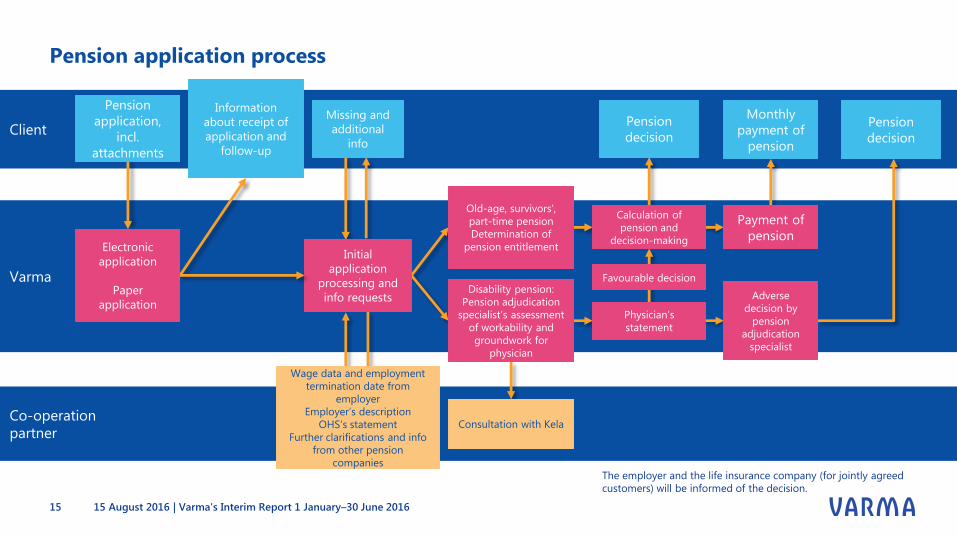
Pension application process
15 August 2016 | Varma's Interim Report 1 January–30 June 201615
Client
Co-operation
partner
Varma
Information
about receipt of
application and
follow-up
Pension
application,
incl.
attachments
Old-age, survivors’,
part-time pension
Determination of
pension entitlement
Physician’s
statement
Favourable decision
Missing and
additional
info
Pension
decision
Calculation of
pension and
decision-making
Monthly
payment of
pension
Payment of
pension
Wage data and employment
termination date from
employer
Employer’s description
OHS’s statement
Further clarifications and info
from other pension
companies
Disability pension:
Pension adjudication
specialist’s assessment
of workability and
groundwork for
physician
Consultation with Kela
Initial
application
processing and
info requests
Electronic
application
Paper
application
Pension
decision
Adverse
decision by
pension
adjudication
specialist
The employer and the life insurance company (for jointly agreed
customers) will be informed of the decision.
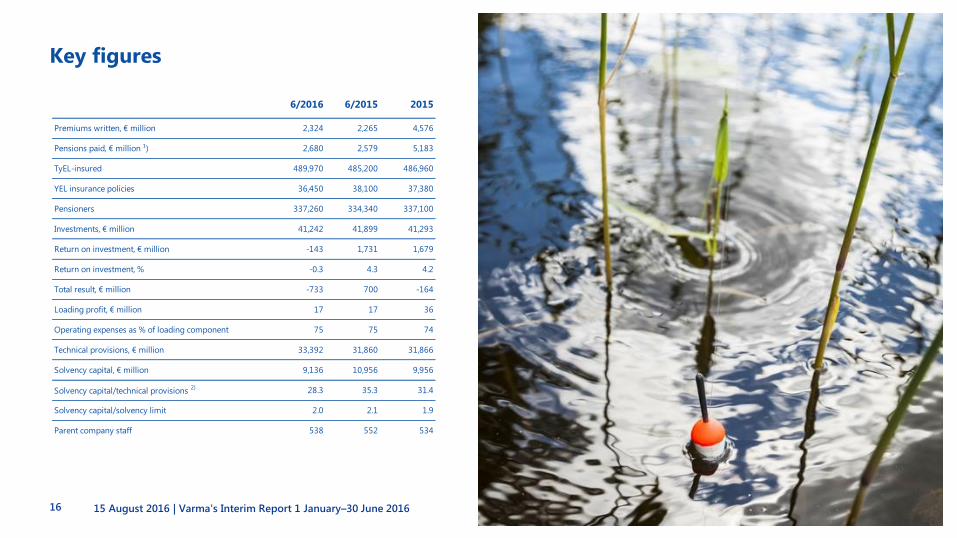
Key figures
15 August 2016 | Varma's Interim Report 1 January–30 June 201616
6/2016 6/2015 2015
Premiums written, € million 2,324 2,265 4,576
Pensions paid, € million ¹) 2,680 2,579 5,183
TyEL-insured 489,970 485,200 486,960
YEL insurance policies 36,450 38,100 37,380
Pensioners 337,260 334,340 337,100
Investments, € million 41,242 41,899 41,293
Return on investment, € million -143 1,731 1,679
Return on investment, % -0.3 4.3 4.2
Total result, € million -733 700 -164
Loading profit, € million 17 17 36
Operating expenses as % of loading component 75 75 74
Technical provisions, € million 33,392 31,860 31,866
Solvency capital, € million 9,136 10,956 9,956
Solvency capital/technical provisions 2) 28.3 35.3 31.4
Solvency capital/solvency limit 2.0 2.1 1.9
Parent company staff 538 552 534

Responsibility
15 August 2016 | Varma's Interim Report 1 January–30 June 201617

15 August 2016 | Varma's Interim Report 1 January–30 June 201618
Vision.
CSR is part of Varma’s daily
operations. We actively
communicate what CSR means
to us and how our responsible
operations show in society. We
continuously develop our
responsible ways of operating.
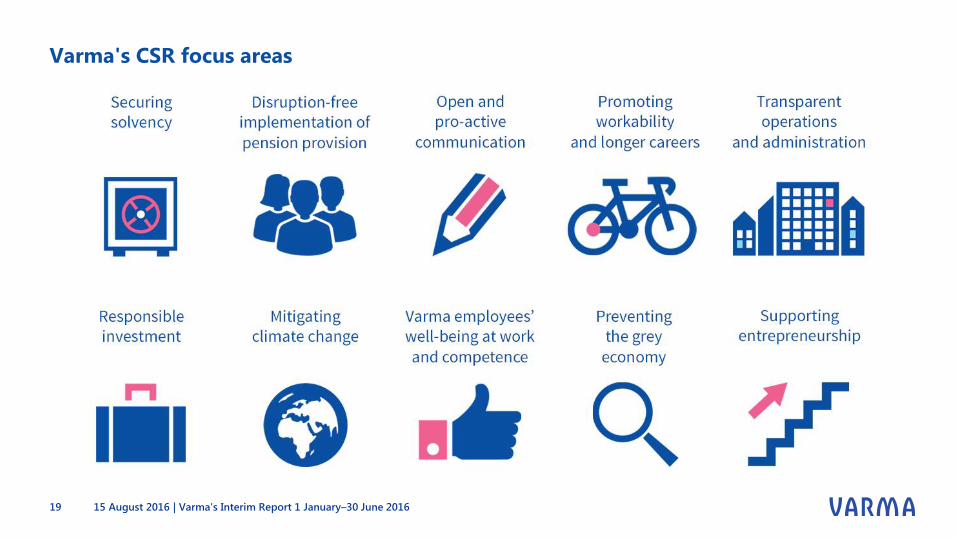
Varma's CSR focus areas
15 August 2016 | Varma's Interim Report 1 January–30 June 201619

Responsible investment
• In May, Varma published a climate
policy that steers its investments. It
was the first Finnish earnings-related
pension company to do so.
• Varma joined the Montréal Carbon
Pledge initiative, in which investors
commit to measure and publicly
disclose the carbon footprint of their
listed equity investments annually.
• Varma also signed the CDP (formerly
Carbon Disclosure Project), which
compiles data on companies’
greenhouse gas emissions and other
climate-change-related data.
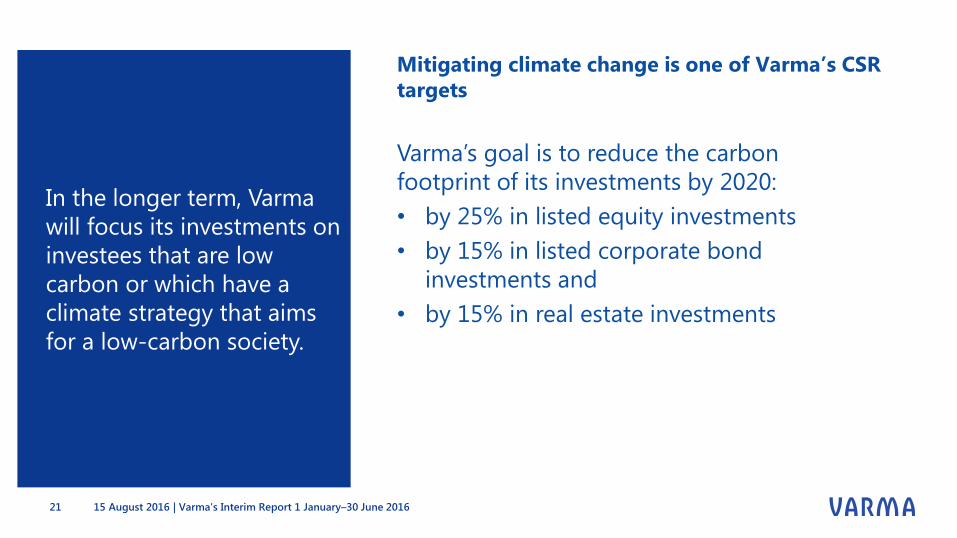
Mitigating climate change is one of Varma’s CSR
targets
15 August 2016 | Varma's Interim Report 1 January–30 June 201621
Varma’s goal is to reduce the carbon
footprint of its investments by 2020:
• by 25% in listed equity investments
• by 15% in listed corporate bond
investments and
• by 15% in real estate investments
In the longer term, Varma
will focus its investments on
investees that are low
carbon or which have a
climate strategy that aims
for a low-carbon society.

Current issues
15 August 2016 | Varma's Interim Report 1 January–30 June 201622
• Economic and political uncertainty
continue – attention shifts from Brexit to
US presidential election
• Global economic growth will continue, but
at a slower pace than during the years
immediately following the financial crisis
• Monetary policy will continue to focus on
stimulus measures – nominal interest rates
in the eurozone will remain exceptionally
low
• Varma’s strong solvency and investment
risk management secure pensions in
unstable markets
Current issues
15 August 2016 | Varma's Interim Report 1 January–30 June 201623