Vasopressin activates Akt/mTOR pathway in smooth muscle cells cultured in high glucose concentration Daniela K. Montes a , Marianne Brenet a , Vanessa C. Muñoz a , Patricia V. Burgos a , Carolina I. Villanueva a , Carlos D. Figueroa b , Carlos B. González a,c,⇑ a Department of Physiology, Universidad Austral de Chile, Valdivia 509-9200, Chile b Department of Anatomy, Histology and Pathology, Universidad Austral de Chile, Valdivia 509-9200, Chile c Department of Neuroscience and Cell Biology, University of Texas Medical Branch, Galveston, TX 77555, United States article info Article history: Received 29 October 2013 Available online 8 November 2013 Keywords: Vasopressin mTOR Akt PI3-kinase Vascular remodeling abstract Mammalian target of rapamycin (mTOR) complex is a key regulator of autophagy, cell growth and pro- liferation. Here, we studied the effects of arginine vasopressin (AVP) on mTOR activation in vascular smooth muscle cells cultured in high glucose concentration. AVP induced the mTOR phosphorylation in A-10 cells grown in high glucose, in contrast to cells cul- tured in normal glucose; wherein, only basal phosphorylation was observed. The AVP-induced mTOR phosphorylation was inhibited by a PI3K inhibitor. Moreover, the AVP-induced mTOR activation inhibited autophagy and increased thymidine incorporation in cells grown in high glucose. This increase was abol- ished by rapamycin which inhibits the mTORC1 complex formation. Our results suggest that AVP stimulates mTOR phosphorylation by activating the PI3K/Akt signaling pathway and, subsequently, inhibits autophagy and raises cell proliferation in A-10 cells maintained in high glucose concentration. Ó 2013 Elsevier Inc. All rights reserved. 1. Introduction Hyperglycemia is one of the complications of diabetes leading to arteriosclerosis and hypertension. Changes in nutrients, as glucose, result in changes of the AMP/ATP ratio, such that, low ATP level is detected by the AMPK which, in turn, phosphorylates TSC2. The activated TSC2 reduces mTOR complex 1 activity by inhibiting the small GTPase protein Rheb [1]. On the other hand, nutrients can also regulate mTORC1 by activating PLD and, therefore, production of phosphatidic acid, which binds and stabilizes mTORC1 complex [2,3]. In addition, mTORC1 is also positively regulated by growth factors and mitogens through two key signaling pathways; the PI3K/Akt and Ras/RAF/ERK pathways that activate mTORC1 [4–6] by inhibiting the GTPase-activating protein activity of the TSC1/ TSC2 complex and thus, promoting mTORC1 function, which even- tually can, on one hand, stimulates protein translation and hence cell growth and proliferation and on the other, inhibits autophagy. Therefore, mTOR pathway integrates signals from nutrients, energy balance and hormones to regulate a variety of processes, including autophagy, metabolism, cell growth and proliferation. High extracellular glucose concentration, such as that found in poorly controlled diabetic syndrome, produce an osmotically- induced AVP secretion from the neurohypophysis [7]. Indeed, patients undergoing a hyperglycemic condition have high levels of plasma AVP; almost the double compared with normal subjects and simultaneously, a decrease in the AVP content in the neural lobe due to AVP hypersecretion [8,9]. Recently, it has been found, in population studies, an association of an increase in the AVP sys- tem activity and diabetes mellitus [10–12]. It is well known that AVP increases cell proliferation by EGFR transactivation and hence activation of the MEK/ERK pathway [13–16]. Since two factors affecting the mTOR activity, that is, nutrients and mitogens, converges in the diabetic mellitus, we decided to analyze the effect of AVP on mTOR activity, when smooth muscle cells are cultured in a high glucose concentration, to shed light on the mechanisms of hyperglycemia as a risk factor for cardiovascular diseases. 2. Methods 2.1. Cell culture A-10 cells (ATCC CRL 1476), derived from smooth muscle cells of rat aorta, were cultured to subconfluency on 60 mm dishes in 0006-291X/$ - see front matter Ó 2013 Elsevier Inc. All rights reserved. http://dx.doi.org/10.1016/j.bbrc.2013.10.169 Abbreviations: AVP, arginine vasopressin; mTOR, mammalian target of rapamycin; mTORC1, mTOR complex 1; PI3K, phosphatidyl inositol-3 kinase; AMPK, AMP-activated protein kinase; PKC, protein kinase C, Akt or protein kinase B; TSC1/TSC2, tubero sclerosis protein 1 and 2; Rheb, ras homolog enriched in brain; PLD, phospholipase D; ERK, extracellular regulated-kinase. ⇑ Corresponding author at: Edif Ciencias Biomédicas, Of. 406, Universidad Austral de Chile, Campus Isla Teja, Valdivia, Chile. Fax: +56 63 222 1513. E-mail address: [email protected](C.B. González). Biochemical and Biophysical Research Communications 441 (2013) 923–928 Contents lists available at ScienceDirect Biochemical and Biophysical Research Communications journal homepage: www.elsevier.com/locate/ybbrc
Transcript
Biochemical and Biophysical Research Communications 441 (2013) 923–928
Contents lists available at ScienceDirect
Biochemical and Biophysical Research Communications
journal homepage: www.elsevier .com/locate /ybbrc
Vasopressin activates Akt/mTOR pathway in smooth muscle cellscultured in high glucose concentration
0006-291X/$ - see front matter � 2013 Elsevier Inc. All rights reserved.http://dx.doi.org/10.1016/j.bbrc.2013.10.169
Abbreviations: AVP, arginine vasopressin; mTOR, mammalian target ofrapamycin; mTORC1, mTOR complex 1; PI3K, phosphatidyl inositol-3 kinase;AMPK, AMP-activated protein kinase; PKC, protein kinase C, Akt or protein kinaseB; TSC1/TSC2, tubero sclerosis protein 1 and 2; Rheb, ras homolog enriched inbrain; PLD, phospholipase D; ERK, extracellular regulated-kinase.⇑ Corresponding author at: Edif Ciencias Biomédicas, Of. 406, Universidad Austral
Daniela K. Montes a, Marianne Brenet a, Vanessa C. Muñoz a, Patricia V. Burgos a,Carolina I. Villanueva a, Carlos D. Figueroa b, Carlos B. González a,c,⇑a Department of Physiology, Universidad Austral de Chile, Valdivia 509-9200, Chileb Department of Anatomy, Histology and Pathology, Universidad Austral de Chile, Valdivia 509-9200, Chilec Department of Neuroscience and Cell Biology, University of Texas Medical Branch, Galveston, TX 77555, United States
a r t i c l e i n f o
Article history:Received 29 October 2013Available online 8 November 2013
Mammalian target of rapamycin (mTOR) complex is a key regulator of autophagy, cell growth and pro-liferation. Here, we studied the effects of arginine vasopressin (AVP) on mTOR activation in vascularsmooth muscle cells cultured in high glucose concentration.
AVP induced the mTOR phosphorylation in A-10 cells grown in high glucose, in contrast to cells cul-tured in normal glucose; wherein, only basal phosphorylation was observed. The AVP-induced mTORphosphorylation was inhibited by a PI3K inhibitor. Moreover, the AVP-induced mTOR activation inhibitedautophagy and increased thymidine incorporation in cells grown in high glucose. This increase was abol-ished by rapamycin which inhibits the mTORC1 complex formation.
Our results suggest that AVP stimulates mTOR phosphorylation by activating the PI3K/Akt signalingpathway and, subsequently, inhibits autophagy and raises cell proliferation in A-10 cells maintained inhigh glucose concentration.
� 2013 Elsevier Inc. All rights reserved.
1. Introduction balance and hormones to regulate a variety of processes, including
Hyperglycemia is one of the complications of diabetes leading toarteriosclerosis and hypertension. Changes in nutrients, as glucose,result in changes of the AMP/ATP ratio, such that, low ATP level isdetected by the AMPK which, in turn, phosphorylates TSC2. Theactivated TSC2 reduces mTOR complex 1 activity by inhibiting thesmall GTPase protein Rheb [1]. On the other hand, nutrients can alsoregulate mTORC1 by activating PLD and, therefore, production ofphosphatidic acid, which binds and stabilizes mTORC1 complex[2,3]. In addition, mTORC1 is also positively regulated by growthfactors and mitogens through two key signaling pathways; thePI3K/Akt and Ras/RAF/ERK pathways that activate mTORC1 [4–6]by inhibiting the GTPase-activating protein activity of the TSC1/TSC2 complex and thus, promoting mTORC1 function, which even-tually can, on one hand, stimulates protein translation and hencecell growth and proliferation and on the other, inhibits autophagy.Therefore, mTOR pathway integrates signals from nutrients, energy
autophagy, metabolism, cell growth and proliferation.High extracellular glucose concentration, such as that found in
poorly controlled diabetic syndrome, produce an osmotically-induced AVP secretion from the neurohypophysis [7]. Indeed,patients undergoing a hyperglycemic condition have high levelsof plasma AVP; almost the double compared with normal subjectsand simultaneously, a decrease in the AVP content in the neurallobe due to AVP hypersecretion [8,9]. Recently, it has been found,in population studies, an association of an increase in the AVP sys-tem activity and diabetes mellitus [10–12].
It is well known that AVP increases cell proliferation by EGFRtransactivation and hence activation of the MEK/ERK pathway[13–16]. Since two factors affecting the mTOR activity, that is,nutrients and mitogens, converges in the diabetic mellitus, wedecided to analyze the effect of AVP on mTOR activity, whensmooth muscle cells are cultured in a high glucose concentration,to shed light on the mechanisms of hyperglycemia as a risk factorfor cardiovascular diseases.
2. Methods
2.1. Cell culture
A-10 cells (ATCC CRL 1476), derived from smooth muscle cellsof rat aorta, were cultured to subconfluency on 60 mm dishes in
924 D.K. Montes et al. / Biochemical and Biophysical Research Communications 441 (2013) 923–928
DMEM containing 10% fetal bovine serum and 5.5 mM glucose (LG,low glucose) or 25 mM glucose (HG, high glucose) for ten days.After serum starvation for 16 h the cells were treated with AVPin the absence or presence of inhibitors. The reaction was stoppedby the addition of 100 ll of ice-cold RIPA buffer (150 mM NaCl,50 mM Tris/HCl pH 7.4, 0.5% sodium deoxycholic acid 1% NonidetP40, 0.1% SDS, 1 mM EDTA, 1 mM Na3VO4, 1 mM NaF, 0.1 mMphenylmethane-sulphonyl fluoride, 1 lg/mL leupeptin, 5 lg/mLsoy bean trypsin inhibitor). Proteins were determined and avolume containing approximately 15 lg of protein was mixed withelectrophoresis sample buffer. In some experiments, cells wereincubated for 30 min with each of the following inhibitors:10 lM Gö6983, 50 lM PD98059, 1 lM AG 1478, 10 lMLY294002, 0.1 lM Rapamycin, 0.3% 1-butanol or 1 mM N-acetyl-L-cysteine (NAC) prior to stimulation with AVP.
2.2. Western blotting
Cell extracts were fractionated using 8% polyacrylamide gelelectrophoresis, to detect mTOR or 12% polyacrylamide gels to de-tect Akt. Proteins were electrotransferred onto nitrocellulose filtersusing 0.05% SDS in the transfer buffer (20 mM Tris–glycine pH 8.3and 20% methanol). Blots were incubated with anti-phospho mTOR(Ser2448) or anti-phospho Akt (S473) antibodies at a dilution of1:1000 (Cell Signaling Technology, Inc., MA, USA). Blots were thenincubated with peroxidase-labeled secondary antibody at a dilu-tion of 1:50,000 followed by chemiluminescence (SuperSignal,Thermo Scientific, IL, USA).
2.3. Cell proliferation assay
Vascular smooth muscle A-10 cells were seeded in 96-wellplates at a cell density of 5 � 103 cells per well. Cells were synchro-nized for 24 h and then stimulated with AVP (50 nM) for 48 h. DNAsynthesis was measured by the incorporation of [3H]Thymidine. Allthe values are reported as the mean ± SE of triplicate experiments.To standardize the results, absolute counts were converted to apercentage of the control.
2.4. Data analysis
Densitometric analyses of gel digital images were carried outusing the UN-SCAN-IT gel software (Silk Scientific, Inc., Orem, UT,USA) and the relative phosphorylated protein density level wasnormalized by comparison to the total protein signal. Values areexpressed as means ± SE. Statistical analyses were performed byone-way repeated measures analysis of variance followed byHolm-Sidak method by multiple comparisons versus time zero(without AVP treatment) using SigmaPlot version 12 software.When it was necessary, the data were analyzed by t-test. Valuesof P < 0.05 were considered statistically significant.
3. Results
3.1. AVP stimulates mTOR phosphorylation in A-10 cells cultures in ahigh extracellular glucose concentration
A-10 cells were maintained for 16 h without fetal bovine serumin DMEM containing 5.5 mM glucose, and then the concentrationof glucose was raised to 25 mM and cells maintained for differenttimes from 15 min to 72 h. The analysis of the phosphorylation ofmTOR by Western blotting using a specific antibody against thephosphorylated serine residue 2448 showed no significant varia-tions in the phosphorylation state at any time after changing the
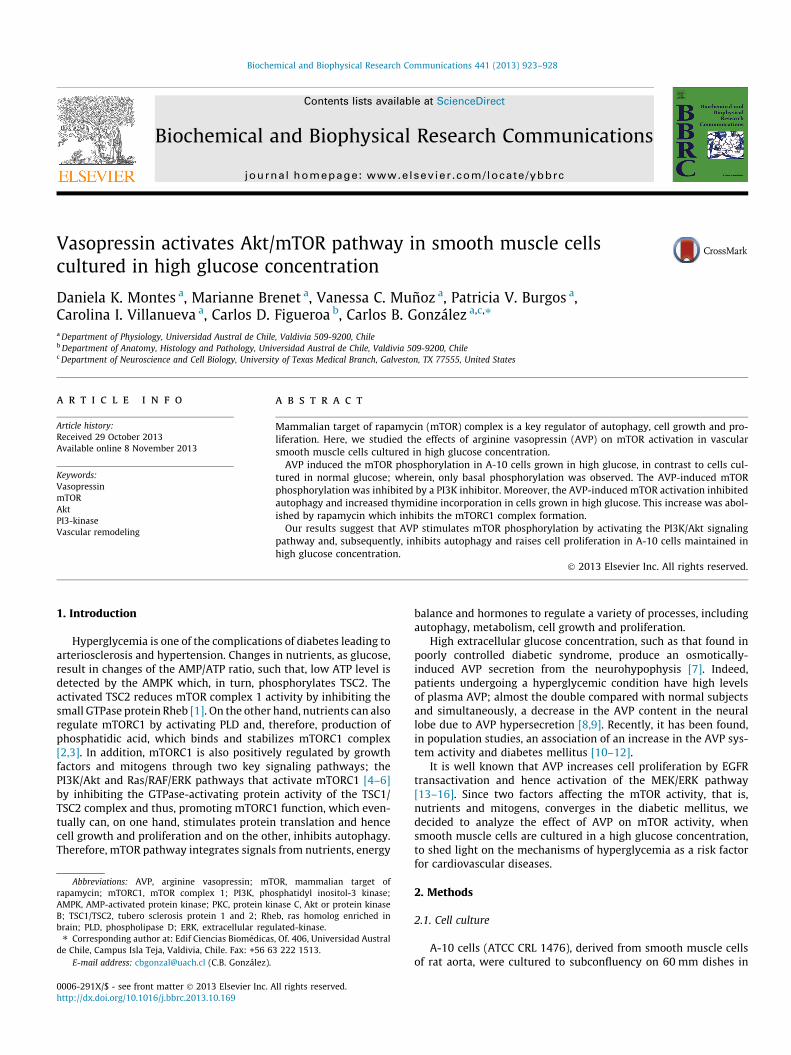
extracellular glucose concentration (Figs. 1S A and B). Thestimulation of cells, maintained in normal extracellular glucoseconcentration (5.5 mM), with 50 nM AVP showed no significant in-crease in the phosphorylation of mTOR up to 180 min after stimu-lation (Figs. 1A and C). In contrast, cells, which were maintained inhigh extracellular glucose concentration (25 mM) for 10 days andthen stimulated with 50 nM AVP for the same time, displayed astatistically significant increase in the phosphorylation of mTORbetween 90 to 180 min (Figs. 1B and C). Similarly, there was an in-crease in Ser 473 phosphorylation of Akt, which is a serine/threo-nine kinase upstream regulator of mTOR, in cells maintained inhigh extracellular glucose concentration and stimulated with AVP(Figs. 1D and E) as compared to that cultured in normal glucoseconcentration (not shown).
3.2. The AVP-induced mTOR phosphorylation is mediated by theactivation of the PI3K/Akt pathway
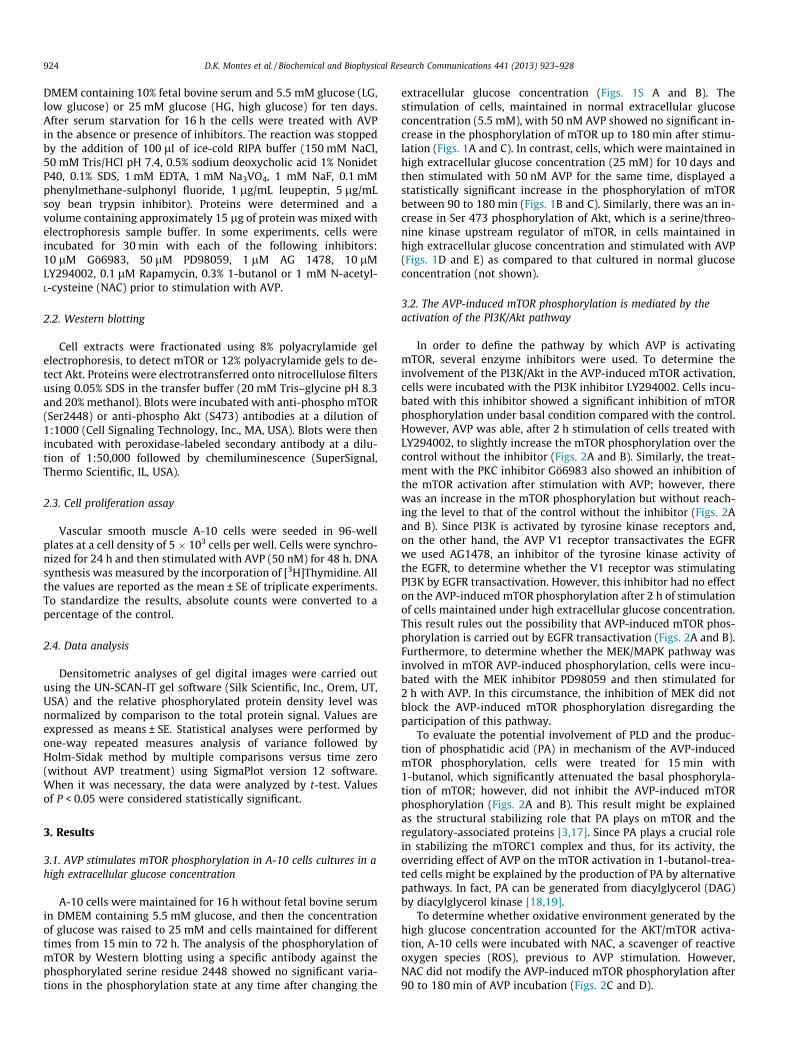
In order to define the pathway by which AVP is activatingmTOR, several enzyme inhibitors were used. To determine theinvolvement of the PI3K/Akt in the AVP-induced mTOR activation,cells were incubated with the PI3K inhibitor LY294002. Cells incu-bated with this inhibitor showed a significant inhibition of mTORphosphorylation under basal condition compared with the control.However, AVP was able, after 2 h stimulation of cells treated withLY294002, to slightly increase the mTOR phosphorylation over thecontrol without the inhibitor (Figs. 2A and B). Similarly, the treat-ment with the PKC inhibitor Gö6983 also showed an inhibition ofthe mTOR activation after stimulation with AVP; however, therewas an increase in the mTOR phosphorylation but without reach-ing the level to that of the control without the inhibitor (Figs. 2Aand B). Since PI3K is activated by tyrosine kinase receptors and,on the other hand, the AVP V1 receptor transactivates the EGFRwe used AG1478, an inhibitor of the tyrosine kinase activity ofthe EGFR, to determine whether the V1 receptor was stimulatingPI3K by EGFR transactivation. However, this inhibitor had no effecton the AVP-induced mTOR phosphorylation after 2 h of stimulationof cells maintained under high extracellular glucose concentration.This result rules out the possibility that AVP-induced mTOR phos-phorylation is carried out by EGFR transactivation (Figs. 2A and B).Furthermore, to determine whether the MEK/MAPK pathway wasinvolved in mTOR AVP-induced phosphorylation, cells were incu-bated with the MEK inhibitor PD98059 and then stimulated for2 h with AVP. In this circumstance, the inhibition of MEK did notblock the AVP-induced mTOR phosphorylation disregarding theparticipation of this pathway.
To evaluate the potential involvement of PLD and the produc-tion of phosphatidic acid (PA) in mechanism of the AVP-inducedmTOR phosphorylation, cells were treated for 15 min with1-butanol, which significantly attenuated the basal phosphoryla-tion of mTOR; however, did not inhibit the AVP-induced mTORphosphorylation (Figs. 2A and B). This result might be explainedas the structural stabilizing role that PA plays on mTOR and theregulatory-associated proteins [3,17]. Since PA plays a crucial rolein stabilizing the mTORC1 complex and thus, for its activity, theoverriding effect of AVP on the mTOR activation in 1-butanol-trea-ted cells might be explained by the production of PA by alternativepathways. In fact, PA can be generated from diacylglycerol (DAG)by diacylglycerol kinase [18,19].
To determine whether oxidative environment generated by thehigh glucose concentration accounted for the AKT/mTOR activa-tion, A-10 cells were incubated with NAC, a scavenger of reactiveoxygen species (ROS), previous to AVP stimulation. However,NAC did not modify the AVP-induced mTOR phosphorylation after90 to 180 min of AVP incubation (Figs. 2C and D).
Fig. 1. Vasopressin induces phosphorylation of mTOR and Akt in A-10 cells cultured in high glucose medium. A-10 cells were cultured in DMEM containing 5.5 mM (LG) (A)or 25 mM (HG) (B) glucose followed by stimulation with AVP for different time periods. Cell extracts were subjected to Western blotting and the degree of mTORphosphorylation was determined using a phospho-site (Ser 2448) antibody. Immunoblots were quantified using UN-SCAN-IT densitometry software. Values were normalizedto that in the absence of AVP (basal) and expressed as the ratio phospho-mTOR/total mTOR (C). The statistical significance of the data was determined by one-way repeatedmeasures analysis of variance (ANOVA) followed by Holm-Sidak method by multiple comparisons versus time zero (without AVP treatment). Anova showed that thedifferences in the mean values among the AVP-treated HG group (gray column) are statistically significant; whereas, those of the AVP-treated LG group (black column) arenot. Values are mean ± SE of 4 independent experiments. ⁄ indicates p < 0.05 and ⁄⁄p < 0.01. The degree of Akt phosphorylation was evaluated using an anti phospho Akt (Ser473) antibody and detected using peroxidase-labeled secondary antibody at a dilution of 1:50,000 followed by chemiluminescence (D). Ratios of P-Akt and Akt signal weremeasured by quantitative densitometry (E). Data represent the mean ± SE of three experiments.
Fig. 2. PI3K is involved in the AVP-induced mTOR phosphorylation. A-10 cells cultured in DMEM containing 25 mM glucose treated without or with 50 nM AVP for 120 min(control, C). Prior to AVP stimulation cells were treated for 30 min with the PKC inhibitor Gö6983 (10 lM), the PI3K inhibitor LY294002 (10 lM), the PLD inhibitor 1-butanol(0.3%), the EGFR kinase inhibitor AG1478 (1 lM), the MEK inhibitor PD98059 (50 lM). The degree of mTOR phosphorylation was evaluated using an anti phospho mTOR (Ser2428) antibody and detected using peroxidase-labeled secondary antibody at a dilution of 1:50,000 followed by chemiluminescence (A). P-mTOR and mTOR signals weremeasured by densitometry and expressed as a P-mTOR/mTOR ratio (B). Cells were treated with 1 mM N-acetyl-L-cysteine prior to the AVP stimulation for the indicated time(C) and P-mTOR and mTOR signals were determined by densitometry and expressed as a P-mTOR/mTOR ratio (D). Data represent the mean ± SE of three experiments.
D.K. Montes et al. / Biochemical and Biophysical Research Communications 441 (2013) 923–928 925
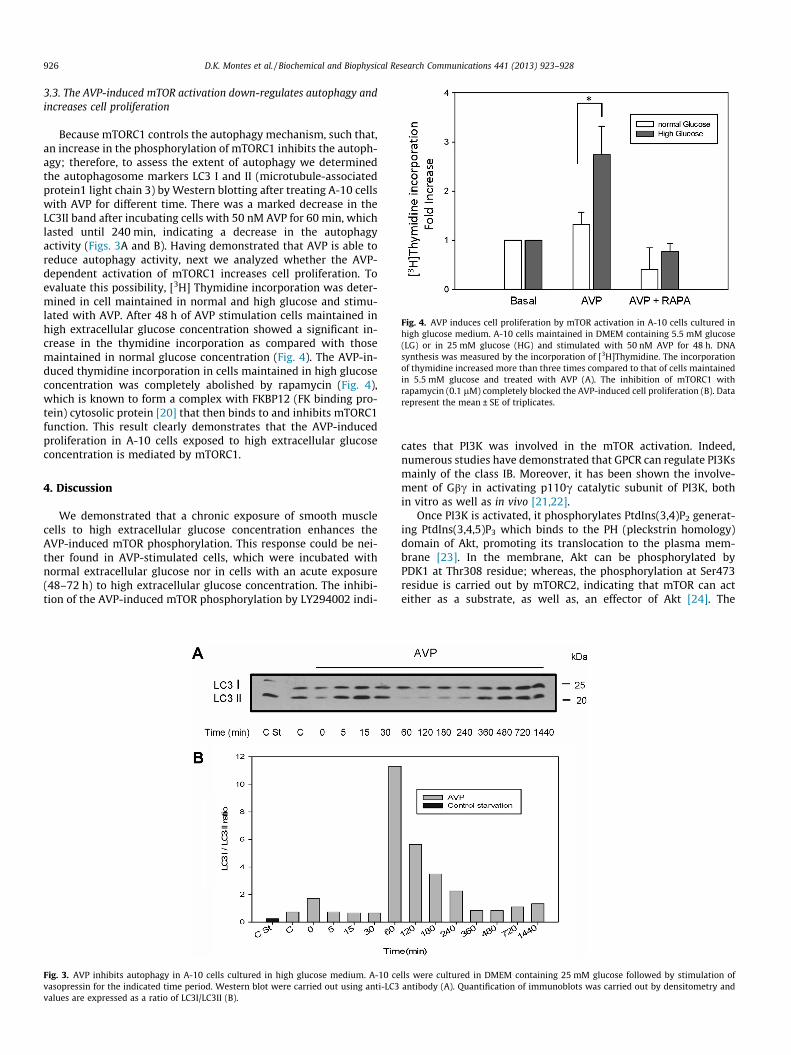
Fig. 4. AVP induces cell proliferation by mTOR activation in A-10 cells cultured inhigh glucose medium. A-10 cells maintained in DMEM containing 5.5 mM glucose(LG) or in 25 mM glucose (HG) and stimulated with 50 nM AVP for 48 h. DNAsynthesis was measured by the incorporation of [3H]Thymidine. The incorporationof thymidine increased more than three times compared to that of cells maintainedin 5.5 mM glucose and treated with AVP (A). The inhibition of mTORC1 withrapamycin (0.1 lM) completely blocked the AVP-induced cell proliferation (B). Datarepresent the mean ± SE of triplicates.
926 D.K. Montes et al. / Biochemical and Biophysical Research Communications 441 (2013) 923–928
3.3. The AVP-induced mTOR activation down-regulates autophagy andincreases cell proliferation
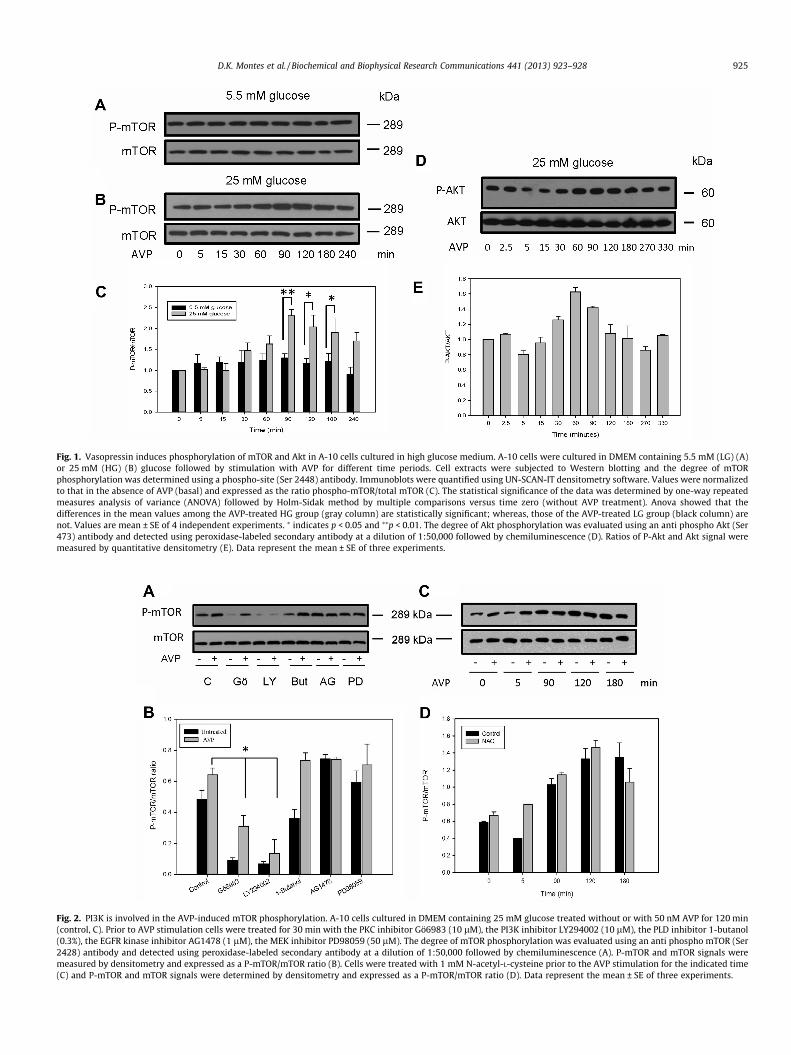
Because mTORC1 controls the autophagy mechanism, such that,an increase in the phosphorylation of mTORC1 inhibits the autoph-agy; therefore, to assess the extent of autophagy we determinedthe autophagosome markers LC3 I and II (microtubule-associatedprotein1 light chain 3) by Western blotting after treating A-10 cellswith AVP for different time. There was a marked decrease in theLC3II band after incubating cells with 50 nM AVP for 60 min, whichlasted until 240 min, indicating a decrease in the autophagyactivity (Figs. 3A and B). Having demonstrated that AVP is able toreduce autophagy activity, next we analyzed whether the AVP-dependent activation of mTORC1 increases cell proliferation. Toevaluate this possibility, [3H] Thymidine incorporation was deter-mined in cell maintained in normal and high glucose and stimu-lated with AVP. After 48 h of AVP stimulation cells maintained inhigh extracellular glucose concentration showed a significant in-crease in the thymidine incorporation as compared with thosemaintained in normal glucose concentration (Fig. 4). The AVP-in-duced thymidine incorporation in cells maintained in high glucoseconcentration was completely abolished by rapamycin (Fig. 4),which is known to form a complex with FKBP12 (FK binding pro-tein) cytosolic protein [20] that then binds to and inhibits mTORC1function. This result clearly demonstrates that the AVP-inducedproliferation in A-10 cells exposed to high extracellular glucoseconcentration is mediated by mTORC1.
4. Discussion
We demonstrated that a chronic exposure of smooth musclecells to high extracellular glucose concentration enhances theAVP-induced mTOR phosphorylation. This response could be nei-ther found in AVP-stimulated cells, which were incubated withnormal extracellular glucose nor in cells with an acute exposure(48–72 h) to high extracellular glucose concentration. The inhibi-tion of the AVP-induced mTOR phosphorylation by LY294002 indi-
Fig. 3. AVP inhibits autophagy in A-10 cells cultured in high glucose medium. A-10 cevasopressin for the indicated time period. Western blot were carried out using anti-LC3values are expressed as a ratio of LC3I/LC3II (B).
cates that PI3K was involved in the mTOR activation. Indeed,numerous studies have demonstrated that GPCR can regulate PI3Ksmainly of the class IB. Moreover, it has been shown the involve-ment of Gbc in activating p110c catalytic subunit of PI3K, bothin vitro as well as in vivo [21,22].
Once PI3K is activated, it phosphorylates PtdIns(3,4)P2 generat-ing PtdIns(3,4,5)P3 which binds to the PH (pleckstrin homology)domain of Akt, promoting its translocation to the plasma mem-brane [23]. In the membrane, Akt can be phosphorylated byPDK1 at Thr308 residue; whereas, the phosphorylation at Ser473residue is carried out by mTORC2, indicating that mTOR can acteither as a substrate, as well as, an effector of Akt [24]. The
lls were cultured in DMEM containing 25 mM glucose followed by stimulation ofantibody (A). Quantification of immunoblots was carried out by densitometry and
D.K. Montes et al. / Biochemical and Biophysical Research Communications 441 (2013) 923–928 927
phosphorylation of both residues is required for full activation ofAkt [25], which, in turn, phosphorylates to mTOR in two adjacentsites, that is, Thr2446 and Ser2448 [26]. Moreover, the phosphory-lation of mTOR at residue S2448 by Akt is correlated with the acti-vation of mTORC1 [27]. Furthermore, Akt is also able to directlyphosphorylate TSC2, which as a heterodimer with TSC1 is a nega-tive regulator of mTORC1 [25]. Accordingly, PI3K plays a vital rolein controlling mTORC1 activity by regulating of Akt phosphoryla-tion, on one hand, by directly phosphorylating mTOR, and, on theother, by inhibiting TSC1/2 activity and hence stimulating mTORphosphorylation.
An intriguing question is why mTORC1 is solely activated by AVPwhen cells are maintained in high extracellular glucose concentra-tion. One possible explanation would be that the high concentrationof extracellular glucose leads to alterations of the mechanisms reg-ulating the signaling pathways involved in the regulation of vascu-lar tone, and in cell proliferation. In this context, it has been reportedthat both endothelial and smooth muscle cells maintained in highglucose concentrations have an augmented DAG concentration,which translates into an increase in PKC activity [28,29]. Alterna-tively, the high glucose concentration produces ROS (ReactiveOxygen Species), which could also alter signaling pathways. Indeed,Swiss 3T3 fibroblasts or HEK 293 cells subjected to oxidative stressshowed PI3K-dependent activation of Akt/PKB, which is an up-stream of mTOR cascade [30]. Likewise, ROS play an essential rolein the Interleukin 7-mediated viability and proliferation by activa-tion of PI3K/Akt/mTOR pathway in T-cell lymphoblastic leukemiacells [31]. However, in our cell model we did not find changes inAkt nor mTOR phosphorylation when cells are exposed to highextracellular glucose concentration. Moreover, the incubation ofcells with NAC, a scavenger of ROS, did not modify the AVP-inducedmTOR phosphorylation. These data ruled out the possible participa-tion of ROS on the AVP-stimulated mTOR activation.
It is well known that mTOR activation induces cell proliferationby up-regulating cell cycle-related genes and that its inhibition byrapamycin results in cell cycle arrest [25,32,33]. Growth factors areable to induce cell proliferation and, on the other hand, AVP is ableto transactivate the EGFR [16,34]. However, AG1478, an EGFR ki-nase inhibitor, did not alter the AVP-induced mTOR activation sug-gesting that the AVP-induced mTOR activation is carried out by anEGFR-independent transactivation mechanism. Most importantly,the inhibition of AVP-induced thymidine incorporation by rapamy-cin demonstrates that this proliferative effect of AVP is mediatedby mTORC1 activation. Taken these results together clearly showthat AVP is capable of reducing autophagy activity and concomi-tantly increasing cell proliferation via mTOR pathway activation.
Therefore, high extracellular glucose concentration itself or bythe generation of ROS might lead to alterations of the mechanismsregulating the signaling pathways involved in the regulation ofvascular tone, and in cell proliferation. Here, we showed thatAVP, which is secreted due to the hyperglycemia-induced osmolal-ity increase, might also be contributing to vascular complicationsassociated with diabetes mellitus.
Acknowledgments
This work was supported by Fondo Nacional de DesarrolloCientífico y Tecnológico (FONDECYT) Grant numbers 1100871(CBG) and 1130929 (PVB) and Dirección de Investigación y Desarr-ollo, Universidad Austral de Chile.
Appendix A. Supplementary data
Supplementary data associated with this article can be found, inthe online version, at http://dx.doi.org/10.1016/j.bbrc.2013.10.169.
References
[1] X. Gao, Y. Zhang, P. Arrazola, O. Hino, T. Kobayashi, R.S. Yeung, B. Ru, D. Pan, Tsctumour suppressor proteins antagonize amino-acid-TOR signalling, Nat. Cell.Biol. 4 (2002) 699–704.
[2] L. Xu, D. Salloum, P.S. Medlin, M. Saqcena, P. Yellen, B. Perrella, D.A. Foster,Phospholipase D mediates nutrient input to mammalian target of rapamycincomplex 1(mTORC1), J. Biol. Chem. 286 (2011) 25477–25486.
[3] A. Toschi, E. Lee, L. Xu, A. Garcia, N. Gadir, D.A. Foster, Regulation of mTORC1and mTORC2 complex assembly by phosphatidic acid: competition withrapamycin, Mol. Cell. Biol. 29 (2009) 1411–1420.
[4] K. Inoki, Y. Li, T. Zhu, J. Wu, K.L. Guan, TSC2 is phosphorylated and inhibited byAkt and suppresses mTOR signalling, Nat. Cell. Biol. 4 (2002) 648–657.
[5] E. Penuel, G.S. Martin, Transformation by v-Src: Ras-MAPK and PI3K-mTORmediate parallel pathways, Mol. Biol. Cell. 10 (1999) 1693–1703.
[6] A. Coutant, C. Rescan, D. Gilot, P. Loyer, C. Guguen-Guillouzo, G. Baffet, PI3K-FRAP/mTOR pathway is critical for hepatocyte proliferation whereas MEK/ERKsupports both proliferation and survival, Hepatology 36 (2002) 1079–1088.
[7] Y. Iwasaki, K. Kondo, T. Murase, H. Hasegawa, Y. Oiso, Osmoregulation ofplasma vasopressin in diabetes mellitus with sustained hyperglycemia, J.Neuroendocrinol. 8 (1996) 755–760.
[8] I. Fujisawa, N. Murakami, S. Furuto-Kato, N. Araki, J. Konishi, Plasma andneurohypophyseal content of vasopressin in diabetes mellitus, J. Clin.Endocrinol. Metab. 81 (1996) 2805–2809.
[9] R.L. Zerbe, F. Vinicor, G.L. Robertson, Plasma vasopressin in uncontrolleddiabetes mellitus, Diabetes 28 (1979) 503–508.
[10] U. Saleem, M. Khaleghi, N.G. Morgenthaler, A. Bergmann, J. Struck, T.H. MosleyJr., I.J. Kullo, Plasma carboxy-terminal provasopressin (copeptin): a novelmarker of insulin resistance and metabolic syndrome, J. Clin. Endocrinol.Metab. 94 (2009) 2558–2564.
[11] S. Enhorning, J. Struck, E. Wirfalt, B. Hedblad, N.G. Morgenthaler, O. Melander,Plasma copeptin, a unifying factor behind the metabolic syndrome, J. Clin.Endocrinol. Metab. 96 (2011) E1065–1072.
[12] W. Fenske, C. Wanner, B. Allolio, C. Drechsler, K. Blouin, J. Lilienthal, V. Krane,D.S.I. German, Diabetes, copeptin levels associate with cardiovascular eventsin patients with ESRD and type 2 diabetes mellitus, J. Am. Soc. Nephrol. 22(2011) 782–790.
[13] O. Melien, G.H. Thoresen, D. Sandnes, E. Ostby, T. Christoffersen, Activation ofp42/p44 mitogen-activated protein kinase by angiotensin II, vasopressin,norepinephrine, and prostaglandin F2alpha in hepatocytes is sustained, andlike the effect of epidermal growth factor, mediated through pertussis toxin-sensitive mechanisms, J. Cell. Physiol. 175 (1998) 348–358.
[14] P.M. Ghosh, M. Mikhailova, R. Bedolla, J.I. Kreisberg, Arginine vasopressinstimulates mesangial cell proliferation by activating the epidermal growthfactor receptor, Am. J. Physiol. Renal Physiol. 280 (2001) F972–979.
[15] T. Chiu, S.S. Wu, C. Santiskulvong, P. Tangkijvanich, H.F. Yee Jr., E. Rozengurt,Vasopressin-mediated mitogenic signaling in intestinal epithelial cells, Am. J.Physiol. Cell. Physiol. 282 (2002) C434–450.
[16] L.Q. Fuentes, C.E. Reyes, J.M. Sarmiento, C.I. Villanueva, C.D. Figueroa, J.Navarro, C.B. Gonzalez, Vasopressin up-regulates the expression of growth-related immediate-early genes via two distinct EGF receptor transactivationpathways, Cell. Signal. 20 (2008) 1642–1650.
[17] Y. Sun, J. Chen, mTOR signaling: PLD takes center stage, Cell Cycle 7 (2008)3118–3123.
[18] I. Merida, A. Avila-Flores, E. Merino, Diacylglycerol kinases: at the hub of cellsignalling, Biochem. J. 409 (2008) 1–18.
[19] B. Luo, S.M. Prescott, M.K. Topham, Diacylglycerol kinase zeta regulatesphosphatidylinositol 4-phosphate 5-kinase Ialpha by a novel mechanism, CellSignal. 16 (2004) 891–897.
[20] C.K. Yip, K. Murata, T. Walz, D.M. Sabatini, S.A. Kang, Structure of the humanmTOR complex I and its implications for rapamycin inhibition, Mol. Cell 38(2010) 768–774.
[21] D. Leopoldt, T. Hanck, T. Exner, U. Maier, R. Wetzker, B. Nurnberg,Gbetagamma stimulates phosphoinositide 3-kinase-gamma by directinteraction with two domains of the catalytic p110 subunit, J. Biol. Chem.273 (1998) 7024–7029.
[22] B. Stoyanov, S. Volinia, T. Hanck, I. Rubio, M. Loubtchenkov, D. Malek, S.Stoyanova, B. Vanhaesebroeck, R. Dhand, B. Nurnberg, et al., Cloning andcharacterization of a G protein-activated human phosphoinositide-3 kinase,Science 269 (1995) 690–693.
[23] K. Ma, S.M. Cheung, A.J. Marshall, V. Duronio, PI(3,4,5)P3 and PI(3,4)P2 levelscorrelate with PKB/akt phosphorylation at Thr308 and Ser473, respectively;PI(3,4)P2 levels determine PKB activity, Cell Signal. 20 (2008) 684–694.
[24] R.M. Memmott, P.A. Dennis, Akt-dependent and -independent mechanisms ofmTOR regulation in cancer, Cell Signal. 21 (2009) 656–664.
[25] N. Hay, N. Sonenberg, Upstream and downstream of mTOR, Genes Dev. 18(2004) 1926–1945.
[26] A. Sekulic, C.C. Hudson, J.L. Homme, P. Yin, D.M. Otterness, L.M. Karnitz, R.T.Abraham, A direct linkage between the phosphoinositide 3-kinase-AKTsignaling pathway and the mammalian target of rapamycin in mitogen-stimulated and transformed cells, Cancer Res. 60 (2000) 3504–3513.
[28] T. Inoguchi, R. Battan, E. Handler, J.R. Sportsman, W. Heath, G.L. King,Preferential elevation of protein kinase C isoform beta II and diacylglycerol
928 D.K. Montes et al. / Biochemical and Biophysical Research Communications 441 (2013) 923–928
levels in the aorta and heart of diabetic rats: differential reversibility toglycemic control by islet cell transplantation, Proc. Natl. Acad. Sci. USA 89(1992) 11059–11063.
[29] B. Williams, B. Gallacher, H. Patel, C. Orme, Glucose-induced protein kinase Cactivation regulates vascular permeability factor mRNA expression andpeptide production by human vascular smooth muscle cells in vitro,Diabetes 46 (1997) 1497–1503.
[30] M. Shaw, P. Cohen, D.R. Alessi, The activation of protein kinase B by H2O2 orheat shock is mediated by phosphoinositide 3-kinase and not by mitogen-activated protein kinase-activated protein kinase-2, Biochem. J. 336 (Pt. 1)(1998) 241–246.
[31] A. Silva, A. Girio, I. Cebola, C.I. Santos, F. Antunes, J.T. Barata, Intracellularreactive oxygen species are essential for PI3K/Akt/mTOR-dependent IL-7-
[32] N. Balcazar, A. Sathyamurthy, L. Elghazi, A. Gould, A. Weiss, I. Shiojima, K.Walsh, E. Bernal-Mizrachi, mTORC1 activation regulates beta-cell mass andproliferation by modulation of cyclin D2 synthesis and stability, J. Biol. Chem.284 (2009) 7832–7842.
[33] L.M. Ballou, R.Z. Lin, Rapamycin and mTOR kinase inhibitors, J. Chem. Biol. 1(2008) 27–36.
[34] E.P. Salazar, I. Hunger-Glaser, E. Rozengurt, Dissociation of focal adhesionkinase and paxillin tyrosine phosphorylation induced by bombesin andlysophosphatidic acid from epidermal growth factor receptor transactivationin Swiss 3T3 cells, J. Cell. Physiol. 194 (2003) 314–324.