70
September 2017 3
| Date post: | 09-Mar-2018 |
| Category: |
Documents |
| Upload: | nguyenduong |
| View: | 216 times |
| Download: | 3 times |

September
2017
3

Fibres and Textiles Vlákna a textil
Published by Vydáva
Slovak University of Technology in Bratislava, Faculty of Chemical and Food Technology
Slovenská technická univerzita v Bratislave, Fakulta chemickej a potravinárskej technológie
Technical University of Liberec, Faculty of Textile Engineering
Technická univerzita v Liberci, Fakulta textilní
Alexander Dubček University of Trenčín, Faculty of Industrial Technologies
Trenčianska univerzita Alexandra Dubčeka v Trenčíne, Fakulta priemyselných technológií
Slovak Society of Industrial Chemistry, Bratislava Slovenská spoločnosť priemyselnej chémie, Bratislava
Research Institute of Man-Made Fibres, JSC, Svit Výskumný ústav chemických vlákien, a.s. Svit
VÚTCH – CHEMITEX, Ltd., Žilina VÚTCH – CHEMITEX, spol. s r.o., Žilina
Chemosvit Fibrochem, JSC, Svit Chemosvit Fibrochem, a.s., Svit
Editor in Chief (Šéfredaktor): Anna Ujhelyiová
Executive Editor (Výkonný redaktor): Marcela Hricová
http://www.vat.ft.tul.cz
Editorial Board Redakčná rada
Ľ. Balogová, M. Hricová, P. Lizák, J. Králiková, P. Michlík, M. Pajtášová, M. Tunák, V. Tunáková, V. Váry
Honourable Editorial Board Čestní členovia redakčnej rady
R.U. Bauer (DE), M. Budzák (SK), D. Ciechanska (PL), T. Czigani (HU), J. Drašarová (CZ), A.M. Grancarić (HR), M. Jambrich (SK), M. Krištofič (SK), I. Krucinska (PL), A. Marcinčin (SK), A.M. Marechal (SL), J. Militký (CZ),
R. Redhammer (SK), M. Révus (SK), I. Sroková (SK), J. Šajbidor (SK), J. Šesták (SK), J. Vavro (SK), V. Vlasenko (UA)
Editorial Office and distribution of the journal
(Redakcia a distribúcia časopisu)
Ústav prírodných a syntetických polymérov Fakulta chemickej a potravinárskej technológie Slovenská technická univerzita v Bratislave Radlinského 9, 812 37 Bratislava, SK Tel: 00 421 2 59 325 575 e-mail: [email protected]
Order and advertisement of the journal
(Objednávka a inzercia časopisu)
Slovenská spoločnosť priemyselnej chémie, člen Zväzu vedecko-technických spoločností Radlinského 9, 812 37 Bratislava, SK Tel: 00 421 2 59 325 575 e-mail: [email protected]
Order of the journal from abroad – excepting Czech Republic
Objednávka časopisu zo zahraničia – okrem Českej Republiky SLOVART G.T.G, s.r.o. EXPORT-IMPORT
Krupinská 4, P.O.Box 152, 852 99 Bratislava, SK Tel: 00421 2 839 471-3, Fax: 00421 2 839 485
e-mail: [email protected]
Typeset and printing at Sadzba a tlač
FOART, s.r.o., Bratislava
Journal is published 4x per year Časopis vychádza 4x ročne Subscription 60 EUR Ročné predplatné 60 EUR
ISSN 1335-0617
Evidenčné číslo MKCR SR Bratislava EV 4006/10
Fibres and Textiles (3) 2017 1
Fibres and Textiles (3) 2017 Vlákna a textil (3) 2017
September 2017
Content
TEXTILE TECHNOLOGIES
3 M. Kašparová and J. Wiener
Connection of Indigo Ring Dyeing of Cotton Yarns With Decolorization by CO2 Laser
10 O.V. Kolosnichenko, A.I. Baranova and I.O. Prykhodko-Kononenko
Design of Concordant Forms of Modern Clothes on the Basis of Proportional Correlations of Sacred Geometry
15 M. Černý, I. Vojtová, P. Bayerová, L. Burgert and A. Vojtovič
Optimization of Millinery Ribbon Dyeing Conditions
24 M. Filipi and M. Milichovský
Separation of Cd2+
from Water by Use of Oxycelluloses and Active Pulp
30 S. Kuleshova, O. Zakharkevich, J. Koshevko and O. Ditkovska
Development of Expert System Based on Kansei Engineering to Support Clothing Design Process
*21st
International Conference STRUTEX 2016
42 E. Stránská and D. Neděla
Use of Reinforcing Fabric for Preparation of More Resistance Ion Exchange Membrane
48 U.H. Erdogan, F. Selli and H. Duran
Banana Plant Waste as Raw Material for Cellulose Extraction
53 P. Ursíny and E. Moučková
Theory of Mass Irregularity Changes in the OE-Rotor Spinning System
58 A. Jabbar and J. Militký
Investigation of the Creep and Dynamic Mechanical Properties of Jute/Green Epoxy Composites Incorporated with Chemically Treated Pulverized Nano/Micro Jute Fibers
64 T. Heinisch, P. Těšinová and L. Pološčuková
Moisture Management for Different Air Conditions
*Special part venue the 21
st International Conference STRUTEX 2016 “Structure and Structural Mechanics of Textiles”
held on December 1.- 2. 2016 in Liberec, Czech Republic.
SCIENTIFIC COMITEE prof. S. M. ISHTIAQUE, Indian Institute of Technology Delhi, India prof. Yordan KYOSEV, Hochschule Niederrhein, Germany prof. Bohuslav NECKÁŘ, Technical University of Liberec, Czech Republic prof. Jakub WIENER, Technical University of Liberec, Czech Republic prof. Luboš HES, Technical University of Liberec, Czech Republic prof. Oldřich JIRSÁK, Technical University of Liberec, Czech Republic
*Contributions were received without review process. The authors are responsible for professional and language level of contributions.

Fibres and Textiles (3) 2017 2

Textile Technologies Textilné technológie
Fibres and Textiles (3) 2017 3
CONNECTION OF INDIGO RING DYEING OF COTTON YARNS WITH DECOLORIZATION BY CO2 LASER
Marie Kašparová and Jakub Wiener
Department of Textile Chemistry, Faculty of Textile, Technical University of Liberec, Liberec, Czech Republic [email protected]
Abstract: Investigation the influence of indigo dye penetration depth into cotton fabric on decolorization of samples using CO2 laser treatment is the main goal of this research.
Due to various setting of pH values, it is possible to obtain uniform distribution of indigo in cotton fibers or ring dyeing in yarns (surface dyeing). It has been concluded that indigo can be deposited in various penetration depths of yarns. In this study pH values were set up to 8, 9, 10 and 11.8. Penetration depth of indigo into cotton yarn was analyzed by microscopic method in both cross sections of yarns in warp and weft directions. Pulsed CO2 laser was used for decolorization of indigo dyed cotton fabric. Various values of marking speed were used to obtain different laser power densities. Marking speed was set up in range of 50 - 400 bits.ms
-1. Morphological changes of irradiated indigo dyed cotton fabric were observed by SEM
(scanning electron microscopy) analysis. Color shade changes of indigo dyed cotton fabrics after laser treatment were objectively measured by UV-VIS Reflective Spectrophotometer. The results showed that, changing the pH values from 10 up to 11.8 was very effective for indigo dye uptake by cotton fabric. Light color shades of indigo dyed cotton fabric were obtained with lower pH values (pH 8 and 9) during dyeing. It is cause of lower solubility of indigo in water at neutral medium.
The penetration depth of indigo dye was 35 μm into cotton fabric at pH value of 8. The depth of indigo penetration into cotton fabric was 60 μm at pH value of 11.8. The decolorization of indigo dyed cotton fabric is very effective by infrared laser beam. The results show that, penetration depth of indigo into cotton yarn does not play any role on decolonization of cotton using laser. For decolorization of indigo dyed cotton fabric, the saturation of coloration has higher influence than penetration depth of indigo into the yarn. Also the yellowing index of fabrics after laser treatment can be attributed to their initial color shade.
Partly decolorization of indigo from dyed cotton samples is caused by high value of marking speed (400 bits.ms
-1) during laser treatment. Total decolorization of indigo from dyed cotton samples was
obtained by low value of marking speed (50 bits.ms-1
). Untreated cotton fibre is smooth. From SEM analysis, there are no pores. But with the increasing laser intensity (decreasing marking speed) there are cracks and pores on the surface of the fabric.
Infrared laser beam is effectively absorbed by fiber system. The depth of penetration of infrared laser beam is much lower into the fiber system, at the most two layers of fibers. It is also lower than penetration depth of indigo. And that is why penetration depth of indigo into the yarn has small effect on the efficiency for decolorization of cotton textile by infrared laser beam.
Keywords: indigo, cotton, infrared laser treatment.
1 INTRODUCTION
Cotton fabric is possible to dye by indigo only in alkaline medium. In general, it is valid that solubility of indigo dye increases with the increasing of pH value of dyeing bath. Indigo is partially soluble at pH=11 of dyeing bath. It has higher affinity for cotton, which is supported by fast uptake of indigo to the fiber. This leads to accumulation of dye only in surface layers (surface dyeing) because of quick uptake of indigo. Thus it is possible to obtain deeper color shade of dyeing. Leuco-form of indigo is much more soluble with the increasing of pH value of dyeing bath and there are more ionized molecules at pH=13, however indigo has lower affinity for cotton fibre at this pH. Dye penetration into cellulosic fibres is much slower, however indigo breaks into deeper depth of fibres. Lighter color shade of dyeing is obtained by this way, but the dyeing is more
uniform. The best results of indigo dyeing can be reached in the range of pH value from 9 to 11 [1].
CO2 laser treatment has been used in different areas of textile industry for several years because it allows short-time surface designing of patterns with good precision, desirable effect, various size and intensity without much damaging the bulk properties of the textile materials [1].
Laser light is suitable tool for removal of indigo from fabric surface to create the design on denim fabrics. This process is effective only on the surface of fabric. The interaction of infrared laser light with indigo dyed fabric is based on effects of thermal heating of fibers on the surface of fabric. It was found out that interaction between laser and indigo dyed cotton fabric is more effective at 10.6 µm wavelength of laser beam than at 1.064 µm. Due to the fact that the absorption coefficient of indigo solution

Textile Technologies Textilné technológie
Fibres and Textiles (3) 2017 4
is higher at 10.6 µm wavelength of laser beam. It was observed that the most important parameter for decolorization of indigo dyed samples is the laser wavelength and then the laser power density [2].
Another study was focused on changes of wear characteristics after laser treatment like as color fastness, strength resistance, tearing strength and dimensional changes. It was concluded that there is only small difference in color change after laser treatment and the material does not lost its qualities and in some cases (tear strength, shrinkage) laser treated material shows better properties. And only CO2 laser offered a good alternative to a conventional method for fading processes [3, 4]. The best results for decolorization of denim fabric were obtained with the length of pulse 100 - 150 µs [4].
Laser parameters i.e. resolution and pixel time has been examined in other study. The resolutions were set from 40 to 60 dpi. Pixel time was set from 100 to 120 µs. There are a lot of pores, cracks and fragments formed on fiber surface after laser treatment [5].
Dye-ability, rate of exhaustion and color fastness has been observed in other study after laser treatment by CO2 laser. From the reflectance curves it has been found that the amount of direct dye absorbed by the fabric is reduced after laser treatment. With the increasing resolution and pixel time, K/S values showed a decreasing level of color shade. In comparison with untreated sample, laser treated samples could cause the fading of color shade of cotton and slight increase in the time of half dyeing. Laser treated samples showed the same color stability to washing fastness such as the untreated samples. But laser treated samples have relatively poor crocking results than the untreated samples [6].
In previous research work, decolorization of vat dyed cotton fabric after exposure to CO2 laser was studied to determined changes in chemical composition and morphology of fiber surfaces. For evaluation of color changes, color shade of samples was measured by UV-VIS Reflective Spectrophotometer.
Surface morphology and chemical composition of samples were appointed by XPS and SEM analysis. Differential Scanning Calorimetry (DSC) was used to determined thermal stability of vat dyes and cotton fabric. The tensile strength of laser treated samples was measured in weft and warp direction. At lower and medium laser fluency, relative ratio of ketone groups is increased in case of laser treated sample in comparison with untreated sample due to oxidation of fiber surfaces with atmospheric oxygen. Carbonization of fiber surfaces was found at higher laser fluency due to the increasing of carbon bonds. The tensile strength of fabrics has been decreased in warp and weft direction for all color shades of vat dyes. Low level of damage
of fibres is caused by medium laser fluency of CO2 laser. According to DSC analysis, the most stable vat dye was C.I. Vat Yellow 2 and the lowest vat dye was C.I. Vat Green 1. It was confirmed by color intensity. It results that vat dyestuff protects dyed cotton yarns from infrared laser light. The decrease of tensile strength of tested dyed yarns was 15 and 45% at laser fluency 7.8 and 15.6 mJ.cm
-2 in weft
direction, respectively. Low laser fluency of 3.1 mJ.cm
-2 showed only small decrease of tensile
strength of original (non-dyed) cotton yarn in weft direction. The significant decrease of tensile strength was observed at original (non-dyed) irradiated yarn in comparison with dyed irradiated yarn in case of laser fluency 7.8 mJ.cm
-2 and higher [7].
In this research work, the influence of penetration depth of Indigo dye into cotton fabric on decolorization of samples using CO2 laser treatment is investigated.
2 EXPERIMENTAL
2.1 Materials and dyeing technique
100% twill-weave cotton fabric (240 g.m-2
), with the fabric density of 32 threads per 1 cm in warp direction and 16 threads per 1 cm in weft direction was used in this research work. For dyeing cotton fabrics C. I. Vat Blue 1 (Figure 1.) as a vat dye was used. Sodium hydroxide NaOH (38%) and sodium hydrosulphite were purchased from Merck.
Figure 1 The chemical structure of Indigo (C.I. Vat Blue 1)
2.2 Dyeing procedure
As it was mentioned, the C. I. Vat Blue 1 was used for dyeing the cotton fabrics. Dyeing temperature was in the range from 33 up to 45°C. The graph of dyeing is shown in Figure 2. The pH values of dyeing bath were set by using acetic acid CH3COOH 80%, sodium hydroxide 38% and sodium hydrosulphite in the range from 8 to 11.8. Dyeing time of each sample was 2 minutes. After dyeing, samples were rinsed in running water immediately after removal from the dyeing bath.
After treatment
A
A: NaOH B: Na2S2O4
C: CH3COOH
B
33 ºC
45 ºC
C
Figure 2 Dyeing scheme

Textile Technologies Textilné technológie
Fibres and Textiles (3) 2017 5
2.3 Laser treatment
Laser treatment of indigo dyed cotton fabrics was performed by using a pulsed infrared laser (Marcatex 150 Flexi, Spain). The wavelength of this pulsed laser is 10.6 µm. Parameters that determine marking power of laser are: marking speed [bits/ms], duty cycle [%] and frequency [kHz]. Lower value of marking speed presents longer marking time. During the process of laser treatment, the marking speed of laser beam was set in range of 50, 100, 200, 300 and 400 bits.ms
-1 (Table 1). In this study
the duty cycle (DC) was set at 50%. The used laser power was 100 W at 50% of DC and 5 kHz. Marked area of each sample was 7.5 × 2.3 cm
2.
Table 1 Setting of laser device for laser treatment of indigo dyed cotton samples
Marking speed [bits.ms-1] 400 300 200 100 50 Areal energy [Ws.cm-2] 2.9 3.8 5.7 11.1 21.9
2.4 Analysis of the penetration depth of indigo into cotton yarn
In this study, the penetration depth of indigo into yarns has been analyzed using image processing. For this purpose the cross section of indigo dyed yarns were prepared using a hand microtome (thickness 20 μm).
Cross sections of yarns in warp and weft direction for each pH value were investigated. Special software and digitizing device, Program NIS-Elements AR 2.30 (Laboratory Imaging Ltd.), was used for this analysis. The gravity center for each cross section of the yarn was found out. Necessary parameters were measured 16 times for each cross section of the yarn. 10
th of the best cross sections of the yarn
for each pH value were chosen for measurements (Figure 3).
Obtained parameter r and l enabled the estimation of penetration depth of indigo dye into yarns. The model used for the measuring of the depth of penetrated indigo dye into textile structure is based on two parameters, r and l (Figure 4). Where r presents yarn radius and l presents penetration depth of indigo into the yarn.
Figure 3 Plotting of cross section of warp
Figure 4 Model used for measuring of penetration depth of indigo into the yarn
2.5 Color measurement of indigo dyed cotton fabric
Before and after laser treatment, photographs of untreated and laser treated indigo dyed cotton fabric were taken with a camera (Canon PC 1023, Japan) and compared. Color intensities of the samples were measured by using a UV VIS-NIR Reflective Spectrophotometer (Datacolor SF600, Switzerland), over the range of 400-700 nm, and the reflection factor (R) was obtained. The relative color strength (K/S value) was then established according to the following Kubelka-Munk equation, where K and S stand for the absorption and scattering coefficient, respectively
R2
R1
S
K 2 (1)
3 RESULTS AND DISCUSSION
3.1 Influence of various pH values on penetration depth of indigo into cotton yarn
As it was mentioned earlier, in this research work, the cotton samples were dyed with indigo dye in different pH values and influence of pH values on penetration depth of indigo dye into cotton yarns was studied.
The results show that, dark color shade of dyeing is obtained by dyeing conditions at pH values of 10 and 11.8. These dyeing conditions provide very effective indigo dyeing. Lower pH values cause lower depth of color shades of indigo dyeing (Figure 5).
pH 8 pH 9 pH 10 pH 11.8
Figure 5 Photos of Indigo dyed cotton samples at various pH values of dyeing bath (8, 9, 10 and 11.8)

Textile Technologies Textilné technológie
Fibres and Textiles (3) 2017 6
These differences can be explained by lower solubility of indigo in water at neutral medium.
The yarn radius of cotton in warp and weft direction was calculated from analysis of yarn cross section. The results are shown in Table 2. As it was expected, cotton yarn radius is fluctuating. It is cause of unevenness and nature of cotton yarn. The method used in this work was also very sensitive to yarn deformation. The yarn radius of cotton was measured in 16 directions for each cross-section of yarn. The average values of yarn radius are 158 µm in warp direction and 142 µm in weft direction.
Table 2 Estimated radius of untreated cotton yarns in warp and weft direction
Estimated radius of cotton yarns [µm]
Warp Weft 158 142
The above-mentioned method was used to analyze radial distribution of indigo dye in yarn cross-section in weft and warp direction (Table 3). Penetration depth of indigo into cotton yarn is 35 µm and 40 µm at pH 8 and pH 9, respectively. By increasing pH value, the penetration depth is increased.
At strong alkaline pH value, indigo penetrates deeper into cotton yarn. The average value of penetration depth of indigo into the yarn in warp and weft direction is 60 µm. Uniform dyeing of yarns was not obtained by this dyeing method.
Table 3 Penetration depth [µm] of indigo into cotton yarn for warp and weft direction at various pH values of dyeing bath
pH value of dyeing bath Warp [µm]
Weft [µm]
8 35 35 9 40 40
10 60 60 11.8 55 65
3.2 Influence of various pH values on decolorization of indigo dyed cotton fabric after laser treatment
Samples of cotton fabric dyed with indigo were exposed to various values of marking speed of laser beam (400, 300, 200, 100, 50 bits.ms
-1). The change
of color shade of all indigo dyed cotton samples was observed (Figure 6). Slightly deeper color shade is observed at darker color shade of indigo dyed cotton samples after laser treatment. The decolorization of indigo dyed cotton fabric is very effective by CO2 laser beam. But the penetration depth of Indigo into cotton yarns does not play any important role on decolorization of samples using CO2 laser.
Results of change of color shade before and after laser treatment were objectively measured by UV-
VIS reflective spectrophotometer. The results related to relative color strength (K/S values) of dyed samples with different pH values of dyeing are displayed in Figure 7. More alkaline dyeing bath causes higher depth of shade and it is causes increase of K/S values.
Indigo dyed cotton fabric after laser treatment
Marking speed [bits.ms-1]
0 400 300 200 100 50
pH 8
pH 9
pH 10
pH 11.8
Figure 6 The photos of Indigo dyed cotton samples after laser treatment at various values of marking speed of laser beam
Figure 8 shows K/S values of dyed samples in various pH after laser treatment. The highest decrease of K/S values is about 1.4 for 400 and
Textile Technologies Textilné technológie
Fibres and Textiles (3) 2017 7
300 bits.ms-1
. The decrease of K/S values is about 1 for 200 bits.ms
-1. The lowest decrease of K/S values
is about 0.4 and 0.1 at 100 and 50 bits.ms-1
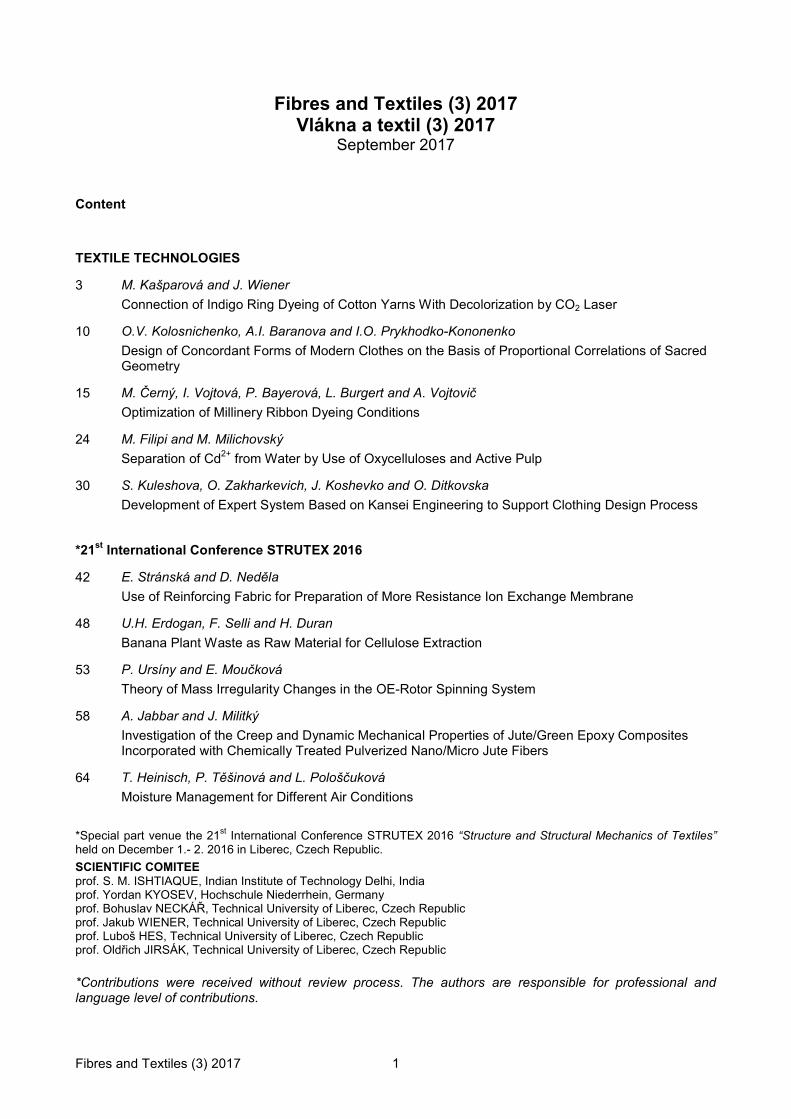
, respectively. The influence of the yellowing of irradiated samples and background of samples was eliminated for calculation relative values in percentage.
Figure 7 Influence of pH value of dyeing bath on the depth of color shade of indigo dyed samples (K/S values at 610 nm)
0
0,5
1
1,5
2
2,5
7 8 9 10 11 12
pH
K/S
400 bits/ms 300 bits/ms
200 bits/ms 100 bits/ms
50 bits/ms
Figure 8 K/S values of indigo dyed cotton samples as a function of pH values in dyeing bath after laser irradiation
The relative values in relation to initial color shade of indigo dyed cotton fabric before laser treatment are presented in Figure 9. The highest decrease of relative values is 16% for 400 bits.ms
-1. The lowest
decrease of relative values is 5% for marking speed of 50 bits.ms
-1.
0
5
10
15
20
25
30
35
7 8 9 10 11 12
pH
%
400 bits/ms 300 bits/ms
200 bits/ms 100 bits/ms
50 bits/ms
Figure 9 Relative values of indigo dyed cotton samples standardized by the original K/S values before laser irradiation as a function of pH values in dyeing bath after laser irradiation
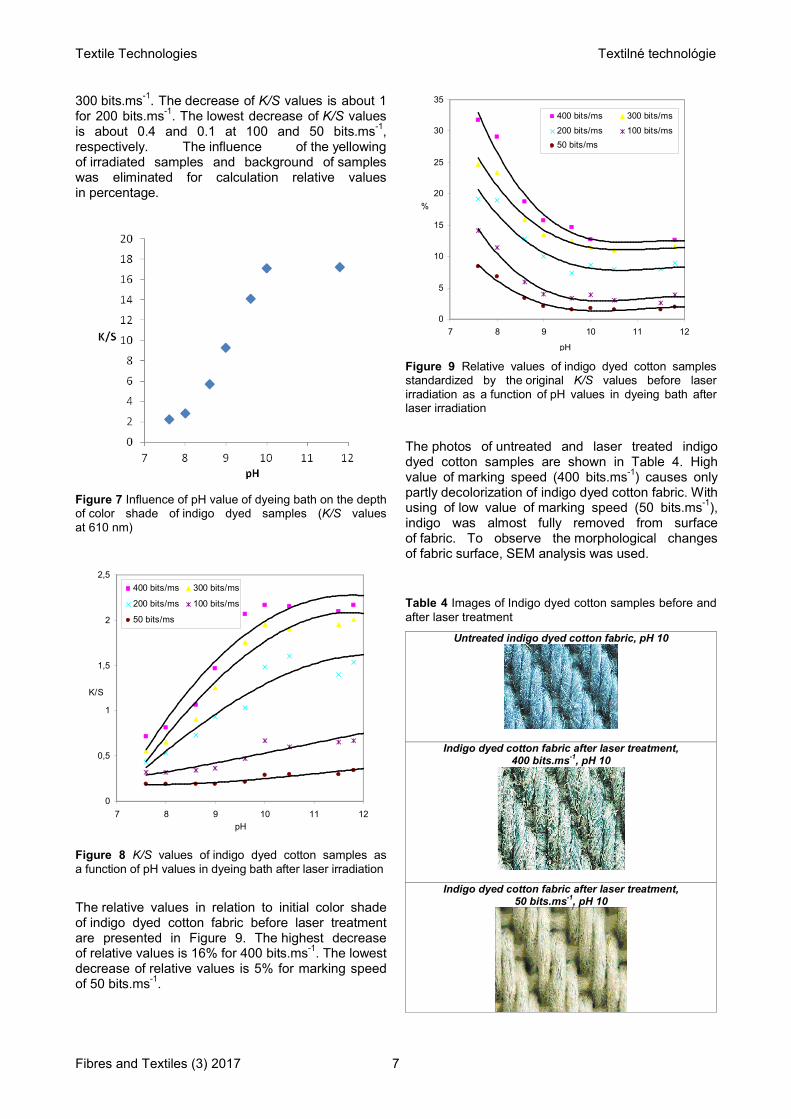
The photos of untreated and laser treated indigo dyed cotton samples are shown in Table 4. High value of marking speed (400 bits.ms
-1) causes only
partly decolorization of indigo dyed cotton fabric. With using of low value of marking speed (50 bits.ms
-1),
indigo was almost fully removed from surface of fabric. To observe the morphological changes of fabric surface, SEM analysis was used.
Table 4 Images of Indigo dyed cotton samples before and after laser treatment
Untreated indigo dyed cotton fabric, pH 10
Indigo dyed cotton fabric after laser treatment, 400 bits.ms-1, pH 10
Indigo dyed cotton fabric after laser treatment, 50 bits.ms-1, pH 10
Textile Technologies Textilné technológie
Fibres and Textiles (3) 2017 8
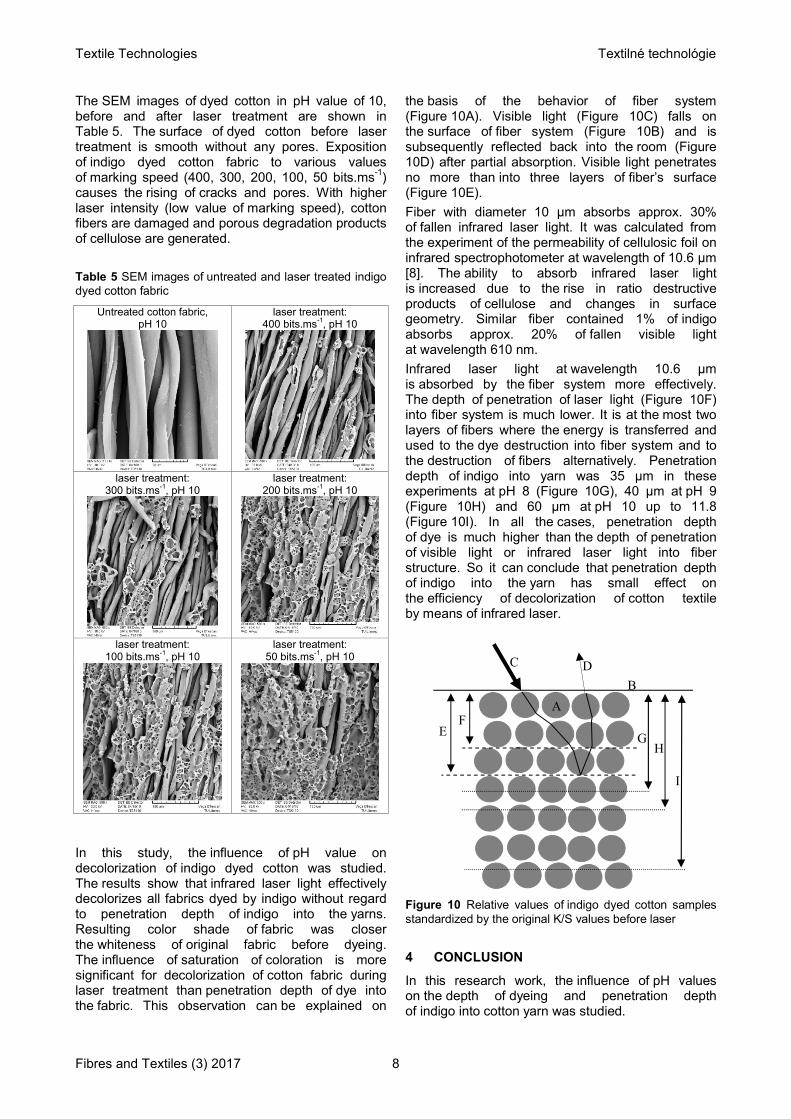
The SEM images of dyed cotton in pH value of 10, before and after laser treatment are shown in Table 5. The surface of dyed cotton before laser treatment is smooth without any pores. Exposition of indigo dyed cotton fabric to various values of marking speed (400, 300, 200, 100, 50 bits.ms
-1)
causes the rising of cracks and pores. With higher laser intensity (low value of marking speed), cotton fibers are damaged and porous degradation products of cellulose are generated.
Table 5 SEM images of untreated and laser treated indigo dyed cotton fabric
Untreated cotton fabric, pH 10
laser treatment: 400 bits.ms-1, pH 10
laser treatment:
300 bits.ms-1, pH 10 laser treatment:
200 bits.ms-1, pH 10
laser treatment: 100 bits.ms-1, pH 10
laser treatment: 50 bits.ms-1, pH 10
In this study, the influence of pH value on decolorization of indigo dyed cotton was studied. The results show that infrared laser light effectively decolorizes all fabrics dyed by indigo without regard to penetration depth of indigo into the yarns. Resulting color shade of fabric was closer the whiteness of original fabric before dyeing. The influence of saturation of coloration is more significant for decolorization of cotton fabric during laser treatment than penetration depth of dye into the fabric. This observation can be explained on
the basis of the behavior of fiber system (Figure 10A). Visible light (Figure 10C) falls on the surface of fiber system (Figure 10B) and is subsequently reflected back into the room (Figure 10D) after partial absorption. Visible light penetrates no more than into three layers of fiber’s surface (Figure 10E).
Fiber with diameter 10 µm absorbs approx. 30% of fallen infrared laser light. It was calculated from the experiment of the permeability of cellulosic foil on infrared spectrophotometer at wavelength of 10.6 µm [8]. The ability to absorb infrared laser light is increased due to the rise in ratio destructive products of cellulose and changes in surface geometry. Similar fiber contained 1% of indigo absorbs approx. 20% of fallen visible light at wavelength 610 nm.
Infrared laser light at wavelength 10.6 µm is absorbed by the fiber system more effectively. The depth of penetration of laser light (Figure 10F) into fiber system is much lower. It is at the most two layers of fibers where the energy is transferred and used to the dye destruction into fiber system and to the destruction of fibers alternatively. Penetration depth of indigo into yarn was 35 μm in these experiments at pH 8 (Figure 10G), 40 μm at pH 9 (Figure 10H) and 60 μm at pH 10 up to 11.8 (Figure 10I). In all the cases, penetration depth of dye is much higher than the depth of penetration of visible light or infrared laser light into fiber structure. So it can conclude that penetration depth of indigo into the yarn has small effect on the efficiency of decolorization of cotton textile by means of infrared laser.
Figure 10 Relative values of indigo dyed cotton samples standardized by the original K/S values before laser
4 CONCLUSION
In this research work, the influence of pH values on the depth of dyeing and penetration depth of indigo into cotton yarn was studied.
E
C
F
D
A
B
G H
I

Textile Technologies Textilné technológie
Fibres and Textiles (3) 2017 9
For higher pH values, indigo penetrates deeper into textile structure. Indigo dye is worse soluble in dyeing bath at moderately alkaline or medium pH. In lower pH values, indigo dye is adsorbed only on the surface of fabric. Experimentally determined penetration depth of indigo into cotton yarn was 35 μm at pH 8 and 40 μm at pH 9 in warp and weft direction. The higher penetration of indigo into cotton yarn, 60 μm, was obtained t alkaline medium pH values of 10 and 11.8.
Laser irradiation effectively decolorized all indigo dyed cotton samples without any influence of penetration depth of indigo dye into the textile structure. Final color of shade was close to original textile material before dyeing. Partly decolorization of indigo dyed cotton is achieved by high value of marking speed (400 bits.ms
-1). Indigo can be fully
removed from surface of fabric at 50 bits.ms-1
. SEM figures show only smooth fiber´s surface before laser treatment. With the decreasing of marking speed, fibers are damaged and cracks and pores on fiber’s surfaces after laser treatment are created.
The higher K/S values were detected at higher values of marking speed 400 and 300 bits.ms
-1.
The lower K/S values were observed at lower values of marking speed 100 and 50 bits.ms
-1. Relative
values in percentage presents the color changes of shade in relation to initial color shade of samples before laser treatment and after elimination of the influence of the yellowing and background of samples. Marking speed 400 bits.ms
-1 causes
the highest decrease of relative values.
The decolorization of indigo dyed cotton fabric by infrared laser light is very effective for all samples dyed at various pH values. There is no regard to penetration depth of indigo into cotton yarn.
The saturation of coloration has higher influence on decolorization of indigo dyed cotton. The ability
to absorb infrared laser light increases during laser exposition due to higher proportion of destructive products of cellulose and changes in surface geometry. In real conditions laser energy is change into heat energy in the first layer of fibers. Infrared laser light at wavelength 10.6 µm is efficiently absorbed in two layers of fibers, where laser energy can penetrate. It can be used for the destruction of dyestuff in fibers and alternatively can be used for fiber destruction as well.
5 REFERENCES
1. Kan C.W.: Colour Fading Effect of Indigo-dyed Cotton Denim Fabric by CO2 Laser, Fibers and Polymers 15(2), 2014, pp. 426-429
2. Dascalu T., Acosta-Ortiz S.E., Ortiz-Morales M., Compean I.: Removal of the indigo color by laser beam-denim interaction, Optics Lasers in Engeneering 34, 2000, pp. 179-189
3. Özgüney A.T., ÖzÇelelik G., Özkaya K.: A study on specifying fading process on the colour change and mechanical properties of the denim fabrics, Tekstíl ve Konfeksiyon 2, 2009
4. Ortiz-Morales M., Poterasu M., Acosta-Ortiz S.E., Compean J.I., Hernandez-Alvarado M.R.: A comparison between characteristics of various laser-based denim fading processes, Optics and Lasers Technology 39, 2003, pp. 15-24
5. Chow Y.L., Chan C.K., Kan C.W.: Effect of CO2 laser treatment on cotton surface, Cellulose 18(6), 2011, pp. 1635-1641
6. Chow Y.L., Chan A., Kan Ch.: Effect of CO2 laser irradiaton on the properties of cotton fabric, Textile Research Journal 82(12), 2011, pp. 1220-1234
7. Štěpánková M., Wiener J., Rusinová K.: Decolourization of vat dyes on cotton fabric with infrared laser light, Cellulose 18, 2011, pp. 469-478
8. Ilg H., Bechter D.: Textil-Praxis, 23, 1968

Textile Technologies Textilné technológie
Fibres and Textiles (3) 2017 10
DESIGN OF CONCORDANT FORMS OF MODERN CLOTHES ON THE BASIS OF PROPORTIONAL CORRELATIONS OF SACRED
GEOMETRY
O.V. Kolosnichenko, A.I. Baranova and I.O. Prykhodko-Kononenko
Kyiv National University of Technologies and Design, Nemirovicha-Danchenka str. 2, 01011 Kyiv, Ukraine [email protected]
Abstract: Design of concordant collection of women’s clothes by means of interpretation of proportional correlations of sacred geometry using combination options for structural forms and lines when creating texture, colour and prints. In order to analyse the information sources, the literary and analytical, visual and analytical methods have been applied; to investigate the requirements of the customer segment, the sociological survey has been applied; in order to transform typical proportional correlations to rhythms of the designer clothes, the systems and structural, morphological analyses have been applied.
Keywords: sacred geometry, Fibonacci sequence, Archimedean spirals, fractals, system and structural analysis, morphological analysis, clothing design, concordance of the forms of clothes, prints.
1 INTRODUCTION
We live in a geometrically regulated world, where all our actions on physical level are under mathematical laws. The sacred geometry determines the laws of existence and informs a person about them by means of language of numbers, angles, forms and relations, it describes powers of self-organization, shaping the world and it measures concordant fluctuations, sustaining life at all levels. All the environment, as well as a human body, consists of a form, structured by specific geometry, combining mystic spiritual practices and accurate scientific formulas, it provides with harmony, for which a person strives for.
The uniform is closely related to the proportional form of a human body, therefore the transfer of such correlations as proportion of golden ratio and Fibonacci sequence on the process of its design is well grounded [1-7].
The object of the research is design of concordant collection of women’s clothes by means of interpretation of proportional correlations of sacred geometry using combination options for structural forms and lines when creating texture, colour and prints.
2 EXPERIMENTAL
Sacred geometry (lat. Sacralis – sacramental, celestial) is religious and mythological concept of the world’s harmony, its structure of geometric shapes, forming the basis for existence [2]. This unique ideology is a result of scientific work and
mystic experience of the world; with all its relations and correlations it is widely used in forming of concordant musical, architectural and artistic compositions.
Every line, every rhythmic element contains certain spiritual principle or pattern, where the deepest meaning is laid. The Fibonacci sequence is the elements of numerical order, where every next number equals to the sum of two previous numbers, it looks as follows 0, 1, 1, 2, 3, 5, 8, 13, 21, 34, 55, 89 etc. This mathematical correlation has a wide range of occurrences in the world around us (location of seeds in a sunflower, a shape of a pine cone, petals and stems of flowers etc.), (Table 1). The Fibonacci sequence is closely related to the definition of Archimedean spiral, presented in the form of a spiral with proportional increase of pitch and convolution. While investigating the parts of spiral convolutions we can see that they are located in accordance with the above stated sequence of numbers, augmenting proportionally [1, 2, 4].
Sequences and correlations, presented in Archimedean spiral and Fibonacci sequence, may be applied in the process of design of women’s clothes collection in order to concord its suit form, since in these particular proportional combinations the laws of organization of the whole world are reflected. The suit form is composed according to the above mentioned proportions – the upper part of the suit is divided in two even parts 1:1 and it equals to its lower part [4].

Textile Technologies Textilné technológie
Fibres and Textiles (3) 2017 11
Table 1 Expressions of mathematical correlation in Archimedean spiral and Fibonacci sequence
Archimedean spiral Fibonacci sequence
Archimedean spiral scheme Allocation of leaves on a tree in Fibonacci sequence
A snail shell based on the principle of Archimedean spiral Human DNA based on the principle of Fibonacci sequence
Spider web based on the principle of Archimedean spiral Location of seeds in a sunflower
Fibonacci numbers can be also observed in space, since Milky Way and many other galaxies are based on the principle
of Archimedean spiral
Moreover, in the process of creation of the models forms, the proportions of golden ratio are used by means of bisection of general uniform in such a manner that the relation of the major part to the minor part equals to the relation of the whole dimension to its major part. The most widespread picture of the golden ratio is a “Vitruvian Man” – the work of Leonardo da Vinci, used as a picture in a book about Vitruvius works. It is an encircled figure of a naked man with outspread legs and hands, applied on another figure with outspread hands and closed legs, inscribed in a square. This picture is considered to be an example of canonical proportions of a human body.
Another picture, containing demonstration of harmony is the so called “Flower of Life” (Figure 1), which, according to ancient legends of the East, contains all famous laws and all famous formulas. On the basis of its symbols “Flower of Life” equals the proportions of the golden ratio and symbolizes an absolute order [1-3]. It provides a clear idea of components, located in accurate hierarchy and give the possibility to suppose that each its joint can also be the “Flower of Life”.
The demonstrated fatality generates amazing symmetry and harmony, since the fractal is indefinitely self-similar geometric figure, each fragment of which is repeated as the dimension reduces. The scale invariant, observed in fractals, can be either accurate, or approximate.
Figure 1 Structure of “Flower of Life”
In order to decorate the collection with ornaments the mathematical correlation of “Flower of Life”, its structure, involving a concordant order, was used. Therefore, the researches are based right on the “Flower of Life”, which resulted in creation of fractal ornaments for ornamental arrangement

Textile Technologies Textilné technológie
Fibres and Textiles (3) 2017 12
of the suit form, using its structural bonds with its further transformation in prints.
In order to allocate the consumer segment and specify more precisely the design and ornamental decisions of the suit form, the opinion poll was hold, which resulted in formation of an image of a potential consumer and requirements for the suit, the outline form and its design solution, modern types of ornaments and its locations were identified. The consumer image is a young woman of 23-27, experiencing beauty and harmony in everything: she is attracted by everything secret and mystic of this world, she is a creative person from show business, engaged in mediation and drawing.
The results of sociological research of the consumer segment requirements and the carried out morphological analysis became the basis for combining of consumer requirements with modern trends for creating harmonious suit forms.
In order to carry out the morphological analysis, the following design components were chosen: location of a waist-line, style of a sleeve, concentration of ornament, shaping of a neckline [5, 6]. The combination was applied by means of combination of trend outline forms with the above stated morphological components.
As a result of carried out analysis we can confirm that the most concordant combinations are trapezoidal outline with high waist-line; combination of straight outline with a concealed sleeve; combination of the outline ‘sandglass’ with ornament, concentrated on the waist-line; trapezoidal outline with a high round neck (Figure 2).
a b c d
Figure 2 Making structural units on the basis of results of morphological analysis: a - location of a waist-line; b - style of a sleeve; c - concentration of ornament; d - shaping of a neckline
Taking into account the peculiarities of proportions of “golden ratio” and its use in a designed women’s clothing collection, the following correlations are used in formation of relations between a general form and its components:
- principle of “golden ratio” (3:5, 5:8, 8:13), which evokes the most concordant perception, is
recommended to be used in formation of business collection;
- contrast proportions (1:4, 1:5), which draw attention to itself more actively, should be better used for a set of evening dress;
- similar proportions (1:1), evoking the feeling of statics, calm and tranquillity, are recommended to be used in design of a set of casual and home clothing.
As mentioned above, the ornament and textures were created on the basis of transformation of the “Flower of Life” representation in combination with colour range corresponding to modern tendencies (Figures 3 and 4).
Figure 3 Creation of ornament on the basis of “Flower of Life”
Figure 4 Combination of a designed uniform with developed ornament

Textile Technologies Textilné technológie
Fibres and Textiles (3) 2017 13
On the basis of conducted researches the collection of women’s clothing [7] is created with improved aesthetic properties, taking into account the consumer requirements by means of concordance of its form, structural and morphological bonds.
The collection is designed in accurate, logical sequence and has a unit structure, containing the development of the form and colour range that is the ideological line of concordance is observed from the first unit to the last. Each successive unit of the collection is the logical continuation of the previous one. Speaking about the principles for creation of the collection, it is worth mentioning that its development can be described with several aspects, which together create a unified multilayer integral collection and artistic image.
The collection consists of four units: casual clothing (Figure 5), unit of evening clothing (Figure 6), unit of work clothing, unit of women’s lingerie. Proceeding from the units purpose the colour range and materials were used, which would be fit for
the purpose of clothing and its emotional charge. From the same considerations the decoration was chosen (its location, number of elements and its form).
Moving from one model to another within each unit, the outline form gradually changes the proportions, creating the variety of forms, though it does not outstep the unified outline form of the unit. The designed form of outlines involves free movement without hindering movements. The division of every outline form of the collection is made on the waist-line. However some models of clothing involve the division of form above the waist-line and below the breast.
The coloristic decision of the collection is made due to peculiarities of the source and fashion trends, from which, at most, cool colours were used. Cool pastel and bright colours of cloths are offered for the models of units of casual, work and evening clothing, in order to provide the collection with expressiveness and extravagance.
Figure 5 Unit of sketches of casual clothing
Figure 6 Sketches from unit of evening clothing

Textile Technologies Textilné technológie
Fibres and Textiles (3) 2017 14
3 RESULTS AND DISCUSSION
Determined proportional correlations have been applied in the process of design of women’s clothes assortment as signs-symbols, which became the basis for the creation of an artistic form meeting the consumer requirements.
It involves the systemization of the analysed dimensional proportions of mathematical relations of sacred geometry and their further application in the process of design of women’s clothes collection for its concordance.
The obtained results have been applied in design of concordant women’s clothes on the basis of correlations, being the part of the sacred geometry contains. The women’s clothes collection has been designed using ornamental compositions on the basis of fractals principle, used in trimming of the clothes.
4 CONCLUSION
During the research the primary focus was on studying the principles of dimensional and proportional correlation, which are the basis of sacred geometry. The basis and essence of sacred geometry was researched, the main idea of which is the proportional concordance of existing proportions.
It has been established that components of the form, contained in sacred geometry, have structural bonds and they are constructed under the principle of fractal repetition.
The consumers survey let us confirm that the proposed outline forms and their design and ornamental arrangement completely correspond to main ideas of sacred geometry and are modern from the point of view of fashion trend of nowadays. It is also worth mentioning that location of ornament on
articles create a visual impression of a “section” of a form, therefore ornamental elements should be located in places that are approximate to the principle of “golden ratio”.
The most successful combinations of morphological components of the form are determined by means of their combination. The components for morphological analysis were selected from the results of the consumers’ questionnaire survey and confirmed by fashion solutions, as presented by trendsetter agencies.
Based on the conducted researches and studying of esoteric symbols the collection of women’s clothing of concordant forms was designed.
5 REFERENCES
1. Mandel'brot B.: Fractal Geometry of Nature, Institute of Computer Science, 2002
2. Skinner S.: Sacred geometry. Deciphering the code, Kladez'-Buks, 2009, 328 p.
3. Itten J.: Art of Color: The Subjective Experience and Objective Rationale of Color, John Wiley & Sons, 1997
4. Kolosnіchenko O.V.: Harmonic analysis and visualization of proportioning clothing art form based on information and sign systems, Bulletin of Kyiv National University of Technology and Design №1, 2015, pp. 79-85
5. Kozlova T.V.: Costume. The theory of artistic design, Textbook for high schools, MGTU im. A.N. Kosygina, 2005, 380 p.
6. Kolosnіchenko M.V.,. Zubkova L.І, Pashkevich K.L., Pol'ka T.O., Ostapenko N.V., Vasil'eva І.V., Kolosnіchenko O.V.: Ergonomics and design. Designing of modern types of clothes: Textbook, K.: PP «NVC «Profі», 2014, 386 p.
7. Malins'ka A.M., Pashkevich K.L., Smirnova M.R., Kolosnіchenko O.V.: Develop collections of clothes, Textbook, K.: PP «NVC «Profі», 2014, 140 p.

Textile Technologies Textilné technológie
Fibres and Textiles (3) 2017 15
OPTIMIZATION OF MILLINERY RIBBON DYEING CONDITIONS
M. Černý, I. Vojtová, P. Bayerová, L. Burgert and A. Vojtovič
Faculty of Chemical Technology, University of Pardubice, Studentská 95, 532 10 Pardubice, Czech Republic [email protected]
Abstract: This article describes a study of dyeing millinery ribbon based on cotton and polyamide blends. These blends combine good absorbency of cotton material with improved strength of polyamide. Unfortunately, their different physicochemical properties are the main disadvantage for finishing processes, especially for dyeing. Differing amounts of binding sites on cotton and on polyamide often result in unlevel dyeing of such blends. Moreover, barriness of polyamide may also occur due to different conditions of production of individual tows of polyamide or even different suppliers of polyamide yarns. One of the possibilities which can be used for dyeing cotton-polyamide blends is using a combination of direct and acid dyes. Two suitable combinations of direct dyes or a mixture of direct and acid dyes were selected for testing. Temperature of dyeing (85 and 97°C) was studied as well as changing pH values of the dyebath for levelling of the final dyeing. But mostly it is necessary to use textile auxiliaries. In this article the following types of textile auxiliaries were selected: Alviron RFR, Slovasol 257 and lecithin.
Dyeing of millinery ribbon was divided into three sequential steps: 1) Wetting of the ribbon with different kinds of textile auxiliaries; 2) The dyeing process with different temperature, pH, and textile auxiliaries; 3) Stabilization of dyeing with cationic agent Syntefix TE.
Dyeing process and the coloring were evaluated by standard coloristic methods (absorption spectrum, amount of dyestuff on the fabric, color fastness to perspiration). Levelness of dyeing was equally monitored.
Keywords: Millinery ribbon, polyamide / cotton blend, dyeing, direct dye, acid dye.
1 INTRODUCTION
Textile blends of cotton and polyamide fibers combine good strength, abrasion resistance, quick drying properties and improved crush resistance. Cotton provides high absorbency and soft touch, thereby improving comfort in use [1]. Replacing expensive fiber with cheaper fiber with properties that cannot be obtained using only one type of material can be considered another reason. El-Sheikh’s studies have shown that the properties of the blended yarn depend on the fibers used and also that the strength of blended yarn decreases with the increasing percentage of high performance fibers [2].
The main disadvantage of these blends is their different physicochemical properties which cause problems in finishing processes. Differing amounts of binding sites on the cotton and on the polyamide surface often result in unlevel dyeing of the blends. Moreover, in the polyamide fiber, inner unlevel dyeing caused by different conditions of production of individual tows of polyamide or even by different suppliers of polyamide yarns may occur. From the viewpoint of dyeing, only few classes of dyes color sufficiently and, above all, uniformly both the cotton and the polyamide parts of blends. Blends of cotton and polyamide are generally dyed in two-bath process [3].
Direct dyes are one class of water soluble dyes which can be used for dyeing cotton-polyamide yarns, wherein creation of ionic bonds between polyamide surface and dyestuff is suppressed. When direct and acid dyes are used together in the same dyebath, only acid dyes able to dye in neutral dyebath have to be used [4]. In these, valence of the dye to the polyamide part of the material by ionic bonds is inherently suppressed; the formation of these bonds would favor dyeing the polyamide part to dyeing the cotton yarn because of high production rate of such bonds. When the classes of direct and acid dyes are used together, the same principles apply, but the polyamide fiber must be dyed by neutral acid dyes [4].
Uniformity of the final dyeing can be affected by changing the parameters of dyeing, usually the temperature and pH of a dye bath. However, it is necessary to use special textile auxiliaries which support the migration of the dye to the cotton fiber and reduce sorption rate of the dye on polyamide fiber surface. Use of soybean lecithin is another option instead of special textile auxiliaries, namely encapsulating the dye into liposomic system using lecithin with a suitable surfactant. After encapsulation of the dye, a gradual release occurs during the dyeing process and thereby a more uniform dyeing of the blend is achieved.

Textile Technologies Textilné technológie
Fibres and Textiles (3) 2017 16
2 EXPERIMENTAL
Millinery ribbon made of a blend of cotton-nylon (35% of cotton, 65% of polyamide) was used for this study. Two different mixtures of textile dyes with predicted properties were chosen for subsequent dyeing. First dyestuff mixture was the result of mixing direct and acid dyes (blue color shade) while the second mixture was prepared only from direct dyes. Suitable textile auxiliaries (TA) (anionic surfactant Alviron RFR, nonionic surfactant Slovasol 257 and the mixture of Slovasol 257 with soybean lecithin) were selected for the experimental work. The dyeing conditions were studied by changing acidity of the environment and also differed in final dyeing temperature (85 and 97°C). Finally, the effect of stabilization of the resulting dye (using Syntefix TE) on color stability was studied too.
Dyeing process of the ribbon was divided into three subsequent basic processes: wetting of the ribbon with different textile auxiliaries, dyeing process and then the fixation of dye with Syntefix TE. The influence of the presence of wetting process and / or the process of fixation on the final dyeing was monitored. All dyeing procedures were performed in the dyeing apparatus Ahiba Nuance Top Speed IIB with IR heating. Bath ratio (ratio of the liquor) in all processes was set to 1:70.
Wetting process
Wetting process (Scheme 1) was selected for the expected improvement of uniformity of resulting dye. The same type of textile auxiliaries as in the subsequent dyeing process was always added. The ribbon was wetted at 85°C for 20 minutes.
20´
85 °C
t [°C]
TA
Scheme 1 The wetting process of millinery ribbon with different textile auxiliaries
Dyeing process
Within the dyeing process modifications, six different variants were prepared with different types of textile auxiliaries in combination with two different final temperatures of dyeing.
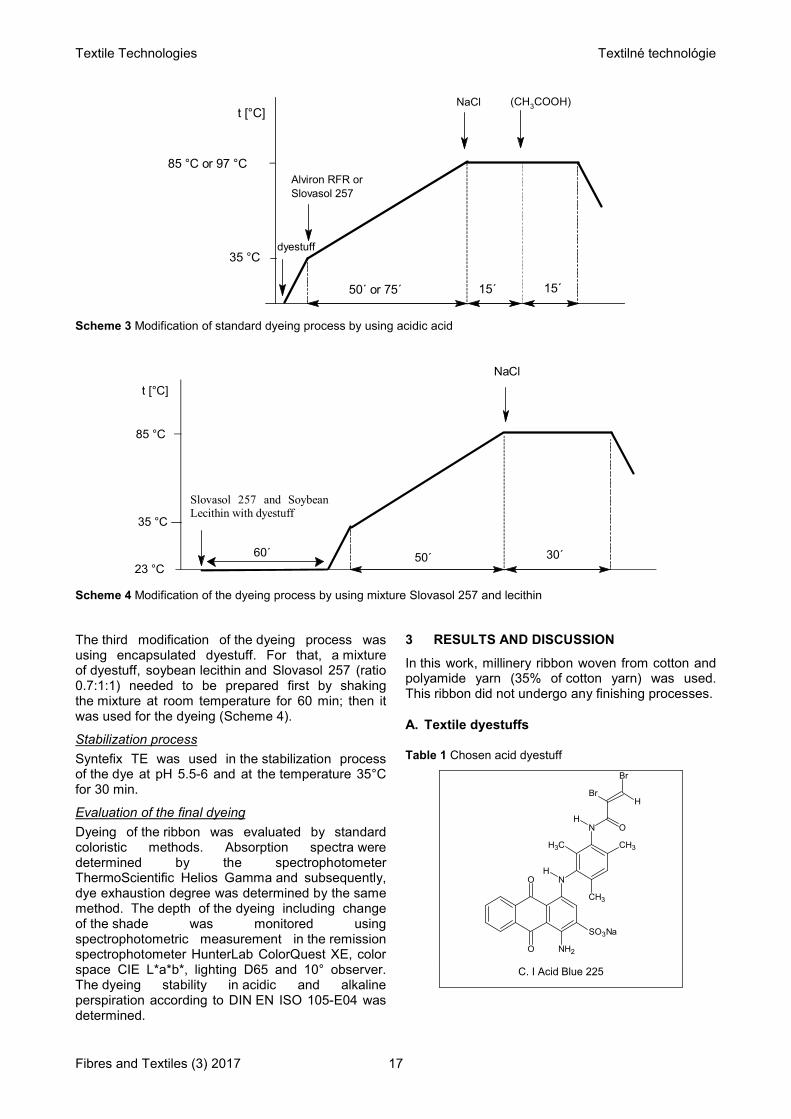
In the standard dyeing process, selected textile auxiliaries were added at 35°C into the dye bath and then the bath was slowly heated to the desired dyeing temperature (Scheme 2, 50 min at 85°C, 75 min at 97°C). At this temperature, the appropriate amount of electrolyte (sodium chloride) was added into the dye bath. Isothermal dyeing was continued for 30 min. After 30 minutes, the dye bath was cooled and the dyed sample was removed and scrubbed in a stream of water until unfixed dye was washed out.
Acidifying the dye bath using acidic acid of the concentration of 2 mL per liter added after 15 min of isothermal dyeing was another modification of the dyeing process (Scheme 3).
85 °C or 97 °C
t [°C]
35 °C
50´ or 75´ 30´
Alviron RFR or
Slovasol 257
NaCl
dyestuff
Scheme 2 The standard dyeing process, 85°C or 97°C
Textile Technologies Textilné technológie
Fibres and Textiles (3) 2017 17
85 °C or 97 °C
t [°C]
35 °C
50´ or 75´ 15´
Alviron RFR or
Slovasol 257
NaCl
15´
(CH3COOH)
dyestuff
Scheme 3 Modification of standard dyeing process by using acidic acid
85 °C
t [°C]
35 °C
50´ 30´
Slovasol 257 and Soybean Lecithin with dyestuff
60´
23 °C
NaCl
Scheme 4 Modification of the dyeing process by using mixture Slovasol 257 and lecithin
The third modification of the dyeing process was using encapsulated dyestuff. For that, a mixture of dyestuff, soybean lecithin and Slovasol 257 (ratio 0.7:1:1) needed to be prepared first by shaking the mixture at room temperature for 60 min; then it was used for the dyeing (Scheme 4).
Stabilization process
Syntefix TE was used in the stabilization process of the dye at pH 5.5-6 and at the temperature 35°C for 30 min.
Evaluation of the final dyeing
Dyeing of the ribbon was evaluated by standard coloristic methods. Absorption spectra were determined by the spectrophotometer ThermoScientific Helios Gamma and subsequently, dye exhaustion degree was determined by the same method. The depth of the dyeing including change of the shade was monitored using spectrophotometric measurement in the remission spectrophotometer HunterLab ColorQuest XE, color space CIE L*a*b*, lighting D65 and 10° observer. The dyeing stability in acidic and alkaline perspiration according to DIN EN ISO 105-E04 was determined.
3 RESULTS AND DISCUSSION
In this work, millinery ribbon woven from cotton and polyamide yarn (35% of cotton yarn) was used. This ribbon did not undergo any finishing processes.
A. Textile dyestuffs
Table 1 Chosen acid dyestuff
H
H
O
Br
Br
N
NH2O
O
SO3Na
CH3
CH3CH3
N
H
C. I Acid Blue 225

Textile Technologies Textilné technológie
Fibres and Textiles (3) 2017 18
Table 2 Chosen direct dyestuffs
CH3
SO3Na
SO3Na
S
N
CH3
N
S
N
N
SO3NH2SO3NH2
NaO3S
OH
OHOH N
N
NH
N SO3Na
N
OH
C. I. Direct Yellow 28 C.I. Direct Violet 66
H
SO3Na
ON
N N
N
SO3Na
N
N
NaO3S
NaO3S
H
H
Cl
Cl
N
O
O
NN
NaO3S
SO3Na
N
C. I. Direct Blue 78 C. I. Direct Blue 106
NH2
OH
N
N N
N N
N
SO3Na
SO3Na SO3Na
SO3Na
NH2
NH2
OH
NNNH2
NH2 N N
NN
NNNH2
C. I. Direct Black 56 C. I. Direct Black 19
B. Mixture of direct and acid dyes, blue shade
Mixture of textile dyes with blue shade
C. I. Direct Yellow 28 C. I. Direct Blue 78 C. I. Direct Blue 106 C. I. Acid Blue 225
Absorption spectra of mixture of the dyestuffs
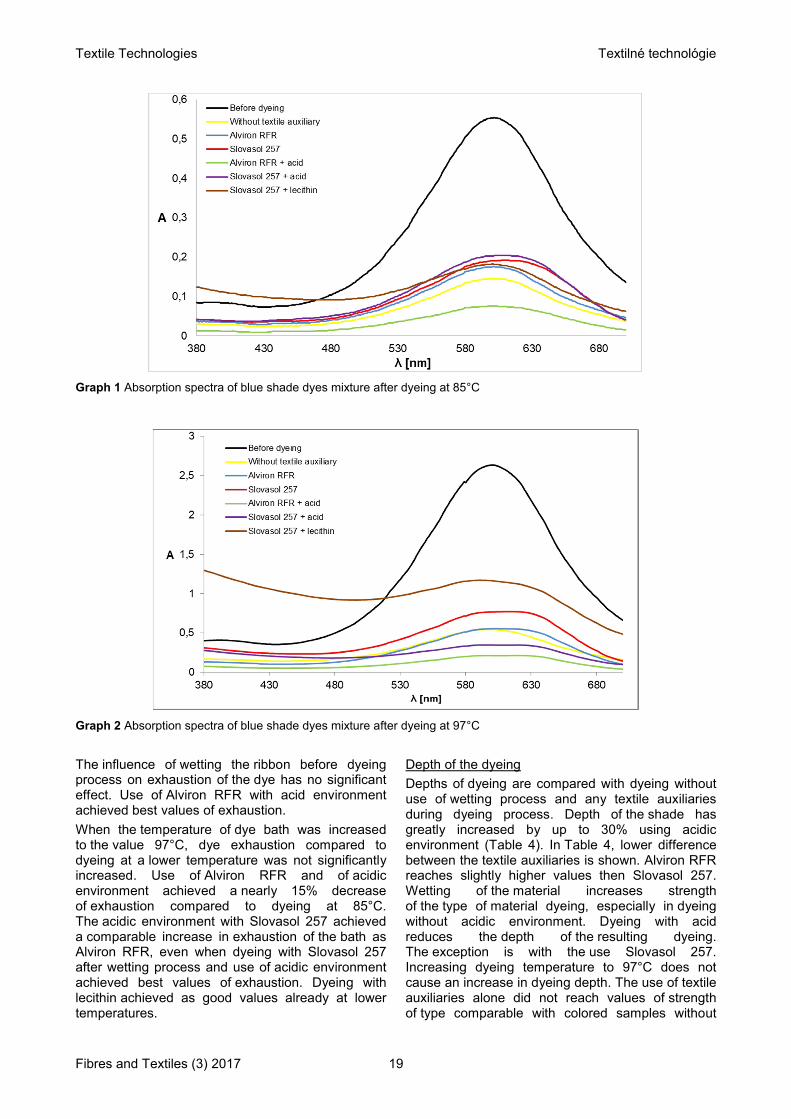
The absorption spectra did not change their shape depending on different dyeing conditions (temperature, different textile auxiliaries (Graphs 1 and 2), except when using lecithin. Due to that fact, maximum absorbance was found at 602 nm value.
Exhaustion of the dye
Exhaustion of the dye bath reached higher values (Table 3). Using various textile auxiliaries
in combination with acidic environment, the rate of exhaustion improved significantly, up to 20%.
The presence of an acid dye is the cause of this increase. Maximum value of dye exhaustion is about 90%, when dyeing at the temperature of 85°C is chosen.
Table 3 Exhaustion of the dye mixture with blue shade
% of exhaustion, dyeing at 85°C
% of exhaustion, dyeing at 97°C
- wetting - wetting
Without TA 73.0 68.9 79.0 76.5 Alviron RFR 68.0 72.0 79.0 63.6 Slovasol 257 67.3 70.7 70.0 72.0 Alviron RFR + acid 86.4 90.0 91.0 76.0 Slovasol 257 + acid 64.9 62.4 86.0 90.2 Slovasol 257 + acid 67.3 56.3 65.0 60.0
Textile Technologies Textilné technológie
Fibres and Textiles (3) 2017 19
Graph 1 Absorption spectra of blue shade dyes mixture after dyeing at 85°C
Graph 2 Absorption spectra of blue shade dyes mixture after dyeing at 97°C
The influence of wetting the ribbon before dyeing process on exhaustion of the dye has no significant effect. Use of Alviron RFR with acid environment achieved best values of exhaustion.
When the temperature of dye bath was increased to the value 97°C, dye exhaustion compared to dyeing at a lower temperature was not significantly increased. Use of Alviron RFR and of acidic environment achieved a nearly 15% decrease of exhaustion compared to dyeing at 85°C. The acidic environment with Slovasol 257 achieved a comparable increase in exhaustion of the bath as Alviron RFR, even when dyeing with Slovasol 257 after wetting process and use of acidic environment achieved best values of exhaustion. Dyeing with lecithin achieved as good values already at lower temperatures.
Depth of the dyeing
Depths of dyeing are compared with dyeing without use of wetting process and any textile auxiliaries during dyeing process. Depth of the shade has greatly increased by up to 30% using acidic environment (Table 4). In Table 4, lower difference between the textile auxiliaries is shown. Alviron RFR reaches slightly higher values then Slovasol 257. Wetting of the material increases strength of the type of material dyeing, especially in dyeing without acidic environment. Dyeing with acid reduces the depth of the resulting dyeing. The exception is with the use Slovasol 257. Increasing dyeing temperature to 97°C does not cause an increase in dyeing depth. The use of textile auxiliaries alone did not reach values of strength of type comparable with colored samples without

Textile Technologies Textilné technológie
Fibres and Textiles (3) 2017 20
textile auxiliaries. It was confirmed that when using the dyeing process without wetting, use of a combination of Alviron RFR with acid is most appropriate.
Just like in the dyeing at the temperature 85°C, the strongest dyeing of the ribbon is achieved using the combination of Slovasol 257 in acidic environment.
Dyeing fastness
Dyeing with combination of direct and acid dyes yielded very good fastness (Tables 5 and 6).
These values of stability evidence, that the dye achieves, as predicted, higher resistance to acidic environment than to alkaline.
Table 4 Values of E and depth of dyeing
Dyeing temperature 85°C 97°C
E* Avg E* Avg
without wetting process Alviron RFR 0.98 108.66 0.91 95.09 Slovasol 257 0.83 95.63 0.97 94.05 Alviron RFR + acid 2.73 123.13 2.84 116.49 Slovasol 257 + acid 1.71 111.91 5.66 98.35 Slovasol 257 + lecithin 0.75 105.63 0.28 100.89 with wetting process Alviron RFR 1.03 96.07 1.52 92.10 Slovasol 257 0.24 99.64 1.96 96.60 Alviron RFR + acid 1.04 109.45 0.76 95.12 Slovasol 257 + acid 3.00 122.49 5.35 134.78 Slovasol 257 + lecithin 0.61 106.03 0.84 106.8
Table 5 Values of fastness in acid and alkaline perspiration, dyeing at 85°C
Without TA Alviron RFR Slovasol 257
Alviron RFR + acid
Slovasol 257 + acid
Slovasol 257 + lecithin
S* U* S* U* S* U* S* U* S* U* S* U*
Acidic perspiration
With wetting process Change in the shade 4-5 4-5 5 4-5 4-5 4-5 4-5 4 4-5 4 4-5 4-5 Staining to the CO 4-5 4-5 5 4 5 5 4-5 4-5 5 4 4-5 4-5 Staining to the PA 4-5 3-4 4-5 4-5 4-5 4 4-5 3 4-5 3 4-5 4-5 Without wetting process Change in the shade 4-5 3-4 5 4 5 5 5 4-5 4-5 4-5 4-5 4-5 Staining to the CO 4 4 4-5 4-5 5 4-5 4-5 4-5 4-5 4 5 4-5 Staining to the PA 4-5 4 4-5 4 4-5 4-5 4-5 4 4-5 4 4-5 3-4
Alkaline perspiration
With wetting process Change in the shade 5 4-5 4-5 4 4-5 4-5 4-5 4-5 4-5 4-5 4-5 4-5 Staining to the CO 4-5 2-3 4-5 3 4-5 3-4 4-5 2 4 4 4-5 3 Staining to the PA 4-5 3 4 4 4 4 4 3-4 4 4 4-5 4 Without wetting process Change in the shade 4 4 4-5 3-4 4-5 4-5 4-5 4 4-5 4 3-4 4 Staining to the CO 4-5 3 4-5 3 4-5 4 4 2-3 4-5 3-4 4-5 3 Staining to the PA 4-5 4 4-5 4 4 4 4-5 4-5 4-5 4 4-5 3-4
* S - stabilized; U - unstabilized
Table 6 Values of fastness in acid and alkaline perspiration, dyeing at 97°C
Without TA Alviron RFR Slovasol 257
Alviron RFR + acid
Slovasol 257 + acid
Slovasol 257 + lecithin
S* U* S* U* S* U* S* U* S* U* S* U*
Acidic perspiration
With wetting process Change in the shade 4-5 4-5 5 4-5 4-5 4-5 4-5 4 4-5 4 4-5 4-5 Staining to the CO 4-5 4-5 5 4 5 5 4-5 4-5 5 4 4-5 4-5 Staining to the PA 4-5 3-4 4-5 4-5 4-5 4 4-5 3 4-5 3 4-5 4-5 Without wetting process Change in the shade 5 4-5 5 5 5 5 4-5 4-5 4-5 4 4-5 4-5 Staining to the CO 5 4-5 5 4-5 5 4-5 5 4-5 4-5 4-5 5 4-5 Staining to the PA 4 4 4-5 4-5 4-5 4-5 4-5 4-5 4-5 4-5 4-5 4-5
Alkaline perspiration
With wetting process Change in the shade 5 4-5 4-5 4-5 4-5 4 4-5 4-5 4-5 4-5 4-5 4-5 Staining to the CO 4-5 2-3 4-5 3 5 3-4 4-5 2 4 4 4-5 3 Staining to the PA 4-5 3 4 4-5 4-5 4 4 3-4 4 4 4-5 4 Without wetting process Change in the shade 5 4-5 5 5 5 5 4-5 4-5 4-5 4 4-5 4-5 Staining to the CO 5 4-5 5 4-5 5 4-5 5 4-5 4-5 4-5 5 4-5 Staining to the PA 4 4 4-5 4-5 4-5 4-5 4-5 4-5 4 4-5 4-5 4-5
* S - stabilized; U - unstabilized
Textile Technologies Textilné technológie
Fibres and Textiles (3) 2017 21
Unstablilized material showed surprisingly small differences in stability as compared to material which had undergone fixed dyeing. Color-fastness without textile auxiliaries of ribbon dyed at 85°C achieved slightly reduced values. The use of textile auxiliaries increased fastness values. The fastness values slightly decreased when wetting process before the dyeing process was employed. The use of different modifications did not bring big differences in fastness. Staining to cotton fabric is greater than staining to polyamide fabric.
C. Mixture of direct dyes, grey shade
Mixture of textile dyes with grey shade
C. I. Direct Yellow 28 C. I. Direct Black 56 C. I. Direct Black 19 C. I. Direct Violet 66
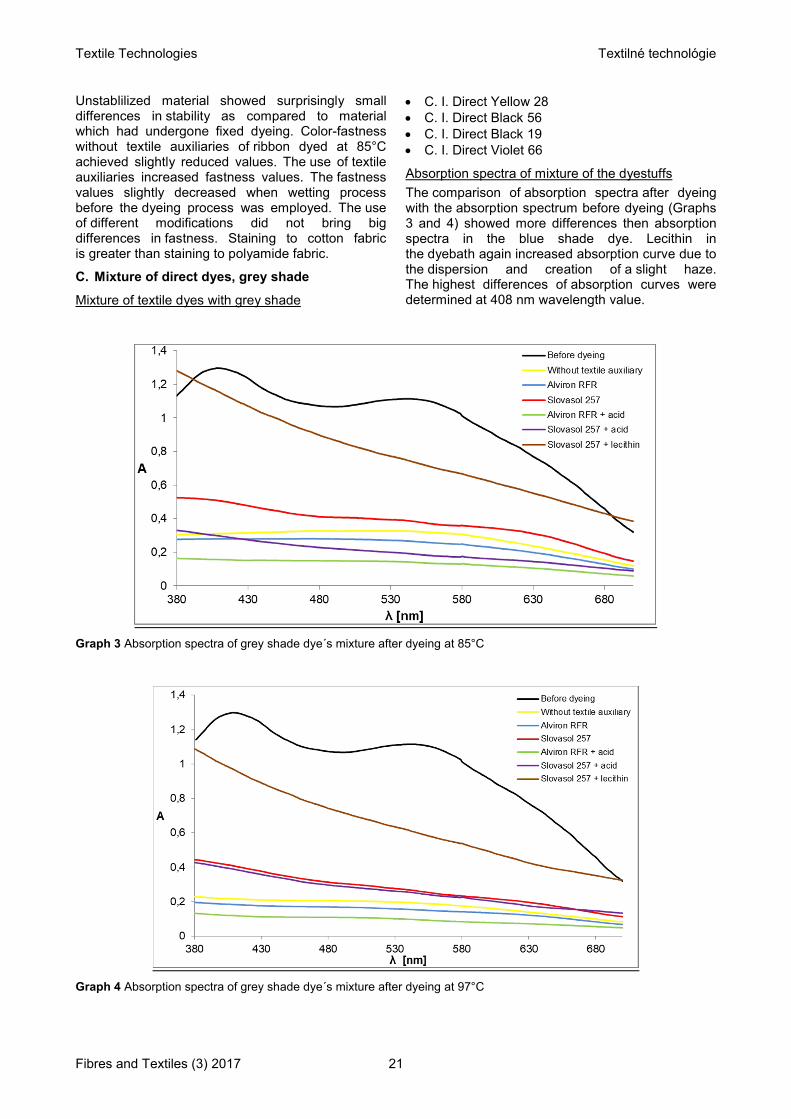
Absorption spectra of mixture of the dyestuffs
The comparison of absorption spectra after dyeing with the absorption spectrum before dyeing (Graphs 3 and 4) showed more differences then absorption spectra in the blue shade dye. Lecithin in the dyebath again increased absorption curve due to the dispersion and creation of a slight haze. The highest differences of absorption curves were determined at 408 nm wavelength value.
Graph 3 Absorption spectra of grey shade dye´s mixture after dyeing at 85°C
Graph 4 Absorption spectra of grey shade dye´s mixture after dyeing at 97°C

Textile Technologies Textilné technológie
Fibres and Textiles (3) 2017 22
Exhaustion of the dye
In dyeing at the lower temperature of 85°C, there was a good exhaustion ratio with maximum value of 87.9% (Table 7).
Table 7 Exhaustion of the dye mixture with grey shade
% of exhaustion, dyeing at 85°C
% of exhaustion, dyeing at 97°C
- wetting - wetting
Without TA 76.0 85.6 83.3 85.0 Alviron RFR 78.0 79.7 85.8 81.6 Slovasol 257 60.8 67.2 68.4 71.3 Alviron RFR + acid 87.9 83.2 90.7 88.9 Slovasol 257 + acid 76.9 85.1 69.8 81.5 Slovasol 257 + acid 33.5 47.4 42.0 49.0
Using a variety of textile auxiliaries in combination with an acidic medium, when compared with dyeing without textile auxiliaries, did not bring a significant improvement. Influence of the wetting material prior to dyeing has no significant influence, either. Use of Alviron RFR with acidic environment achieved better results. Dyeing with combination of Slovasol 257 and lecithin achieved half values of exhaustion compared with other modifications. When dyeing temperature was increased to 97°C, exhaustion of the dye increased, which confirms recommendations for dyeing polyamide and cotton at a temperature close to boiling point. The best values were, again, achieved with the combination Alviron RFR and acidic environment. Acidic environment with Slovasol 257 in the dyeing of the ribbon did not reach a comparable increase in the exhaustion as when using Alviron RFR. Dyeing with lecithin at 97°C achieved better values compared to dyeing at 85°C but was very distant from dyeing with other modifications.
Depth of the dyeing
Using acidic environment again promotes stronger dyeing even at 85°C (Table 8).
Combination of Slovasol 257 and subsequent acidification gives the best value in the dyeing of a wetted material and also high values for dyeing unwetting fabric. In contrast with the values of exhaustion from dyeing bath, the strongest depth of dyeing was achieved by the combination of Slovasol 257 with lecithin.
Table 8 Values of E and depth of dyeing
Dyeing temperature 85°C 97°C E* Avg E* Avg
without wetting process
Alviron RFR 0.35 98.06 1.10 91.46 Slovasol 257 0.93 96.09 1.78 90.37 Alviron RFR + acid 1.47 98.82 1.18 99.23 Slovasol 257 + acid 1.72 103.55 2.13 109.69 Slovasol 257 + lecithin 3.48 121.88 1.04 102.97
with wetting process
Alviron RFR 1.41 90.39 8.85 188.79 Slovasol 257 1.72 100.22 9.63 201.53 Alviron RFR + acid 3.05 117.82 8.85 186.03 Slovasol 257 + acid 4.24 130.39 11.69 236.45 Slovasol 257 + lecithin 1.82 112.13 11.13 235.52
Dyeing at 97° C reached the highest dyeing strength in wetted fabrics using Slovasol 257 during dyeing, namely in combination with subsequent acidification. Comparable values of dyeing at 85°C were obtained using the mixture Slovasol 257 and lecithin.
Dyeing fastness
Difference of fastness between the acidic and alkaline perspiration is not significant (Tables 9, 10), unlike it was in the case of the first type of mixed dye containing acid dye. All dyed materials reached a higher stability. Fixing process, again, did not have a significant impact on the value of individual stability. By increasing the temperature of dyeing, fastness values generally decreased by half a degree. Staining was observed in cotton fabric.
Table 9 Values of fastness in acid and alkaline perspiration, dyeing at 85°C (* S - stabilized; U – unstabilized)
Without TA Alviron RFR Slovasol 257
Alviron RFR + acid
Slovasol 257 + acid
Slovasol 257 + lecithin
S* U* S* U* S* U* S* U* S* U* S* U*
Acidic perspiration
With wetting process Change in the shade 4-5 4-5 4-5 4-5 4-5 4-5 5 5 4-5 4-5 4-5 4-5 Staining to the CO 4-5 5 5 4-5 4-5 4-5 5 5 5 4-5 4-5 4-5 Staining to the PA 4-5 4-5 4-5 4 4-5 4 4-5 4-5 4-5 4 4-5 4-5 Without wetting process Change in the shade 4 4-5 4-5 4 4-5 4-5 5 4-5 4 4 4-5 4-5 Staining to the CO 4-5 4-5 4-5 4-5 5 5 5 4-5 5 4-5 4-5 4-5 Staining to the PA 4 4 4 4 4-5 4-5 4-5 4 4-5 4 4-5 4-5
Alkaline perspiration
With wetting process Change in the shade 5 3 5 4-5 4-5 4-5 4-5 4-5 4-5 4-5 4-5 4-5 Staining to the CO 4-5 3-4 4-5 4 4-5 3-4 4-5 3 4-5 4 4-5 3-4 Staining to the PA 4-5 4 4 4 4-5 4-5 4-5 4 4-5 4-5 4-5 4-5 Without wetting process Change in the shade 5 3-4 4-5 3-4 4-5 4-5 4-5 4-5 3-4 3 4 4 Staining to the CO 4-5 4 4-5 4 4-5 4-5 4 2-3 4-5 3-4 4-5 4 Staining to the PA 4 4 4-5 4-5 4-5 4-5 4 4 4-5 4-5 4-5 4
Textile Technologies Textilné technológie
Fibres and Textiles (3) 2017 23
Table 10 Values of fastness in acid and alkaline perspiration, dyeing at 97°C
Without TA Alviron RFR Slovasol 257
Alviron RFR + acid
Slovasol 257 + acid
Slovasol 257 + lecithin
S* U* S* U* S* U* S* U* S* U* S* U*
Acidic perspiration
With wetting process Change in the shade 4-5 4-5 4-5 4-5 4-5 4-5 4-5 4 4 4 5 4-5 Staining to the CO 4-5 4 5 4 5 5 5 4-5 5 5 5 5 Staining to the PA 4-5 4-5 4-5 4-5 4-5 4-5 4-5 4-5 4-5 4-5 4 4 Without wetting process Change in the shade 5 4-5 3-4 3 5 5 4-5 4-5 4-5 4 4-5 4-5 Staining to the CO 4-5 4-5 5 4 4-5 4-5 5 4-5 5 5 4-5 4-5 Staining to the PA 4-5 4-5 4-5 4 4-5 4-5 4-5 4-5 4-5 4-5 4-5 4-5
Alkaline perspiration
With wetting process Change in the shade 4-5 4-5 5 5 4-5 4-5 4 4 4-5 4 4-5 4-5 Staining to the CO 4-5 4 4-5 3-4 4-5 4 4-5 4 4-5 3-4 4-5 3-4 Staining to the PA 4-5 4 4-5 4 4-5 4 4 4 4 4 4-5 4-5 Without wetting process Change in the shade 5 4-5 4-5 4-5 4-5 4-5 3 3 4 3-4 4-5 4-5 Staining to the CO 4-5 3-4 4-5 4-5 4-5 4-5 4 3-4 5 4-5 4-5 3-4 Staining to the PA 4-5 4 4-5 4-5 4-5 4-5 4 4 4-5 4-5 4-5 4
* S - stabilized; U - unstabilized
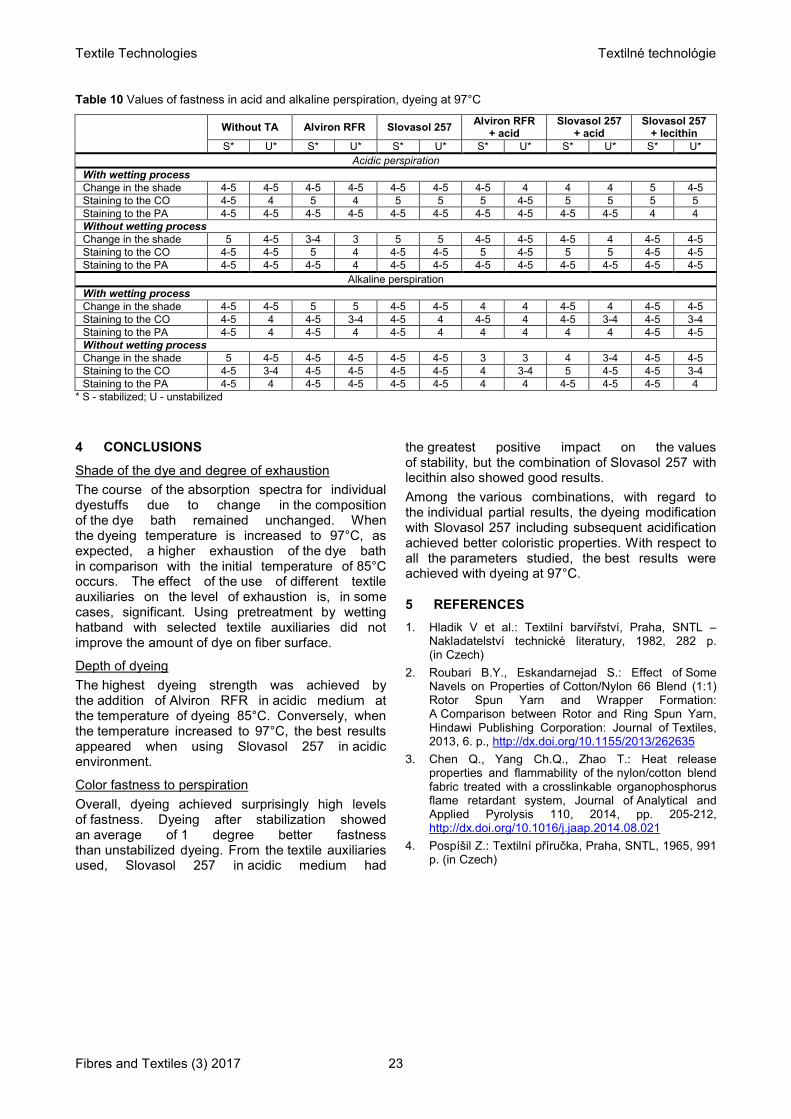
4 CONCLUSIONS
Shade of the dye and degree of exhaustion
The course of the absorption spectra for individual dyestuffs due to change in the composition of the dye bath remained unchanged. When the dyeing temperature is increased to 97°C, as expected, a higher exhaustion of the dye bath in comparison with the initial temperature of 85°C occurs. The effect of the use of different textile auxiliaries on the level of exhaustion is, in some cases, significant. Using pretreatment by wetting hatband with selected textile auxiliaries did not improve the amount of dye on fiber surface.
Depth of dyeing
The highest dyeing strength was achieved by the addition of Alviron RFR in acidic medium at the temperature of dyeing 85°C. Conversely, when the temperature increased to 97°C, the best results appeared when using Slovasol 257 in acidic environment.
Color fastness to perspiration
Overall, dyeing achieved surprisingly high levels of fastness. Dyeing after stabilization showed an average of 1 degree better fastness than unstabilized dyeing. From the textile auxiliaries used, Slovasol 257 in acidic medium had
the greatest positive impact on the values of stability, but the combination of Slovasol 257 with lecithin also showed good results.
Among the various combinations, with regard to the individual partial results, the dyeing modification with Slovasol 257 including subsequent acidification achieved better coloristic properties. With respect to all the parameters studied, the best results were achieved with dyeing at 97°C.
5 REFERENCES
1. Hladik V et al.: Textilní barvířství, Praha, SNTL – Nakladatelství technické literatury, 1982, 282 p. (in Czech)
2. Roubari B.Y., Eskandarnejad S.: Effect of Some Navels on Properties of Cotton/Nylon 66 Blend (1:1) Rotor Spun Yarn and Wrapper Formation: A Comparison between Rotor and Ring Spun Yarn, Hindawi Publishing Corporation: Journal of Textiles, 2013, 6. p., http://dx.doi.org/10.1155/2013/262635
3. Chen Q., Yang Ch.Q., Zhao T.: Heat release properties and flammability of the nylon/cotton blend fabric treated with a crosslinkable organophosphorus flame retardant system, Journal of Analytical and Applied Pyrolysis 110, 2014, pp. 205-212, http://dx.doi.org/10.1016/j.jaap.2014.08.021
4. Pospíšil Z.: Textilní příručka, Praha, SNTL, 1965, 991 p. (in Czech)

Textile Technologies Textilné technológie
Fibres and Textiles (3) 2017 24
SEPARATION OF Cd2+ FROM WATER BY USE OF OXYCELLULOSES AND ACTIVE PULP
Michaela Filipi and Miloslav Milichovský
Institute of Chemistry and Technology of Macromolecular Materials, Faculty of Chemical Technology Studentská 573, 532 10 Pardubice, Czech Republic
[email protected]; [email protected]
Abstract: Natural cellulose and carboxyl celluloses are highly hydrated substances with interesting sorption behaviour. They have the similar chemical composition, but different size of molecules and representation of -COOH groups organized into a complex of supramolecular structure. Separation of Cd
2+
from polluted water by use of oxycellulose (OC) hydrocolloid fibrous form was compared with dissolved carboxyl methylcellulose (CMC). The carboxyl celluloses adsorption capacity of Cd
2+ ions increases with
increasing of –COOH group content and distinctly increases with other competitive ions in the aqueous solution. The dissolved and hydrocolloid fibrous forms of carboxyl celluloses were separated from water by use of pulp fibre in both activated and inactivated form as a scavenger. It was revealed that for factual separation efficiency static (i.e. rheosedimentation) or dynamic (i.e. drainage fiber suspension) conditions of the scavenger application evoking counter character of the separation behavior are most important.
Keywords: oxycellulose, linters, adsorption, rheosedimentation.
1 INTRODUCTION
Properties and interactions of cellulose surfaces and its derivatives are of a great interest for wide variety of applications including paper, textiles, and pharmaceutical products. In many applications the cellulose products are in contact with aqueous solutions or humid environment. In these cases the formation of active groups, e.g. carboxylic groups, determine adsorption phenomena of polymer/solution interface as occurring in sorption filtration and textile production or washing.
The most widely spread separation procedures include filtration working on various spatial levels (common filtration, microfiltration, ultrafiltration, nanofiltration and more and more important sorption filtration) [1].
As known, a hopefully separation filtration process is improved by use of sorption filtration methods for cleaning of polluted water contains of cationactive substances predominantly heavy metals. The treatment of heavy metals is of special concern due to their recalcitrance and persistence in the environment. In recent years, various methods for heavy metal removal from waste water have been extensively studied [2]. Adsorption characteristic of polysaccharides, cellulose and its derivates including oxycellulose in relation to cations, particularly [3] heavy metals, have drawn more attention recently. Distribution of heavy metal depends on the existence of natural sources and human’s activity [4-6]. Heavy metals at trace levels are difficult to metabolise in human body and very harmful; hence, research on the determination
of heavy metals in food and environmental samples are very popular for healthy life of human [7-9].
We have studied the following colloid-sorption methods:
colloid-sorption separation with inactivated fibre /CSS separation/
colloid-sorption separation with activated fibre /ACSS separation/.
The main tested separation component (Sequestrant) was the H-form of oxycellulose (OC) of various compositions in the fibrous form and nano-form and its sequestration effect was compared with carboxyl methylcellulose (CMC). Carboxymethyl cellulose (CMC) is an anionic polysaccharide obtained from the carboxy-methylation of natural cellulose. In contrast to the cellulose, CMC is a kind of hydrophilic polymers which is easily solubilized in water and has excellent water swelling ability [10].
Also sorption capacities of the fibrous oxycellulose were measured. The tested metal was cadmium Cd
2+ in model water containing competitive ions
of calcium and magnesium with pH = 11.5. For separation of the activated and inactivated papermaking pulp fibers from the water suspension two following methods were then utilized.
1.1 Theoretical
Separation with rheosedimentation (CSS)
1. step: chemical reaction with colloidal part of oxycellulose - sorption
Men+
Sequestrant
Sequestrant Men+

Textile Technologies Textilné technológie
Fibres and Textiles (3) 2017 25
2. step: surface flocculation with pulp (F) in active (ACSS) or no-active (CSS) form
Sequestrant Men+ Active pulp
Active pulp +
Sequestrant Men+
3. step: separation contaminated pulp by sedimentation
Active pulp +
Sequestrant Men+ Rheosedimentation
Pulp +
Sequestrant Men+
4. step: deposition bioactive fibre sediment with Me
n+
Separation by drainage of a fibre suspension (CSD)
1. step: chemical reaction with colloidal part – sorption
Men+ Sequestrant Sequestrant Men+
2. step: surface flocculation with pulp (F) in active (ACSS) or no-active (CSS) form
Sequestrant Men+ Active pulp
Active pulp +
Sequestrant Men+
3. step: separation contaminated pulp by its drainage
Active pulp +
Sequestrant Men+ Drainage (D)
Pulp +
Sequestrant Men+
4. step: deposition of bioactive fibre cake with Men+
Rheosedimentation
A control of papermaking process is possible by measurement of strength and bonding properties of pulp fibres. These properties are possible to estimate by rheosedimentation method. This method is based on sedimentation of fibre network [11].
A movement of rheosedimenting fibre network continuum is very well described [12] by general equation of continuity as similar as Smellie and La Mer
[13] used this equation to description
of subsidence of uraniferous phosphate slime. As showed in Figure 1, the observation of a proper rheosedimentation is very simple because rheosedimenting fibre network is characterized by high of this fibre network in cylindrical vessel [14].
Formerly was shown [14] that rheosedimentation is strongly dependent on intensity of pulp beating, i.e., with increasing a degree of beating the rheosedimentation gets slowly, and the standard rheosedimentation velocity can be used for determination of character the beating process. It was found theoretically and proved by experiments that with increasing of pulp beating, the standard velocity of rheosedimentation is decreasing markedly faster for fibrillation than for fibre cutting. Further it was found that the course of the initial velocity of rheosedimentation is different for dried
and never dried pulps, i.e. dried pulp rheosediments at comparable condition more rapidly than never dried pulp. This phenomenon was also depending on the degree of delignification, i.e., on a composition of tested the cellulosic material. The more the pulp was delignified, the deeper the phenomenon.
Figure 1 Schematic presentation the principle of rheosedimentation
2 EXPERIMENTAL
2.1 Separation efficiency
Separation efficiency SE expresses a quantity of metal M
n+, which has been trapped on the fibres
of cellulose suspension. It is given by ratio of sorbed amount of metal M
n+ to total initial amount of metal
Mn+
which has been used in the experiment [15].
p
.rovnp
p
a
c
)cc(100
c
c100SE
(1)
where: SE- separation efficiency [%] crovn - equilibrium concentration of Cd
2+ in model
water after separation process [g/l]; ca - equilibrium concentration of the Cd
2+ sorbed
onto the pulp [g/l); cp - total concentration of the Cd
2+ in model water
[g/l].
The metal tested was cadmium Cd2+
in model water containing competitive ions of calcium and magnesium of pH 11.5.
2.2 Spectrophotometric determination of Cd2+
ions
The concentration of Cd2+
in the supernatant was determined spectrophotometrically with the help of dithizone extract (0.005% solution of dithizone in chloroform) of alkalized supernatant (by use of 10% solution of NaOH with the ratio 1:1) at λ = 515 nm [16]. The same measurements were conducted at this wavelength against the reference solution (solution with chemicals without Cd
2+).

Textile Technologies Textilné technológie
Fibres and Textiles (3) 2017 26
The basic cadmium solution was prepared by dissolution of 0.1 g in CdCl2 and refilling with distilled water up to the 1 litre volume. 1 ml of the solution thus contained 61.32 g Cd.
The amount of ions in the supernatant was then determined by use of spectrophotometry.
2.3 Materials
As native cellulose was used commercial cotton linter. Oxycelluloses OKCEL H-L were prepared by nitroxide-mediated oxidation of linters in Synthesia, Pardubice-Semtin, Czech Republic and pulp is commercial bleached MgBi-sulphite spruce pulp from Biocel Paskov, Czech Republic – see Table 1.
Table 1 The parameters of oxycellulose
Sample DP xGA
[g/g] PDP
xCOOH [%]
XDS [%]
xGA-PAGA
Okcel H-L
284/051/3 35.8 0.455 0.813 17.8 70.842 0.6513
xGA-PAGA (mmol GA-PAGA/g oxycel.)
Carboxymethyl cellulose (CMC) was received from Fisher Scientific.
DS = 0.7
MCMC = 250000
MACMG = 242
MAG = 162
MCOONa = 67
Non-active pulp
Sulphite pulp (air-dry) was defibrated in laboratory pulper for 10 minutes, so that 3% suspensions could be obtained. 30 g of pulp was added into the pulper vessel with 1 litre of distilled water and was left to swell for 2 minutes. Then the pulp suspension was stirred at 600 revolutions.
Parameters of the pulper are: vessel volume 3 liters, vessel height 0.19 m, and internal diameter of the vessel 0.155 m. The mixer is from steel with the diameter 9 cm with three rectangular blades situated vertically in the axis of the vessel. The vessel has 4 spiralled stops on its walls.
Active pulp
A 3% sulphite pulp suspension was cationized by oligomeric cationic component Refaktan K (trade mark of Chemotex, Decin CR, prepared by the reaction between dimethylamine and epichlorhydrine), which was actived by dissolving NaOH in Refaktan K at a mass ratio of Refaktan K: NaOH of 1:0.05. The reaction of cationization was as follows: temperature 50-60°C, reaction time 30 min, pH 7-8, 10% addition of activated Refaktan K calculated upon a.d. pulp [17].
Carboxyl celluloses
Suspensions of oxycellulose were prepared by weighing 1.6 g in 100 ml of the model mixture. 5 mg of carboxyl methylcellulose were added into 500 ml of distilled water.
Colloid-sorption separation by rheosedimentation (CSS separation)
1.6 g carboxyl methylcellulose (CMC) was added into five 250 ml beakers, i.e. the calculated amount of 1% solution CMC (24 ml) was measured out and added 100 ml of the solution of CdCl2 cooled to 15°C in concentrations 0.5, 0.4, 0.3, 0.2 and 0.1 g CdCl2/l. The mixture was stirred by application of a glass stick, left to rest for 30 minutes, then 32.4 ml of activated pulp was added to each beaker and the content was stirred again.
1.6 g oxycellulose was added into five 250 ml beakers, then 100 ml of the solution of CdCl2 in concentrations 0.4, 0.3, 0.2, 0.1 and 0.05 g CdCl2/l were added. The mixture was stirred with the use of a glass stick, left to rest for 30 minutes – sorption took place. The measuring flask was used to add 32.4 ml of activated pulp into each beaker, it was stirred and left to rest for 15 minutes – surface flocculation occurred.
The same experiment as in case of activated pulp was made for the inactivated pulp for concentrations 0.5, 0.45, 0.4, 0.35 and 0.3 g CdCl2/l. Blend experiments without carboxyl celluloses sequestrants were gained by similar way.
After the solution cleared above the rheosedimenting pulp, a pipette was used to gauge an amount of 10 ml of supernatant to determine Cd content by using of (0.005% solution of dithizone in chloroform) spectrophotometric method.
Colloid-sorption separation by drainage of a fibre suspension (CSD separation)
1.6 g CMC was added into five 250 ml beakers, i.e. the calculated amount of 1% solution of CMC (24 ml) was measured out and added. 100 ml of the solution of CdCl2 in concentrations 0.4, 0.3, 0.2, 0.1 and 0.05 g CdCl2/l were added. The mixture was stirred with the use of a glass stick, left to rest for 30 minutes – sequestration, 32.4 ml of activated pulp was added to each beaker and the content was stirred again and left to rest for 15 minutes.
1.6 g oxycellulose was added into five 250 ml beakers, 100 ml of the solution of CdCl2 in concentrations 0.4, 0.3, 0.2, 0.1 and 0.05 g CdCl2/l were added again. The mixture was stirred thoroughly with a glass stick, left to rest for 30 minutes – sorption took place. The measuring flask was used to add 32.4 ml of activated pulp into each beaker, it was mixed and left to rest for extra 15 minutes – surface flocculation occurred.
The same evaluation as in case of activated pulp was made for the inactivated pulp for concentrations

Textile Technologies Textilné technológie
Fibres and Textiles (3) 2017 27
0.5, 0.45, 0.4, 0.35 and 0.3 g CdCl2/l. By similar way took place the blend experiments without carboxyl celluloses sequestrants.
The content of the beaker was filtered through the Büchner funnel without the filter sheet; the filtrate containing remnants of fibres was poured again over the created filter cake on the Büchner funnel. This pouring was always performed 3 times for all samples – the filtrate did not contain any fibres.
Content of Cd2+
in clear filtrate was determined again by use of the spectrophotometric dithizone method.
3 RESULTS AND DISCUSSION
Separation via rheosedimentation process (CSS)
Separation of cadmium from water via sequestration agents OC and CMC with the use of rheosedimenting fibre pulp suspensions in both activated and inactivated forms is illustrated in the Figures 2 and 3.
Figure 2 Dependence of SE versus cp, g Cd
2+/l where SE
and cp are the separation efficiency and the total concentration of the Cd
2+ in model water, respectively
Figure 3 Dependence of SE versus, gSS/gM where SE, gSS and gM are the separation efficiency, the amount of sequestering agent and the amount of Cd
2+,
respectively
Separation via drainage of a fibre suspension (CSD)
A separation of cadmium from water via sequestration agents OC and CMC with the use of separation by drainage of a fibre pulp suspension in both activated and inactivated forms is illustrated in the Figures 4 and 5.
Figure 4 Dependence of SE versus cp, g Cd2+
/l where SE and cp are the separation efficiency and the total concentration of the Cd
2+ in model water, respectively
Figure 5 Dependence of SE versus, gSS/gM where SE, gSS and gM are the separation efficiency, the amount of sequestering agent and the amount of Cd
2+,
respectively
The separation efficiency (SE) expresses the amount of cadmium, which was captured on the pulp fibres by help of sequestering aids CMC and oxycellulose. It is given by the proportion of the captured (absorbed) amount of Cd
2+
in the pulp fibre to the total amount of Cd2+
in the separation mixture. Received results document that logically dependences SE vs. cp have opposite character the dependences SE vs. gSS/gM
(compare Figures 2-3 and Figures 4-5). However, a controversial character of CSS and CSD separation process is important. During CSD process the separation efficiency increases with

Textile Technologies Textilné technológie
Fibres and Textiles (3) 2017 28
increase of Cd2+
ion concentration in model water to the contrary of rheosedimentation CSS process. Moreover, in comparison with CMC, by use of oxycellulose as sequestering aid was achieved better separation efficiency at CSS than the CSD separation process. Reversely, the CSD process is more efficiency for use of CMC as sequestering aid. Further, also the effect of activated and inactivated pulp is manifested here in a great extent. In comparison with active pulp, the inactivated pulp shows better separation effect if it is use at drainage separation process (CSD) than at the rheosedimentation separation process (CSS). Also, the received results reveal significant counter differences in a separation mechanism of both processes. Obviously, an explanation of these counter differences it is necessary to look for on difference in hydrodynamic shear forces during CSS separation process – low shear forces – and during CSD separation process – high shear forces.
It was confirmed that the separation effect of the colloid-fiber form of oxycellulose is high. It was also positive to find out that the colloid-fiber form of oxycellulose has a high affinity to the common ligno-cellulose fibrous material – pulp. This affinity can be further increased by modifying the pulp through introducing oligomer cation-active groups. The result is, unlike the CSS process, an increasing separation effect of the CSD process with an increase in the concentration of cadmium cations, or potentially with a decrease of the dose of SS/M.
Unlike the CSD process, as it can be seen from the Figures 2 - 3, the separation efficiency of the CSS separation decreases with an increasing concentration of Cd
2+, i.e., or it increases with
the growing amount of COOH groups of sequestration agents with regard to the amount of metals in the model water (see Figure 3). It is completely inverse behaviour to CSD separation where, on the contrary, the activated pulp negatively affects the separation efficiency of Cd
2+, especially
in case of OC (see Figures 4 - 5). This confirms a significant colloidal-stability effect of cadmium ions on the agglomeration of hydrocolloids of sequestration agents of the anion-active character, especially OC.
This behaviour can be explained by means of the classical stability theory of colloid systems and their electro-kinetic behaviour. The colloid system of hydrocolloid sequestrants with cadmium and other ions is thus destabilised only by the increasing concentration of cadmium in model water, or more precisely by its hydrated forms. Unlike the CSD separation, virtually no shear forces are applied in rheosedimentation (CSS) separation. This means that the thickness of the adjacent part of the electric double layer of pulps is relatively wide and it probably also includes the protruding oligomer cation-active groups. These then serve to apply during colloid interactions and only the resulting
hydrated surface interface of the fibre characterised with its Zeta potential is applied here. Due to this effect, the Zeta potential of active pulp is positive but drawing closer zero and a negative Zeta potential of oxycellulose colloid-fibres, theirs surface behave as anion-active, is depressed by interaction with Cd
2+ ions. Moreover, taking into account a low
thickness of the diffuse part of the electric double layer given by the high ionic force of model water, the applied electrostatic interactions are only very little. In the case of fully dissolved CMC, these small electrostatic inter-particle forces are practically not applied.
At high-shear hydrodynamic condition of CSD separation is another situation, because the high shear hydrodynamic forces decrease the thickness of the adjacent part of the electric double layer of the hydrated pulp interfaces, expose more active hydrate pulp groups and the oligomer cation-active groups on the pulp are more active. As a result of action the intermolecular and shear hydrodynamic forces, in comparison with oxycellulose colloid-fibres, the hydrated macromolecules of CMC are practically quantitatively captured in drained pulp bed. Obviously, the further intermolecular forces are important beside the classical colloidal forces (see relatively high separation efficiency of non-active pulp in Figure 4). In addition to classical electrostatic forces of electrokinetic character, the hydration forces are predominantly important too [18]. In simple terms, that controversy differentia between drainage (CSD) and rheosedimentation (CSS) separation processes is possible in the raw to characterize as the interactions of more naked (CSD) and more clothed (CSS) hydrated interfaces of mutually interacted subjects, respectively.
4 CONCLUSION
A separation of cadmium ions Cd2+
was performed from the model mixture, which contained both cadmium ions and chemicals for modification of the pH environment, under the presence of activated and inactivated pulp and sequestration agents, i.e. oxycellulose and carboxyl methylcellulose. It was apparent from all evaluated experiments that the separation of Cd
2+ from
polluted water can be made by means of sequestrants and pulp. The efficient component of the fibre suspension (pulp + sequestrant) was the sequestration agent.
Two steps took place in the reaction mixture. First, Cd
2+ reacted with the sequestration agent and
secondly, this one interacts with hydrated interfaces of porous fiber walls of the rheosedimenting or drained pulp fibers functioning as scavengers of the sequestrants. If the sample contained only pulp, the separation effect was small.
However, most important are static (i.e. rheosedimentation) or dynamic (i.e. drainage fiber

Textile Technologies Textilné technológie
Fibres and Textiles (3) 2017 29
suspension) conditions of scavenger application evoking counter character of the separation behavior. A higher separation effect was achieved by rheosedimentation method in the cases where oxycellulose with cation-activated pulp were applied but more effective results were received by application of CMC and cation-activated pulp fiber for the drainage separation method.
Rheosedimentation is in fact a static process, when compared with drainage dynamic process, during which shearing forces revealing the oligomer cation-active groups in micro-interfaces of the activated pulps are not applied. However, they also release the captured hydrocolloid particles from microsurfaces of these fibrous scavengers. That is why a significant colloid behaviour, which is only slightly apparent in case of CSD method, is clearly apparent in the case of the rheosedimentation method (CSS).
5 REFERENCES
1. Milichovský M., Češek Bř., Filipi M., Gojný J.: Cellulosic Sorption Filter Materials with Surface Flocculation Activity-A Hopeful Anticipation of Water Purification, Journal of Water Resource and Protection 6, 2014, pp. 165-176, DOI: 10.4236/jwarp.2014.63022
2. Fenglian F., Wang Q.: Removal of heavy metal ions from wastewaters: A review, Journal of Environmental Management 92, 2011, pp. 407-418, doi:10.1016/j.jenvman.2010.11.011
3. Burke A., Yilmaz E., Hasirci N.: Evaluation of Chitosan as a Potential Medical Iron (III) Ion Adsorbent, Turkish Journal of Medical Sciences 30, 2000, pp. 341-348
4. Sahito S.R., Kazi T.G., Shar G.Q., Mangrio A.M., Shaikh M.S.: Quantification of total and water extractable essential elements in medicinal plants used for stomach problems, Pakistan Journal of Analytical Chemistry 5, 2004, pp. 30-33
5. Sanobari F., Banisaeid S.: Determination of atmospheric particulate matter and heavy metals in air of Tabriz City, Iran, Asian Journal of Chemistry 19, 2007, pp. 4143-4150
6. Mendil D., Tuzen M., Usta C., Soylak M.: Bacillus thuringiensis israelensis immobilizedon Chromosorb 101: a new solid phase extractant for preconcentration of heavy metal ions in environmental samples, Journal of Hazardous Materials 150, 2008, pp. 357-363
7. Armagan F., Soylak M., Elci L. Dogan M.: Solid phase extraction of some metal ions on Diaion HP-20 resin prior to flame atomic absorption spectrometric analysis, Journal of Trace and Microprobe Techniques 20, 2002, pp. 15-27
8. Tuzen M., Citak D., Mendil D., Soylak M.: Arsenic speciation in natural water samples by coprecipitation - hydride generation atomic absorption spectrometry combination, Talanta,78, 2009, pp. 52-56
9. Uluozlu O.D., Tuzen M., Mendil D., Soylak M.: Coprecipitation of trace elements with Ni
2+/2-Nitroso-
1-naphthol-4-sulfonic acid and their determination by
flame atomic absorption spectrometry, Journal of Hazardous Materials 176, 2010, pp. 1032-1037
10. Siritientong T., Aramwit P.: Characteristics of carboxymethyl cellulose/sericin hydrogels and the influence of molecular weight of carboxymethyl cellulose, Macromolecular Research 9, 2015, pp. 861-866
11. Fišerová M., Gigac J., Boháček Š.: Influence of fibre characteristics on rheosedimentation properties of kraft pulp suspension, Wood Research 55(3), 2010, pp. 63-70
12. Milichovský M., Lébr Fr., Joch H.: Dewatering ability of paper pulp Method of evaluation, Papír a celulóza 37, 1982, pp. 7-8
13. Smellie R.H., La Mer V.K.: Floculation, subsidence and filtration of phosphate slimes, Journal of Colloid Science 11, 1956, pp. 720-731
14. Milichovský M., Češek Bř.: Rheosedimentation - a Typical and Characteristic Phenomenon of Paper, Cellulose Chem. and Technology 38, 2004, pp. 385-397
15. Filipi M., Milichovsky M.: Mechanism of Separation of Heavy Metals from Water by Means of Active Filter Plate, IJEIR, 4, 2015, pp. 147-150
16. Malát M.: Absorbtion inorganic photometry, 1st Edition, Academia Prague Czechoslovakia, 1973
17. Milichovský M., Vodeničarová M.: Influence of the Actived Pulp on the Wet-Web Chemistry of Paper Machines, Cellulose Chemistry and Technology 33, 1999, pp. 503-511
18. Češek B., Milichovský M., Gojný J., Bříza D.: Thermo-Responsive Behaviour of Cellulosic Materials, Cellulose Chemistry and Technology 48 (3-4), 2014, pp. 225-236

Textile Technologies Textilné technológie
Fibres and Textiles (3) 2017 30
DEVELOPMENT OF EXPERT SYSTEM BASED ON KANSEI ENGINEERING TO SUPPORT CLOTHING DESIGN PROCESS
Svetlana Kuleshova, Oksana Zakharkevich, Julia Koshevko and Olesya Ditkovska
Khmelnitsky National University, Department of Technology and Design of Garments, Institytska str. 11, 29016 Khmelnitskyi, Ukraine
[email protected]; zbir_vukladaс[email protected]; [email protected]; [email protected]
Abstract: The article presents the development of the concept of operation of the expert system prototype for the selection of clothes according to the consumer’s wishes on the basis of the methodology of Kansei engineering in the shell ‘Rapana’, which ensures the dialogue in the form of successive questions of the system and the user's responses to express consumer’s impressions about the design elements of the garment.
Keywords: Kansei Engineering, expert system, emotional design, semantic differential, fashion dresses.
1 INTRODUCTION
Within the concept of a current policy in the field of quality products and services the need to improve the competitiveness of products is highlighted. This is impossible without further study of customers’ specific, especially their system of clothing perception. Development of design efficiency is based on the study of impressions of garments which provide high aesthetic garments’ quality and increase their attractiveness to consumers.
Time requirements include the mobile edition of various fashionable products [1], fast update range and availability of products that are in demand among the population, that is, now the concept of product development is the unity of functionality and emotion in the best possible design to meet the needs and desires of consumers.
High saturation of information environment and the risk of making wrong decisions increase the relevance of information technology as a means to support decision making. One way to address the informal or weakly formalized problems is the use of artificial intelligence methods and the creation of expert systems (ES).
2 ANALYSIS OF PUBLISHED DATA AND STATING THE PROBLEM
Today, scientists in the world successfully implement elements of artificial intelligence and the ES at various stages of designing clothes: for selection of clothes style according to the constitution features of consumers [2], for the choice of clothes to form a harmonious image of individual consumers [3], to assess the quality of design clothes drawings [4], for the formation of industrial clothing range [5], for the production of flexible reorientation of women's outerwear [6] and
other purposes. However, at this stage the ES operate mainly with digital information that provides performance of the product’s main function: to fit the human body. Some researchers work with problems of achieving the psychological comfort of clothing [7]. While today's main role of defining the functional characteristics of the product is the art of creating and selling impressions, emotions and fun. The paper [8] defines the problem of considering impression for the purposes of product design, demand study for garments [9], assessing the quality of product design [10]. This has led to the emergence of a popular current theory of emotional design.
Research of recent decades indicates active learning in the field of impressions from clothes for problems of models’ design. They show that the percentage of impressions among other factors when choosing clothes is equal to 33%. This significant proportion causes the intensity of the evaluation study on impression of shapes, colours and materials [11] and [12]. Emotional design is extremely versatile trend that originated in Japan just three decades ago. In the 1970s the concept of Kansei Engineering appeared. This derivation used to transmit quality satisfaction from using some object or subject. So, there are objects in which much Kansei, and there are those who have it smaller or even not at all. Kansei Engineering (KE) as a term, eventually transformed into “emotional design”. KE develops methods of implementation of perceptual and emotional qualities into product design. The emotions which are caused by outfits play an important role in enhancing the aesthetic quality of clothing.
Steps of image analysis based on KE are investigated in detail in [13]. This method may be used for any product design, including clothing.
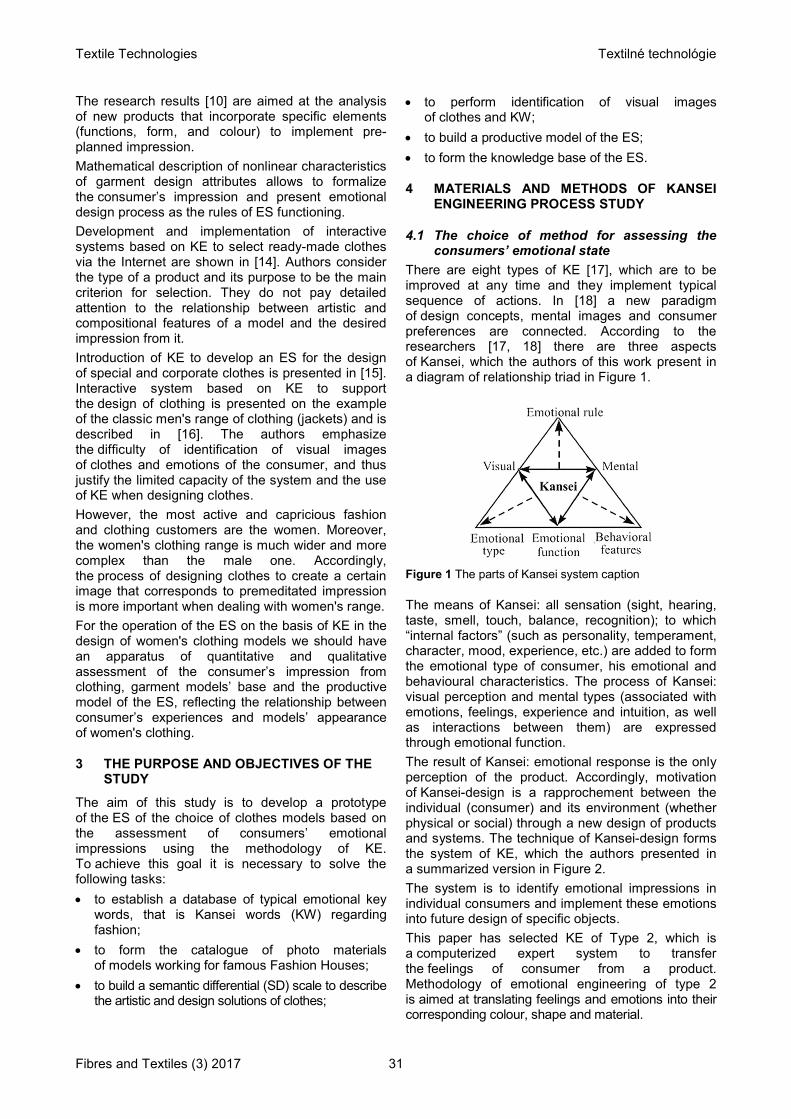
Textile Technologies Textilné technológie
Fibres and Textiles (3) 2017 31
The research results [10] are aimed at the analysis of new products that incorporate specific elements (functions, form, and colour) to implement pre-planned impression.
Mathematical description of nonlinear characteristics of garment design attributes allows to formalize the consumer’s impression and present emotional design process as the rules of ES functioning.
Development and implementation of interactive systems based on KE to select ready-made clothes via the Internet are shown in [14]. Authors consider the type of a product and its purpose to be the main criterion for selection. They do not pay detailed attention to the relationship between artistic and compositional features of a model and the desired impression from it.
Introduction of KE to develop an ES for the design of special and corporate clothes is presented in [15]. Interactive system based on KE to support the design of clothing is presented on the example of the classic men's range of clothing (jackets) and is described in [16]. The authors emphasize the difficulty of identification of visual images of clothes and emotions of the consumer, and thus justify the limited capacity of the system and the use of KE when designing clothes.
However, the most active and capricious fashion and clothing customers are the women. Moreover, the women's clothing range is much wider and more complex than the male one. Accordingly, the process of designing clothes to create a certain image that corresponds to premeditated impression is more important when dealing with women's range.
For the operation of the ES on the basis of KE in the design of women's clothing models we should have an apparatus of quantitative and qualitative assessment of the consumer’s impression from clothing, garment models’ base and the productive model of the ES, reflecting the relationship between consumer’s experiences and models’ appearance of women's clothing.
3 THE PURPOSE AND OBJECTIVES OF THE STUDY
The aim of this study is to develop a prototype of the ES of the choice of clothes models based on the assessment of consumers’ emotional impressions using the methodology of KE. To achieve this goal it is necessary to solve the following tasks:
to establish a database of typical emotional key words, that is Kansei words (KW) regarding fashion;
to form the catalogue of photo materials of models working for famous Fashion Houses;
to build a semantic differential (SD) scale to describe the artistic and design solutions of clothes;
to perform identification of visual images of clothes and KW;
to build a productive model of the ES;
to form the knowledge base of the ES.
4 MATERIALS AND METHODS OF KANSEI ENGINEERING PROCESS STUDY
4.1 The choice of method for assessing the consumers’ emotional state
There are eight types of KE [17], which are to be improved at any time and they implement typical sequence of actions. In [18] a new paradigm of design concepts, mental images and consumer preferences are connected. According to the researchers [17, 18] there are three aspects of Kansei, which the authors of this work present in a diagram of relationship triad in Figure 1.
Figure 1 The parts of Kansei system caption
The means of Kansei: all sensation (sight, hearing, taste, smell, touch, balance, recognition); to which “internal factors” (such as personality, temperament, character, mood, experience, etc.) are added to form the emotional type of consumer, his emotional and behavioural characteristics. The process of Kansei: visual perception and mental types (associated with emotions, feelings, experience and intuition, as well as interactions between them) are expressed through emotional function.
The result of Kansei: emotional response is the only perception of the product. Accordingly, motivation of Kansei-design is a rapprochement between the individual (consumer) and its environment (whether physical or social) through a new design of products and systems. The technique of Kansei-design forms the system of KE, which the authors presented in a summarized version in Figure 2.
The system is to identify emotional impressions in individual consumers and implement these emotions into future design of specific objects.
This paper has selected KE of Type 2, which is a computerized expert system to transfer the feelings of consumer from a product. Methodology of emotional engineering of type 2 is aimed at translating feelings and emotions into their corresponding colour, shape and material.

Textile Technologies Textilné technológie
Fibres and Textiles (3) 2017 32
Figure 2 Generalized system of Kansei Engineering
Typical ES have the following structure: database, knowledge base (KB), the mechanism of withdrawal (solver), subsystem of explanations, user interface [19]. The proposed computer system architecture has three databases (words, images, design and colour), knowledge base, inference engine and consumer’s interface. Database of KW is formed of adjectives that describe the consumer’s feelings from garments. Image Database is a set of photos of clothes. Database of design and colour consists of design attributes and colours that correlate with KW. Knowledge base consists of rules needed to determine the high correlation between product attributes and KW. The main part in the expert system is inference engine – a software mechanism that searches the knowledge base rules for rational logic solutions. The task of consumer’s interface is the exchange of information between the consumer and the machine output.
A key phenomenon upon which the concept of expert systems is built we call synaesthesia. There are many types of synaesthesia: for example, the feeling of tactile forms during wearing clothes, associating shapes, colours and temperament [20]. The project is based on the association of colours perception, textures, and shapes while considering clothes and emotions that arise. Visual impressions and associations, the first feeling, psychological perception of colour in general and the major symbolic significance of these colours, symbolic and communicative sense of form and colour are converted into visual data – hue, brightness, saturation, heat and coldness [21].
The basic method of image analysis in KE is the method of semantic differential in the classification of Kansei attributes [17]. SD is the method of psycholinguistics, which is a combination of scaling procedures and method of controlled associations [20]. This method allows to model semantic space that shows the relationship between the samples of products and meanings of words – adjectives that describe the impression from the products. The ratio between the content and meaning of the image can be represented with the help of a scheme (Figure 3), which is called “logical-semantic triangle” or semantic triad.
Semantic triad is a schematic representation for the notion that every word (in this case the product) has at least 2 types of meanings (denotative and connotative), that is lexical (descriptive) and emotional.
Figure 3 Structure of semantic triad
4.2 Investigated materials and equipment used in the experiment
For the study the material of fashion mega-portal “first VIEW” 22 was used which makes it possible to work with digitized photographs from the whole show collection. The object of the study is the women's fashion dresses in spring-summer 2016 season. Leading selection criteria of photographic material chosen for the study are:
homogeneity of the material; respect to the author's chronological sequence
of models demonstration on the catwalk; technical quality of photos.
The size of samples is 12 most frequently appearing outfits over the investigated period in press releases of designers and Fashion Houses namely Alexander McQueen (UK), Elie Saab (Lebanon), Oscar de la Renta (USA), Roberto Cavalli (Italy), Valentino (Italy), Emanuel Ungaro (France), Jason Wu (USA). The names should match the selection criteria:
the history of the House should have at least 10 years;
House should have been known worldwide and considered a “trendsetter”.
As the object of study is women's dresses, from the collection of hits models by these houses in the period of spring-summer 2016 all models of women's dresses were picked up. Thus, a general collection was formed which amounted to 66 photos of fashion dresses for subsequent questionnaire.
4.3 Stages of Semantic Differential formation of the emotional development of Kansei words
By analogy with [13], the basic process of emotional component research is advisable to present by three stages of formation of SD emotional development of KW for clothes, as shown in Figure 4, in the scheme, developed by the authors.

Textile Technologies Textilné technológie
Fibres and Textiles (3) 2017 33
Figure 4 Semantic differential of the emotional development of Kansei words
Step 1: Research of words that express the emotions of consumers from clothing
(1.1) Collection of KW – typical emotional keywords which reflect physiological impression from any models of clothes – database of KW (Table 1).
(1.2) Sorting out typical keywords into groups and subgroups (Table 2) – new database of KW.
Table 1 Database of typical emotional Kansei key words
No KW No KW No KW No KW
1 Active 51 Intriguing 26 Cozy 76 Regal 2 Aesthetic 52 Laconic 27 Creative 77 Reliable 3 Agreeable 53 Light 28 Decisive 78 Resilient 4 Alive 54 Luxurious 29 Decorative 79 Respectable 5 Alluring 55 Magnificent 30 Deep 80 Restrained 6 Authoritarian 56 Majestic 31 Delicate 81 Rich 7 Authoritative 57 Manly 32 Dreamy 82 Romantic 8 Balanced 58 Mature 33 Dynamic 83 Rough 9 Benevolent 59 Modern 34 Elegant 84 Seductive 10 Blinding 60 Mysterious 35 Emotional 85 Serious 11 Bold 61 Natural 36 Energetic 86 Severe 12 Breakneck 62 Nice 37 Ethnic 87 Sexual 13 Bright 63 Noble 38 Excitable 88 Simple 14 Brilliant 64 Notable 39 Exclusive 89 Smart 15 Calm 65 Official 40 Exquisite 90 Soft 16 Carefree 66 Open 41 Fairy 91 Solemn 17 Charming 67 Organic 42 Fashionable 92 Sophisticated 18 Cheerful 68 Passive 43 Female 93 Spectacular 19 Chic 69 Pleasant 44 Festive 94 Sports 20 Clean 70 Practical 45 Formal 95 Strong 21 Clear 71 Pretty 46 Fresh 96 Sturdy 22 Cold 72 Proportional 47 Functional 97 Stylish 23 Comfortable 73 Provocative 48 Harmonious 98 Tender 24 Conservative 74 Purple 49 Innovative 99 Tonic 25 Costly 75 Rational 50 Inspiring 100 Traditional

Textile Technologies Textilné technológie
Fibres and Textiles (3) 2017 34
Table 2 Grouping of Kansei words (KW)
Clothing style KW (database 1) The base colour KW (database 2)
Classic Respectable, Practical,
Elegant
Red Ruling, Bold, Luxurious Orange Bohemian, Exquisite, Natural Yellow Gullible, Calm, Attractive Green Creative, Elegant, Emancipated Blue Energetic, Businesslike, Luxurious Violet Classic Chic, Spectacular, Luxurious
Achromatic Restrained, Intellectual, Cold Romantic Female, Fine, Exquisite … …
Sports Practical, Functional, Comfortable … … Folk Ethnic, Natural, Ecological … …
Avant-garde Outrageous, Creative, Unusual … …
Step 2: Formation of word pairs that form the semantic differential
(2.1) This process includes the selection of words from a common database of KW with the opposite meaning and interpretation. Each pair of KW is the SD poles for a particular attribute of an investigated fashion model: style, shape, colour, material and so on.
(2.2) Coding of KW pairs. The common practice of coding uses the first letters of words with opposite meaning.
(2.3) Search for positive correlation between each word from the SD (column 2 and 3 of Table 3) with words that express the emotions of consumers from clothing (column 6 and 7 of Table 3).
Step 3: Scaling of semantic differential
(3.1) Collection of photographic material (in this case – models of clothes).
(3.2) Development of assessment of SD scales on each of Kansei attributes.
Bipolar adjectival pairs – simple, economical tools that make it possible to get some data based on a subjective understanding of connotative meanings of words by people. These tools include a few scales put horizontally on a form (questionnaire). Each scale has seven gradations that are expressed numerically (-3, -2, -1, 0, +1, +2, +3) or verbally (hard, medium, low, can, low, medium, hard) (Figure 5).
Table 3 Consolidated results for semantic differential of impressions from clothes
Pair code
КW Meaning Positively correlated to КW 1 КW 2 КW 1 КW 2 КW 1 КW 2
CS Casual Smart practical for special events Comfy
Rational Exquisite Charming
RS Romantic Sports feminine image everyday sportswear Elegant
Exquisite Functional Dynamic
CA Classic Avant-garde typical forms unusual fashion Austere Elegant
Epatage Creative
FM Folk Modern national attire modern styles Ethnic Natural
Voguish Modern
RO Rectangle Oval geometric symbols geometric symbols Practical
Persistent Female Calm
TdTu Trapezoid
(long base down) Trapezoid
(long base up) geometric symbols geometric symbols
Creative Impulsive
Pragmatic Decisive
MP Mono colour
Poly colours
simple colour palettes
elaborate colour palettes
Unvaried Stable
Complex Fantasy
BS Bright Soft pure colours gray hues Solemn Matte LD Light Deep white hues black hues Light Heavy WC Warm Cool golden hues blue hues Cheerful Fresh
MtPt Mono texture Poly texture one texture many textures Classic Elegant
Luxurious Avant-garde
MS Matte texture
Shiny texture
absorb light reflect light Moderate
Simple Smooth Bright
TN Gauzy Opaque freely pass light do not pass light Light
Delicate Sturdy Thin
SA Symmetry Asymmetry equal parts of
garment unequal parts of
garment Static
Balanced Expressive Dynamic

Textile Technologies Textilné technológie
Fibres and Textiles (3) 2017 35
Figure 5 Example of scales of Kansei words of semantic differential for the questionnaire
Figure 6 Example of psychographic profile of an outfit 1
(3.3) Evaluation of photo material by experts using semantic differential scales and processing of survey results.
The expert group consisted of 10 experts and 16 consumers. In a survey photos of clothes were valued using evaluation factors in bipolar scales defined by verbal antonyms of KW from each end of the scale (Figure 5).
Since these evaluations are subjective, as a result of the survey psychographic profile of one dress pattern was constructed (Figure 6). This profile reflects the average amount of evaluation coefficients for each pair of KW.
As shown in Figure 6 psychographic profile of an outfit visually practically does not differ for different groups of experts.
4.4 The method of forming a database of expert system of clothes’ choice based on the assessment of emotional impressions of consumers
Analysis of the emotional component of the garment on the basis of SD can be achieved through cluster analysis. Such an approach will identify models of clothes based on perception and emotional needs of the consumer.
Cluster analysis is a process of multidimensional grouping of objects. In this case it is grouping of clothes depending on the impressions that they cause in consumer.
Using cluster analysis involves the constant action sequences, regardless of the subject of research. Accordingly the sequence in this case is as follows:

Textile Technologies Textilné technológie
Fibres and Textiles (3) 2017 36
sampling selection for cluster – set of female models of light dresses;
determining the set of variables, which will be evaluated in the sample objects – a pair of KW of SD;
calculation of the degree of similarity between the objects;
using cluster analysis method for grouping similar objects;
results validation of cluster solutions.
Cluster analysis can be used only when the following requirements are observed: performance should not correlate with each other, they should be dimensionless, their distribution should be close to normal, they must meet the requirement of ‘stability’, by which we mean no effect on their value random factors; in addition, the samples must be homogeneous and do not contain ‘emissions’.
In order to implement these conditions it is necessary to conduct a preliminary factor analysis. These requirements are automatically met by the procedure of a factorial design. Initial data for factor analysis are the profiles of each of the fashion models, presented as a series of average figures (for all groups of experts) of evaluation ratios.
5 THE RESEARCH RESULTS OF CONSUMER’S EMOTIONAL WORDS
The consistency degree of photo evaluation results by experts using SD scales is confirmed by
concordance coefficients and Pearson criteria. Table 4 presents the consolidated results of the evaluation level coordination of expert opinions of the first five models.
Tabular value of Pearson criterion for 5 percent of the weight level and the corresponding number of freedom degrees (χ
2tabl = 22.36) is less than the
estimated value criterion. Therefore it is possible to state with 95% probability that the frequency of evaluation ratios of KW pairs in different experts is coordinated in accordance with the calculated rate of concordance. Thus, each clothes model can be described with the help of 14 rating pairs of KW.
Factor analysis is conducted using the package PASW Statistics. The analysis results by the method of principal components and using the method of rotation (Varimax rotation with Kaiser normalization) are presented in Table 6 as a matrix of returned components. The choice of such methods of analysis is explained by the fact that only these methods are mathematically justified and can be implemented in software environment.
Factor loadings, presented in the matrix (Table 5), should be understood as correlation coefficients between the variables and factors. In the table factors that indicate a high degree of correlation with the variable component (factor) are highlighted. Software environment PASW Statistics generates a specified value factors used in solving the problem of hierarchical clustering.
Table 4 The consolidated results of the evaluation degree of coordination of expert opinions (fragment)
Number of an outfit
for the expert group 2р for the expert group
consumers (16 people) professionals (10 people) consumers professionals
1 0.898 0.734 186.74 95.42 2 0.896 0.600 186.42 77.37 3 0.953 0.884 198.18 114.92 4 0.892 0.653 185.60 84.92 5 0.922 0.828 179.78 107.65
Table 5 Matrix of the returned components of Kansei words of semantic differential
Code Component
1 2 3 4 5 6
SA 0.801 – – – – – CA 0.742 – – – – –
BS – 0.890 – – – – LD – 0.878 – – – – WC – 0.420 – – – –
CS – – 0.771 – – – MS – – 0.673 – – – RS – – -0.661 – – –
TN – – – -0.832 – – MtPt – – – 0.751 – –
FM – – – – 0.798 – MP – – – – -0.692 –
TdTu – – – – – 0.842 RO – – – – – -0.653

Textile Technologies Textilné technológie
Fibres and Textiles (3) 2017 37
Thus, as the results of the factor analysis, six factors (components) are highlighted, which can combine all pairs of words of SD that reflect consumer’s impressions from clothes. To facilitate communication between the man and the ES, which concept is being developed, for the design of system dialogues names of factors are presented by the most important components of each consistent according to table 6, namely SA, BS, CS, TN, FM, TdTu.
In solving the problem of clustering the original set of clothes’ models is divided into subsets that do not overlap, so that each cluster consisting of fashion models, that is, as close to the metric ρ (Euclidean distance) and clothes’ models from different clusters should differ significantly.
The method of intergroup relations was used for clustering. As a result we obtained a dendrogram (Figure 7), at the hierarchical levels the outfits are located in such a way as to emphasize their mutual relationship considering some analyzed features. In the dendrogram each model is represented by its serial number in the source directory of the photographic images.
As a result of the cluster analysis 25 conventional groups were selected (Table 6). Groups are formed of models with closest bonds that differ less than 20% (as it is evidenced by the mark 5 on the scale of scalable distance in the dendrogram).
As shown in Table 6 in each cluster there are models of different colours that are in separate cells.
This approach allows to detail the search for the desired models in a common database of images.
Figure 7 Dendrogram with using the method of intergroup relations between models of ready-to-wear women's clothing
Table 6 Belonging of clothes’ models to clusters (Cl)
Cl Colour Red Orange Yellow Green Blue Violet White Gray Black Poly
1 1 - - - - - - - - - 2 - - - - - - - - - 65 3 - - - - - - - - 51, 57 - 4 - - - - - - - - 40, 62 - 5 - - 5 - - - 41 - - - 6 - - - - - - - - - 36, 58 7 - - - - - - - - - 35 8 - - - 43 - - - - - 14, 26, 46, 59 9 - - - - - - - 50 - -
10 - - - 18 - - - - 8, 9, 10 52, 56 11 - - - - - - - - - 27, 29 12 - - - - - 3 - 22 - 33, 42 13 - - - - - - - - - 61 14 31, 13 - - - - - 60 - - 32 15 - 60 53 - - - 15 - - - 16 - - - - - - - - - 37, 38, 16, 66 17 - - - - - - 7 17 - - 18 - - - - - - - - - 28 19 - 23 - - - - 19 - - - 20 - - - - - - - - - 34 21 - - - - - - - - - 11, 12, 21, 47, 55 22 - - - - - - - - - 49, 63 23 4, 39 54 - - - - - - - 30, 45 24 - - - - - - - - - 24, 48 25 - - - - - - - - - 2, 25, 44

Textile Technologies Textilné technológie
Fibres and Textiles (3) 2017 38
6 DISCUSSION OF RESEARCH RESUTS AND THE PROSPECTS OF KANSEI ENGINEERING
According to the results of factorial and cluster analysis we may form a productive ES models for choosing clothes considering the wishes (opinions) of a consumer. ES model of production presupposes knowledge of the relationship between the concepts. The relationship between the concepts is presented in the form of ordered sequences Cli = (f1i, f2i, f3i, f4i, f5i, f6i) and M = (Cli, colour), where i is a model number.
In order to determine the factors that have a high degree of influence in clusters, cluster analysis is performed with k-mediums, the results of which are presented in Table 7, where the final cluster centres are sorted according to the figure of the first factor.
Table 7 Interpretation of clusters
Cluster Factor
f1 f2 f3 f4 f5 f6
8 -1 -1 0 0 -1 1 15 -1 -1 0 -1 1 1 19 -1 -1 1 0 1 0 20 -1 0 0 -1 -3 -1 25 -1 0 0 -1 -1 1 10 -1 1 0 1 0 1 5 0 -1 -1 -1 1 0
14 0 -1 0 1 1 -1 13 0 -1 2 -1 1 1 1 0 0 -2 1 0 1
17 0 0 1 1 1 1 21 0 0 1 1 0 -1 18 0 0 2 -2 -1 1 11 0 1 1 0 -3 1 12 0 1 -1 -1 0 0 3 0 2 0 -1 1 -1 4 0 2 1 -1 1 0
24 1 -1 1 0 -1 -1 6 1 0 -2 1 0 -1
23 1 0 0 -1 0 -1 7 2 -1 -2 -1 0 0
16 2 0 -1 0 0 0 22 2 0 2 -1 0 2 9 2 1 2 0 0 1 2 3 -1 0 0 1 0
Figure 8 presents quantitative relations between clusters that are already available in a database of ES which is being developed. An analysis of Table 7 revealed that in the database following important factors are not available: f1 = -3; -2, f2 = -3; -2; 3, f3 = -3; 3, f4 = -3; 2; 3, f5 = -2, 2, 3, f6 = -3; -2; 3. Therefore, the rules of the ES should consider the
above mentioned fact as the answer to lack of response in the system of clothes’ models that match specific emotions. However, the database is open, and thus can be updated during the usage.
Figure 8 Coordination of observations in clusters
The easiest way of the ES development is to use “empty” shell, which corresponds by its purpose and structure to the conceptual model (or other model) of objective environment which is the subject to review. To develop a prototype of ES for subtasks of choosing ready-made garments based on the methodology of KE, which in appearance corresponds to the wishes of the consumer, in this paper we selected “empty” shell of ES called “Rapana”, which is distributed free of charge via the web-site [24] and is able to solve the problem of different industries.
Complex “Rapana” includes two components: “Cognitograph” (software for the developers of knowledge base of the ES) and “Expert” (application for users). Using “Expert” does not require special training, because dialogue is conducted by natural language. According to the above outlined research results, seven entities must be entered in shell. The figures for these entities must be determined by the consumer in the form of answers to the questions of the system: SA, BS, CS, TN, FM, TdTu and 1c (colour). For making a decision two entities are necessary, their figures are determined immediately by ES regulations: Cl (cluster) and M (model). Example of dialogues of the developed ES, which represent consumer’s answers to the system’s questions and explanations of dialogue results are shown in Figure 9.
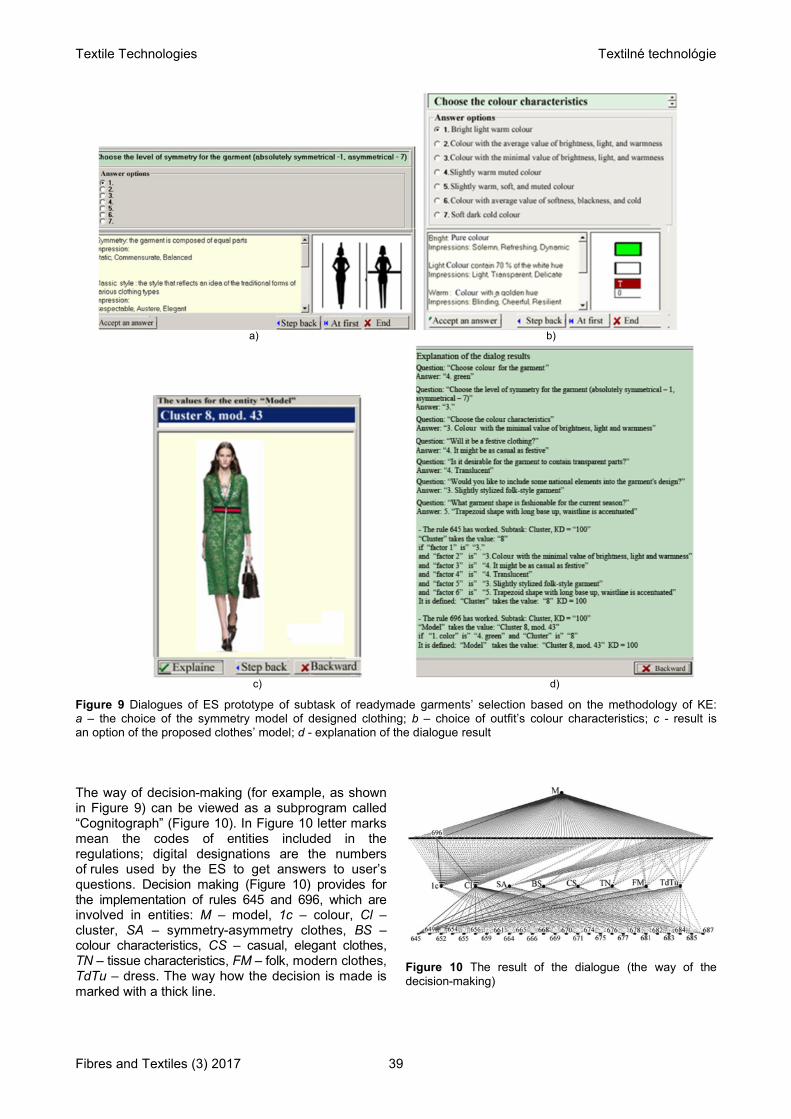
Textile Technologies Textilné technológie
Fibres and Textiles (3) 2017 39
a) b)
c) d)
Figure 9 Dialogues of ES prototype of subtask of readymade garments’ selection based on the methodology of KE: a – the choice of the symmetry model of designed clothing; b – choice of outfit’s colour characteristics; c - result is an option of the proposed clothes’ model; d - explanation of the dialogue result
The way of decision-making (for example, as shown in Figure 9) can be viewed as a subprogram called “Cognitograph” (Figure 10). In Figure 10 letter marks mean the codes of entities included in the regulations; digital designations are the numbers of rules used by the ES to get answers to user’s questions. Decision making (Figure 10) provides for the implementation of rules 645 and 696, which are involved in entities: M – model, 1c – colour, Cl – cluster, SA – symmetry-asymmetry clothes, BS – colour characteristics, CS – casual, elegant clothes, TN – tissue characteristics, FM – folk, modern clothes, TdTu – dress. The way how the decision is made is marked with a thick line.
Figure 10 The result of the dialogue (the way of the decision-making)
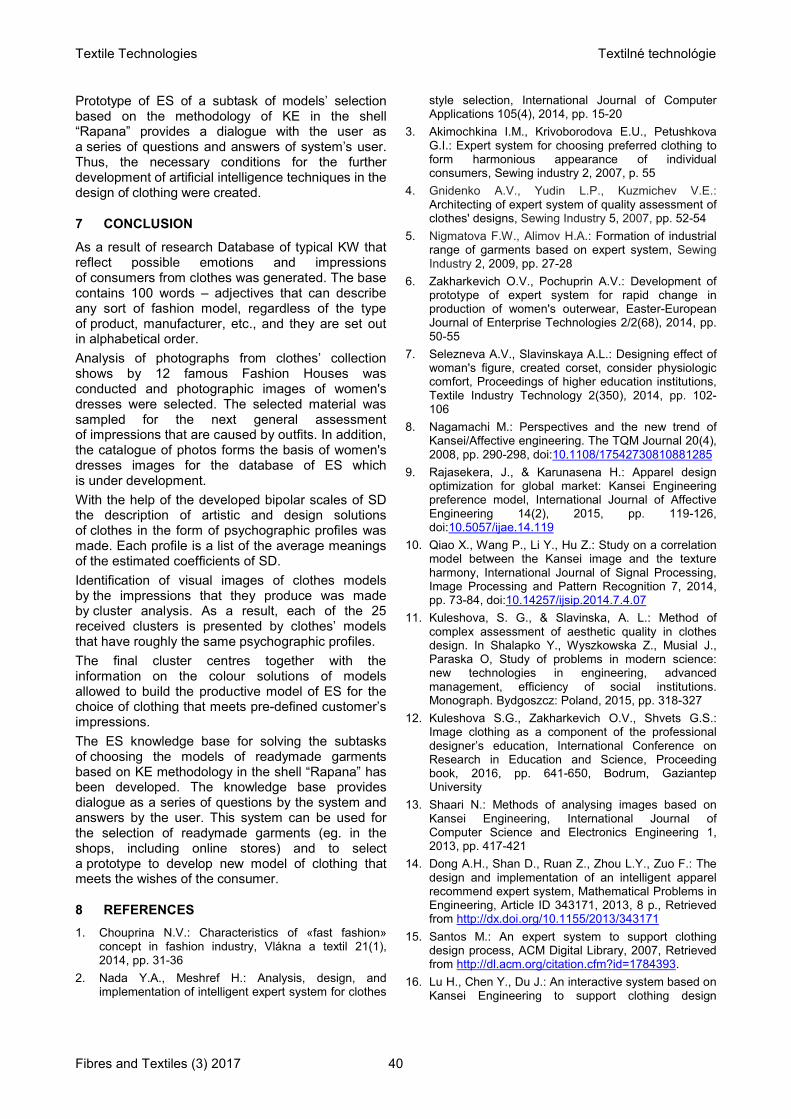
Textile Technologies Textilné technológie
Fibres and Textiles (3) 2017 40
Prototype of ES of a subtask of models’ selection based on the methodology of KE in the shell “Rapana” provides a dialogue with the user as a series of questions and answers of system’s user. Thus, the necessary conditions for the further development of artificial intelligence techniques in the design of clothing were created.
7 CONCLUSION
As a result of research Database of typical KW that reflect possible emotions and impressions of consumers from clothes was generated. The base contains 100 words – adjectives that can describe any sort of fashion model, regardless of the type of product, manufacturer, etc., and they are set out in alphabetical order.
Analysis of photographs from clothes’ collection shows by 12 famous Fashion Houses was conducted and photographic images of women's dresses were selected. The selected material was sampled for the next general assessment of impressions that are caused by outfits. In addition, the catalogue of photos forms the basis of women's dresses images for the database of ES which is under development.
With the help of the developed bipolar scales of SD the description of artistic and design solutions of clothes in the form of psychographic profiles was made. Each profile is a list of the average meanings of the estimated coefficients of SD.
Identification of visual images of clothes models by the impressions that they produce was made by cluster analysis. As a result, each of the 25 received clusters is presented by clothes’ models that have roughly the same psychographic profiles.
The final cluster centres together with the information on the colour solutions of models allowed to build the productive model of ES for the choice of clothing that meets pre-defined customer’s impressions.
The ES knowledge base for solving the subtasks of choosing the models of readymade garments based on KE methodology in the shell “Rapana” has been developed. The knowledge base provides dialogue as a series of questions by the system and answers by the user. This system can be used for the selection of readymade garments (eg. in the shops, including online stores) and to select a prototype to develop new model of clothing that meets the wishes of the consumer.
8 REFERENCES
1. Chouprina N.V.: Characteristics of «fast fashion» concept in fashion industry, Vlákna a textil 21(1), 2014, pp. 31-36
2. Nada Y.A., Meshref H.: Analysis, design, and implementation of intelligent expert system for clothes
style selection, International Journal of Computer Applications 105(4), 2014, pp. 15-20
3. Akimochkina I.M., Krivoborodova E.U., Petushkova G.I.: Expert system for choosing preferred clothing to form harmonious appearance of individual consumers, Sewing industry 2, 2007, p. 55
4. Gnidenko A.V., Yudin L.P., Kuzmichev V.E.: Architecting of expert system of quality assessment of clothes' designs, Sewing Industry 5, 2007, pp. 52-54
5. Nigmatova F.W., Alimov H.A.: Formation of industrial range of garments based on expert system, Sewing Industry 2, 2009, pp. 27-28
6. Zakharkevich O.V., Pochuprin A.V.: Development of prototype of expert system for rapid change in production of women's outerwear, Easter-European Journal of Enterprise Technologies 2/2(68), 2014, pp. 50-55
7. Selezneva A.V., Slavinskaya A.L.: Designing effect of woman's figure, created corset, consider physiologic comfort, Proceedings of higher education institutions, Textile Industry Technology 2(350), 2014, pp. 102-106
8. Nagamachi M.: Perspectives and the new trend of Kansei/Affective engineering. The TQM Journal 20(4), 2008, pp. 290-298, doi:10.1108/17542730810881285
9. Rajasekera, J., & Karunasena H.: Apparel design optimization for global market: Kansei Engineering preference model, International Journal of Affective Engineering 14(2), 2015, pp. 119-126, doi:10.5057/ijae.14.119
10. Qiao X., Wang P., Li Y., Hu Z.: Study on a correlation model between the Kansei image and the texture harmony, International Journal of Signal Processing, Image Processing and Pattern Recognition 7, 2014, pp. 73-84, doi:10.14257/ijsip.2014.7.4.07
11. Kuleshova, S. G., & Slavinska, A. L.: Method of complex assessment of aesthetic quality in clothes design. In Shalapko Y., Wyszkowska Z., Musial J., Paraska O, Study of problems in modern science: new technologies in engineering, advanced management, efficiency of social institutions. Monograph. Bydgoszcz: Poland, 2015, pp. 318-327
12. Kuleshova S.G., Zakharkevich O.V., Shvets G.S.: Image clothing as a component of the professional designer’s education, International Conference on Research in Education and Science, Proceeding book, 2016, pp. 641-650, Bodrum, Gaziantep University
13. Shaari N.: Methods of analysing images based on Kansei Engineering, International Journal of Computer Science and Electronics Engineering 1, 2013, pp. 417-421
14. Dong A.H., Shan D., Ruan Z., Zhou L.Y., Zuo F.: The design and implementation of an intelligent apparel recommend expert system, Mathematical Problems in Engineering, Article ID 343171, 2013, 8 p., Retrieved from http://dx.doi.org/10.1155/2013/343171
15. Santos M.: An expert system to support clothing design process, ACM Digital Library, 2007, Retrieved from http://dl.acm.org/citation.cfm?id=1784393.
16. Lu H., Chen Y., Du J.: An interactive system based on Kansei Engineering to support clothing design

Textile Technologies Textilné technológie
Fibres and Textiles (3) 2017 41
process, Research Journal of Applied Sciences, Engineering and Technology 6, 2013, pp. 4531-4535
17. Nagamachi M.: Kansei / Affective Engineering, Taylor & Francis Group, 2011
18. Schutte S.: Engineering emotional values in product design. Kansei Engineering in development, Linkoping University Institute of technology, 2005
19. Gavrilova T.A., Khoroshevskiy V.F.: Knowledge Bases of Intelligent Systems, St. Petersburg: Peter, 2000
20. Osgood C.E.: Method and Theory in Experimental Psychology, Hardcover: Import, 1968
21. Kuleshova S.G.: Color in the art of designing clothes: study guide, Khmelnytskyi: KhNU, 2016
22. First VIEW. Available at: http://www.firstview.com/
23. IBM SPSS Statistics – Essentials for Pyton 24.0 [Windows XP]. Retrieved from https://www.ibm.com/us-en/marketplace/statistical-analysis-and-reporting
24. Expert system “Rapana”. Retrieved 11. 16. 2016 Available at: http://esrapana.narod.ru/

The 21st International Conference STRUTEX 2016
Fibres and Textiles (3) 2017 42
USE OF REINFORCING FABRIC FOR PREPARATION OF MORE RESISTANCE ION EXCHANGE MEMBRANE
Eliška Stránská and David Neděla
MemBrain s.r.o., Pod Vinici 87, 471 27 Straz pod Ralskem, Czech Republic
Abstract: Mechanical characteristics are one of the important properties of ion exchange membranes. These parameters are required for next operation and for an application in an electrodialysis (as tightness of stack). The most important properties of fabric in this application are thickness (diameter of used fibers), free area related to warp and weft, mechanical strength, material and of course price. Between less relevant parameters of a reinforcing fabric belong a type of fabric (monofilament or multifilament), a type of bond (plain or twill weave, a knit), shrinkage and for example purity. As a reinforcing fabric in ion exchange membranes can be used a weave fabric, a knit or a nonwoven fabric. Ion exchange membranes have different parameters which are connected with parameters of a reinforcing fabric. The goal of this article is comparison of influence of different reinforcing fabric on the properties of ion exchange membranes. Electrochemical, physical and mechanical properties of ion exchange membranes compared to different reinforcing fabric were studied.
Keywords: Reinforcing fabric, ion exchange membrane, weave fabric, knit, nonwoven fabric.
1 INTRODUCTION
Coated fabrics used since the 18th century, when
the fabric was soaked in linseed oil for the production of waterproof cloth. Since then coated fabrics started to use extensively for a variety of applications and created composite materials. The most widely used fabric coated on one or both sides of a polymer. Properties of the resulting layers are dependent on many parameters, such as the types of bonding fabric, the fiber density in the fabric sett or orientation. Other important parameters fabrics are:
good mechanical properties (elongation, modulus, strength),
fiber type, dimensional stability, adhesion, absorption of the polymer matrix
and textile, temperature resistance, the homogeneity of the fabric [4, 10].
Due to the parameters of fibers, material or a type of bond on the resulting properties of textiles is covered by many authors [2, 6, 8, 11, 12].
Heterogeneous ion exchange membranes are also layered systems. They contain a polymer matrix having ion exchange function groups which are reinforced with the reinforcing fabric. Ion exchange membranes (IEMs) are separation membranes which separate cations and anions form solution if electric field is applied. Thanks to the fact that the IEM contains fixed ionic functional groups free counter-ions can be transported through IEMs but transport of co-ions is limited [7]. Figure 1 shows the scheme and simple principle of IEMs. An IEM can be anion exchange membrane (AEM) or cation exchange membrane (CEM) depending on the counter-ion which can be transported through IEM.
Figure 1 Scheme of IEMs

The 21st International Conference STRUTEX 2016
Fibres and Textiles (3) 2017 43
IEMs are used for electrodialysis (ED), electrodeionization (EDI), membrane electrolysis, electrophoresis (EF) or in power sources as fuel cells [1, 7, 9]. IEMs are the most frequently utilized in desalination of brackish and surface water, purification of waste water, water desalination after tertiary biological treatment, purification of organic substances, stabilization of wine, demineralization of whey, separation of inorganic and organic solutions, purification of organic substances.
The goal of this article is comparison of influence of different reinforcing fabric on the properties of ion exchange membranes. Electrochemical, physical and mechanical properties of ion exchange membranes compared to different reinforcing fabric were studied. For a characterization of IEMs were chosen six type of IEMs with the nonwoven fabric, the monofilament knit, the multifilament knit, the monofilament weave fabric, the multifilament
weave fabric and for comparison non-reinforcing IEMs.
2 EXPERIMENTAL
2.1 Materials
IEMs preparation and used materials were described in the literature [13]. Five kinds of reinforcing fabrics were used; Ulester, Uzel, Zora, Wora (Silk & Progress) and Novolin (Polytex). Their properties are described in the Table 1 and Figure 2.
Zora and Wora are the knits, Ulester and Uzel are the woven fabrics and Novolin is a nonwoven fabric. The structure of individual reinforcing fabrics is shown in the scans from scanning electron microscope (SEM), Figure 3. Observe and reverse side of knit Wora is presented on the SEM scans.
Table 1 Properties of used reinforcing fabrics
Reinforcing fabric
Material Thickness
[μm] Warp/weft1
[1/cm] Free area
[%] Shrinkage2
[%]
Ultimate force3
[N]
Ultimate strain3
[%] Threads
Zora PES 180 11,5/28,0 59,0 2,5 124/78 31/73 multifilament Wora PAD 180 11,5/22,5 74,0 8,0 120/37 27/97 monofilament
Ulester PES 100 32,0/35,0 66,8 0,1 220/238 28/28 monofilament Uzel PES 80 40,0/43,0 28,1 0,9 280/260 35/35 multifilament
Novolin PP 100 - 110 - not determined 3,6 15/24 97/80 -
1Number of yarns of reinforcing fabric applied to 1 centimetre, 2Shrinkage was determined at 160°C for all fabrics except to Novolin PP than temperature was only 120°C, 3Ultimate strain and force in warp/weft direction (MD/TD).
Figure 2 Tensile curves for the reinforcing fabrics (warp and weft direction, MD/TD)

The 21st International Conference STRUTEX 2016
Fibres and Textiles (3) 2017 44
Figure 3 SEM for reinforcing fabric; A) obverse side of Zora, B) obverse and C) reverse side of Wora, D) nonwoven fabric Novolin, E) Uzel and F) Ulester 32S
2.2 Methods
Electrochemical, physical and mechanical properties of ion exchange membranes compared to different reinforcing fabric were studied. Measurements of permselectivity, specific and areal resistivity, relative water content with other physical properties (relative change of thickness, length and width after swelling in demineralized water) are published in the literature [13]. Mechanical properties are described in the [14].
2.2.1 Relative water content and other physical properties
The relative water content and other physical properties such as relative change of thickness, length and width after swelling in demineralized water were determined in the following way. IEMs were dried in an oven at 75°C to constant weight and weighed in the dry form. Length, width and thickness were determined. Subsequently IEMs were swelled in demineralized water at room temperature for 24 h and dabbed with a filter paper to remove excess water. The weight, length, width and thickness of IEMs in the wet form were measured. Then physical properties were determined using this formula [3]:
%100statedry
statedrystatewetpropertiesphysical
(1)
2.2.2 Specific resistance
IEMs for measurement of resistance had to be swollen in demineralized water at room temperature. The next operation was the same as in the IEC measurement (membranes’ conditioning). IEMs were equilibrated in 0.5 M NaCl for 24 h. Electric
resistance was measured in 0.5 M NaCl solution at room temperature in a special experimental cell using a compensation method. The experimental cell consisted from two parts separated from each other. The appropriate solution was mixed in experimental cell. Electric resistance was measured between reference electrodes and then the direct current was applied between platinum electrodes. Electric resistance was determined by two measurements of potential difference. The first measurement was performed without the IEM (only solution) and the second with the IEM between the two parts [1, 5]. The active area of IEM was 0.785 cm
-2.
2.2.3 Permselectivity
Permselectivity of IEMs was determined by Henderson’s method in the same measuring cell as electric resistance but with the following KCl solution pair 0.1 - 0.5 M in separated part and without applied direct current. IEMs were equilibrated in 0.5 M KCl for 24 h before the measurement [3].
2.2.4 Mechanical properties
Mechanical properties of membrane specimens were measured with samples of dimensions of 25×50 mm (clamping length) according to the ČSN EN ISO 527-3 standard using an H5K-T (Tinius Olsen) tensile testing machine with a speed of 5 mm.min
−1. Ultimate force and ultimate strain
were determined. Before measurement CEMs are swollen in demineralized water for 24 h.
2.2.5 Morphology
The morphology of the membrane surface was investigated using a FEI Quanta 250 FEG scanning electron microscope. The conditions for

The 21st International Conference STRUTEX 2016
Fibres and Textiles (3) 2017 45
measurement on SEM were 5 kV voltage, high vacuum (4.5x10
-3 Pa pressure) and ETD (Everhart
Thornley detector) or in low vacuum (40 Pa) with LFD (large field detector) for secondary electrons. Samples of reinforcing fabrics were sputtered by 10 nm thick layer of chromium before measurement by the Quorum Technologies Q150T S/E/ES. The second microscope was chosen optical microscope Intracomicro.
3 RESULTS AND DISCUSSION
The thickness, free area of reinforcing fabric and the stability bond are the most important technical parameters which fabric has to fulfill. Minimum thickness of prepared IEM is treble of used reinforcing fabric. So the thinner the reinforcing fabric and the smaller is the resulting IEM. Bigger value of free area ensures the lower resistance of IEM but this must not be at the expense of stability bond. Stability bond is important for manufacture of IEM. During lamination of reinforcing fabric to IEM must not lead to deformation of the fabric, for example narrowing. Other parameters which play the role in manufacture of IEM are mechanical durability, the material of the fabric, diameter and the type of threads, the type of bond, temperature and chemical stability or the purity of the fabric.
Electrochemical and physical properties of CEMs are published in the Table 2. Permselectivity is higher than 90% that is important for the best function of IEMs. Permselectivity is parameter of CEMs which indicates the number of counter ions transferred across CEMs to co-ions. Counter ions have the same polarity as the function groups in the IEMs and co-ions have the opposite polarity than the function group. Ideally the permselectivity is equal 100%. So used reinforcing fabric has the influence, positive impact, on the permselectivity of CEMs. Reinforcing fabric disallows the polymeric materials absorb so much demineralized water and the structure of CEMs is more compact. Any holes and cracks do not create which cause the decrease of permselectivity.
CEM Novolin has the biggest value of specific and areal resistance. Non-reinforcing CEM and CEM
Uzel show low values of areal resistance but thickness of these CEMs is relatively small so the specific resistance which is not dependent on the thickness is higher than for other CEMs. The lowest resistance has CEM Ulester. Resistance of CEMs is dependent on many parameters of reinforcing fabric. For example is open area or thickness of fabric. The woven fabric Uzel has the smallest value of open area and in the opposite side is the knit Wora but CEMs with these fabrics do not have significantly different electrochemical properties.
The type of reinforcing fabric has the influence on the relative change of thickness, length and width and relative water content. Relative water content for reinforcing CEMs is about 50-55% but non-reinforcing CEM swells by more than 20%. CEMs with woven fabrics and knits have the bigger relative change of thickness after swelling compared to relative change of length and width. For non-reinforcing CEM and CEM Novolin applies the reverse trend. Stable physical properties of IEMs are very important for used of IEMs in a specific electrodialysis application. Due to the high dimensional changes of IEMs may be reduced tightness of ED unit, be plugged inlets of solution which in turn may cause stop of electrodialysis process.
Tensile curves for CEMs are in the Figure 4. Non-reinforcing CEMs have very low mechanical strength, but it is not problem to protract their structure. This is due to the fact that in the structure any reinforcing fabric is not present which causes increase of mechanical strength and it does not allow so high elongation of polymeric structure.
High value of elongation is not so important for final use of CEMs. Using the nonwoven fabric Novolin is not improved mechanical strength, moreover CEMs Novolin has a lower percentage elongation than non-reinforcing CEMs. The knits have distinctly bigger value of elongation and lower value of strength in the weft direction than in the warp direction that it is due to manufacture of the knit. These trends are same for CEM Zora and CEM Wora.
Table 2 Properties of six types of CEMs
IEMs Thickness of wet CEM
[μm]
Relative change of Relative water
content [%]
Areal resistance
[Ω.cm2]
Specific resistance
[Ω.cm]
Permselectivity [%]
thickness [%]
length [%]
width [%]
CEM non-reinforcing
370 27.3 17.5 12.2 72.0 4.24 113.7 90.0
CEM Zora 534 58.4 2.5 4.0 51.3 5.10 95.5 95.0 CEM Wora 468 44.4 5.0 3.0 54.2 4.53 96.8 94.9
CEM Ulester 497 56.9 2.0 2.9 53.5 4.45 89.6 94.4 CEM Uzel 407 56.4 1.0 3.0 49.9 4.81 118.2 93.8
CEM Novolin 438 38.4 11.1 11.6 51.7 8.48 193.6 90.6

The 21st International Conference STRUTEX 2016
Fibres and Textiles (3) 2017 46
Figure 4 Tensile curves for CEMs (warp and weft direction, MD/TD)
The woven fabrics Ulester and Uzel have the similar value of elongation and ultimate force in both direction and the same trend applies for CEMs. CEM Ulester has the biggest value of ultimate force and the lowest value of elongation. Using woven fabrics or knits improves mechanical strength and durability. These parameters are important for next application of CEMs in electrodialysis process.
The quality of lamination incorporating the fabric into the polymer binder is so important for application
of IEMs in the electrodialysis. The quality of lamination shows Figure 5. Only binding points are evident on the surface of CEM Ulester but other CEMs with Uzel, Zora or Novolin have worse quality of lamination. For CEM Zora and Uzel this is due to the fact that the reinforcing fabrics are composed of multifilament. For CEM Novolin it is caused by heterogeneity of fibers in the structure of non-woven fabrics. Thickness of Novolin is not constant and moving around 100-110 μm.
Figure 5 Quality of lamination of CEMs; A) CEM Ulester, B) CEM Novolin, C) CEM Uzel and D) CM Zora

The 21st International Conference STRUTEX 2016
Fibres and Textiles (3) 2017 47
4 CONCLUSIONS
As a reinforcing fabric in CEMs were used two woven fabrics Ulester and Uzel, two knits Zora a Wora and the nonwoven fabric Novolin. CEMs have different parameters which are connected with parameters of the reinforcing fabric. The goal of this article was compared to electrochemical, physical and mechanical properties of CEMs with different reinforcing fabric.
Non-reinforcing CEMs have lower mechanical strength, but the best elongation. These CEMs have big relative dimension change after swelling in demineralized water. Areal resistance of these CEMs is the best.
Nonwoven fabric causes decrease of dimension change but mechanical durability of CEMs is still lower.
CEMs with woven fabrics and knits have good mechanical durability, lower swelling dimension changes. But using the fabric increase the areal resistance which has influence on the flow solution in the electrodialysis stack.
The cheapest variant of CEMs is CEM with non-woven fabric or do not used any reinforcing fabric because non-woven fabric increases resistance and mechanical strength is still low.
In terms of quality of lamination and other electrochemical, physical and mechanical parameters is the best CEM Ulester after comparison with other CEMs.
ACKNOWLEDGEMENTS: The work was carried out within the framework of the project No. LO1418 "Progressive development of Membrane Innovation Centre" supported by the program NPU I Ministry of Education Youth and Sports of the Czech Republic, using the infrastructure Membrane Innovation Centre.
5 REFERENCES
1. Agel E., Bouet J., Fauvarque J.F.: Characterization and use of anionic membranes for alkaline fuel cells, J. Power Sources 101, 2001, pp. 267-274
2. Bilisik A.K., Turhan Y.: Multidirectional Stitched Layered Aramid Woven Fabric Structures and their Experimental Characterization of Ballistic Performance, Text. Res. J. 79(14), 2009, pp. 1331-1343
3. Cui W., Kerres J., Eigenberger G.: Development and characterization of ion-exchange polymer blend membranes, Sep. Purif. Technol. 14, 1998, pp. 145-154
4. Dubrovski P.D.( Ed.), Woven Fabric Engineering. (1st
ed.). Sciyo (India), 2010
5. Gohil G.S., Shahi V.K., Rangarajan R.: Comparative studies on electrochemical characterization of homogeneous and heterogeneous type of ion-exchange membranes, J. Membr. Sci. 240, 2004, pp. 211-219
6. Içten B.M., Karakuzu R.: Effects of Weaving Density and Curing Pressure on Impact Behavior of Woven Composite Plates, J. Reinf. Plast. Compos. 27(10), 2008, pp. 1083-1092
7. Křivčík J., et al.: The effect of an organic ion-exchange resin on properties of heterogeneous ion-exchange membranes, Desal. Wat. Treat. 14, 2010, pp. 179-184
8. Mehta H.U., Gupta K.C., Bhatt V.R., Somashekar T.H., Modi C.A., Malatesh S.: Effect of Construction and Weave on Some Mechanical Properties of Untreated and Resin-Treated Cotton Fabrics, Text. Res. J. 48(9), 1978, pp. 512-517
9. Oren Y., Freger V., Linder C.: Highly conductive ordered heterogeneous ion-exchange membranes, J. Membr. Sci. 239, 2004, pp. 17-26
10. Saiman M.P., Wahab M.S., Wahit M.U.: The Effect of Fabric Weave on Tensile Strength of Woven Kenaf Reinforced Unsaturated Polyester Composite, International Colloquium on Textile Engineering, Fashion, Apparel & Design, 2014
11. Seyam A., El-Shiekh A.: Mechanics of Woven Fabrics: Part V: Impact of Weavability Limit Parameters on Properties of Fabrics from Yarns with Thickness Variation, Text. Res. J. 65(1), 1995, pp. 14-25
12. Shahpurwala A., Schwartz P.: Modeling Woven Fabric Tensile Strength Using Statistical Bundle Theory, Text. Res. J. 59(1), 1989, pp. 26-32
13. Stránská E.: Relationships between transport and physical-mechanical properties of ion exchange membranes, Desalination and Water Treatment. Retreaved Nov 11, 2014
14. Stránská E., Weinertová K., Křivčík J., Neděla D.: Vlastnosti kationvýměnné membrány v závislosti na počtu vláken dostavy armující textilie, CHISA (Seč), 2015 (in Czech)

The 21st International Conference STRUTEX 2016
Fibres and Textiles (3) 2017 48
BANANA PLANT WASTE AS RAW MATERIAL FOR CELLULOSE EXTRACTION
Umit Halis Erdogan, Figen Selli and Hicran Duran
Dokuz Eylul University, Department of Textile Engineering, Tinaztepe Campus, 35160, Buca, Izmir, Turkey [email protected]
Abstract: Renewable raw materials and sustainability has a widespread significance for all types of industry. Cellulose, which has a great potential as a raw material for various branch of industry including textile, is the main component of most vegetable fibers. Cellulose from different vegetable resources can be isolated using chemical and mechanical treatments. Chemical treatments are effective for delignification. Based on this, the aim of our study is extraction of sustainable cellulose from ligno-cellulosic banana plant waste using chemical treatment. First, the waste banana plants were supplied as resource of cellulose considering the previous works about this topic and preliminary experimental studies. After that, the composition of the extract was determined in order to confirm the high cellulose content. At the next stage of this study, organic acid extraction method was used to extract cellulose from banana plant wastes. The cellulose content of banana plant was determined as 57% and 24% of hemicellulose. The cellulose was successfully extracted from banana plant wastes. Characterization results suggest that cellulose, an important raw material for textile, pulp and paper, composite and defense industries, can be effectively regained from banana plant wastes.
Keywords: Cellulose, extraction, banana plant wastes, pulping.
1 INTRODUCTION
Recently, research has focused on sustainability, renewable materials and recycling in the textile sector in conjunction with the other branches of industry. Cellulose is the most abundant natural polymer that can be used as a raw material in various industries such as paper, food and composite materials. Vegetable fibers are one of the raw materials of textile and they content various amounts of cellulose. Vegetable fiber wastes in the forms of cotton linter, fiber, yarn and fabric are being produced during production processes.
Cellulose can be extracted from banana plant with mechanical, chemical treatments and also by combining these two types of treatment [2]. Banana is one of the most important fruit and vegetable crop plants. Banana pseudo stem is known as a potential cellulose source, though usually discarded as agricultural waste in many countries [1, 3]. Turkey has a high production capacity for banana plants with 206.346 tons in 2012 [6]. Based on this high production capacity in Turkey we aimed to recycle cellulose from banana plant wastes (Figure 1).
Figure 1 Waste Banana Plants-Fibers
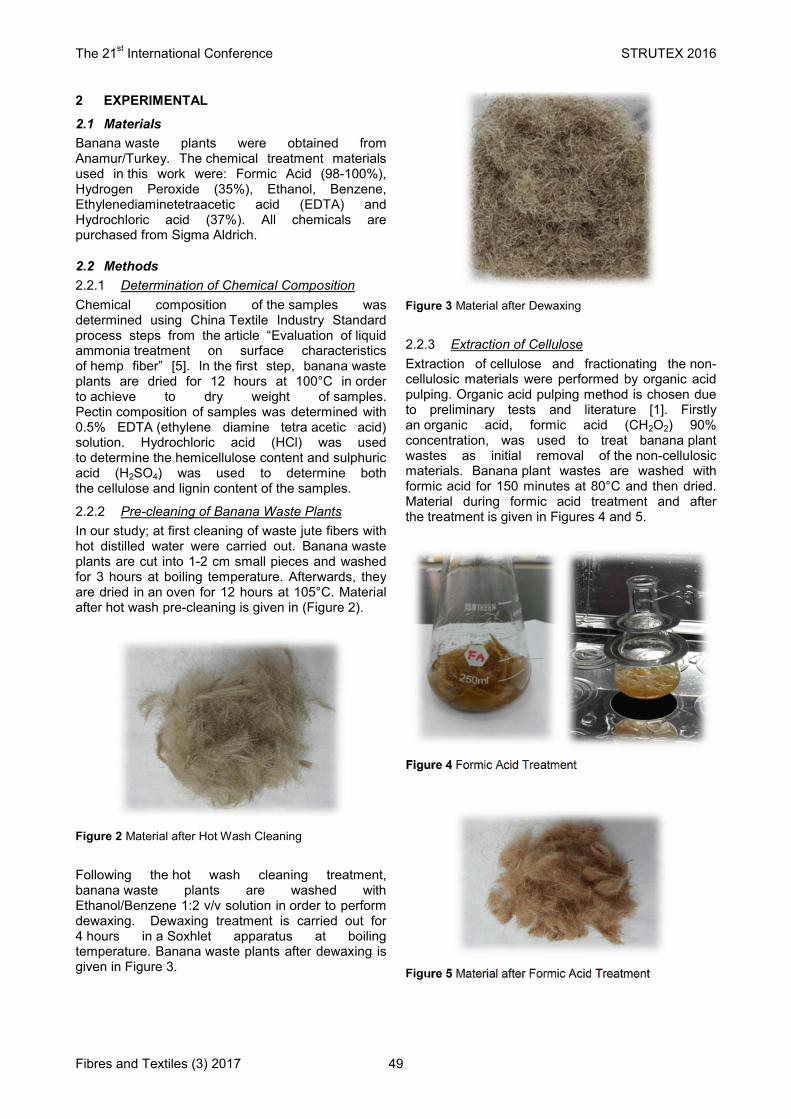
The 21st International Conference STRUTEX 2016
Fibres and Textiles (3) 2017 49
2 EXPERIMENTAL
2.1 Materials
Banana waste plants were obtained from Anamur/Turkey. The chemical treatment materials used in this work were: Formic Acid (98-100%), Hydrogen Peroxide (35%), Ethanol, Benzene, Ethylenediaminetetraacetic acid (EDTA) and Hydrochloric acid (37%). All chemicals are purchased from Sigma Aldrich.
2.2 Methods
2.2.1 Determination of Chemical Composition
Chemical composition of the samples was determined using China Textile Industry Standard process steps from the article “Evaluation of liquid ammonia treatment on surface characteristics of hemp fiber” [5]. In the first step, banana waste plants are dried for 12 hours at 100°C in order to achieve to dry weight of samples. Pectin composition of samples was determined with 0.5% EDTA (ethylene diamine tetra acetic acid) solution. Hydrochloric acid (HCl) was used to determine the hemicellulose content and sulphuric acid (H2SO4) was used to determine both the cellulose and lignin content of the samples.
2.2.2 Pre-cleaning of Banana Waste Plants
In our study; at first cleaning of waste jute fibers with hot distilled water were carried out. Banana waste plants are cut into 1-2 cm small pieces and washed for 3 hours at boiling temperature. Afterwards, they are dried in an oven for 12 hours at 105°C. Material after hot wash pre-cleaning is given in (Figure 2).
Figure 2 Material after Hot Wash Cleaning
Following the hot wash cleaning treatment, banana waste plants are washed with Ethanol/Benzene 1:2 v/v solution in order to perform dewaxing. Dewaxing treatment is carried out for 4 hours in a Soxhlet apparatus at boiling temperature. Banana waste plants after dewaxing is given in Figure 3.
Figure 3 Material after Dewaxing
2.2.3 Extraction of Cellulose
Extraction of cellulose and fractionating the non-cellulosic materials were performed by organic acid pulping. Organic acid pulping method is chosen due to preliminary tests and literature [1]. Firstly an organic acid, formic acid (CH2O2) 90% concentration, was used to treat banana plant wastes as initial removal of the non-cellulosic materials. Banana plant wastes are washed with formic acid for 150 minutes at 80°C and then dried. Material during formic acid treatment and after the treatment is given in Figures 4 and 5.
Figure 4 Formic Acid Treatment
Figure 5 Material after Formic Acid Treatment
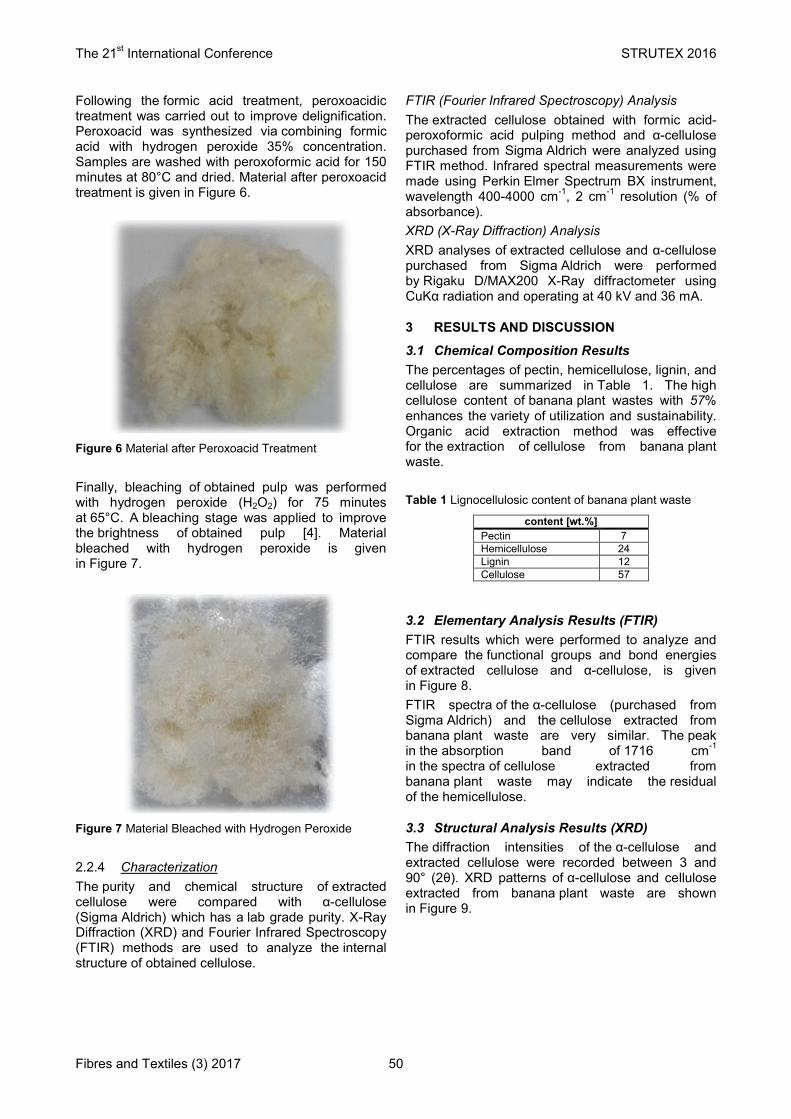
The 21st International Conference STRUTEX 2016
Fibres and Textiles (3) 2017 50
Following the formic acid treatment, peroxoacidic treatment was carried out to improve delignification. Peroxoacid was synthesized via combining formic acid with hydrogen peroxide 35% concentration. Samples are washed with peroxoformic acid for 150 minutes at 80°C and dried. Material after peroxoacid treatment is given in Figure 6.
Figure 6 Material after Peroxoacid Treatment
Finally, bleaching of obtained pulp was performed with hydrogen peroxide (H2O2) for 75 minutes at 65°C. A bleaching stage was applied to improve the brightness of obtained pulp [4]. Material bleached with hydrogen peroxide is given in Figure 7.
Figure 7 Material Bleached with Hydrogen Peroxide
2.2.4 Characterization
The purity and chemical structure of extracted cellulose were compared with α-cellulose (Sigma Aldrich) which has a lab grade purity. X-Ray Diffraction (XRD) and Fourier Infrared Spectroscopy (FTIR) methods are used to analyze the internal structure of obtained cellulose.
FTIR (Fourier Infrared Spectroscopy) Analysis
The extracted cellulose obtained with formic acid-peroxoformic acid pulping method and α-cellulose purchased from Sigma Aldrich were analyzed using FTIR method. Infrared spectral measurements were made using Perkin Elmer Spectrum BX instrument, wavelength 400-4000 cm
-1, 2 cm
-1 resolution (% of
absorbance).
XRD (X-Ray Diffraction) Analysis
XRD analyses of extracted cellulose and α-cellulose purchased from Sigma Aldrich were performed by Rigaku D/MAX200 X-Ray diffractometer using CuKα radiation and operating at 40 kV and 36 mA.
3 RESULTS AND DISCUSSION
3.1 Chemical Composition Results
The percentages of pectin, hemicellulose, lignin, and cellulose are summarized in Table 1. The high cellulose content of banana plant wastes with 57% enhances the variety of utilization and sustainability. Organic acid extraction method was effective for the extraction of cellulose from banana plant waste.
Table 1 Lignocellulosic content of banana plant waste
content [wt.%]
Pectin 7 Hemicellulose 24 Lignin 12 Cellulose 57
3.2 Elementary Analysis Results (FTIR)
FTIR results which were performed to analyze and compare the functional groups and bond energies of extracted cellulose and α-cellulose, is given in Figure 8.
FTIR spectra of the α-cellulose (purchased from Sigma Aldrich) and the cellulose extracted from banana plant waste are very similar. The peak in the absorption band of 1716 cm
-1
in the spectra of cellulose extracted from banana plant waste may indicate the residual of the hemicellulose.
3.3 Structural Analysis Results (XRD)
The diffraction intensities of the α-cellulose and extracted cellulose were recorded between 3 and 90° (2θ). XRD patterns of α-cellulose and cellulose extracted from banana plant waste are shown in Figure 9.

The 21st International Conference STRUTEX 2016
Fibres and Textiles (3) 2017 51
Figure 8 FTIR spectra of the extracted cellulose and α-cellulose
Figure 9 XRD patterns of the α- cellulose and cellulose extracted from banana plant waste
The diffraction peaks at 2θ=22–23° and 2θ=18-19° indicate the typical diffractions of cellulose. The crystallinity indexes of cellulose samples were calculated as 67 and 61.9% respectively. According to XRD patterns of the α-cellulose (purchased from Sigma Aldrich) and the cellulose extracted from banana plant waste, samples show the same intensity peaks at the same diffraction angles.
4 CONCLUSION
Our results suggest that, material which is a waste product after harvesting the banana plant can be
used as a potential source for cellulose. Cellulose extracted from banana plant wastes can be used in the production of regenerated cellulose fibers and composite materials and also in the paper and food industry. Moreover, microcrystalline and nano crystalline cellulose may be produced by acid hydrolysis of extracted cellulose. The thermal properties of extracted cellulose will be further investigated by using analytic methods. For a further study, cellulose extraction from banana plant wastes will be also investigated by using different chemical and mechanical treatments and their combination.

The 21st International Conference STRUTEX 2016
Fibres and Textiles (3) 2017 52
ACKNOWLEDGEMENT: The authors gratefully acknowledge the funding by Scientific and Technological Research Council of Turkey (TÜBİTAK) under grant 115M736.
5 REFERENCES
1. Blackburn R.S.: Sustainable Textiles; Life Cycle and Environmental Impact, Woodhead Publishing, UK, 2009
2. Kumar M., Kumar D.: Comparative Study of Pulping of Banana Stem, International Journal of Fiber and Textile Research 1(1), 2011, pp. 1-5
3. Klemm D., Heublein B., Fink H-P., Bohn A.: Cellulose: Fascinating Biopolymer and Sustainable Raw Material, Angewandte Chemie International Edition 44(22), 2005, pp. 3358-3393
4. Khan M.Z.H., Sarkar M.A.R, Al Imam Md.F.I., Malinen R.O.: Fiber morphology and Pulping study of Banana Pseudo-stem, International Journal of Fiber and Textile Research 3(1), 2013, pp. 31-35
5. Zhang J., Zhang H., Zhang J.: Evaluation of Liquid Ammonia Treatment on Surface Characteristics of Hemp Fiber, Cellulose 21(1), 2014, 569-579
6. www.fao.org, Food and Agricultural Organization of the United Nations

The 21st International Conference STRUTEX 2016
Fibres and Textiles (3) 2017 53
THEORY OF MASS IRREGULARITY CHANGES IN THE OE-ROTOR SPINNING SYSTEM
Petr Ursíny and Eva Moučková
Technical University of Liberec, Faculty of Textile Engineering, Department of Textile Technologies Studentská 2, 461 17 Liberec 1, Czech Republic
Abstract: In the work a theory of yarn mass irregularity changes in the OE-rotor spinning technology is presented. Three various approaches are described. In the first we assume the OE-rotor spinning system as a dynamic system and use the random mass function of short section of sliver and yarn as a function of time and we construct so called modulus of the transfer function. In the second approach we analyse the mass irregularity formation on the basis of the laws of variation phenomena in random processes. We express the total square mass irregularity by means of individual components which are influenced by technological process of final yarn formation. In the last approach we solved influence of OE-rotor spinning system on the yarn mass irregularity formation depending on the yarn fineness. We theoretically derive ratio of changes of draft of opening system and number of cyclic doubling as a function of OE-rotor yarn fineness. This ratio increases with decreasing value of yarn linear density. Increase in ratio corresponds with increase in mass irregularity. The described analysis is applicable for research of optimal technological conditions for OE-rotor spun yarn production.
Keywords: Yarn mass irregularity, partial square mass irregularity, OE-rotor spun yarn, OE-rotor spinning system, total square mass irregularity, cyclic doubling.
1 INTRODUCTION
Resulting mass irregularity of yarn depends not only on quality of raw material (fibre fineness and its variation, variation of fibre length) but also on the processing variables of several technological stages (for example draft, doubling…) while main influence has the finite technological stage – a spinning machine. During technological process of OE-rotor yarn production the mass irregularity of carded sliver is gradually transformed into the irregularity of final yarn. In the rotor spinning machine the feed sliver is opened into individual fibres by means of combing (opening) roller and consequently fibres are transported into the rotor by air stream. For this a very high draft is necessary. Fibres are collected in rotor groove (collecting surface) and thin fibres bundle is created by so called cyclic-doubling. For yarn manufacturing it is necessary to insert end of yarn into the rotor. Due to rotation of the rotor and high centrifugal forces the end of yarn starts to rotate around its axis and continuously to twists-in the fibres laying in the collection surface [1, 2]. It is known that the formation of yarn irregularity is mainly influenced by draft, which has negative effect and doubling, which has positive effect on mass irregularity [3]. In the literature the impact of cyclic-doubling on the change of structure of mass irregularity of fibrous product was theoretically described by so called modulus of relative transfer function of given system [1]. Generally, the modulus of relative transfer
function is a ratio of amplitudes of corresponding harmonic components of output and input signal related to the respective mean value [4] (for example mean value of fineness of output and input fibrous product). The function expressing the course of mass of short length sections of corresponding fibrous products in dependence on the length of these products is considered as an output (input) signal. Impact of general spinning system on total yarn mass irregularity can be also theoretically expressed assuming that the overall variance in the mass of short lengths of the end product in yarn manufacture can be regarded as the sum of the dispersions (variances) of the individual components of the mass irregularity [3, 5, 6].
The main aim of this article is to present the theory of yarn mass irregularity changes in the OE-rotor spinning system by various approaches. In the first method we assume the OE-rotor spinning system as a dynamic system and use the random mass function of short sections of sliver and yarn as a function of time and we construct experimental modulus of the transfer function. In the second approach we theoretically analyse the mass irregularity formation on the basis of the laws of variation phenomena in random processes. We express the total square mass irregularity by means of individual components which are influenced by technological process of final yarn formation. In the last method we solve influence of change of draft in the opening system and cyclic-

The 21st International Conference STRUTEX 2016
Fibres and Textiles (3) 2017 54
doubling of OE-rotor spinning system on the yarn mass irregularity formation depending on the yarn fineness.
2 INFLUENCE OF OE-ROTOR SPINNING SYSTEM ON THE YARN MASS IRREGULARITY
2.1 OE-rotor spinning system as a dynamic system, structure of spinning system
The basic concept of the mass irregularity transformation from the OE-rotor spinning system, as a dynamic system, consequents from the concept of the random mass function (fineness) of short parts of longitudinal textile (sliver, fiber flow, yarn) as a function of time or length. We use the function of time and the modulus of the transfer function of the specific dynamic system we express:
C
0
OE
PA
)(A)(F
(1)
where │FOE()│is modulus of the relative transfer function of a spinning system as a function of the wave length of harmonics component of the yarn mass irregularity; A() is relative amplitude of harmonics component (from mass irregularity of yarn) with the wave length ; A0(/Pc) is relative amplitude of harmonics component of sliver mass irregularity with the wave length /Pc; Pc is total draft of technological system (OE-rotor spinning system); is the wave length of a harmonic component of mass irregularity of yarn [m].
The modulus of the relative transfer function from the equation (1) is possible to determinate experimentally using spectrograms of output and input (supply) fibrous product obtained as a results of mass irregularity measurement employing the Uster Tester 4-SX. To determine the modulus mentioned above we use CV values, which correspond to relevant harmonic components of the yarn and sliver mass irregularity. Similar method was applied for construction of experimental modulus of relative transfer function of drafting system of a ring spinning machine in the work [11]. The course of the experimental modulus of relative transfer function of the OE-rotor spinning system is shown in the Figure 1.
Drawn slivers of fineness 4.6 ktex and rotor spun yarn of count 23 tex produced from 100% Tencel fibres (1.3 dtex, 38 mm) were used for experiment. Measurements of yarn and sliver mass irregularity were realized under these conditions - sliver: speed of measurement 25 m/min, time of measurement 5 min and yarn: speed of measurement 400 m/min, time of measurement 2.5 min. Examples of spectrograms are presented in the Figure 2a and 2b.
Figure 1 Experimental modulus of relative transfer function of OE-rotor spinning system
Figure 2a Spectrogram of sliver mass irregularity
Figure 2b Spectrogram of yarn mass irregularity
From the course of experimental modulus of relative transfer function it is obvious that the rotor spinning system deepens mass irregularity from the wavelength of yarn cca 25 m towards shorter wavelength. This increasing in values of experimental modulus of relative transfer function can be caused by higher draft between feed roller and rotor collecting groove. Components with longer wavelengths are not markedly affected by the high draft and furthermore effect of cyclic doubling suppresses also components with wave-lengths at the order of tens meters in the case of yarn.
The expression of characteristics of particular dynamic systems
For the expansion of analyses to the whole spinning system, as a dynamic system, it is necessary to calculate with the inner structure. The inner structure, how it is evident from the Figure 3 is divided in two basic partial systems, which have fundamental effect on the transformation of the mass irregularity – combing (opening) system and system of cyclic doubling. We rate the change of mass separation between fiber ribbon and the final yarn as relatively small. Fiber ribbon and

The 21st International Conference STRUTEX 2016
Fibres and Textiles (3) 2017 55
the yarn correspond each other in aspect of mass distribution.
Modulus of relative transfer function of total rotor spinning system is possible to express as follows:
CDOUOE F.FF (2)
where │FCD()│ is modulus of relative transfer function of cyclic doubling system as function of wave length of harmonic components of yarn mass irregularity and │FOU()│is modulus of relative transfer function of opening system as function of wave length of harmonic components of mass irregularity of yarn.
From equation (2) results the possibility to determine modulus of relative transfer function of opening system under application of modulus of relative transfer function of cyclic doubling system [7, 8] (see formula (3) and (4)).
.NA
AF
3
CD (3)
OE
0
3
3
OE
0
OU
PA
.NA
.NA
A
PA
A
F
(4)
where A3(N.) is relative amplitude of harmonic component mass of irregularity of fiber flow with wave length 3 = N..
Figure 3 Block schema of OE-rotor spinning system N is cyclic doubling rate; Pou is draft of combing (opening) system; POE is total draft of rotor spinning system; OE is rotor spinning system; OU is combing (separating) system; CD is system of cyclic doubling; 0, 3, are wave lengths of harmonic components of mass irregularity sliver (amplitude A0), fiber flow (amplitude A3 ) and yarn (amplitude A)
2.2 Analysis of the rotor spun yarn square mass irregularity formation in the spinning system
The overall dispersion (variance) in the mass of short lengths of the end product in yarn manufacture can be regarded as the sum of the dispersions (variances) of the individual components of the mass irregularity [3, 5].
k
1i
2i
2 CVCV (5)
The individual components CVi of the mass irregularity are independent on each other. As overall rate of variation in the mass of yarn short lengths CV we can use the parameter CVmass determined by apparatus for measuring yarn mass irregularity based on capacitance principle (for example Uster Tester). It is yarn total square mass irregularity [3].
Further analysis is based on CV [%] i.e. square mass irregularity on the short sections. During yarn formation on the OE-rotor spinning system we can distinguish these linear fibrous assemblies: supplied sliver, fibre flow, fibre ribbon (yarn). Square mass irregularity of fibre ribbon (or resulting rotor spun yarn) CVp we can express as:
2sp
2plim
2p CVCVCV (6)
where CVlim p is square limiting irregularity of OE-rotor yarn; CVSP is systematic square irregularity of OE-rotor yarn.
Square mass irregularity of fibre flow on the collecting surface CV3 we can express as:
23S
23lim
23 CVCVCV (7)
where CVlim3 is square limiting irregularity of fibre flow and CVS3 is systematic square irregularity of fibre flow which we can express as:
203VS
203P
20S
23S CVCVCVCV (7a)
where CVS0 is systematic square irregularity of supplied sliver; CVP03 is additional square irregularity induced in the opening process and CVVS03 is systematic developed square irregularity induced by draft in the opening process.
Square mass irregularity of supplied sliver CV0
can be expressed as:
20S
20lim
20 CVCVCV (8)
where CVlim0 is square limiting irregularity of supplied sliver and P03 is draft of the opening system.
When we convert the equations (6) ÷ (8) with use of technological patterns of doubling and drawing influence, we obtain formulas (9) ÷ (11):
20S
203VS
203P03
20lim
23 CVCVCVP.CVCV (9)
N
CVCVCV
23S2
plim2
P (10)
20S
20lim
20 CVCVCV (11)
where N is number of cyclic doubling.
Influence of spinning process on final yarn square mass irregularity we can express by so called

The 21st International Conference STRUTEX 2016
Fibres and Textiles (3) 2017 56
machine square irregularity CVOE which is generally defined by formula (12) [9].
20lim
20
2Plim
2P
2OE CVCVCVCVCV (12)
After substituting the formulas (10), (11) into (12) we obtain:
N
1NCV
N
CVCVCV 2
0S
203VS
203P2
OE
(13)
Machine square irregularity CVOE expresses the degree of equalizing effect of given spinning system on the final yarn mass irregularity. Opening system forms the mass irregularity and consequently mass irregularity decreases due to cyclic doubling system. In that way the formation of additional rotor yarn mass irregularity takes place. Next component of rotor yarn mass irregularity is given by the systematic square mass irregularity of supplied sliver.
The effect of changes of draft and cyclic doubling depending on the fineness of the fibrous product is possible to mathematically calculate according to following analysis.
2.3 Influence of the rotor spinning system on the yarn mass irregularity as a function of yarn fineness
Below we explain the influence of rotor spun yarn fineness on the internal level of draft of opening system and number of cyclic doubling. It follows, to certain extent, a limitation to produce rotor yarn with higher fineness. Total draft of OE-rotor spinning system Pc we can express by formula (14a) as well as by formula (14b):
.N
1.PP 03c (14a)
T
TP 0
c (14b)
where: P03 is draft of the opening system, T0 is fineness of the supplied sliver [tex], T is fineness of the final rotor yarn [tex], η is take-up coefficient (linear contraction of ribbon in consequence of twist) an N is number of cyclic doubling which can be calculated using diameter of the collecting surface d3 [m] and machine twist Z [m
-1] according to
formula (15):
.Z.d.N 3 (15)
When we express draft of the opening system P03 from the relation (14a) and substitute relation (14b) and (15) we obtain the formula (16).
Z.d..T
TP 3
003 (16)
Afterwards we express draft of the opening system and number of the cyclic doubling as a function of the final yarn fineness [10] and we will analyse this function. By using the relation for OE-rotor yarn twist as a fineness function with constant twist coefficient we obtain the relations for draft of the opening system P03 and number of cyclic doubling in the following form:
3/5003T
K.TP (17)
3/2T
.KN
(18)
Magnitude K is equal to: 1003 ... amdK and am is
twist coefficient (Phrix) [ktex2/3
m-1
].
The changes of draft P03 and number of cyclic doubling N as a function of OE-rotor yarn fineness T (derivation of a function P03 and N by course of fineness T as a function of yarn fineness T) are:
3/80T
1.T.K
3
5)T(p (19)
3/5T
1.K
3
2)T(n (20)
Where p(T) is change of draft of opening system in relation to change of OE-rotor yarn fineness as a function of yarn fineness and n(T) is change of number of cyclic doubling in relation to change of OE-rotor yarn fineness as a function of yarn fineness
Ratio R(T):
)T(n
)T(p)T(R (21)
A graph in Figure 4 shows the course of the ratio R(T), calculated for various yarn count. Individual curves respect the sliver fineness (T0) used for yarn production. For group of finer yarn count
is recommended to use finer sliver [12]. Increase in ratio R(T) corresponds with increase of mass irregularity. In the area of higher fineness of rotor yarns (T = 20 ÷ 12 tex) there are very high value of ratio R(T) – see Figure 4. It means that influence of draft in opening system plays a more significant role on formation of yarn mass irregularity compared with cyclic doubling system. For this instance it is necessary to supply a sliver with higher quality in the case of adequate sliver fineness.
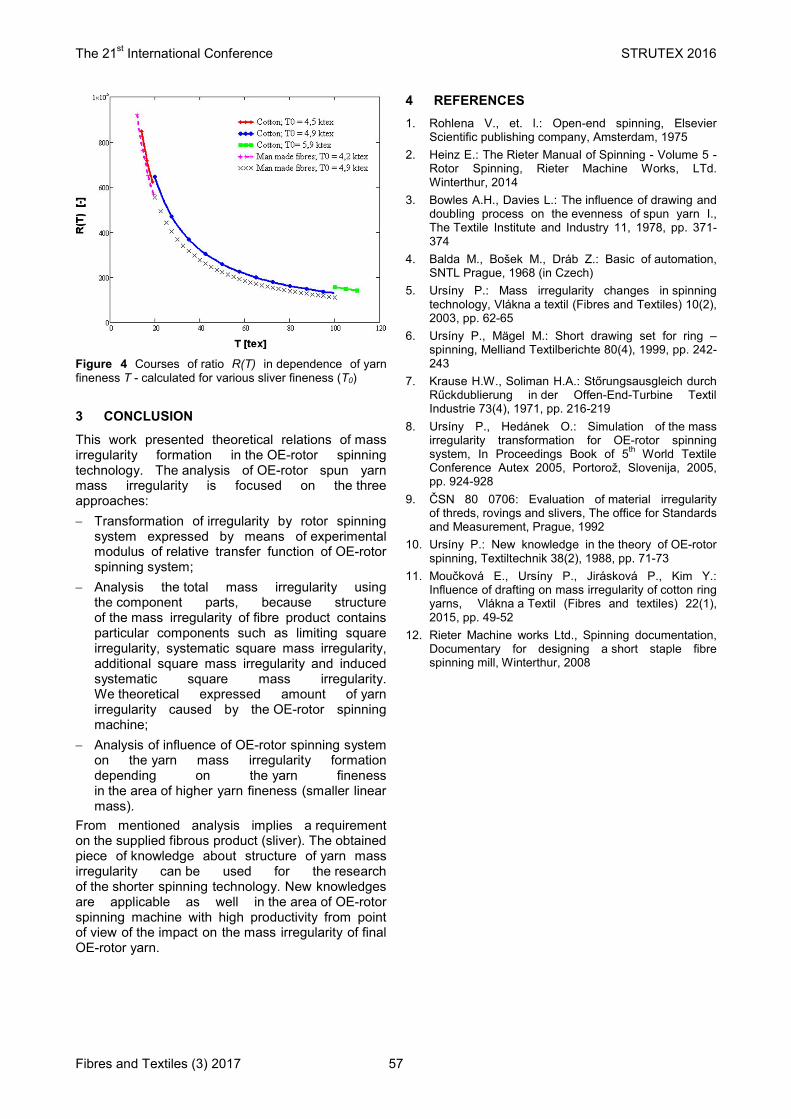
The 21st International Conference STRUTEX 2016
Fibres and Textiles (3) 2017 57
Figure 4 Courses of ratio R(T) in dependence of yarn fineness T - calculated for various sliver fineness (T0)
3 CONCLUSION
This work presented theoretical relations of mass irregularity formation in the OE-rotor spinning technology. The analysis of OE-rotor spun yarn mass irregularity is focused on the three approaches:
Transformation of irregularity by rotor spinning system expressed by means of experimental modulus of relative transfer function of OE-rotor spinning system;
Analysis the total mass irregularity using the component parts, because structure of the mass irregularity of fibre product contains particular components such as limiting square irregularity, systematic square mass irregularity, additional square mass irregularity and induced systematic square mass irregularity. We theoretical expressed amount of yarn irregularity caused by the OE-rotor spinning machine;
Analysis of influence of OE-rotor spinning system on the yarn mass irregularity formation depending on the yarn fineness in the area of higher yarn fineness (smaller linear mass).
From mentioned analysis implies a requirement on the supplied fibrous product (sliver). The obtained piece of knowledge about structure of yarn mass irregularity can be used for the research of the shorter spinning technology. New knowledges are applicable as well in the area of OE-rotor spinning machine with high productivity from point of view of the impact on the mass irregularity of final OE-rotor yarn.
4 REFERENCES
1. Rohlena V., et. l.: Open-end spinning, Elsevier Scientific publishing company, Amsterdam, 1975
2. Heinz E.: The Rieter Manual of Spinning - Volume 5 - Rotor Spinning, Rieter Machine Works, LTd. Winterthur, 2014
3. Bowles A.H., Davies L.: The influence of drawing and doubling process on the evenness of spun yarn I., The Textile Institute and Industry 11, 1978, pp. 371-374
4. Balda M., Bošek M., Dráb Z.: Basic of automation, SNTL Prague, 1968 (in Czech)
5. Ursíny P.: Mass irregularity changes in spinning technology, Vlákna a textil (Fibres and Textiles) 10(2), 2003, pp. 62-65
6. Ursíny P., Mägel M.: Short drawing set for ring – spinning, Melliand Textilberichte 80(4), 1999, pp. 242-243
7. Krause H.W., Soliman H.A.: Stőrungsausgleich durch Rűckdublierung in der Offen-End-Turbine Textil Industrie 73(4), 1971, pp. 216-219
8. Ursíny P., Hedánek O.: Simulation of the mass irregularity transformation for OE-rotor spinning system, In Proceedings Book of 5
th World Textile
Conference Autex 2005, Portorož, Slovenija, 2005, pp. 924-928
9. ČSN 80 0706: Evaluation of material irregularity of threds, rovings and slivers, The office for Standards and Measurement, Prague, 1992
10. Ursíny P.: New knowledge in the theory of OE-rotor spinning, Textiltechnik 38(2), 1988, pp. 71-73
11. Moučková E., Ursíny P., Jirásková P., Kim Y.: Influence of drafting on mass irregularity of cotton ring yarns, Vlákna a Textil (Fibres and textiles) 22(1), 2015, pp. 49-52
12. Rieter Machine works Ltd., Spinning documentation, Documentary for designing a short staple fibre spinning mill, Winterthur, 2008

The 21st International Conference STRUTEX 2016
Fibres and Textiles (3) 2017 58
INVESTIGATION OF THE CREEP AND DYNAMIC MECHANICAL PROPERTIES OF JUTE/GREEN EPOXY COMPOSITES
INCORPORATED WITH CHEMICALLY TREATED PULVERIZED NANO/MICRO JUTE FIBERS
Abdul Jabbar and Jiří Militký
Department of Material Engineering, Technical University of Liberec, Studentská 2, 461 17 Liberec, Czech Republic [email protected]
Abstract: The cellulose based stiff fillers have attained considerable attention in the last few decades for use as reinforcement in polymer composites. The creep and dynamic mechanical properties of alkali treated jute/green epoxy composites incorporated with 1, 5 and 10 wt.% of chemically treated pulverized jute fibers (PJF) are presented in this work. The incorporation of PJF is found to significantly improve the creep resistance and strain rate of composites. Burger’s model was used to model the creep behavior in this study. Dynamic mechanical thermal analysis (DMTA) results revealed the increase in storage modulus, glass transition temperature and reduction in the tangent delta peak height of composites with higher loading of PJF.
Keywords: Polymer composites, Creep, Compression molding, Pulverization.
1 INTRODUCTION
Natural fiber polymer composites (NFPC) are increasingly used nowadays in industrial applications as a substitute of polymer composites made with mostly used synthetic fibers such as glass and carbon etc. due to their environmental and economic benefits. Polymer composites used in engineering applications are often subjected to stress for a long time and at high temperatures. Creep (a progressive deformation of a material at constant stress) is very important end-use property for material applications requiring long term durability and reliability [1]. Considerable studies can be found in literature on the creep behavior of natural fiber polymer composites [2-7]. Researchers have also tried to study the creep behavior of polymer composites by addition of different kinds of fillers in matrices [8-10]. To the author’s best knowledge, there is no study available in open literature on the creep behavior of alkali treated jute reinforced green epoxy composites incorporated with chemically treated pulverized jute fibers as reinforcing fillers. Therefore, the objective of the present study is to investigate the incorporation of pulverized nano/micro jute fibers prepared from waste jute on the creep behavior under the conditions of different temperatures and dynamic mechanical behavior of alkali treated woven jute/green epoxy composites.
2 EXPERIMENTAL
2.1 Materials
Jute woven fabric produced from tossa jute (C. olitorius) fibers having an areal density of 600 gm
-2 with 5-end satin weave design was
produced on a shuttle loom. Warp and weft densities of the fabric were 6.3 threads per cm and 7.9 threads per cm respectively. Waste jute fibers, sourced from a jute mill, were used for pulverization. Green epoxy resin CHS-Epoxy G520 and hardener TELALIT 0600 were supplied by Spolchemie, Czech Republic. Sodium hydroxide (NaOH) was supplied by Lach-Ner, Czech Republic. Sodium sulfate (Na2SO4) and sodium hypochlorite (NaOCl) were supplied by Sigma-Aldrich, Czech Republic.
2.2 Methods
The untreated fabric was first washed with 2 wt.% non-ionic detergent solution at 70°C for 1 h prior to surface treatments. The jute fabric and waste jute fibers were then immersed separately in 2% NaOH solution for 1 h at 80°C maintaining a liquor ratio of 15:1. Alkali treated waste jute fibers were further treated with 7 g/l NaOCl solution at room temperature for 2 hours under pH 10-11 and subsequently antichlored with 0.1% Na2SO4 at 50°C for 20 min. Both fabric and waste fibers, after chemical pretreatment, were then washed with fresh water several times until the final pH was maintained at 7.0 and then allowed to dry at room temperature for 48 h and at 100°C in an oven for 2 h.

The 21st International Conference STRUTEX 2016
Fibres and Textiles (3) 2017 59
Pulverization of chemically treated waste jute fibers was carried out using a high-energy planetary ball mill of Fritsch pulverisette 7. The sintered corundum container of 80 ml capacity and zirconium balls of 10 mm diameter were chosen for 1 hour of pulverization. The ball to material ratio (BMR) was kept at 10:1 and the speed was kept at 850 rpm.
The composites were prepared by hand layup method and compression moulding technique. The resin and hardener were mixed in a ratio of 100:32 (by weight) according to manufacturer recommendations before layup and then weighed amounts of pulverized jute fibers (PJF) under 1, 5 and 10 wt.% were mechanically mixed with epoxy resin at room temperature until a homogeneous mixture was obtained. The prepared composite samples were designated as U (untreated), A-0% (alkali treated jute fabric with 0 wt.% of PJF), 1%, 5% and 10% (alkali treated jute fabric with 1, 5, 10 wt.% of PJF) respectively.
2.3 Testing
Particle size distribution of pulverized jute particles was studied on Malvern Zetasizer nano series based on dynamic light scattering principle of Brownian motion of particles. Deionized water was used as dispersion medium and it was ultrasonicated for 5 min with BANDELIN ultrasonic probe SONOPLUS before characterization. Refractive index of 1.52 was used to calculate particle size of pulverized jute. In addition, morphologies of pulverized jute fibers were observed with Vega-Tescan TS5130 Scanning Electron Microscope at 30 KV accelerating voltage. The surface of fibers was gold coated prior to SEM inspection.
Short-term creep tests were performed in three point bending mode at temperatures 40, 70 and 100°C using Q800 Dynamic mechanical thermal analysis (DMTA) instrument of TA instruments (New Castle DL, USA) for 30 minutes. The static stress of 2.0 MPa was applied at the center point of long side of the sample through the sample thickness for 30 min after equilibrating at the desired temperature and creep strain was measured as a function of time. The dynamic mechanical properties of composites were measured in 3-point bending mode using the above same instrument. The testing conditions were controlled in the temperature range of 35-200°C, with a heating rate of 3°C/min, fixed frequency of 1 Hz, preload of 0.1 N, amplitude of 20 µm, and force track of 125%. The samples having a thickness of 4.5-5 mm, width of 12 mm and span length of 50 mm were used for both creep and DMTA testing. Two replicate samples were tested for each test condition and average values are reported.
3 RESULTS AND DISCUSSION
The jute fibers were pulverized to particles with an average size of 1480 nm in wider particle size distribution as shown in Figure 1a. Figure 1b shows the shape and surface morphology of pulverized jute fibers. The PJF can be seen in irregular shape and size with certain aspect ratio as well.
Figure 1 (a) Particle size distribution and (b) SEM image of jute fibers after pulverization
3.1 Creep behavior
Four parameters (or the Burger’s) model is one of the mostly used physical models to give the relationship between the morphology of polymer composites and their creep behavior. The total strain as a function of time can be represented by the following equation:
te1EE
tM
0K/tKE
K
0
M
0
(1)
Figure 2 shows the creep strains for jute composites as a function of time with 0, 1, 5, 10 wt.% of PJF content at three different temperature conditions. It is visibly apparent that the composites have low instantaneous deformation M and creep strain at 40°C due to higher stiffness of composites but this deformation increases at higher temperatures due to decrease in composites stiffness.

The 21st International Conference STRUTEX 2016
Fibres and Textiles (3) 2017 60
Figure 2 Creep curves of composites incorporated with different loadings of PJF at different temperatures

The 21st International Conference STRUTEX 2016
Fibres and Textiles (3) 2017 61
The creep strain of all composites also increased at higher temperatures but the untreated jute composites was affected more than the others. The creep strain of alkali treated with 0% PJF composite is less than untreated one. This may be explained due to increase in surface roughness of jute fabric after alkali treatment and decrease in frictional slippage of matrix polymer chains at the fiber/matrix interface resulting in less creep deformation than untreated composite.
The least creep strain is shown by composite incorporated with 10% PJF at all temperatures followed by 5% and 1% PJF incorporated composites. At 100°C, 5% and 10% PJF composites have almost same instantaneous elastic deformation but 10% composite has less viscous deformation over time. This may be attributed to greater inhibition of slippage and reorientation of polymer chain with increasing contents of PJF. The Burger’s model curves show a satisfactory agreement with the experimental data (Figure 3). The four parameters EM, EK, ηM, ηK of Burger’s model, used to fit the Eq. 1 to the experimental data, are summarized in Table 1. All four parameters were found to decrease for all composites as temperature increased (Table 1). EM corresponds to the elasticity of the crystallized zones in a semicrystallized polymer. Compared to the amorphous regions, the crystallized zones are subjected to immediate stress due to their higher stiffness. The instantaneous elastic modulus is recovered immediately once the stress is removed. EK is also coupled with the stiffness of material. The decrease in parameters EM, EK resulted from the increase
in the instantaneous and the viscoelastic deformations as temperature increased. The viscosity ηM corresponds to damage in the crystallized zones and irreversible deformation in the amorphous regions and the viscosity ηK is associated with the viscosity of the amorphous regions in the semicrystallized polymer (Militký and Jabbar, 2015). The decrease in viscosity parameters ηM, ηK proposes an improvement in the mobility of molecular chains at higher temperature. The parameters for untreated and alkali treated with 0% PJF composites have undergone a largest decrease, resulting in higher creep strain. The composites incorporated with PJF, especially 5 and 10%, have comparatively better values of parameters particularly ηM which is related to the long term creep strain and validates less temperature dependence of these composites (Figure 2). The viscosity ηM increases with the increase in PJF % and permanent deformation decreases.
3.2 Dynamic mechanical thermal properties
Dynamic mechanical thermal analysis can characterize the viscoelastic properties of the materials and determine the information of storage modulus, loss modulus (the energy dissipation associated with the motion of polymer chains) and loss factor (tan delta) of polymer composites within the measured temperature range (Wang et al., 2015). The variation of storage modulus (Eʹ) of composites incorporated with different content of PJF as a function of temperature at frequency of 1 Hz is shown in Figure 3.
Table 1 Simulated four parameters in Burger’s model for short term creep of the composites
Temperature Parameters Composite types
Untreated Alkali-0% 1% 5% 10%
40°C
Em [MPa] 2477.24± 78.3 3259.41±138.0 3492.53±133.8 3810.53±133.6 3774.75±149.1 Ek [MPa] 23876.27±10854.5 38244.62±19726.9 42496.38±21110.6 44220.12±21281.1 40549.80±19016.6 ɳm [Pa.s] 2.72E7±1.33E7 3.54E7±1.22E7 4.77E7±2.04E7 4.54E7±1.97E7 5.11E7±2.47E7 ɳk [Pa.s] 2.11E6±2.38E6 1.37E6±2.09E6 1.73E6±2.5E6 2.53E6±3.49E6 1.90E6±2.62E6 SS* 2.65033E-9 1.29037E-9 1.04302E-9 9.92292E-10 1.08146E-9 Adj. R2 0.97524 0.97061 0.96424 0.96929 0.96304
70°C
Em [MPa] 1985.89±91.9 2403.61±102.7 2921.19±118.5 3116.67±118.6 3323.10±131.9 Ek [MPa] 7790.84±2752.5 11972.90±4497.3 14228.47±5360.3 16946.57±6037.4 15615.45±5726.5 ɳm [Pa.s] 9.48E6±3.81E6 1.32E7±5.14E6 1.98E7±9.71E6 2.33E7±1.08E7 2.27E7±1.13E7 ɳk [Pa.s] 956179.43±6.90E5 1.32E6±1.09E6 1.71E6±1.34E6 1.81E6±1.45E6 1.94E6±1.44E6 SS* 1.08937E-8 5.93037E-9 3.81543E-9 2.74811E-9 2.87718E-9 Adj. R2 0.98881 0.98689 0.9851 0.9847 0.98596
100°C
Em [MPa] 1380.05±294.3 1743.43±306.1 2417.83±218.3 2653.56±183.6 2616.45±123.7 Ek [MPa] 665.35±117.7 865.63±121.6 3543.54±958.0 6087.72±1783.7 8457.41±2683.5 ɳm [Pa.s] -4.13E20±0.0 -6.00E32±0.0 7.44E6±3.92E6 1.08E7±5.26E6 1.31E7±5.97E6 ɳk [Pa.s] 219089.75±1.03E5 255733.51±9.91E4 457813.67±2.43E5 705184.01±4.39E5 1.11E6±6.84E5 SS* 8.30033E-7 3.37586E-7 2.87859E-8 1.31777E-8 6.79893E-9 Adj. R2 0.97565 0.98358 0.99023 0.98826 0.98971

The 21st International Conference STRUTEX 2016
Fibres and Textiles (3) 2017 62
Figure 3 Dynamic mechanical properties composites incorporated with different loadings of PJF; (a) storage modulus, (b) loss modulus, (c) tan delta
It can be seen from Figure 3a that there is a gradual fall in the storage moduli with temperature, which should be related with an energy dissipation phenomenon involving cooperative motions of the polymer chains with temperature. The increase in storage modulus over the whole temperature range was observed for composites incorporated with different loadings of PJF, for example, addition of 1, 5 and 10% PJF causes a significant increase of ~18%, 22% and 43% in the storage modulus respectively at 35°C. Moreover, the storage modulus curves of composites have been shifted to higher temperatures after addition of the PJF, particularly 5 and 10% loading. This significant improvement in storage modulus is due to better reinforcing effect of PJF leading to increased stiffness and the mobility restriction of polymer chains. The change in loss factor (tan δ, the ratio of loss modulus to corresponding storage modulus) of composites with different loading of PJF, as a function of temperature, is shown in Figure 3c. Untreated composite displayed a higher tan δ peak value than others. This may be attributed to more energy dissipation due to frictional damping at the weaker untreated fiber/matrix interface. The temperature at which tan δ attains a maximum value can be referred to as the glass transition temperature (Tg). A positive shift in Tg can be observed for all
composites incorporated with PJF compared to untreated composite The lower tan δ peak height is shown by composite incorporated with 10% PJF followed by 5% and 1% PJF composites, exhibiting a strong fiber/matrix interfacial interactions which can restrict the segmental movement of the polymer chains leading to the increased Tg.
4 CONCLUSIONS
Creep behavior of alkali treated woven jute/green epoxy composites incorporated with different loadings of chemically treated pulverized jute fibers (PJF) was presented at various environment temperatures. The creep deformation was found to increase with temperature. The creep resistance of composites was found to improve significantly with the incorporation of PJF. The modeling of creep data was satisfactorily conducted by using Burger’s model. The Burger’s model fitted well the short-term creep data. Dynamic mechanical test results revealed the increase in storage modulus, glass transition temperature and reduction in the tangent delta peak height of PJF incorporated composites. Based on the analysis of results, the improved creep resistance of the composites were likely attributed to the inhibited mobility of polymer matrix molecular chains initiated by large interfacial contact area of PJF as well as their interfacial interaction with the polymer matrix.

The 21st International Conference STRUTEX 2016
Fibres and Textiles (3) 2017 63
ACKNOWLEDGEMENTS: This work was supported under the student grant scheme (SGS-21158) by Technical University of Liberec, Czech Republic. One of the authors is thankful to doc. Ing. Antonín Potěšil and Ing. Petr Hornik for providing DMA testing facilities.
5 REFERENCES
1. Krempl E., Khan F.: Rate (time)-dependent deformation behavior: an overview of some properties of metals and solid polymers, International Journal of Plasticity 19, 2003, pp. 1069-1095
2. Acha B.A., Reboredo M.M., Marcovich N.E.: Creep and dynamic mechanical behavior of PP–jute composites: Effect of the interfacial adhesion, Composites Part A: Applied Science & Manufacturing 38, 2007, pp. 1507-1516
3. Bledzki A.K., Faruk O.: Creep and impact properties of wood fibre–polypropylene composites: influence of temperature and moisture content, Composites Science & Technology 64, 2004, pp. 693-700
4. Hao A., Chen Y., Chen J.Y.: Creep and recovery behavior of kenaf/polypropylene nonwoven composites, Journal of Applied Polmer Science 131(17), 2014, pp. 8864-8874
5. Jia Y., Peng K., Gong X.-l., Zhang Z.: Creep and recovery of polypropylene/carbon nanotube composites, International Journal of Plasticity 27, 2011, pp. 1239-1251
6. Marcovich N.E., Villar M.A.: Thermal and mechanical characterization of linear low‐density polyethylene/wood flour composites, Journal of Applied Polymer Science 90, 2003, pp. 2775-2784
7. Xu Y., Wu Q., Lei Y., Yao F.: Creep behavior of bagasse fiber reinforced polymer composites, Bioresource Technology 101, 2010, pp. 3280-3286
8. Shen L., Phang I.Y., Chen L., Liu T., Zeng K.: Nanoindentation and morphological studies on nylon 66 nanocomposites. I. Effect of clay loading, Polymer 45, 2004, pp. 3341-3349
9. Yang J.-L., Zhang Z., Schlarb A.K., Friedrich K.: On the characterization of tensile creep resistance of polyamide 66 nanocomposites. Part I. Experimental results and general discussions, Polymer 47, 2006, pp. 2791-2801
10. Yang J.-L., Zhang Z., Schlarb A.K., Friedrich, K.: On the characterization of tensile creep resistance of polyamide 66 nanocomposites. Part II: Modeling and prediction of long-term performance, Polymer 47, 2006, pp. 6745-6758

The 21st International Conference STRUTEX 2016
Fibres and Textiles (3) 2017 64
MOISTURE MANAGEMENT FOR DIFFERENT AIR CONDITIONS
Tereza Heinisch, Pavla Těšinová and Lucie Pološčuková
Technical University of Liberec, Faculty of Textile Engineering, Department of Textile Evaluation Studentská 2, Liberec, Czech Republic
Abstract: Paper deals with evaluation of moisture management of textiles. It comprises management types and evaluates fabrics comfort in the terms of liquid moisture transport, drying speed and management resistivity. Because methods has got some limitations and cares with presumptions it is discussed here necessary interpretation of results, especially for smart fabrics.
Keywords: moisture management, drying rates, hydrostatic resistance, woven fabrics.
1 INTRODUCTION
We can meet concept of fast-drying clothes. Majority of apparel producers label clothes and final products by this term on textiles made from synthetic fibres which have got lower wettability itself in comparison to natural fibres. Testing is necessary instrument for exact determination of newly invented types and constructions of fabrics same as profiles of fibres. Unfortunately existing methods do not provide sufficient manual how to test the drying speed objectively. Important factors are mostly neglected which are influences of flow speed or heating of human skin.
This paper summarises important standards dealing with moisture management and determines way of textiles testing.
Figure 1 Transport of liquid in textiles during suction – net model where arrows represent main fluid of humidity including side branches [8]
Related standard AATCC Test Method 195-2009: Liquid Moisture Management Properties of Textile Fabrics is based on kind of wetting resistivity in relation to textile geometry and fabric parameters when sample is placed between two electronic sensors to be possible to apply liquid in the middle
of sample. Electric resistance is detected in dynamic way of the process in plane of both surfaces and through the material [1].
Nonofficial techniques were already published in 2008 as Technical attachment of AATCC / ASTM for textile gods. Official standard [2] AATCC Test Method 199-2011: Drying Time of Textiles: Moisture Analyzer Method was published later on. Testing method is based on gravimetric principle when wetting is defined. Wetting of sample is absorption in deionised water for 1 minute. Decreasing of weight is detected in the real time conditions. End state of measurement is when weight of sample is only 4% higher than completely dry state. Method is limited for high absorbing materials such as first layer of sports clothes higher then 30 s [3] and is suitable for suction materials according to definition at (AATCC TM 79 - suction of textiles).
Important BMI method (from set of standards from 2015 TNI CEN/TR 16422: Buffering capacity of liquid sweat and sweat transport) uses small skin model to evaluate water vapour resistance and thermal resistance. Skin heat temperature and air fluid are testing parameters on the instruments following ISO 11092. Advantage of this method is simulation of human skin by wet polyester fabric which absorbed 15 cm
3 humidity in temperature
35°C. Testing lasts 15 minutes and difference is detected by gravimetric method. This method is not sensitive for drying process and state of dry material [4].
Standard for exact value of moisture drying rate with drying characteristics is ISO 17616: Textiles: Determination of moisture drying rate and is useful to determine speed of drying of textile. It is as well based on gravimetric principle in stationary state of air without heating effect. Testing lasts 60 minutes or at least to the 10% of initial humidity weight [5]. Same principle is used for Asian countries in JIS L 1096: 1999 - Drying speed [6].

The 21st International Conference STRUTEX 2016
Fibres and Textiles (3) 2017 65
Laing in determining the drying time of apparel fabrics comparises two types of drying evaluation. The first method is based on standard AATCC Test Method 195-2009 without air fluid. Second method is based on BPI method with principle of wetted sample faced right side up to the 90° angle to the air flow 1±0.05 m.s
-1 and in contact with heated plate
(according to standard ISO 11092). Stable state and end of measurement is defined when temperature is stabile at 35±0.1°C. It respects real conditions the best from existing methods still does not detect drying process [7].
2 EXPERIMENTAL
Experimental material is defined at first for its moisture management properties with set of methods as capillary action test, Moisture Management Test by instrument MMT SDL Atlas and droplet test. After determination of moisture management it is possible to define reverse process – drying, especially for samples with good moisture management or samples with very good humidity transport through the thickness of the sample. Such a material can be defined as fast-drying and complex drying characteristics including skin heating and air flow in the time is necessary to be determined.
2.1 Materials
It was tested number of samples from fibres PES, PAD in plain, twill and satin weaves provided by Department of Textile Technologies FT TUL.
It was chosen PES material for abstract in plain, twill (3/1), satin (7/1) weaves when warp set is 42 [1/cm], fineness of warp yarn 78 [dtex], fineness of weft yarn165 [dtex].
Figure 2 Microphotography of tested sample, twill weave of multifilament yarns, magnification 10x
3 RESULTS AND DISCUSSION
It was tested suction and moisture management including its theoretical computation build on the model of Lucas–Washburn Equation [9]. Linear model was used and independent variable was theoretical suction. As visible from Figure 3, the closest prediction fits to the plain weave. Calculation is not sensitive for fabric weave in this case. Our task is to find models with satisfactory prediction for two other basic weaves too. After that it will be possible to evaluate better also draying process same as moisture management.
Table 1 Material identification for set of PES fabrics
Weave Plain Twill (3/1) Satin (7/1)
Weft set [1/cm] 21 23 25 27 29 25 27 29 31 33 29 31 33 35 37 Area density [g/m2] 80 79 95 94 96 95 96 95 105 108 101 103 106 109 118
Porosity [%] 47.4 45.8 44.2 42.6 41.0 44.2 42.6 41.0 39.4 37.8 41.0 39.4 37.8 36.2 34.6
Figure 3 Suction high in time relation for PES fabric with visible difference in weaves, warp direction

The 21st International Conference STRUTEX 2016
Fibres and Textiles (3) 2017 66
Drying properties of woven PES were tested on prototype instrument which is constructed from two main parts, see Figure 4.
Figure 4 New instrument: analytical scales (a), aluminum ribs (b), plates (c), 3 ventilators (d), clamping means of the frame (e)
The first part is channel where can be defined exact laminar air flow. This air flow can be set up according to standard needs. Air flow blows tested sample in the whole sample area.
Second part is testing device when tested sample is placed horizontally. Testing device is composed from analytical scales (a), aluminum ribs (b) and plates (c). Ribs with plate are blown by more ventilators to provide isothermal drying conditions. With help of clamping means of the frame (e) sample is fixed on the plate. Sample is placed whole to the channel. The instrument is possible to be placed in the air conditioning chamber.
The instrument is connected with PC when weight of tested sample is recorded in the minute intervals.
Every minute ventilator is stopped for 7 seconds and SW records current weight of sample.
Our experiment runs in temperature 18°C and relative humidity 65%. Sample size was in size 11 x 8 cm. All samples were air-conditioned in laboratory environment for 24 h and weighted on analytical scales of tested instrument in dry state to define standard weight of sample. Tested samples were dipped into distilled water in temperature 18°C for 60 minutes. Every sample was left to drain away on the absorbent paper for one minute after that and placed to the instrument on the plate. Testing begun after ventilator started in speed 5 m.s
-1. Testing
parameters were temperature 18°C and relative humidity 65%. See drying results on following Figures 5 and 6.
Maximum absorbed water content is for satin weave 51%, twill 35% and plain 23% of dry state in testing visualised in Figure 5. It is obvious then drying curves begin on different start point of absolute weight of water in the tested fabric. Suction of PES fibres itself is small. Tested sample in this example is dependent on the different porosity of samples (size of macro pores vary in selected weaves types). Decrease of humidity is in very close trends for all samples.
Graph in Figure 6 shows drying process in case of absolute water content same for all tested samples. When fabrics are same content of humidity in the means of plain weave maximum water suction ability drying speed does not affect on the weave type as in previous test. Drying curves are very close together.
Figure 5 Drying curves in maximum water content (suction ability of samples)

The 21st International Conference STRUTEX 2016
Fibres and Textiles (3) 2017 67
Figure 6 Drying curves for the same level of absolute water content of samples
4 CONCLUSION
Changes in moisture management transport can be seen in the terms of weave of fabrics. Correlation of suction high test is dependent in warp direction mostly. Satin weave samples have got significant difference with weft weave and plain weave in time. Plain weave as a structure with the highest curvature in structure and tightness between yarns embody the smallest suction and moisture management. On the other hand satin weave with its flotation has got high suction on the warp direction - flotation affected moisture management. After detection of drying time it will be possible to define relationship with fabric parameters, for example suction high in time range.
Though, results are not that clear in the reverse process. Drying speed and trend in humidity decrease are very close together for various weaves from this the very first testing with new instrument. Test ability was that what was tested and results are important for next steps which will be testing in various air velocity, broad sample set, various environment conditions etc. New instrument is precise in testing, clear in data interpretation and relevant to continue with.
ACKNOWLEDGEMENTS: This paper was financially supported by the Department of Textile Evaluation FT TUL and supported by the development program of Student Grant Competition SGC 2016 No. 21148 granted financial aid for Specific Undergraduate Research.
5 REFERENCES
1. AATCC Test Method 195-2009: Liquid Moisture Management Properties of Textile Fabrics, USA: AATCC Committee RA63, 2009
2. AATCC Test Method 199-2011. Drying Time of Textiles: Moisture Analyzer Method, USA: AATCC Committee RA63, 2011
3. AATCC Test Method 79-2003. Absorbency of Textile, USA: AATCC Committee RA63, 2003
4. TNI CEN/TR 16422: Klasifikace termoregulačních vlastností. Praha: Úřad pro technickou normalizaci, metrologii a státní zkušebnictví, 2015
5. ISO 17616, 2014: Textiles: Determination of moisture drying rate, Switzerland: International organization for standardization, 2014
6. JIS L 1096: 1999. Testing methods for wowen fabrics: Drying speed, Tokyo: Japanese Standards Association, 1999
7. Laing R.M., Wilson CH.A., Gore S.E., Carr D.J., Niven B.E.: Determining the Drying Time of Apparel Fabrics, Textile Research Journal 77(8), 2007, pp. 583-590, [online], [cit. 2013-03-13], ISSN 0040-5175, available: http://trj.sagepub.com/cgi/doi/10.1177/0040517507078232
8. Wiener J.: Vzlínání kapaliny do plošné textilie, 10/2013. VCT CENTRUM TEXTIL
9. Hamraoui A., Nylander T.: Analytical Approach for the Lucas–Washburn Equation, Journal of Colloid and Interface Science 250(2), 2002, pp. 415-421, [online], [cit. 2016-05-01], DOI: 10.1006/jcis.2002.8288, ISSN 00219797, available: http://linkinghub.elsevier.com/retrieve/pii/S0021979702982883
Fibres and Textiles (3) 2017 68
INSTRUCTIONS FOR AUTHORS
The journal ,,Vlákna a textil” (Fibres and Textiles) is the scientific and professional journal with a view to technology of fibres and textiles, with emphasis to chemical and natural fibres, processes of fibre spinning, finishing and dyeing, to fibrous and textile engineering and oriented polymer films. The original contributions and works of background researches, new physical-analytical methods and papers concerning the development of fibres, textiles and the marketing of these materials as well as review papers are published in the journal.
Manuscript
The original research papers are required to be written in English language with summary. The advertisements will be published in a language according to the mutual agreement.
The first page of the manuscript has to contain:
The title of the article (16 pt bold, capital letters, centred)
The full first name (s) and also surnames of all authors (11 pt, bold, centred).
The complete address of the working place of the authors, e-mail of authors (9 pt, italic, centred)
Abstract (9 pt, italic)
Key words (9 pt, italic)
The manuscript has to be written in A4 standard form, in Arial, 10 pt.
The text should be in double-column format (width 8.1 cm) in single line spacing.
Page margins: up and down 2.5 cm; left and right 2.0 cm.
Do not number the pages and do not use footnotes. Do not use business letterhead.
Figures, tables, schemes and photos (centered) should be numbered by Arabic numerals and titled over the table and under the figure or picture.
Photos and schemes have to be sufficiently contrastive and insert in text as pictures.
Figures, tables, schemes and photos, please, send in separate file.
Mathematical formulae should be centred on line and numbered consecutively on the right margin.
Physical and technical properties have to be quantified in Sl units, names and abbreviations of the chemical materials have to be stated according to the IUPAC standards.
References in the text have to be in square brackets and literature cited at the end of the text. References (9 pt), have to contain names of all authors.
[1] Surname N., Surname N.: Name of paper or Chapter, In Name of Book, Publisher, Place of Publication, YYYY, pp. xxx-yyy
[2] Surname N., Surname N.: Name of paper, Name of Journal Vol. (No.), YYYY, pp. xxx-yyy
[3] Surname N., Surname, N.: Title of conference paper, Proceedings of xxx xxx, conference location, Month and Year, Publisher, City, Surname N. (Ed.), YYYY, pp. xxx-yyy
[4] Surname N., Surname N.: Name of Paper, Available from http://www.exact-address-of-site, Accessed: YYYY-MM-DD
The final template of manuscript is available on http://www.vat.ft.tul.cz
Authors are kindly requested to deliver the paper (in Word form) to be published together with information about at least 3 recommended reviewers from institutions others than the parent (name, e-mail, institution, department) by e-mail: [email protected]
Address of the Editor Office:
Marcela Hricová
Faculty of Chemical and Food Technology,
Slovak University of Technology in Bratislava
Radlinskeho 9
812 37 Bratislava,
Slovakia


