23
Vattenfall Q1 2013 results Øystein Løseth, CEO and Ingrid Bonde, CFO Conference call for analysts and investors, 3 May 2013

Vattenfall Q1 2013 results Øystein Løseth, CEO and Ingrid Bonde, CFO
Conference call for analysts and investors, 3 May 2013

2 | Conference Call | 3 May 2013
Stable underlying operating profit despite challenging market conditions
• Stable underlying EBIT (SEK 11.6 billion, level with Q1/12)
• Profit after tax was SEK 6.2 billion (13.8). - Q1 2012 was impacted by capital gain of SEK 8.2 billion on the sale of
electricity distribution and heating business in Finland
• Electricity generation increased by 7.9% to 52.2 TWh (48.4) due to higher availability in both Forsmark and Ringhals (97.1%), and higher fossil production
• Vattenfall is studying possible divestments - 50% stake in Lippendorf lignite power plant (50% of 1,840 MW)- Danish CHP plants (total 1,388 MW)
• Cost reductions- SEK 3 billion cost reduction programme for 2013 is on track. - Further reductions of SEK 1.5 billion are targeted for 2014. - Expected reduction of 2,500 employees

3 | Conference Call | 3 May 2013
A weak and oversupplied electricity market
Loss of electricity demandwhich is only slowly recovering in the Nordics and Netherlands
Lower industrial activity leading tooversupply of CO2 allowances and low price levels
Overcapacity due to strong generation growth (mainly in renewables but also conventional generation)
Electricity prices have decreased significantly
and are expected to remain flat in the medium term
Electricity Forward Prices
0
10
20
30
40
50
60
70
80
90
100
GermanyNordic
EUR/MWh
2008 20172009 2010 2011 2012 2013 2014 2015 2016Market prices as of end April 2013
current market

4 | Conference Call | 3 May 2013
What could change the market situation?
Electricity price Demand CO2 price Capacity Gas price
Growth in the economy
Political intervention to push up CO2prices
Significant decommissioning (more than announced so far)
Gas price increase
Recession Collapse of EU ETS
Stronger renewables growth
Gas price decrease
5 | Conference Call | 3 May 2013
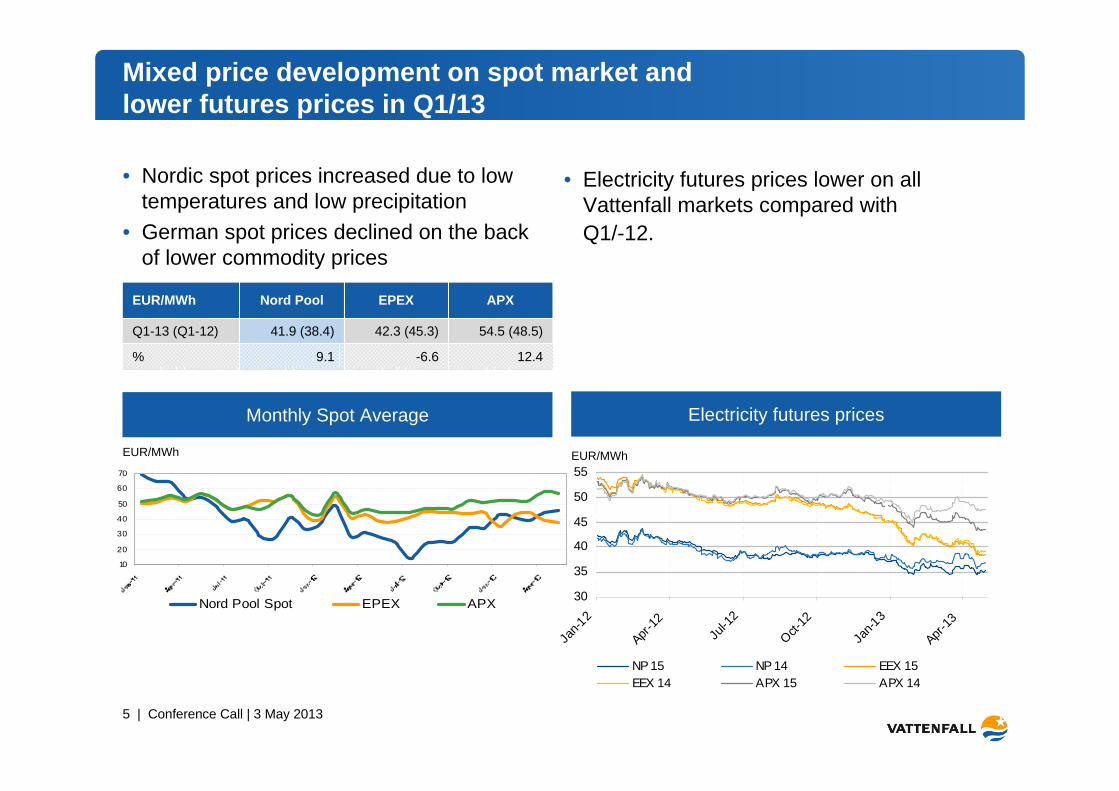
Mixed price development on spot market and lower futures prices in Q1/13
• Nordic spot prices increased due to low temperatures and low precipitation
• German spot prices declined on the back of lower commodity prices
Monthly Spot Average
10
20
30
40
50
60
70
Nord Pool Spot EPEX APX
EUR/MWh
12.4-6.69.1%
42.3 (45.3)
EPEX
41.9 (38.4)
Nord PoolEUR/MWh APX
Q1-13 (Q1-12) 54.5 (48.5)
Electricity futures prices
EUR/MWh
30
35
40
45
50
55
Jan-1
2
Apr-12
Jul-1
2
Oct-12
Jan-1
3
Apr-13
NP 15 NP 14 EEX 15EEX 14 APX 15 APX 14
• Electricity futures prices lower on all Vattenfall markets compared with Q1/-12.

6 | Conference Call | 3 May 2013
02468
101214161820
Emission allowances CO2 (EUR/t)
CO2 prices historically low due to EU parliament vote against back-loading
• CO2 prices plummeted after EU parliament on 16 April voted against the proposed back-loading of 900 million emission allowances
• Risk that national governments will implement other less cost efficient measures to curb CO2 emissions
EU emissions allowances
EUR/tonne

7 | Conference Call | 3 May 2013
Vattenfall’s standpoints regarding EU ETS
• It is Vattenfall’s firm opinion that the EU ETS trading system is the best means of control to tackle the climate issue
• Power companies need adequate price signals to be able to make accurate investment decisions
• We need more long-term and permanent measures to reinforce the system
• The current large accumulated surplus of allowances should be reduced through a distinct one-off set-aside
• The EU ETS system today encompasses approx 50% of all CO2 emissions within the EU• The 3rd phase of EU ETS started 1 January 2013 ending the free-of-charge allocation of
CO2 emission allowances for utilities• In 2012 Vattenfall emitted 83.5 million tonnes of CO2 of which 54.9 was covered by
free of charge allowances received • Vattenfall’s CO2 costs for coming years are to a large extent already hedged
Facts about the ETS trading system and Vattenfall’s C02 exposure:

8 | Conference Call | 3 May 2013
25.4
12.911.0
21.5
0
5
10
15
20
25
30
Heat sales Gas sales
Q1 2013 Q1 2012
1.5
11.214.5
25.0
1.5
11.712.5
22.7
0
5
10
15
20
25
30
Fossil Nuclear Hydro Wind & other
Q1 2013: 52.2 Q1 2012: 48.4
Increased fossil and nuclear generation due to higher availability
• 8% higher electricity generation output (52.2 TWh in Q1/13 vs 48.4 TWh in Q1/12)
- Fossil generation increased by 10% due to higher availability and start up of the German Boxberg R unit
- Nuclear generation increased by 16% due to higher availability
• Forsmark reached an availability of 99.2% (98.6)
• Ringhals reached an availability of 95.3% (69.9)
- Hydro power generation decreased by 4%
- Higher heat and gas sales due to colder weather TWh TWh

9 | Conference Call | 3 May 2013
Large part of generation for next three years already hedged
55
46
2013
51
43
2014
49
42
2015Hedge prices EUR/MWh
Nordic region
Continental Europe
% hedged of planned electricity production (remaining part of the year)
5454
76
55
84
100
0
10
20
30
40
50
60
70
80
90
100
2013 2014 2015
NordicContinental

FinancialsIngrid Bonde, CFO

11 | Conference Call | 3 May 2013
Q1 2013 Financial highlights
-1.2153,943**152,106Adjusted net debt
25.0***21.8FFO/Adjusted net debt (%)
-4.2111,907**107,379Net debt
-55.213,8286,195Profit after tax
-10.312,71711,402Cash flow (FFO)
2.5***3.3Adjusted net debt/EBTIDA (%)
-2,445
11,629
18,910
23,780
48,994
Q1 2012
-2,406
11,625
10,806
15,752
49,659
Q1 2013MSEK Change (%)
Net Sales +1.4
EBITDA -33.8
EBIT -42.9
Underlying EBIT* -
Financial items, net +1.6
* Underlying profit: EBIT excluding Items affecting comparability
** As of 31 December 2012
*** rolling 12 months

12 | Conference Call | 3 May 2013
Underlying EBIT Q1 2013 per operating segment
8,450
Q1 2012
8,066
Q1 2013MSEK
Generation
• Underlying EBIT decreased by SEK 0.4 bn
- Higher production volumes, lower O&M costs
- Lower achieved prices and higher fuel costs
3,591
Q1 2012
4,499
Q1 2013MSEK
Distribution and Sales
• Underlying EBIT increased by SEK 0.9 bn
- Higher gross margin (increased gas sales)
- Lower S&A costs
13 | Conference Call | 3 May 2013
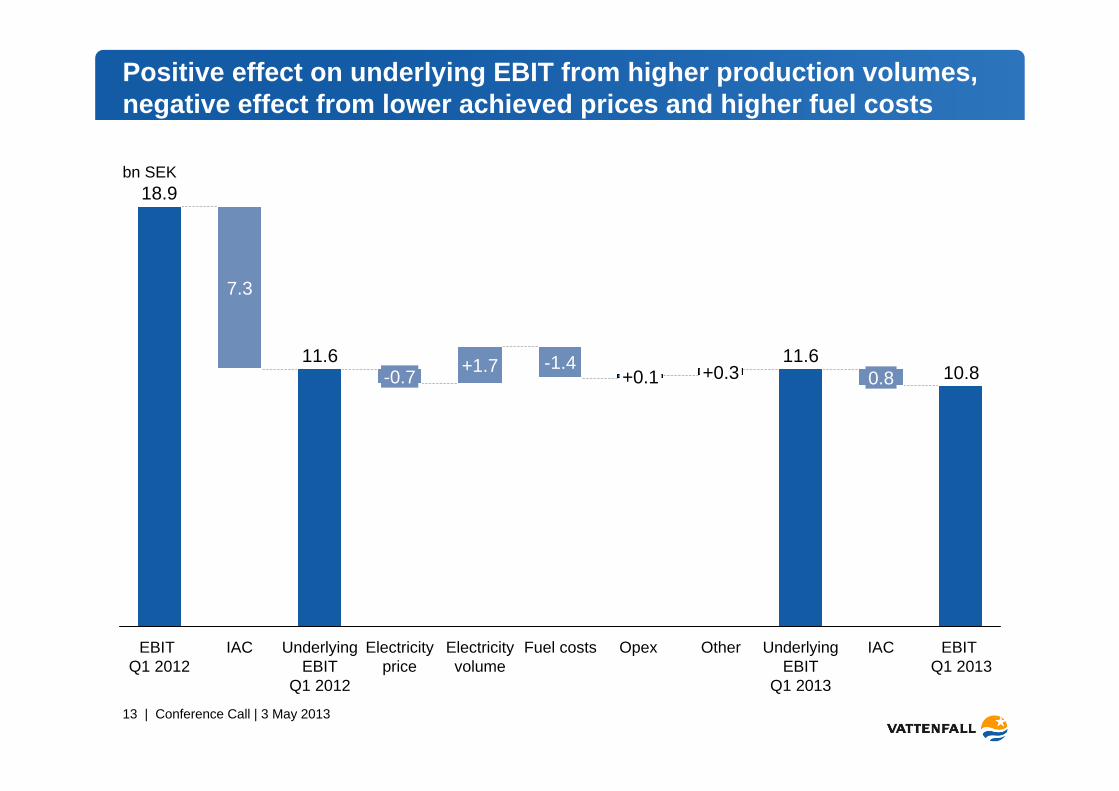
Positive effect on underlying EBIT from higher production volumes, negative effect from lower achieved prices and higher fuel costs
bn SEK
EBIT Q1 2013
10.8
IAC
0.8
Underlying EBIT
Q1 2013
11.6
Other
+0.3
Opex
+0.1
Fuel costs
-1.4
Electricity volume
+1.7
Electricity price
-0.7
Underlying EBIT
Q1 2012
11.6
IAC
7.3
EBIT Q1 2012
18.9
14 | Conference Call | 3 May 2013
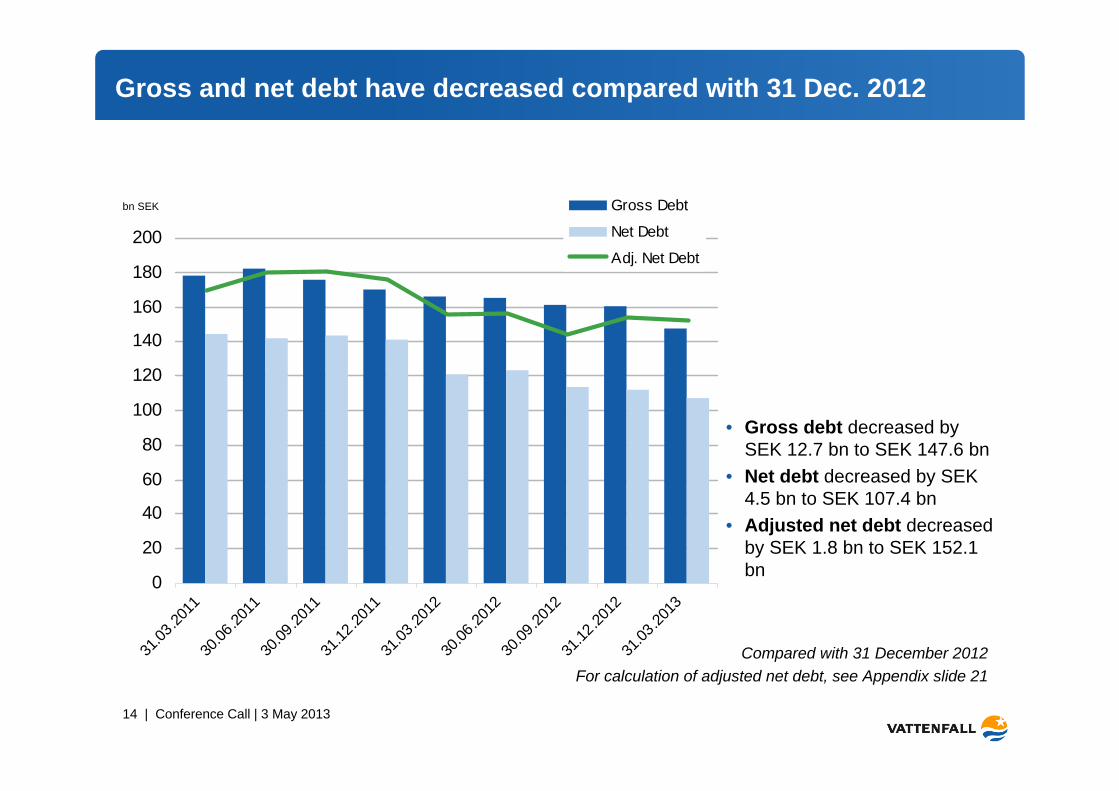
Gross and net debt have decreased compared with 31 Dec. 2012
• Gross debt decreased by SEK 12.7 bn to SEK 147.6 bn
• Net debt decreased by SEK 4.5 bn to SEK 107.4 bn
• Adjusted net debt decreased by SEK 1.8 bn to SEK 152.1 bn
0
20
40
60
80
100
120
140
160
180
200
31.03
.2011
30.06
.2011
30.09
.2011
31.12
.2011
31.03
.2012
30.06
.2012
30.09
.2012
31.12
.2012
31.03
.2013
Gross Debt
Net Debt
Adj. Net Debt
Compared with 31 December 2012For calculation of adjusted net debt, see Appendix slide 21
bn SEK
15 | Conference Call | 3 May 2013
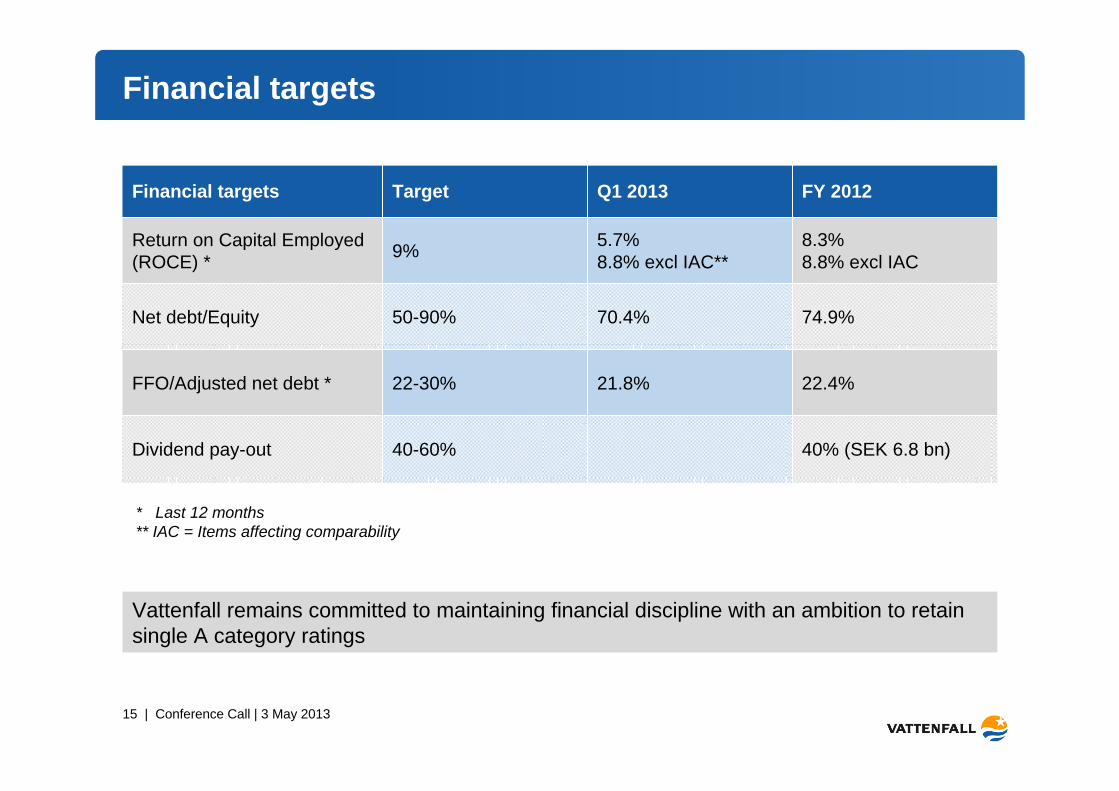
Financial targets
40-60%
22-30%
50-90%
9%
Target
21.8%
70.4%
5.7%8.8% excl IAC**
Q1 2013
74.9%Net debt/Equity
8.3%8.8% excl IAC
Return on Capital Employed (ROCE) *
Financial targets
40% (SEK 6.8 bn)
22.4%
FY 2012
FFO/Adjusted net debt *
Dividend pay-out
Vattenfall remains committed to maintaining financial discipline with an ambition to retain single A category ratings
* Last 12 months** IAC = Items affecting comparability

Q&A

Appendix

18 | Conference Call | 3 May 2013
Cash flow development Q1 2013
MSEK
2 745
4 755
Cash flow before
financing activities
-508
Divestments
37
Growth investments
3 290
Free cash flowMaintenance capex
2 010
Cash flow from operating
activities
19 | Conference Call | 3 May 2013
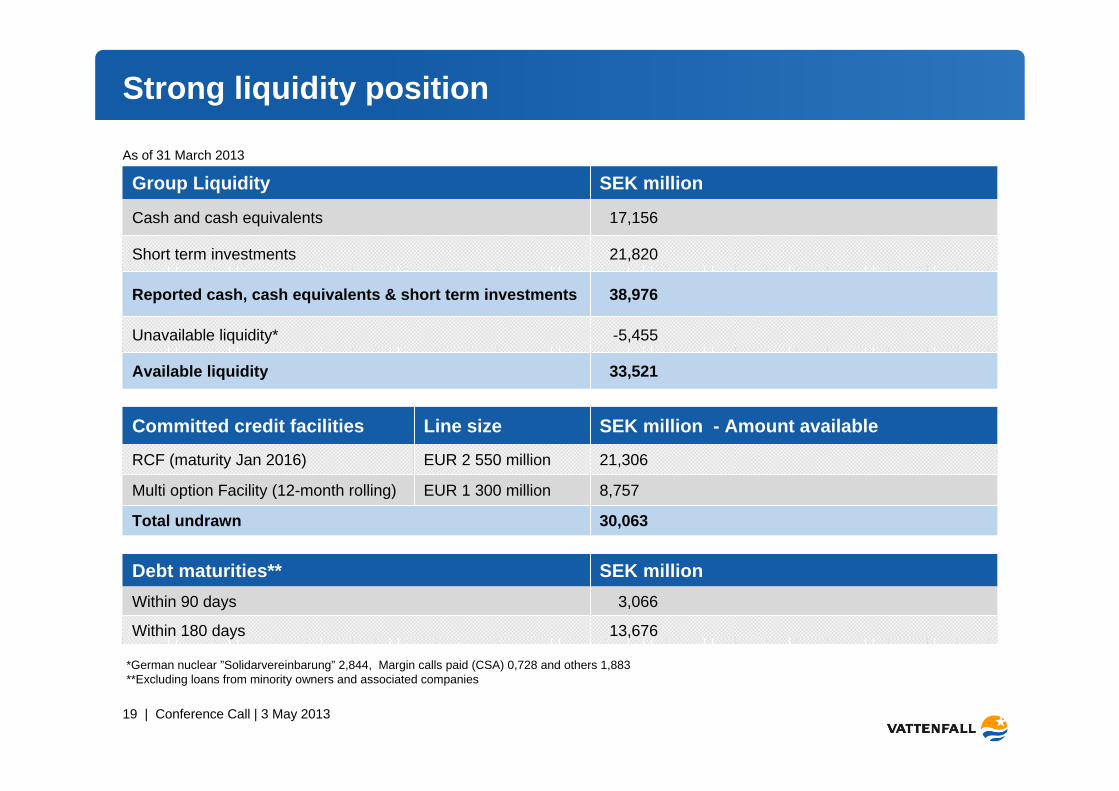
Strong liquidity position
33,521Available liquidity
-5,455Unavailable liquidity*
38,976Reported cash, cash equivalents & short term investments
21,820Short term investments
17,156Cash and cash equivalents
SEK millionGroup LiquidityAs of 31 March 2013
13,676Within 180 days
3,066Within 90 days
SEK millionDebt maturities**
*German nuclear ”Solidarvereinbarung” 2,844, Margin calls paid (CSA) 0,728 and others 1,883**Excluding loans from minority owners and associated companies
30,063Total undrawn
8,757EUR 1 300 millionMulti option Facility (12-month rolling)
EUR 2 550 million
Line size
21,306RCF (maturity Jan 2016)
SEK million - Amount available Committed credit facilities

20 | Conference Call | 3 May 2013
Bonds issued under EMTN-programme
55%
Bank loans and other 3%
Loans from minority
shareholders8%
Present value of liability
pertaining to acquisition of subsidiaries
18%
Loans from associated companies
6%Margin calls
(CSA)4%
Hybrid capital6%
Breakdown of gross debt
• All public debt issued by Vattenfall AB• The debt portfolio has no currency exposure that
has an impact on the income statement. The debt in foreign currency is either swapped to SEK or booked as a hedge against net foreign investments.
• No structural subordination
Total debt 31 Mar 2013: SEK 148 bn (EUR 18 bn)External market debt SEK 100 bn
9,07018,795Total
01,795SEK 15 bn Domestic CP
2,000
15,000
Size(MEUR)
0
9,070
Utilization(MEUR)
Debt issuing programmes
EUR 15 bn Euro MTN
EUR 2 bn Euro CP

21 | Conference Call | 3 May 2013
Reported and adjusted net debt
*Of which: German nuclear ”Solidarvereinbarung” 2.8, margin calls paid (CSA) 0.7, others 1.9
-111.9-107.4Net debt
0.10.0Loans to minority owners of foreign subsidiaries
1.81.2Receivable Swedish pension foundation
46.539.0Reported cash, cash equivalents & short-term investments
-160.3-147.6Total interest-bearing liabilities
-9.2-7.3Other liabilities
-11.9-12.3Liabilities to minority shareholders
-9.3-9.2Liabilities to associated companies
-27.1-26.5Present value of liability pertaining to acquisition of subsidiaries
-84.1
-8.3
Mar 312013
-94.3Bond issues and commercial papers and liabilities to credit institutions
-8.5Capital Securities
Dec 312012
Reported net debt(bn SEK)
1.81.2Receivable Swedish pension foundation
-153.9-152.1= Adjusted net debt
42.234.7= Adjusted cash, cash equivalents & short-term investments
-6.0-5.5*Unavailable liquidity
46.539.0Reported cash, cash equivalents & short-term investments
-196.2-186.8= Adjusted gross debt
10.510.9Liabilities to minority owners due to consortium agreements
7.25.2Margin calls received
3.01.8Cross currency swaps
-18.4-18.2Provisions for nuclear power (net)
-12.2-12.0Mining & environmental provisions
-30.2-31.0Present value of pension obligations
4.2
-147.6
Mar 312013
4.350% of Hybrid capital
-160.3Total interest-bearing liabilities
Dec 312012
Adjusted net debt(bn SEK)

22 | Conference Call | 3 May 2013
Vattenfall debt maturity profile
These figures differ from the reported interest bearing liabilities as loans from associated companies, minority owners, margin calls received (CSA) and valuation at fair value are excluded and currency derivatives for hedging debt in foreign currency are included.
Including Hybrid capital
111.9107.4Net debt (SEK bn)
3.43.3Average interest rate (%)
5.35.2Average time to maturity (years)
3.1
31 Mar 2013
3.3
31 Dec 2012
Duration (years)
MSEK
Capital Securities
0
10 000
20 000
30 000
40 000
2013 2015 2017 2019 2021 2023 2025 2027 2029 2031 2033 2035 2037 2039
Undrawn back-up facilities
Includes deferred payments for Nuon shares (MEUR):July 2013: 1,179.5July 2015: 2,071.3
23 | Conference Call | 3 May 2013
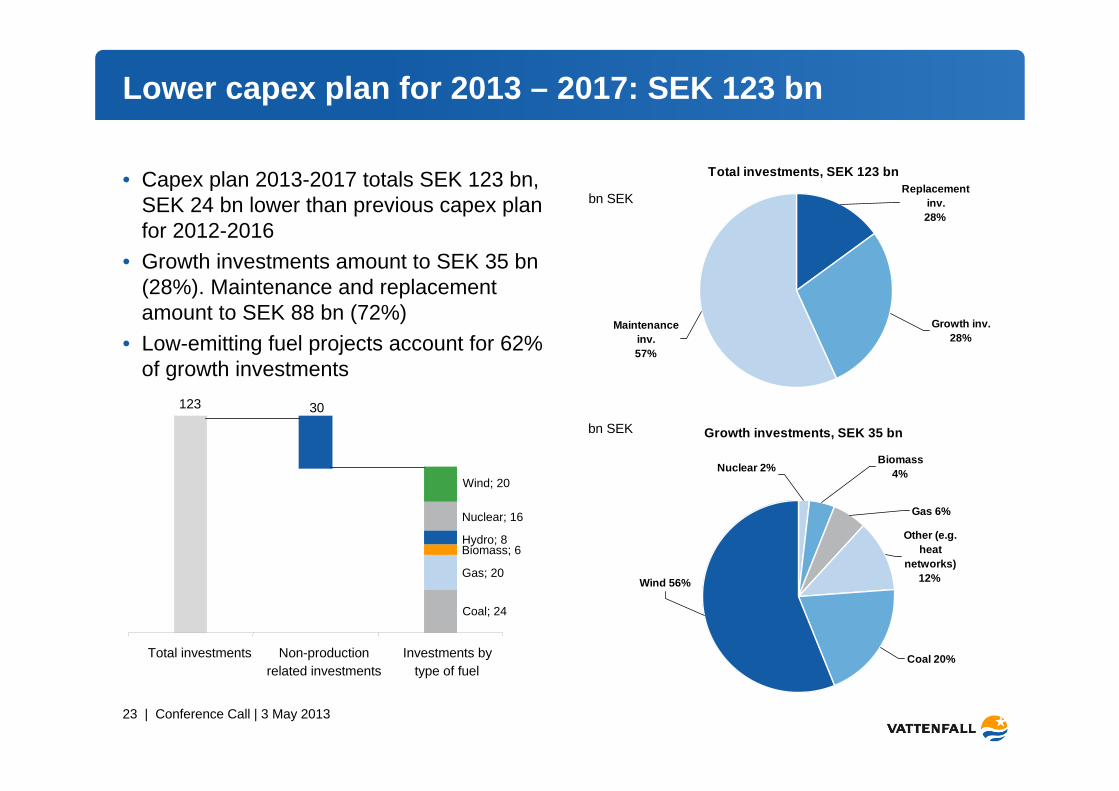
Total investments, SEK 123 bn
Maintenance inv.57%
Replacement inv.28%
Growth inv.28%
Lower capex plan for 2013 – 2017: SEK 123 bn
Growth investments, SEK 35 bn
Wind 56%
Coal 20%
Other (e.g. heat
networks)12%
Gas 6%
Nuclear 2%Biomass
4%
bn SEK
bn SEK
• Capex plan 2013-2017 totals SEK 123 bn, SEK 24 bn lower than previous capex plan for 2012-2016
• Growth investments amount to SEK 35 bn (28%). Maintenance and replacement amount to SEK 88 bn (72%)
• Low-emitting fuel projects account for 62% of growth investments
30123
Total investments Non-productionrelated investments
Investments bytype of fuel
Wind; 20
Nuclear; 16
Hydro; 8Biomass; 6
Gas; 20
Coal; 24


