30
VDOT Pedestrian Safety Action Plan Presented by Mark Cole, VDOT Lauren Blackburn, VHB May 2018

VDOT Pedestrian Safety Action Plan
Presented by Mark Cole, VDOT Lauren Blackburn, VHB
May 2018

Pedestrians made up about 16% of Virginia highway fatalities in 2016
0.00
0.20
0.40
0.60
0.80
1.00
1.20
1.40
1.60
1.80
2.00
3,500
4,000
4,500
5,000
5,500
6,000
6,500
2010 2011 2012 2013 2014 2015 2016
Pede
stria
n Fa
talit
iy R
ate
per
100,
000
Popu
latio
n
Pede
stria
n Fa
talit
ies
U.S. Pedestrian Fatalities U.S. Pedestrian Fatality Rate Virginia Pedestrian Fatality Rate
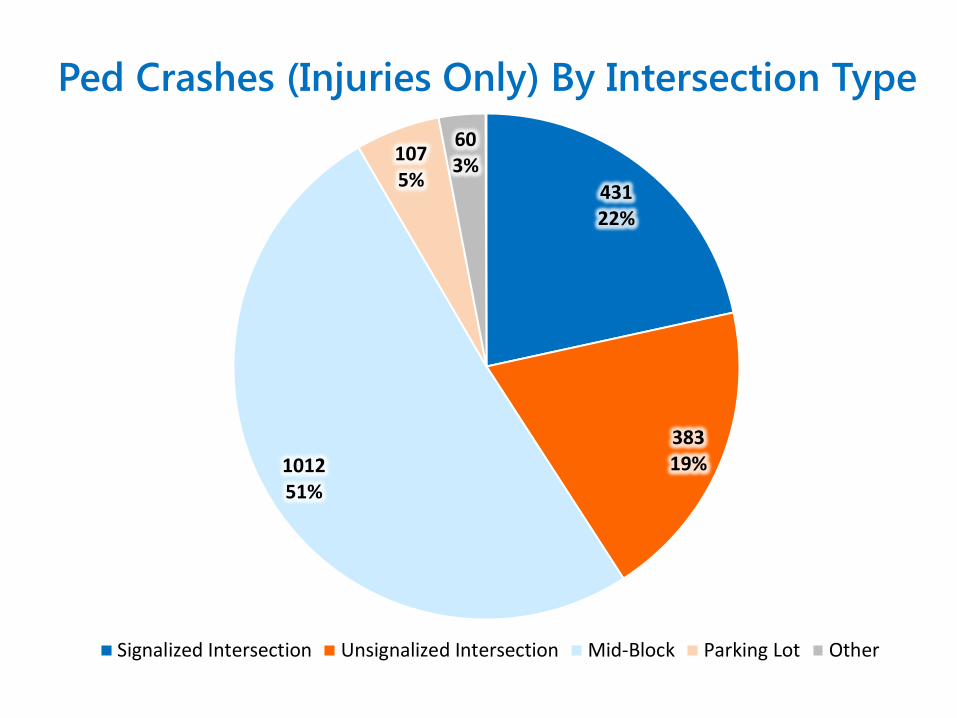
Ped Crashes (Injuries Only) By Intersection Type
431 22%
383 19% 1012
51%
107 5%
60 3%
Signalized Intersection Unsignalized Intersection Mid-Block Parking Lot Other
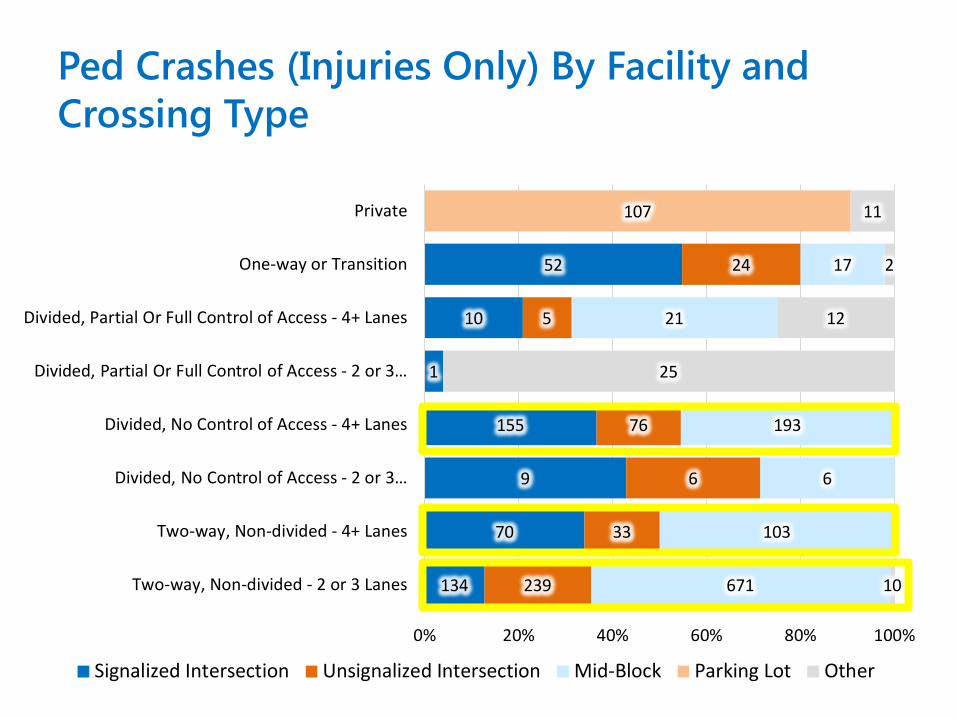
Ped Crashes (Injuries Only) By Facility and Crossing Type
134
70
9
155
1
10
52
239
33
6
76
5
24
671
103
6
193
21
17
107
10
25
12
2
11
0% 20% 40% 60% 80% 100%
Two-way, Non-divided - 2 or 3 Lanes
Two-way, Non-divided - 4+ Lanes
Divided, No Control of Access - 2 or 3…
Divided, No Control of Access - 4+ Lanes
Divided, Partial Or Full Control of Access - 2 or 3…
Divided, Partial Or Full Control of Access - 4+ Lanes
One-way or Transition
Private
Signalized Intersection Unsignalized Intersection Mid-Block Parking Lot Other

Ped Crashes (Injury Only): Land Uses
722 36%
861 43%
28 2%
17 1%
127 6%
238 12%
Residential Commercial Industrial Recreational Institutional Agricultural

Ped Crashes (Injuries Only): Crosswalks
39 8%
22 5%
396 87%
Marked Crosswalk Present,Pedestrian Struck in Crosswalk
Marked Crosswalk Present,Pedestrian Not Struck inCrosswalk
Marked Crosswalk Present,Unclear if Pedestrian Was Struckin Crosswalk
No Marked Crosswalk Present
Goals for the VDOT Pedestrian Safety Action Plan (PSAP) To better understand the pedestrian safety concerns
throughout the state and identify countermeasures to address those concerns Consider policy, procedure, and practice changes to better
promote safe pedestrian travel To consider the relationship between land development and
pedestrian safety To consider maintenance issues for pedestrian access and
safety To identify HSIP pedestrian safety projects

Step 1: Policy Review
Summarize and assess current VDOT policies: Roadway Design Traffic Engineering Permitting and land use Speed setting procedures Pedestrian planning and policy Research (countermeasure guidance) Project prioritization

Example Policy Recommendations
Consider VDOT-specific installation guidance for countermeasures not currently in roadway design manual
Update Traffic Impact Analysis - Pedestrian Levels of Service - per length or duration of pedestrian crossing
Develop road diet design criteria
Create guidance for Pedestrian Priority Zones
Develop a checklist for land development review to consider pedestrian mobility and safety

Step 2: Crash and Data Analysis
Crash Clusters smaller scale focus on crash types
Priority Pedestrian Corridors larger scale selected per criteria evaluating risk for crashes
What is a “crash cluster”?
Dense clusters of pedestrian crash locations, regardless of severity of the pedestrian injury
Uses geocoded pedestrian crash data (2012-2016) prepared for the
Virginia Pedestrian Crash Assessment report Density is measured by unweighted distance between “nearest neighbor”
crash locations
More intense clusters appear as bright orange-red spots
328 Total Clusters Statewide --- 19 Identified as High Priority

Example Mapped Crash Clusters: District 9
1-8 maps, additional inset zooms

Example Crash Cluster Site: Arlington (District 9)

Corridor Evaluation: Criteria Considered LAND USE FACTORS Pedestrian destinations (parks, trails,
and schools) MPO urban area/land use data layer Bus stops and transit/passenger rail
stations
SPEED FACTORS Posted speed limits Operational speeds
VISIBILITY FACTORS N/A: Lighting N/A: Pavement markings and crossing
DESIGN/INFRASTRUCTURE FACTORS Signal density Intersection locations N/A: Sidewalk and path
accommodations maintained by VDOT N/A: Crossing distance
VOLUME/OTHER FACTORS Pedestrian crash data Vehicle traffic volumes Population and employment density
(US Census) Vehicle ownership (US Census) Poverty levels (US Census) Prevalence of impaired (alcohol)
citations

Total Priority Corridors: 181 Total Corridor Mileage: 610 miles 61% of priority corridors are locally-owned roadways
Priority Corridors By District
[CATEGORY NAME], [VALUE]
2: Salem, 3% 3: Lynchburg, 4%
4: Richmond, 16%
5: Hampton Roads, 34%
6: Fredericksbur
g, 6%
7: Culpeper, 4%
8: Staunton, 2%
9: NOVA, 30%

Corridor Scoring Example: Hampton Roads
Top 1% of scored road segments Top 10% of scored road segments

Priority Corridor Example: Chesapeake Blvd, Norfolk (VA 194)
I-64
VA 170
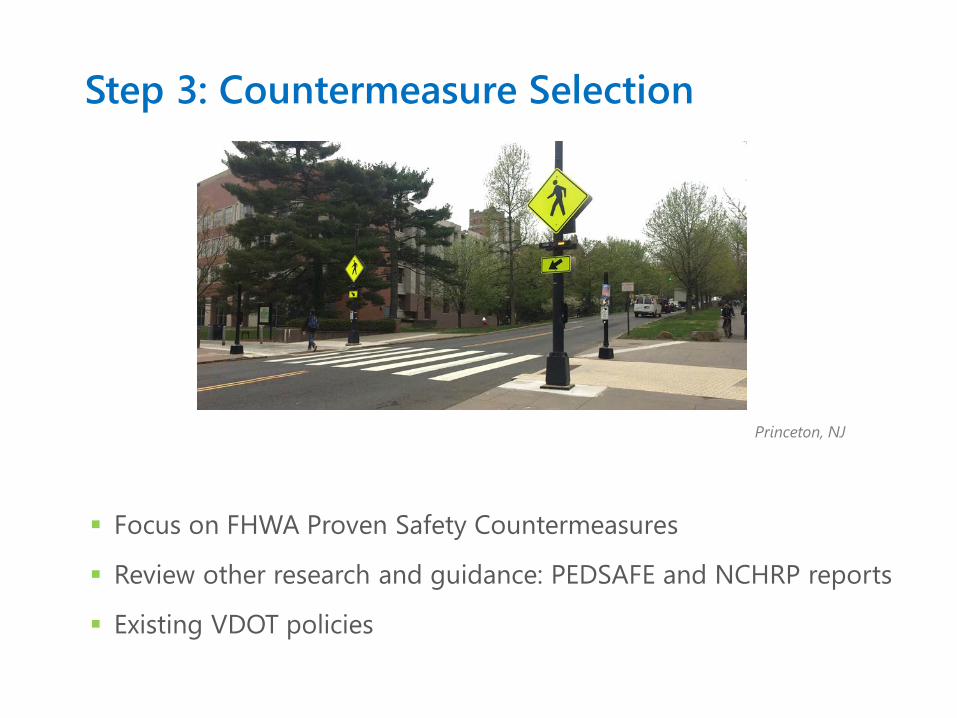
Step 3: Countermeasure Selection
Princeton, NJ
Focus on FHWA Proven Safety Countermeasures
Review other research and guidance: PEDSAFE and NCHRP reports
Existing VDOT policies
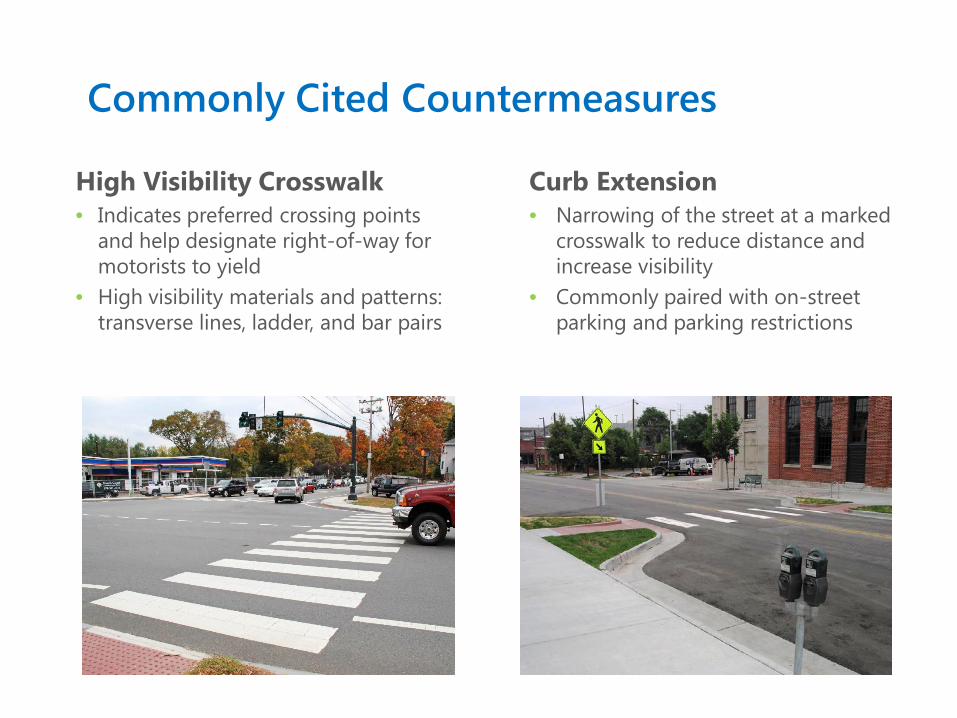
Commonly Cited Countermeasures
High Visibility Crosswalk • Indicates preferred crossing points
and help designate right-of-way for motorists to yield
• High visibility materials and patterns: transverse lines, ladder, and bar pairs
Curb Extension • Narrowing of the street at a marked
crosswalk to reduce distance and increase visibility
• Commonly paired with on-street parking and parking restrictions
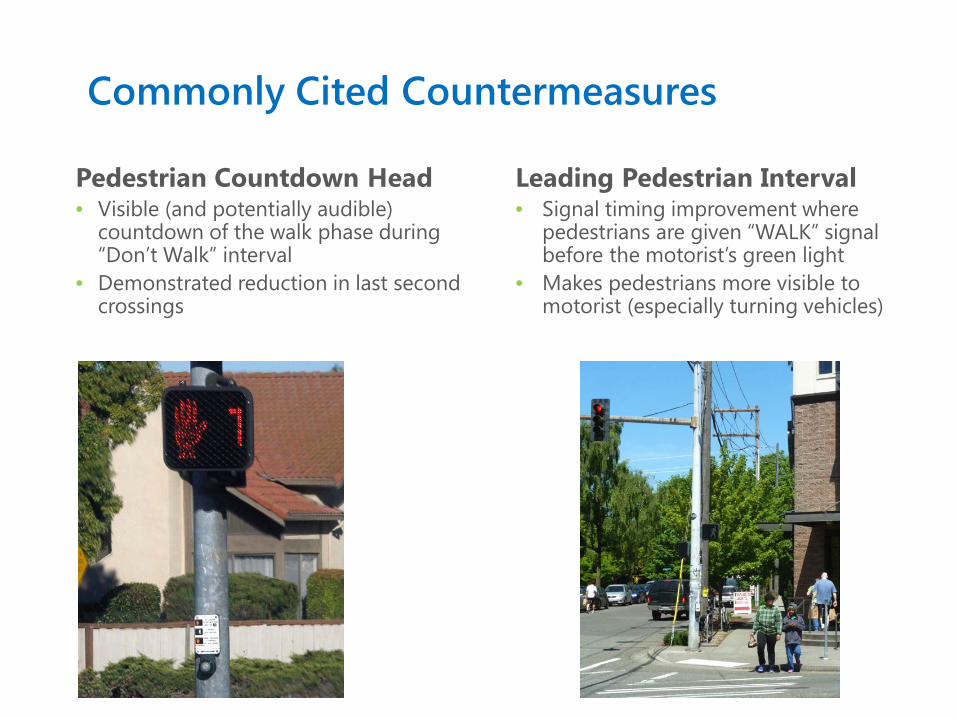
Pedestrian Countdown Head • Visible (and potentially audible)
countdown of the walk phase during “Don’t Walk” interval
• Demonstrated reduction in last second crossings
Leading Pedestrian Interval • Signal timing improvement where
pedestrians are given “WALK” signal before the motorist’s green light
• Makes pedestrians more visible to motorist (especially turning vehicles)
Commonly Cited Countermeasures
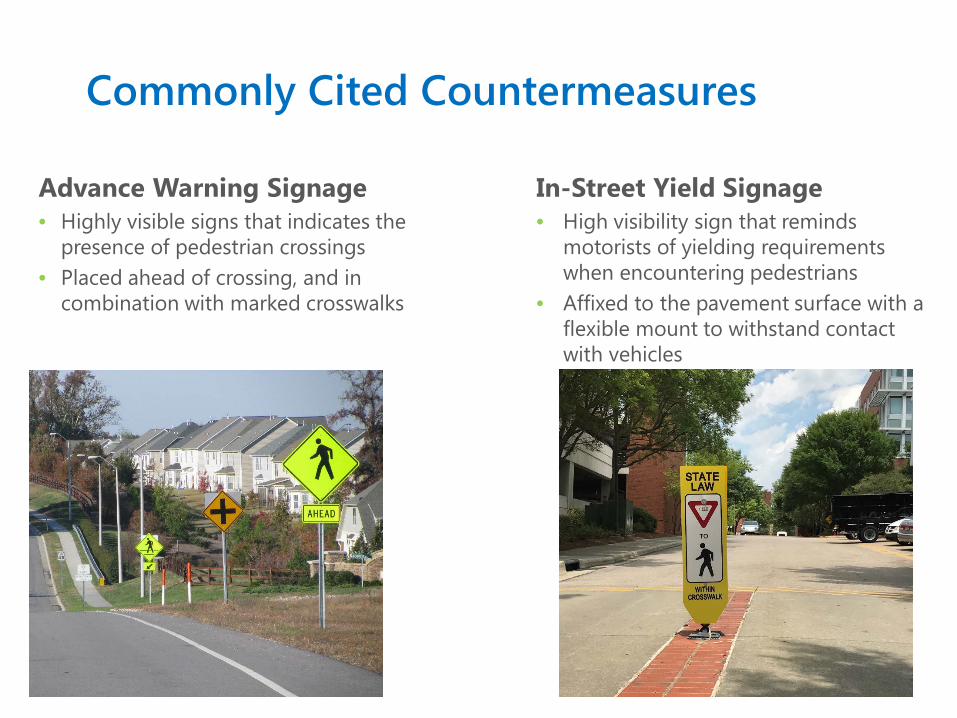
Advance Warning Signage • Highly visible signs that indicates the
presence of pedestrian crossings • Placed ahead of crossing, and in
combination with marked crosswalks
In-Street Yield Signage • High visibility sign that reminds
motorists of yielding requirements when encountering pedestrians
• Affixed to the pavement surface with a flexible mount to withstand contact with vehicles
Commonly Cited Countermeasures

Pedestrian Hybrid Beacon (PHB) • Specialty pedestrian activated
beacon that warns and controls traffic at unsignalized marked crosswalks
• Yellow lights warn of pedestrians, red lights stop traffic for pedestrians
Rectangular Rapid Flashing Beacon (RRFB) • High frequency blinking pedestrian
warning sign that is used in tandem with a marked crosswalk
• Flashing pattern can be activated with pushbuttons or automated and should be unlit when not activated
Commonly Cited Countermeasures

Pedestrian Refuge Island • Raised islands or medians place in the
center of the street at an intersection or mid-block
• Allows pedestrians to find appropriate crossing gap and focus on oncoming direction at a time
Road Diet • Conversion of a roadway that often
reduces travel lanes and adds shared center turn lane and on-street parking or bicycle lanes
• Subject to existing roadway configuration and AADT
Commonly Cited Countermeasures

Example Linear Improvements
Sidewalk Connections Connecting gaps in the sidewalk and
path network reduce need for pedestrians to walk in the roadway Sidewalks on one or both sides of the
roadway per adjacent land use context
Transit Stop Access Review bus shelter placement relative
to pedestrian crossings and intersections Build sidewalks to shelters from nearest
network
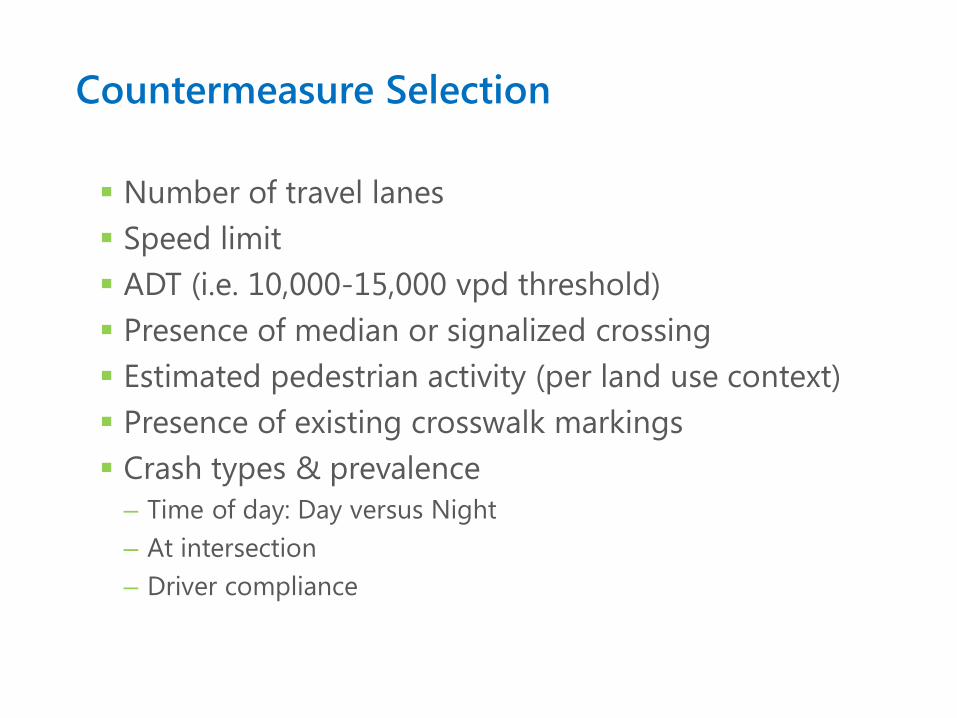
Countermeasure Selection
Number of travel lanes Speed limit ADT (i.e. 10,000-15,000 vpd threshold) Presence of median or signalized crossing Estimated pedestrian activity (per land use context) Presence of existing crosswalk markings Crash types & prevalence
– Time of day: Day versus Night – At intersection – Driver compliance

Piccadilly Street (SR 7)
Community: Winchester VDOT District: 8 (Staunton)
7 out of 8 crashes occurred on 2-lane undivided roadway, all crashes occurred in a 25 mph zone, and 5 out of 8 crashes involved improper action by the driver.
High visibility crosswalks; Right Turn on Red restrictions or Leading Pedestrian Interval
87%
13%
Crash Location
Signalized Intersection Unsignalized Intersection
75%
12%
13%
Pedestrian Action
Crossing with Signal Crossing against SignalCrossing; No Signal

Electric Road (SR 419) – Sheet 1 of 1
Community: Roanoke County VDOT District: 2 (Salem)
• 4-lane median divided roadway with minimal pedestrian crossings and low density residential and commercial land uses. AADT: ~25,000; Speed Limit: 45
• Little to no existing pedestrian crossing infrastructure and wide crossing distances.
Consider sidewalks, pedestrian countdown signals; PHBs at key mid-block crossings

Next Steps for Local Agencies
View or download the data and information ArcGIS Online map showing crash clusters and priority corridors Corridor and crash cluster “cut sheet” maps linked Corridor Site Example Crash Cluster Site Example
Coordinate review with VDOT staff / local agency Review local plans, crash reports, and site conditions Discuss refined countermeasures
Develop and submit HSIP and/or SMART SCALE projects
Thanks!
For more information:
Mark Cole, P.E. VDOT Assistant State Traffic Engineer
Lauren Blackburn, AICP [email protected]


