Page 1
Vegetable StatisticsVegetable Statistics
Technical Bulletin No. 51
Indian Institute of Vegetable Research
Varanasi - 221 305 (Uttar Pradesh)
(Indian Council of Agricultural Research)
6.25
6.16
6.09
6.08 6.
74 7.21 7.58 7.85
7.98
7.99 8.
59.39
8.86
8.48 8.83 10
.13
11.1
4
11.5 12
.85
12.9
1
13.3
7
14.6
6
15 14.4
13.9 14.5 15 15
.4
15.2 16
.4
16.2 16.7 17.3
0
2
4
6
8
10
12
14
16
18
20
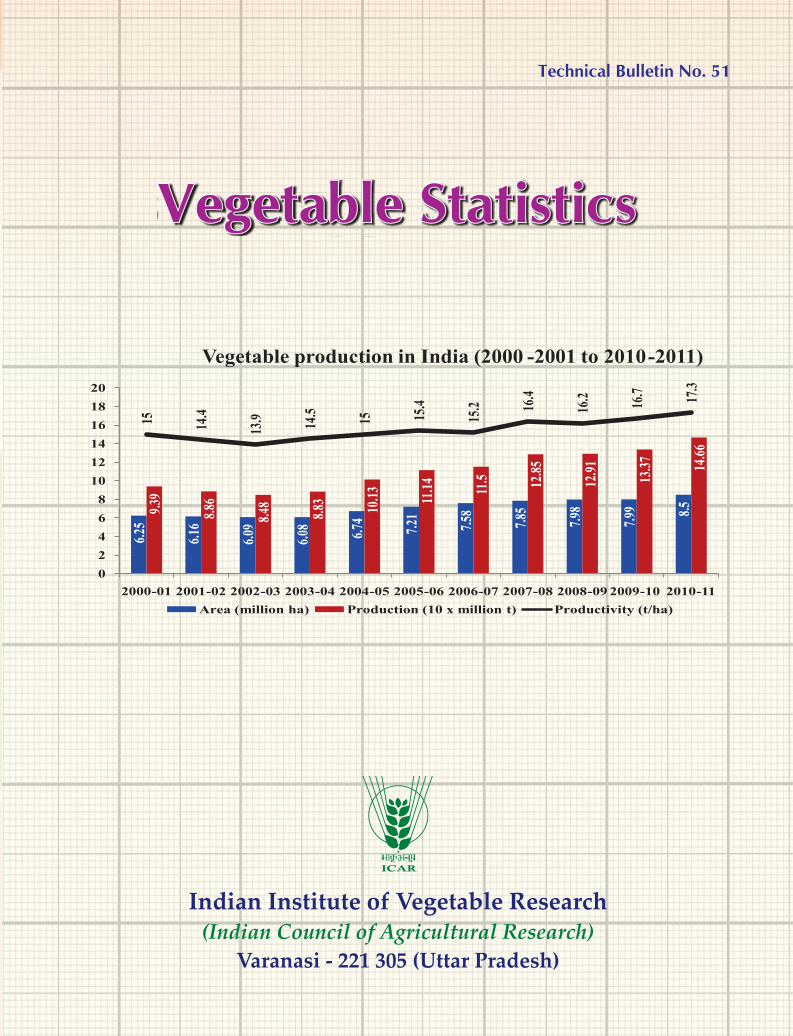
2000-01 2001-02 2002-03 2003-04 2004-05 2005-06 2006-07 2007-08 2008-09 2009-10 2010-11
Area (million ha) Production (10 x million t) Productivity (t/ha)
Vegetable production in India (2000 -2001 to 2010-2011)WB, 18.2
UP, 12.1
Bihar, 10
AP, 8.1Gujarat, 6.4
Karnataka, 6.2
TN, 5.6
Odisha, 5.3
Maharashtra, 5.1
Haryana, 3.2
Others, 19.8
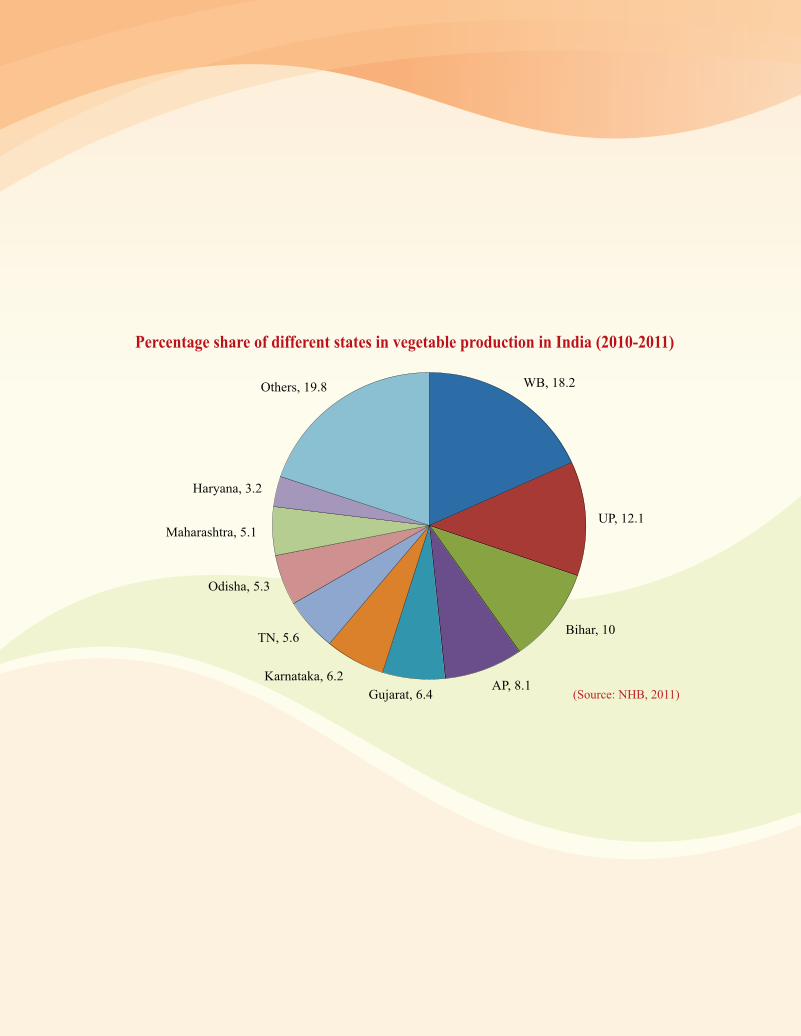
Percentage share of different states in vegetable production in India (2010-2011)
(Source: NHB, 2011)
gj dne] gj Mxjfdlkuksa dk gelQjHkkjrh; Ñd̀f"k vuqlaèkku ifj"kn
Extension Bulletin No. 50
M.H. Kodandaram
Sujoy Saha
A.B. Rai
Prakash S. Naik
Compendium on Pesticide
Use in Vegetables
Compendium on Pesticide
Use in Vegetables
Indian Institute of Vegetable Research
Varanasi - 221 305 (Uttar Pradesh)
(Indian Council of Agricultural Research)
Selectivity & Efficacy
Lab
el C
laim
Foo
d s
afet
y
Rational Pesticide
Use
Page 2
Technical Bulletin No. 51
Vegetable Statistics
S.M. VanithaS.N.S. Chaurasia
P.M. SinghPrakash S. Naik
Indian Institute of Vegetable Research(Indian Council of Agricultural Research)
Varanasi-221305, Uttar Pradesh (India)
Page 3
Technical Bulletin No. 51
Printed: March 2013, 500 copies
Correct citationVanitha, S.M., S.N.S. Chaurasia, P.M. Singh and Prakash S. Naik. 2013. Vegetable Statistics.TechnicalBulletin No. 51, IIVR, Varanasi, pp. 250.
Published byDr. Prakash S NaikDirectorIndian Institute of Vegetable ResearchPost Bag No. 01, Post Office: Jakhini (Shahanshahpur)Varanasi – 221 305, Uttar PradeshE-mail: [email protected]
Printed atNirmal Vijay Printer, New Delhi - 110 028Ph. : 45576780, M. : 98110 53617, E-mail: [email protected]
Page 4
Foreword
Vegetables are important constituents of Indian agriculture andnutritional security due to their short duration, high yield, nutritionalrichness, economic viability and ability to generate on-farm and off-farmemployment. Increasing per capita income, health consciousness,urbanization, increasing working women, shifting of farmers to high valuevegetables due to higher income, favourable income elasticity of demandand annual growth rate for vegetables are also important ingredients forfuelling vegetable growth in the country.
Though India is the second largest producer of vegetables in theworld, non-availability of statistical data for many crops at one place is a major bottleneck incritical analysis of issues and policy planning. I appreciate the efforts made by the Indian Instituteof Vegetable Research, Varanasi to compile important vegetable data from different sources inthis document. In addition to the general information on Indian agriculture/horticulture, thecompilation includes detailed vegetable statistics on area, production, productivity, and trade ofmajor vegetable crops in India and world.
The panel data compiled from different sources and documented in this bulletin entitled“Vegetable Statistics” will be of immense use for the researchers, policy makers, students andentrepreneurs.
(N.K. Krishna Kumar)Deputy Director General (Horticulture)Indian Council of Agricultural Research
New Delhi
Page 6
Preface
Horticulture is the fastest growing sector within Indian agriculture. There has been aperceptible change in the consumption pattern characterized by declining share of food grainsand increasing share of non-food grain items in the consumption baskets particularly fruits andvegetables. Consequently, horticulture is set to assume a greater role and importance within theagriculture sector and eventually in the national economy. However, there is a serious problemconcerning reliability of horticulture data which is one of the most critical requirements to facilitatesystematic policy analysis and planning exercise. Multiple agencies are involved in producinghorticultural data that often varies. This may perhaps be due to the complexities andmethodologies of data collection in horticultural crops. It is not just the basic data like area,production or productivity but the whole gamut of related data like storage infrastructure, marketarrivals, prices, exports etc is required to be collected and compiled to develop integrated database which is extremely important in the present era of globalization and integration of markets.
An attempt has been made in this bulletin to compile available statistics on vegetables grownin India and other countries in order to provide all information at one place. In addition to thelatest available statistics on major vegetable crops from different sources, general information onIndian economy, agriculture and key indicators has also been included. The bulletin has beendivided into 5 sections namely an overview, general information on Indian economy & agriculture,horticultural scenario, vegetable statistics at a glance and crop-wise vegetable statistics. We believethat the information compiled and presented in this bulletin could be of immense interest anduse to various stakeholders.
Information obtained/compiled from various organizations and sources is duly acknowledged.We express our sincere thanks to Dr. V. K. Bhatia, Director, IASRI, New Delhi for sharing theavailable data and his valuable guidance.
S.M. Vanitha, S.N.S. Chaurasia, P.M. Singh and Prakash S. Naik
Page 7
Abbreviations
- Nil MP Madhya Pradesh% Per cent MT Million tonnes‘000 Thousand NHB National Horticulture BoardA Area NHM National Horticulture MissionAE Advance estimates PE Provisional estimatesA&N Andaman & Nicobar PPP Purchasing power parityACGR Annual compound growth rate Pr ProductionAEZ Agri Export Zone K Cal KilocaloriesAr Arrival kg KilogramBRICS Brazil, Russia, India, China, South Africa km KilometerCAB Current account balance MHa Million hectaresCPI Consumer price index MoA Ministry of AgricultureDAP Diammonium phosphate MOP Muriate of potashDES Directorate of Economics and Statistics MP Madhya PradeshDMI Directorate of Market Intelligence MT Million tonnesEU European Union NHB National Horticulture BoardFAO Food and Agriculture Organization NHM National Horticulture MissionG Gram PE Provisional estimatesGCF Gross capital formation PPP Purchasing power parityGDP Gross domestic product Pr ProductionGOI Government of India Q QuintalGSDP Gross state domestic product QE Quick estimatesha Hectares Qty QuantityHP Himachal Pradesh T TonnesIASRI Indian Agricultural Statistics Research Institute TN Tamil NaduPy Productivity UK United kingdomICAR Indian council of Agricultural Research UP Uttar PradeshJ&K Jammu & Kashmir US United statesK Cal Kilo calories US $ US dollarkg Kilogram UTs Union Territorieskm Kilo meter WB West BengalMHa Million hectares WP Wholesale priceMoA Ministry of Agriculture WPI Wholesale price indexMOP Muriate of potash Y Yield
Page 8
ContentsPeriod Page
ForewordPrefaceAbbreviations
An overview 1
Section-I: General Information on Indian Economy and AgricultureTable 1.1 : Key indicators of Indian economy. 2006 -2012 7Table 1.2 : Key census statistics of India. 1971-2011 7Table 1.3 : Sectoral composition of GDP (%). 1950-2012 8Table 1.4 : India’s percent share in world GDP. 1980-2010 8Table 1.5 : State wise statistics of India. 2011 9Table 1.6 : Gross domestic product from agriculture and allied 1954-2012 10
sector and its percentage share to total GDP.Table 1.7 : Continent-wise agricultural and rural population 2000-2010 11
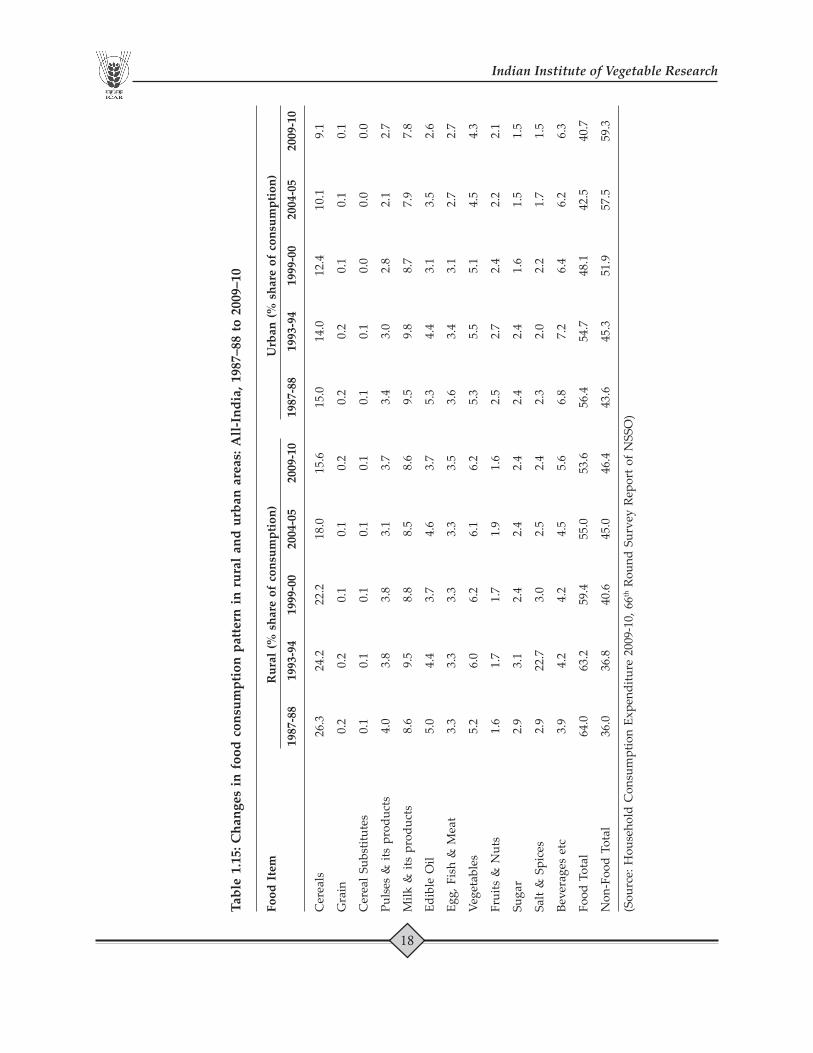
in the world.Table 1.8 : Rural population and agricultural workers. 1951-2011 11Table 1.9 : Land statistics of India. 1990-2009 12Table 1.10 : Land use classification in India. 1950-2010 13Table 1.11 : Area under broad soil groups. 2011 14Table 1.12 : Water statistics of India. 2010 15Table 1.13 : State-wise inland water resources in India. 2011-2012 16Table 1.14 : Yearly performance of monsoon in India. 1992-2011 17Table 1.15 : Changes in food consumption pattern in rural and 1987-2010 18
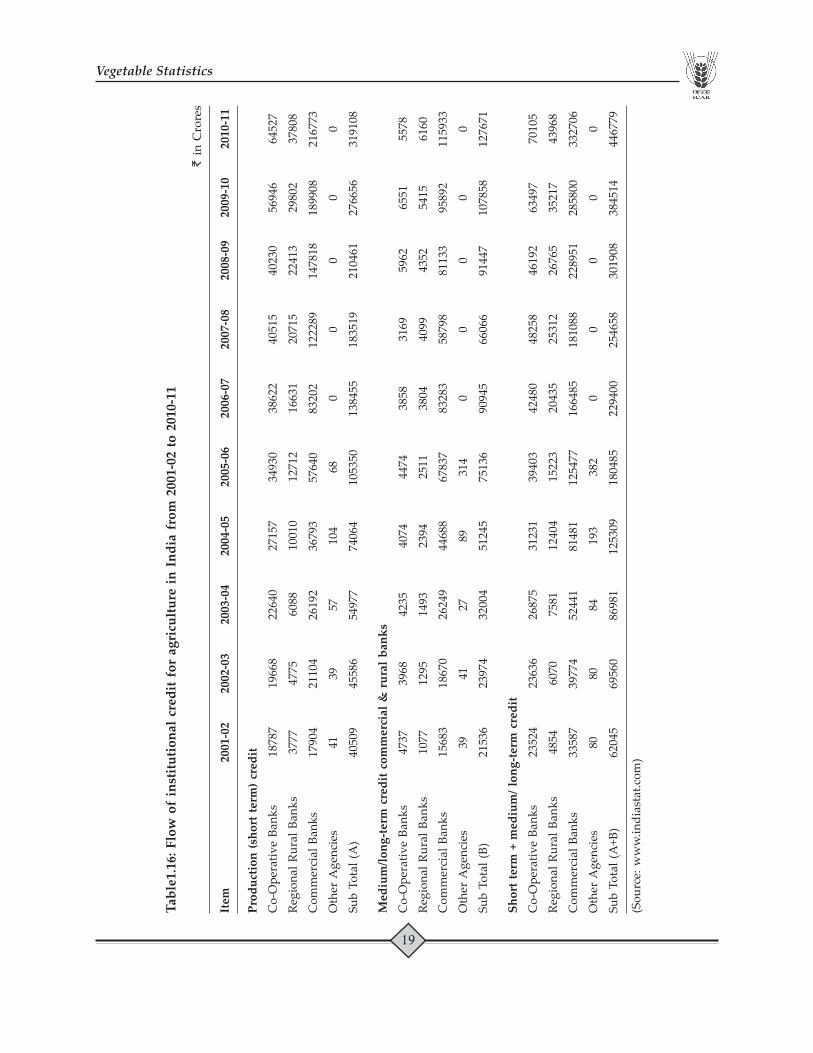
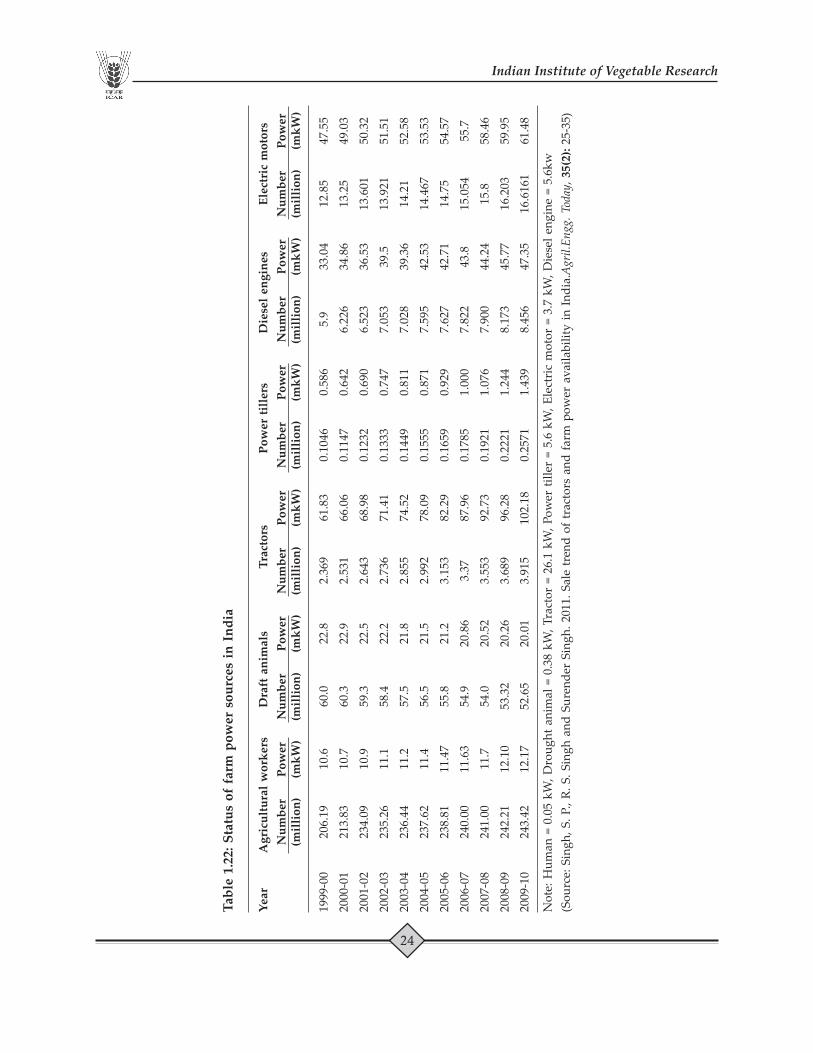
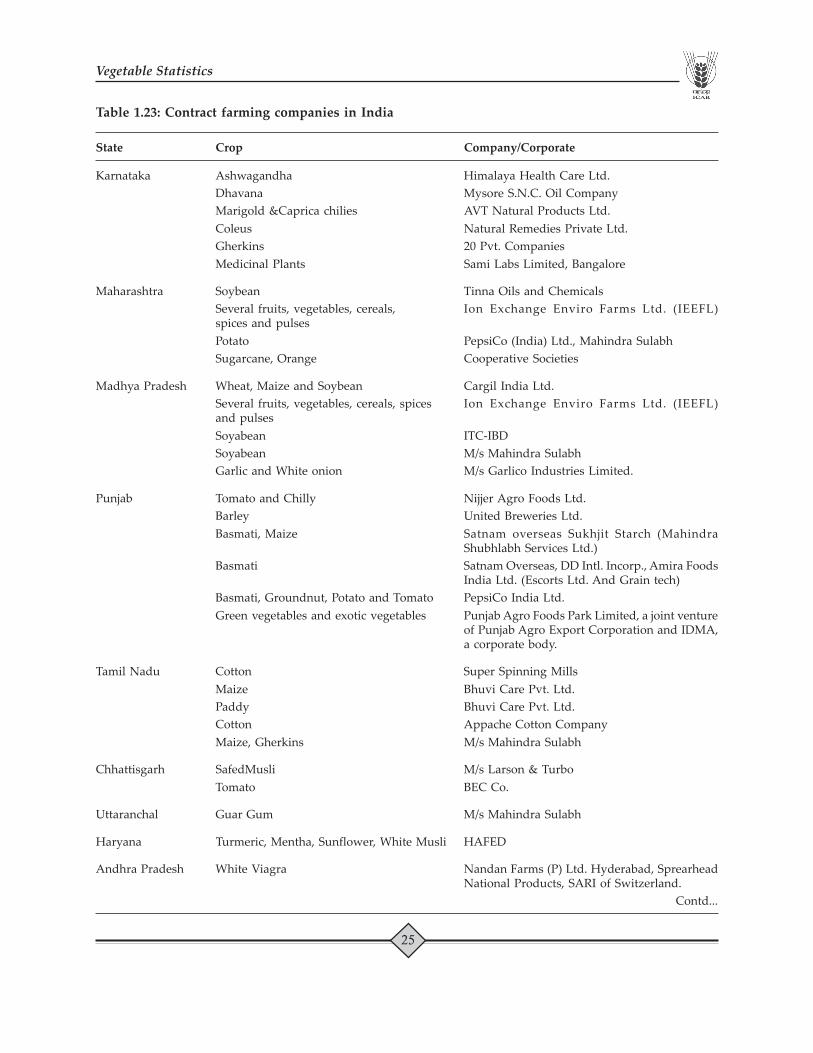
urban areas.Table 1.16 : Flow of institutional credit for agriculture in India. 2001-2011 19Table 1.17 : India’s position in world agriculture. 2008 20Table 1.18 : Indices for agricultural production in India. 1980-2012 21Table 1.19 : Area under principal crops in India (1950-51 to 2009-10) 1950-2010 22Table 1.20 : Fertilizer use in India. 1999-2011 23Table 1.21 : Pesticide use in India. 2003-2011 23Table 1.22 : Status of farm power sources in India. 1999-2010 24Table 1.23 : Contract farming companies in India. 2011 25
Page 9
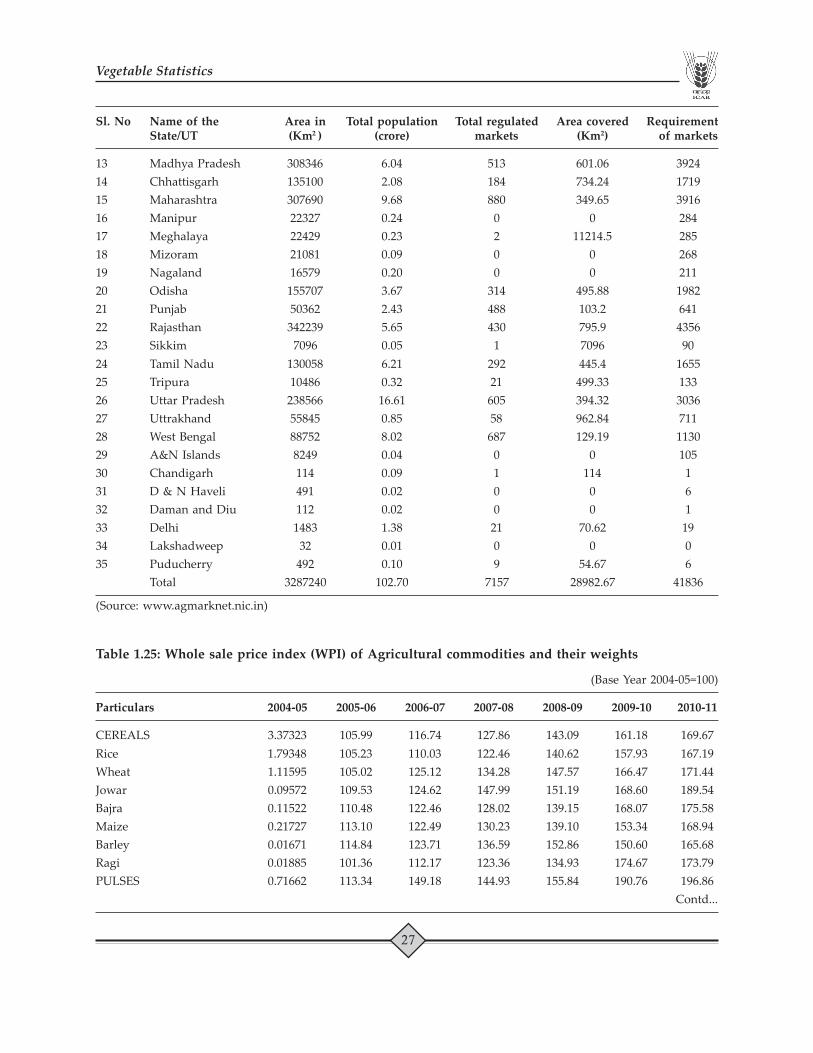
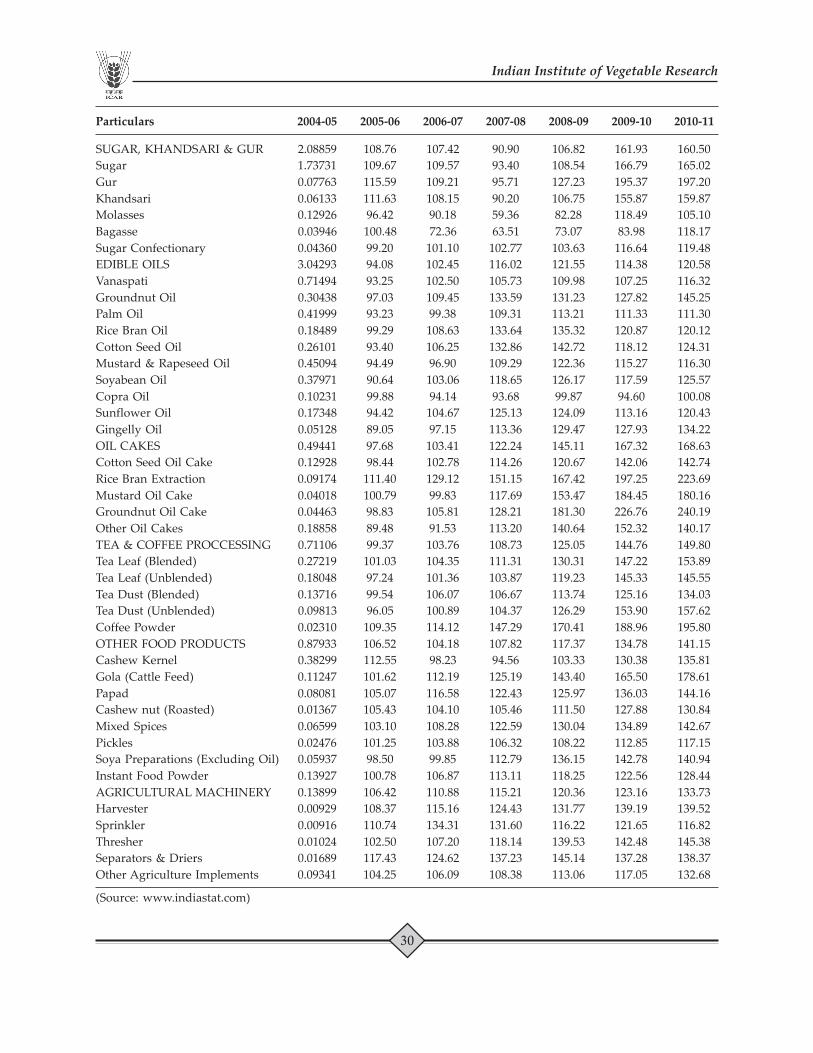
Table 1.24 : Agricultural produce markets in India. 2009-2010 26Table 1.25 : Whole sale price index (WPI) of agricultural 2005-2011 27
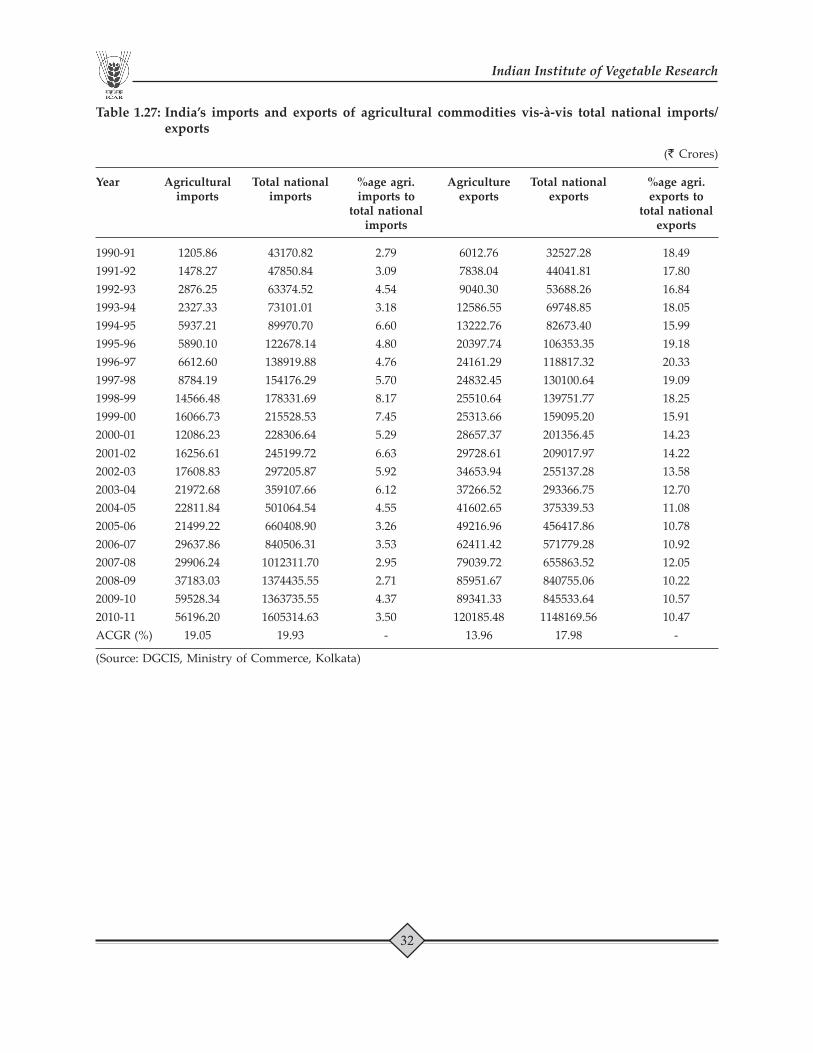
commodities and their weights.Table 1.26 : Export of agricultural products from India. 2008-2011 31Table 1.27 : India’s imports and exports of agricultural 1990-2011 32
commodities vis-à-vis total national imports/ exports.
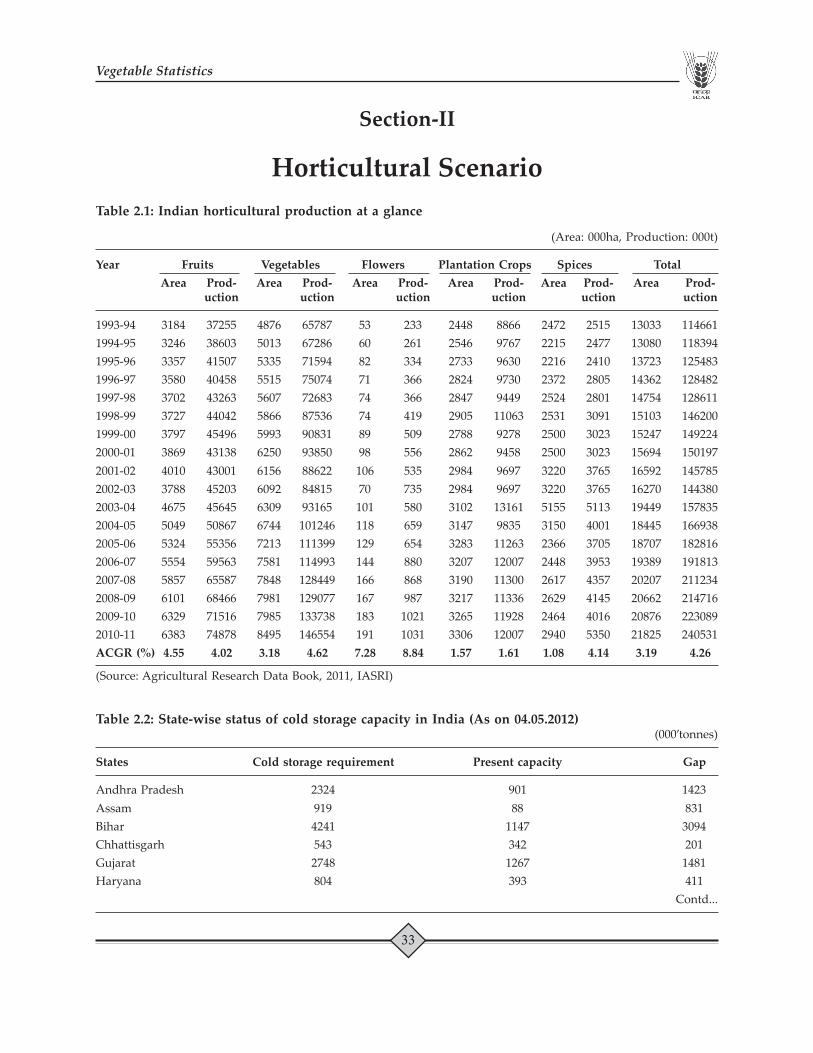
Section-II: Horticultural ScenarioTable 2.1 : Indian horticultural production at a glance 1993-2011 33Table 2.2 : State-wise status of cold storage capacity in India. 2012 33Table 2.3 : State-wise grading facilities in India. 2012 34Table 2.4 : State-wise marketing facilities in India. 2012 35Table 2.5 : State-wise fruits & vegetable processing units and 2007 36
their installed capacities in India.Table 2.6 : Monthly wholesale price index (WPI) of fruits and 1990-2012 37
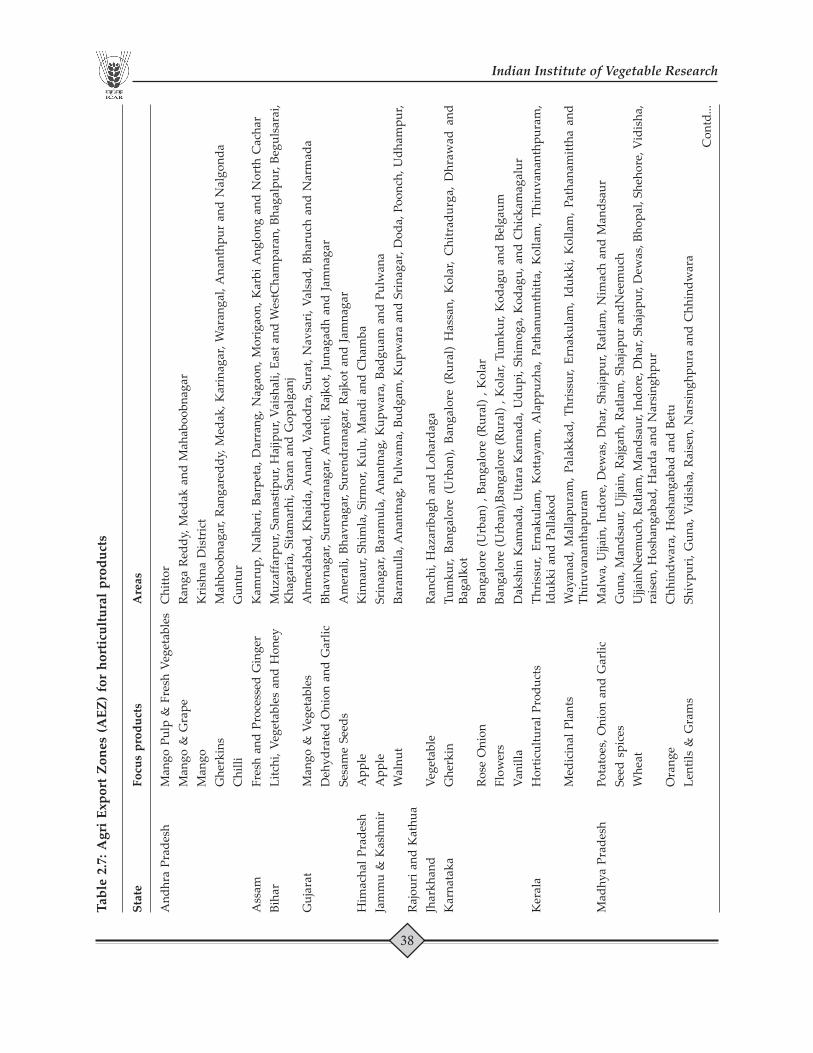
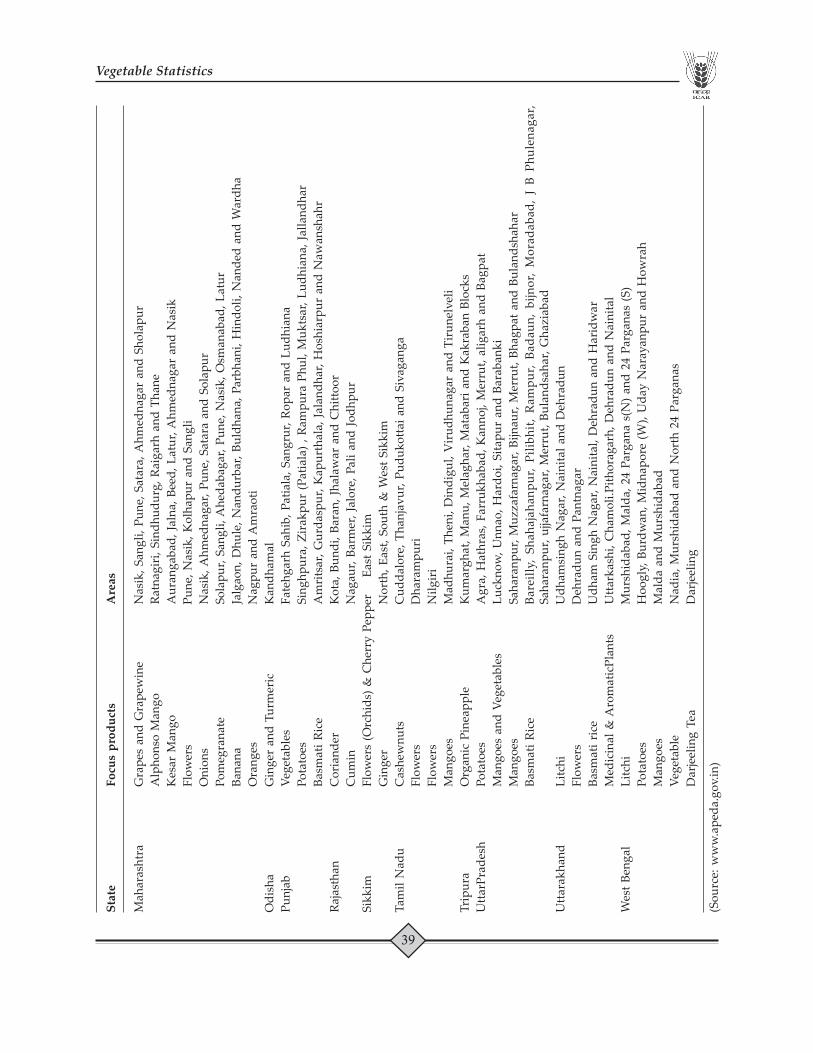
vegetables in India.Table 2.7 : Agri Export Zones (AEZ) for horticultural products. 2011 38Table 2.8 : Export of horticultural products from India. 2006-2011 40Table 2.9 : Per cent export share of major horticultural crops. 2007-2011 41Table 2.10 : Progress under national horticulture mission (NHM) 2010-2011 41
in India.
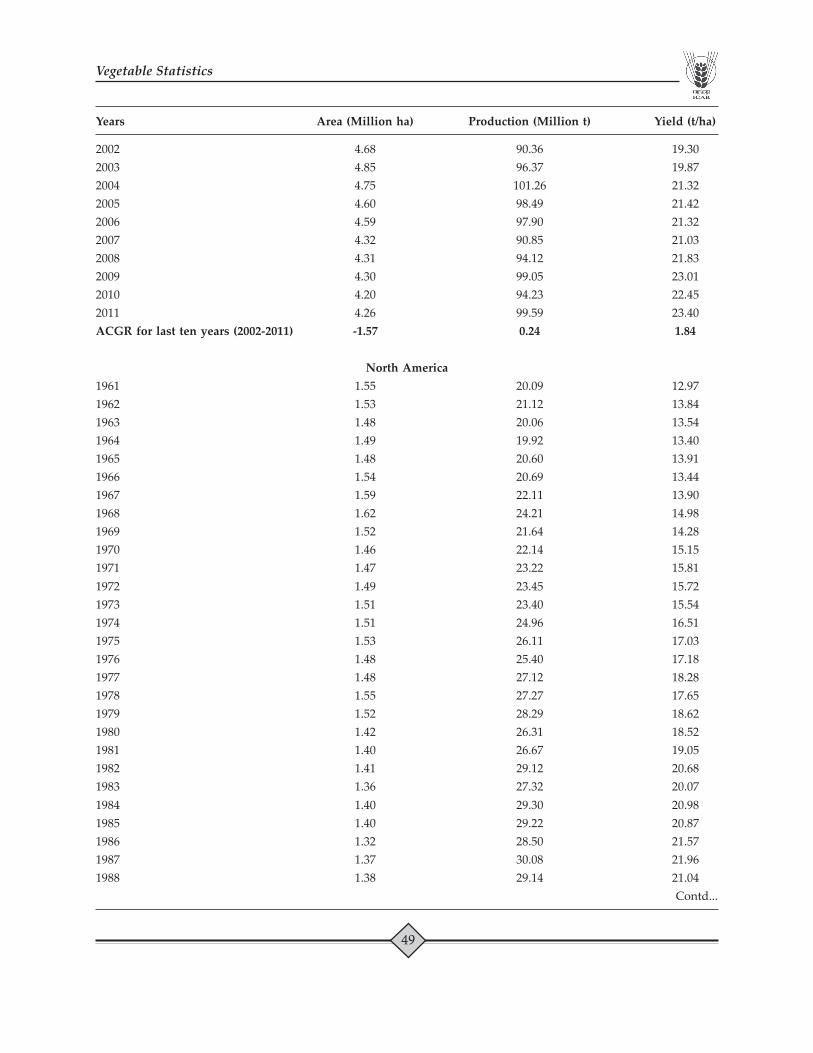
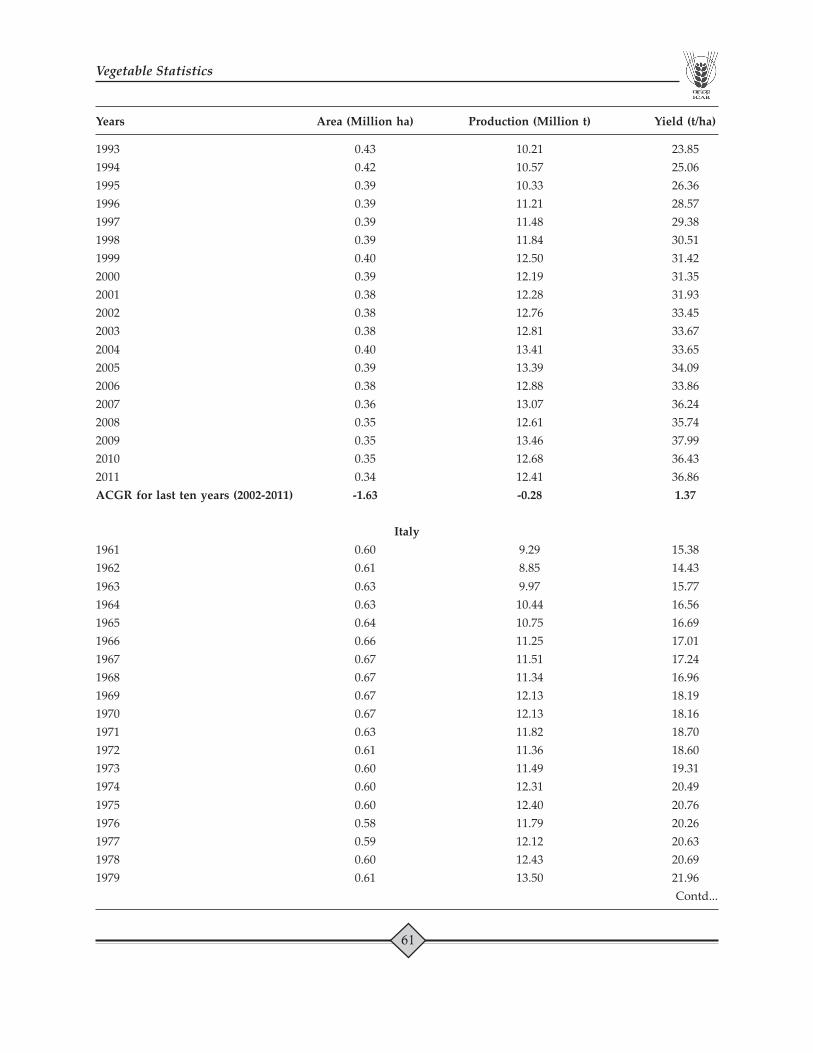
Section-III: Vegetable Statistics at a GlanceTable 3.1 : Area, production and yield of vegetables in world 1961-2011 42
and India.Table 3.2 : Decade-wise annual compound growth rate (ACGRs) 1961-2011 43
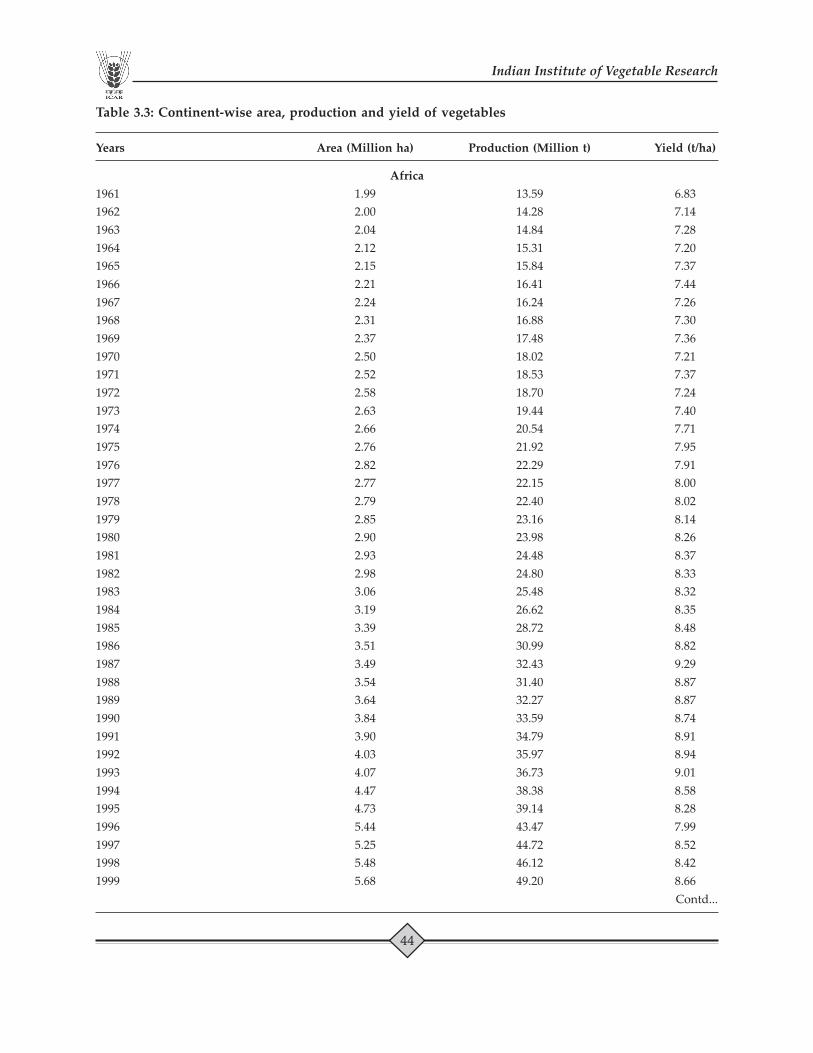
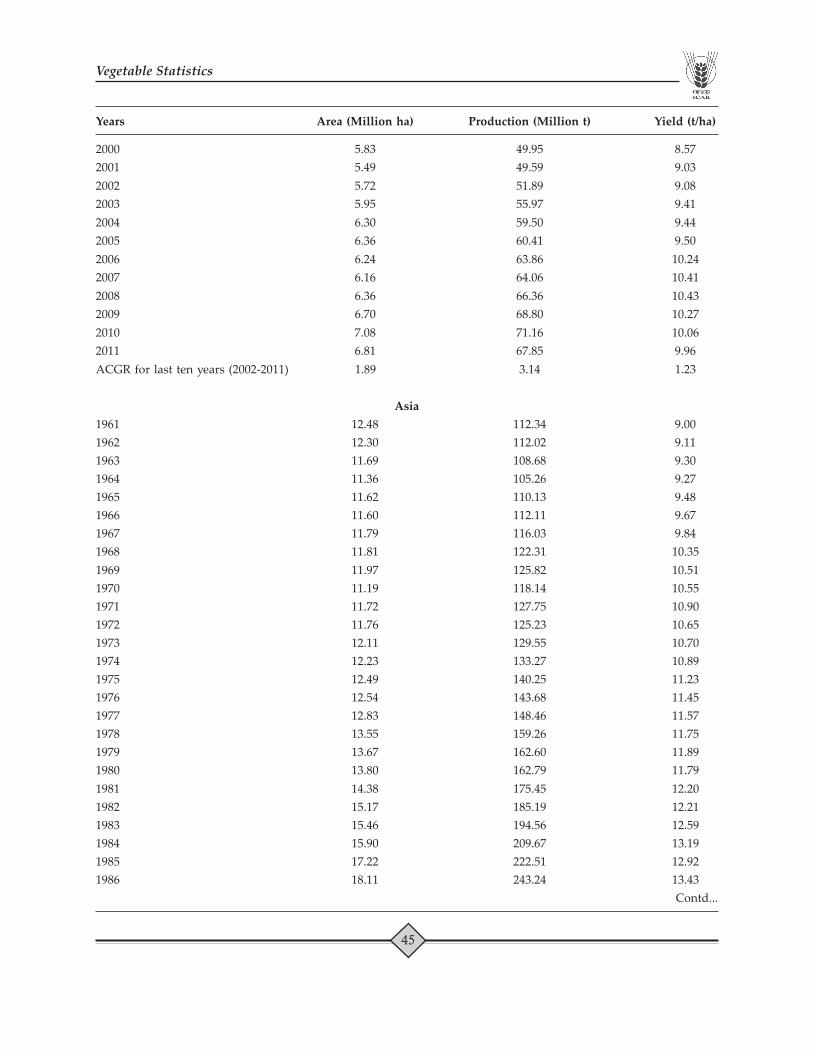
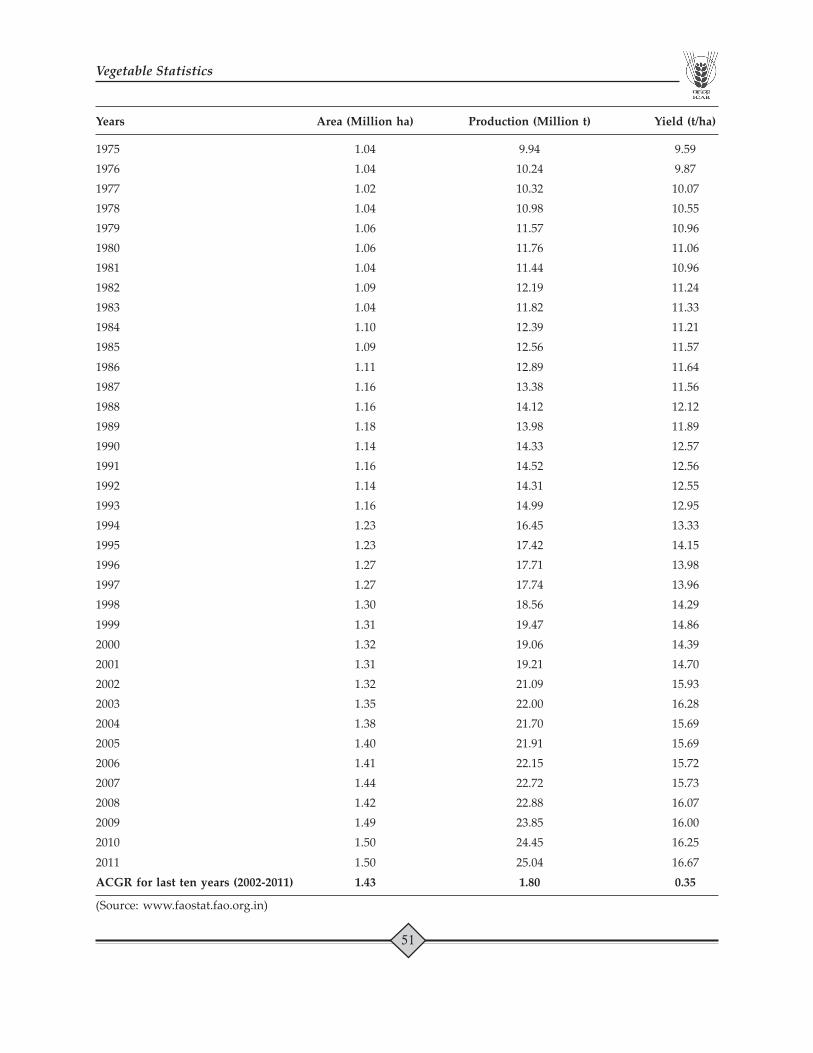
in area, production and yield of vegetables in the world.Table 3.3 : Continent-wise area, production and yield of vegetables 1961-2011 44
(Africa, Asia, Australia, Europe, North America andSouth America)
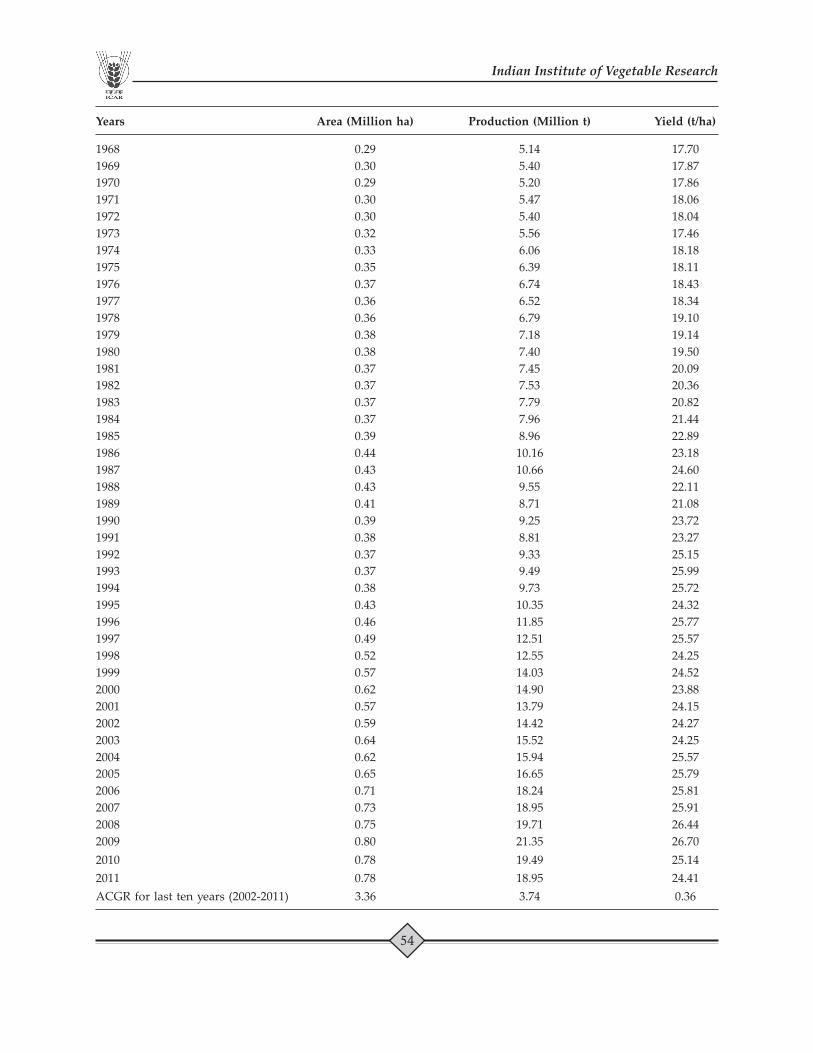
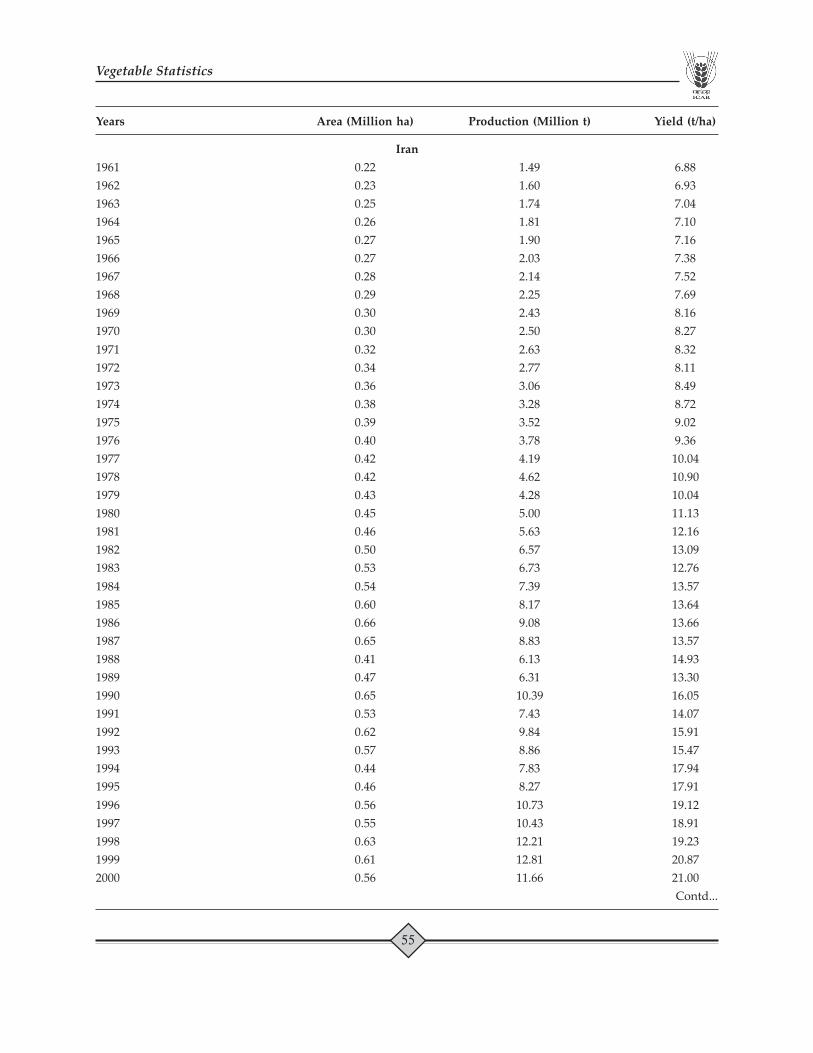
Table 3.4 : Major vegetables producing countries in the world. 2010-2011 52Table 3.5 : Area, production and yield of vegetables in leading 1961-2011
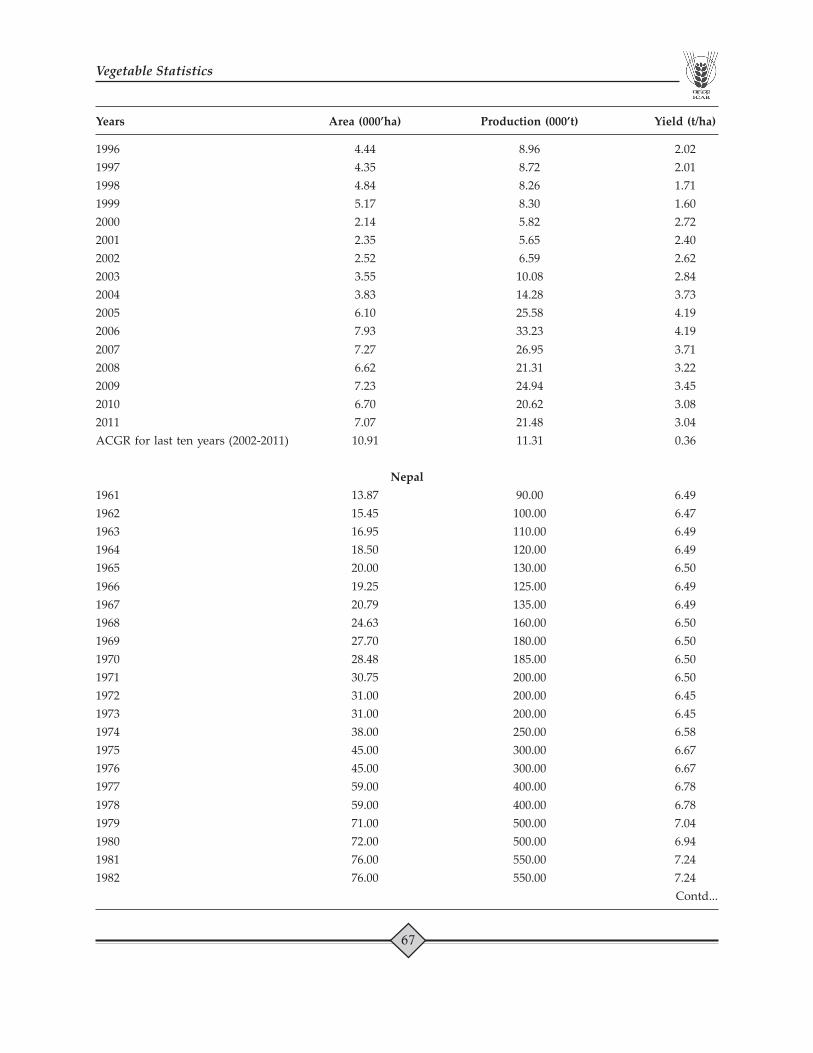
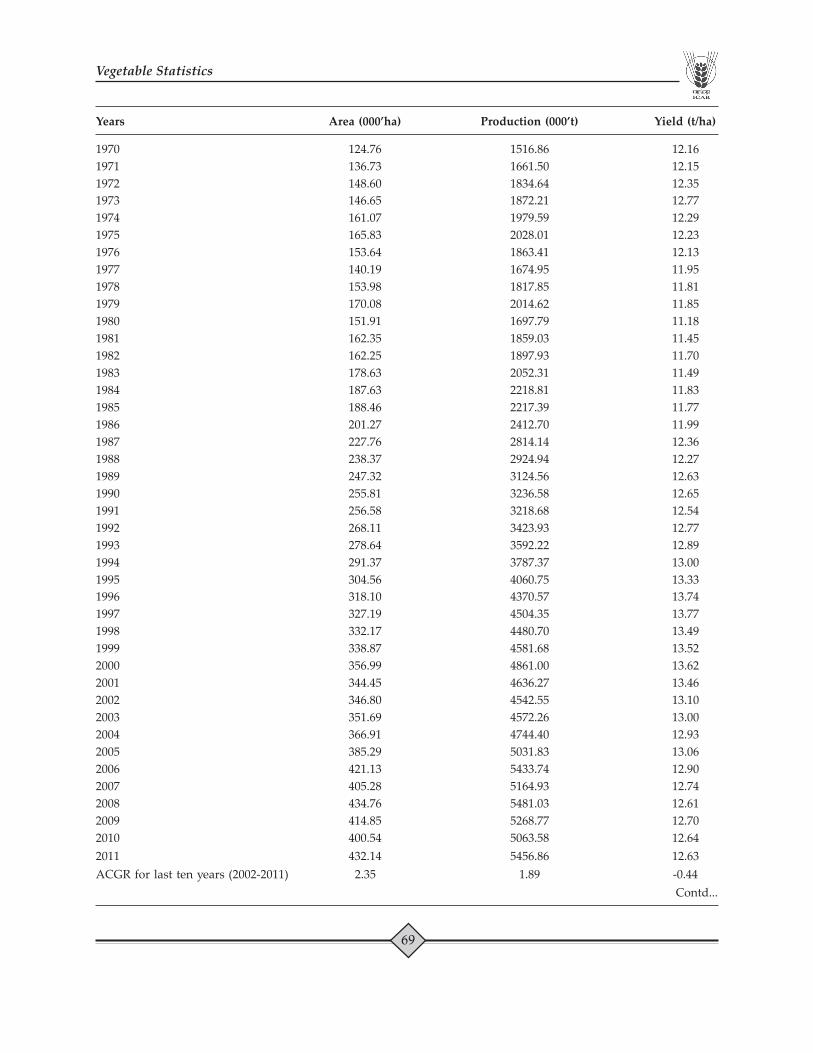
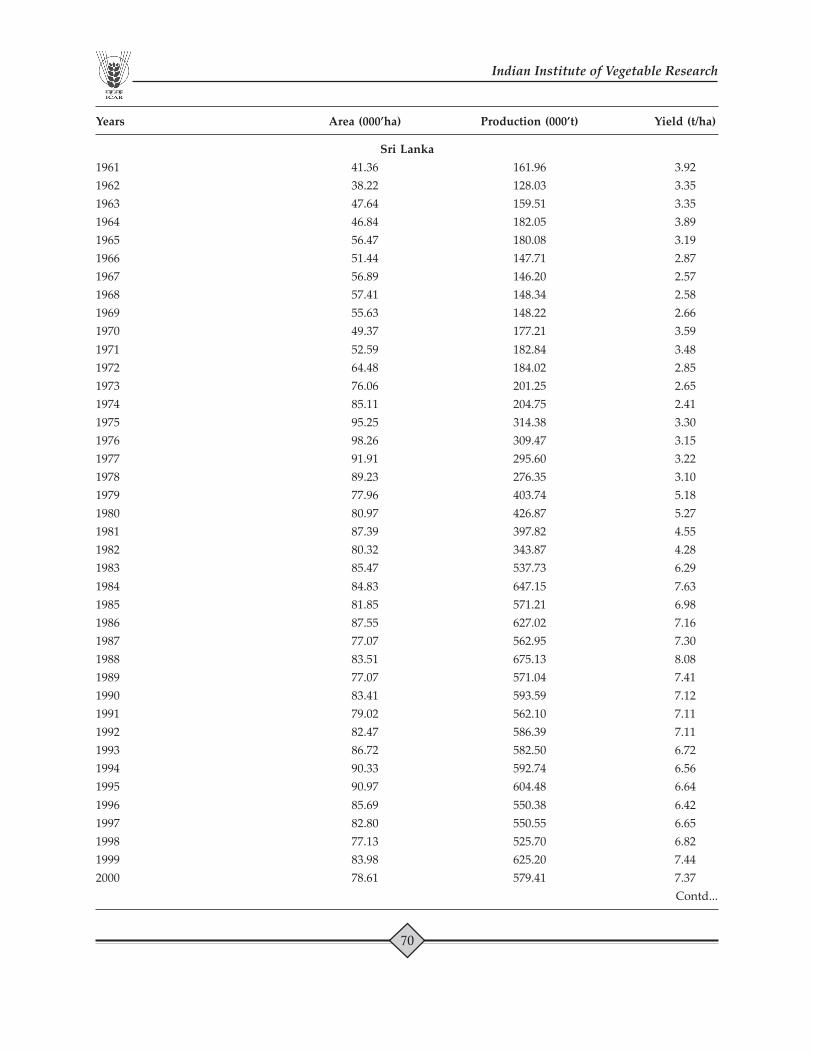
vegetable growing countries.Table 3.6 : Area, production and yield of vegetables in SAARC 1961-2011 63
countries.Table 3.7 : Year-wise area, production and productivity of 1987-2011 71
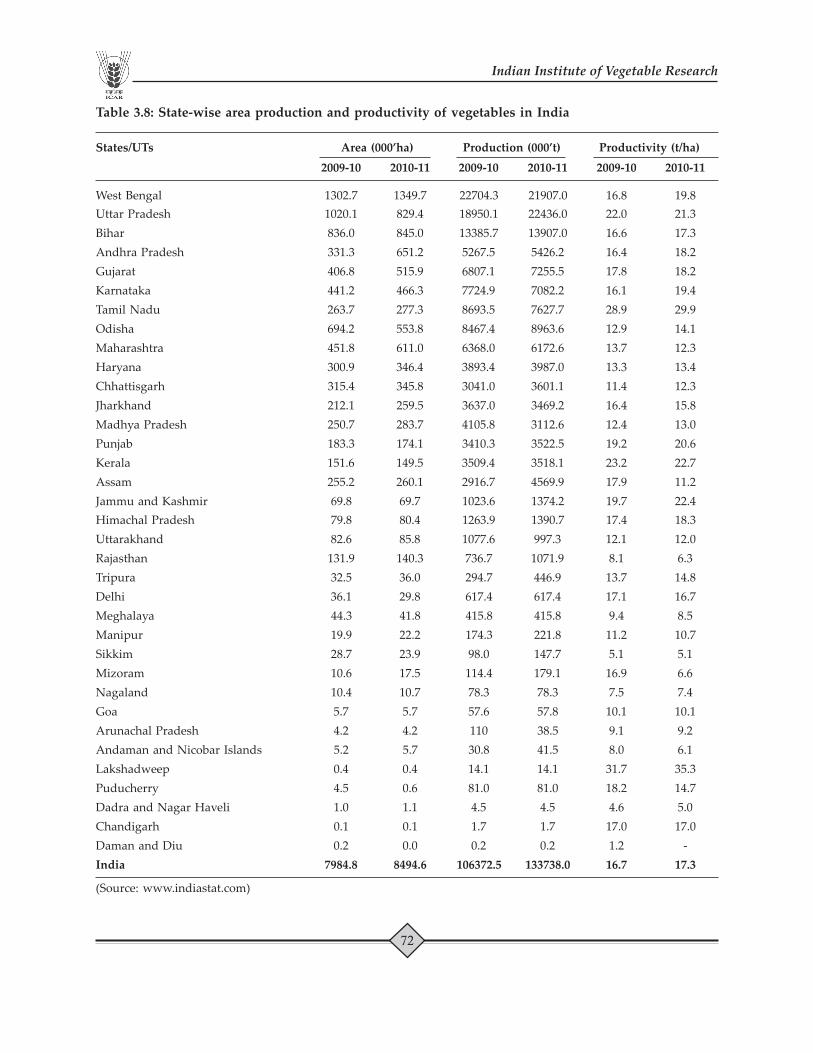
vegetables in India.Table 3.8 : State-wise area production and productivity of 2009-2011 72
vegetables in India.Table 3.9 : Area, production and productivity of major vegetables 2001-2011 73
in India.
Page 10
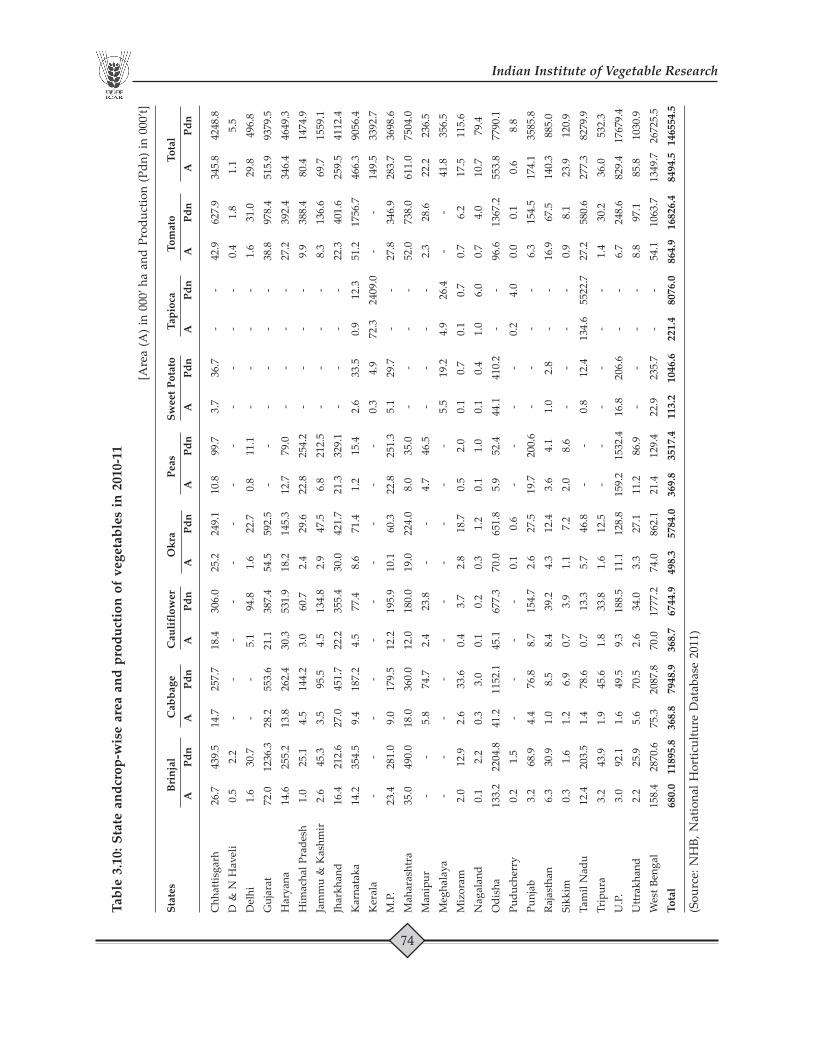
Table 3.10 : State and crop-wise area and production of vegetables. 2010-2011 74Table 3.11 : Different profitable crop rotations for irrigated areas of 75
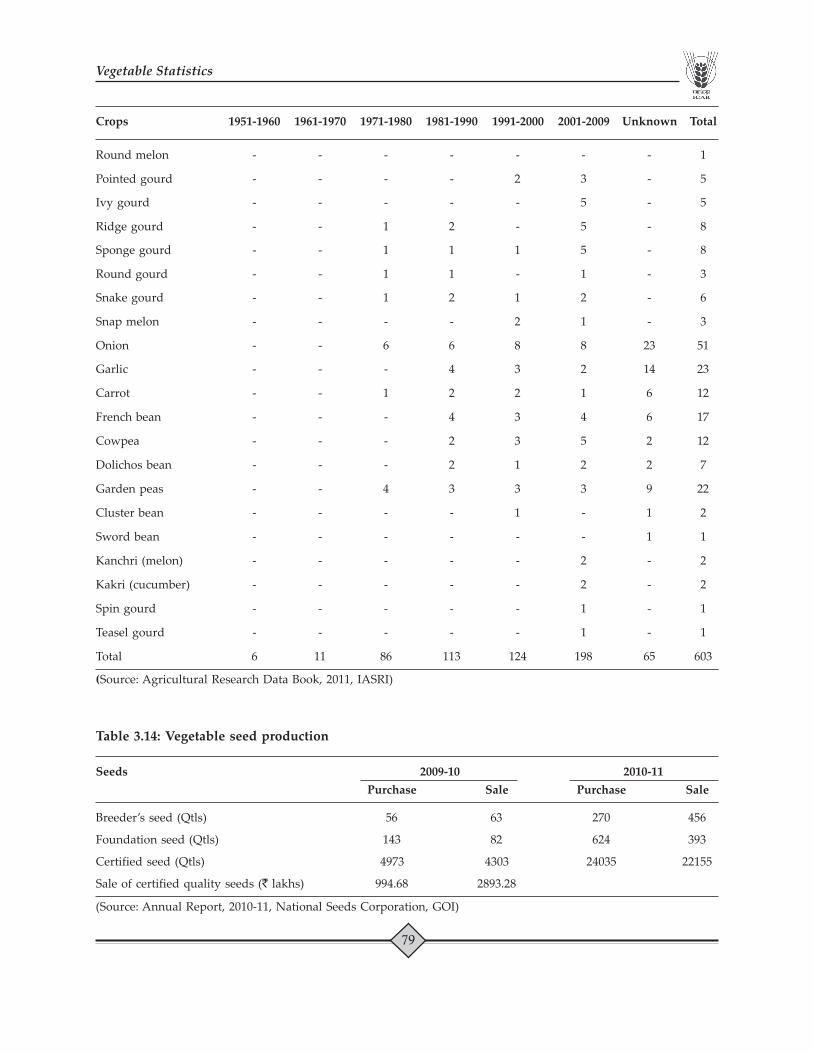
Indo-Gangetic plains.Table 3.12 : Vegetable based profitable crop rotations. 77Table 3.13 : Number of vegetable varieties released. 1951-2009 78Table 3.14 : Vegetable seed production. 2009-2011 79Table 3.15 : Post-harvest losses in vegetables at different stages. 80Table 3.16 : Post-harvest losses in vegetables at grower, wholesaler 80
and retailer levels.Table 3.17 : Monthly wholesale price index (WPI) of vegetables 1990-2012 81
in India.Table 3.18 : Monthly per capita consumption of vegetables & 2009-2010 82
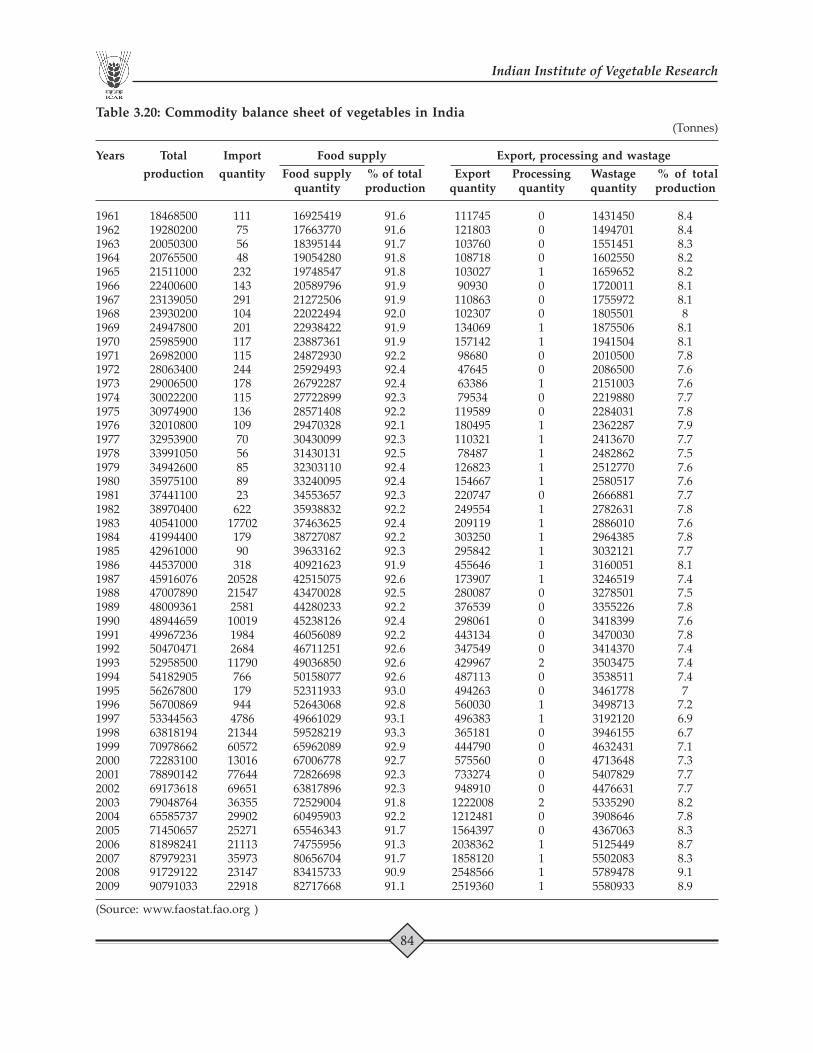
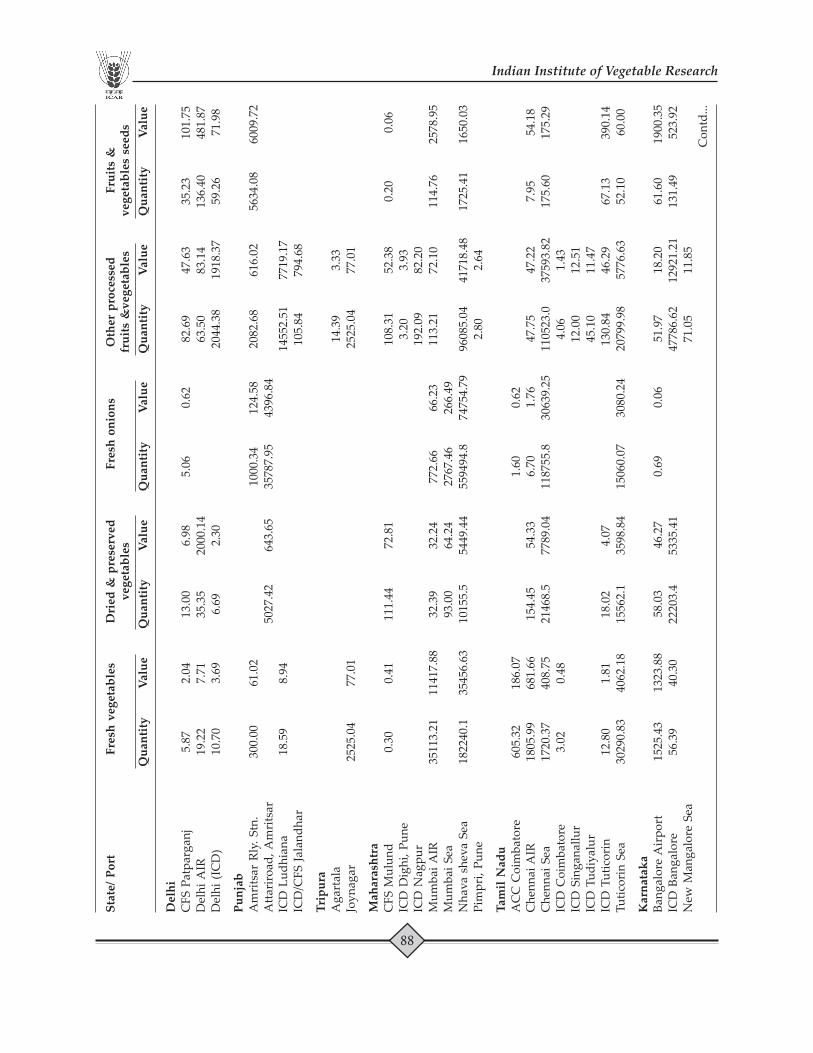
its products in India.Table 3.19 : Food and nutrient supply from vegetables in India. 1961-2009 83Table 3.20 : Commodity balance sheet of vegetables in India. 1961-2009 84Table 3.21 : India’s import of vegetable seeds. 2007-2008 85Table 3.22 : Export of radish seeds from India. 2008-2011 86Table 3.23 : Export of other vegetable seeds from India. 2008-2011 86Table 3.24 : Export specifications of vegetables. 2011 86Table 3.25 : State/Port-wise exports of fresh and processed 2010-2011 87
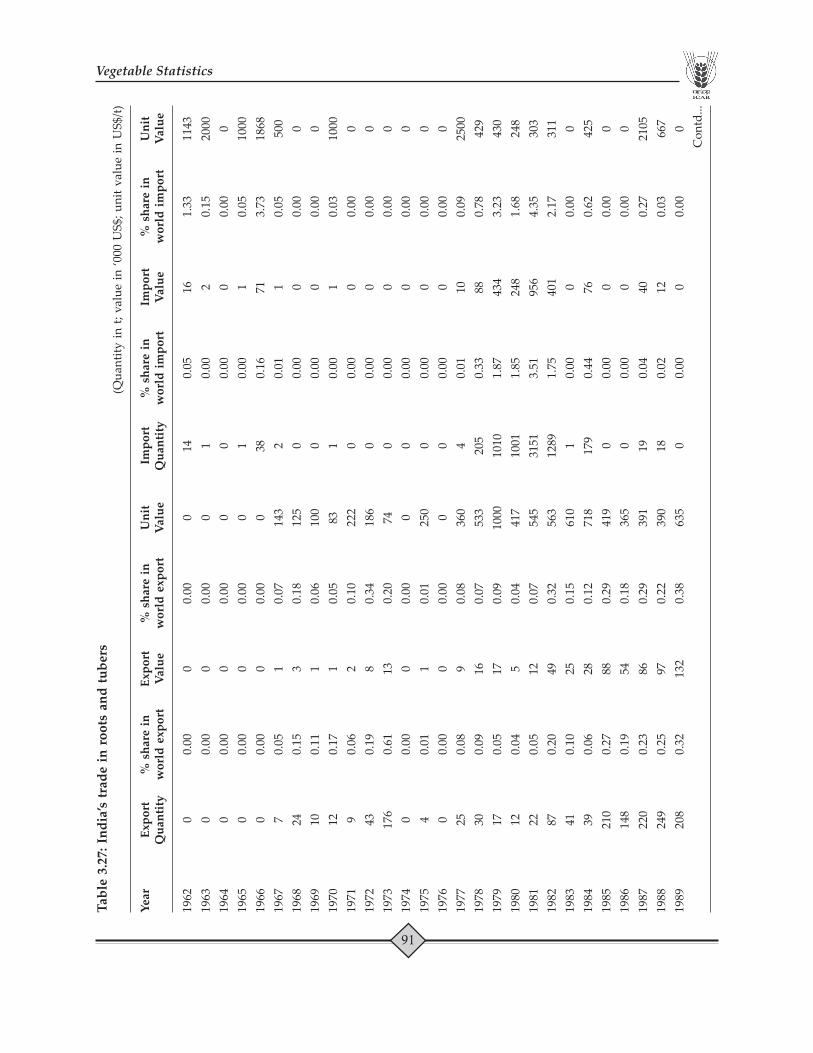
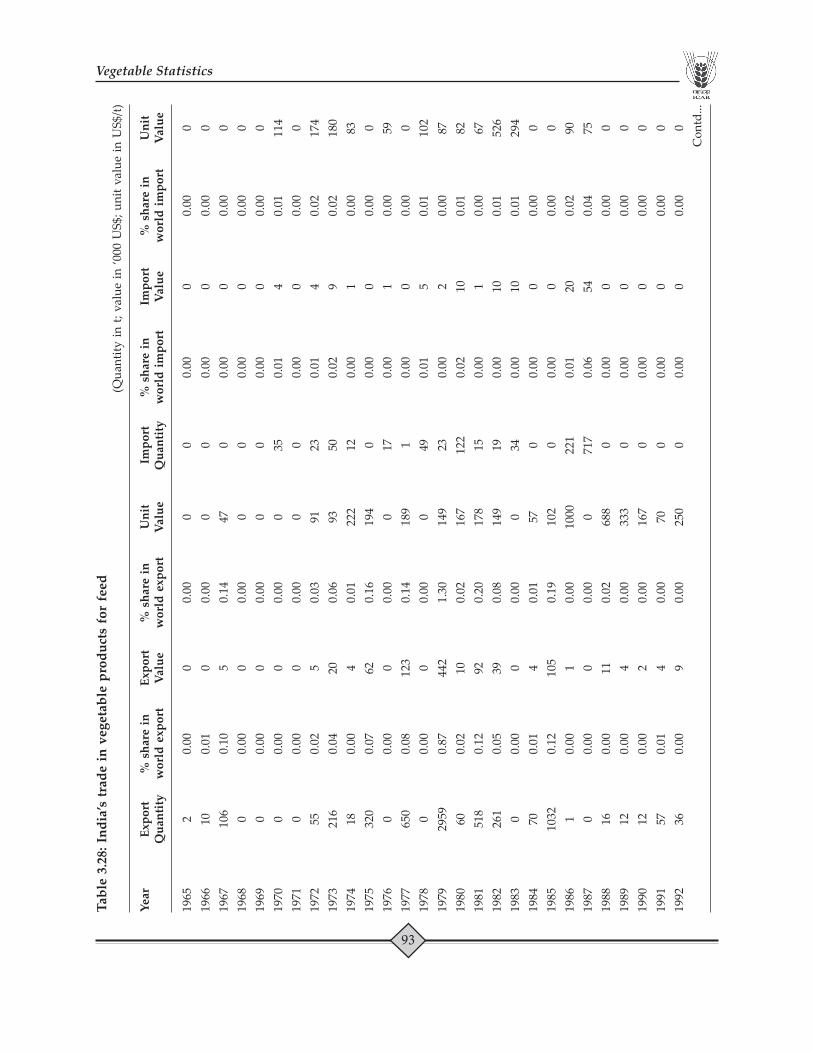
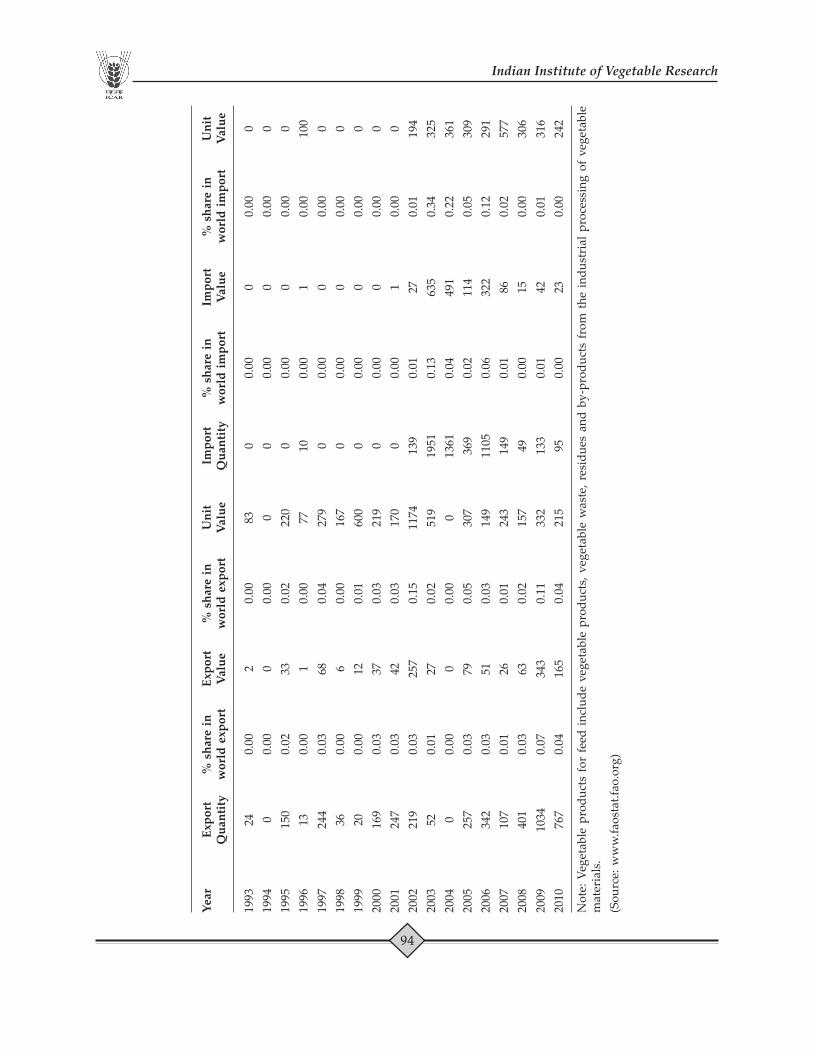
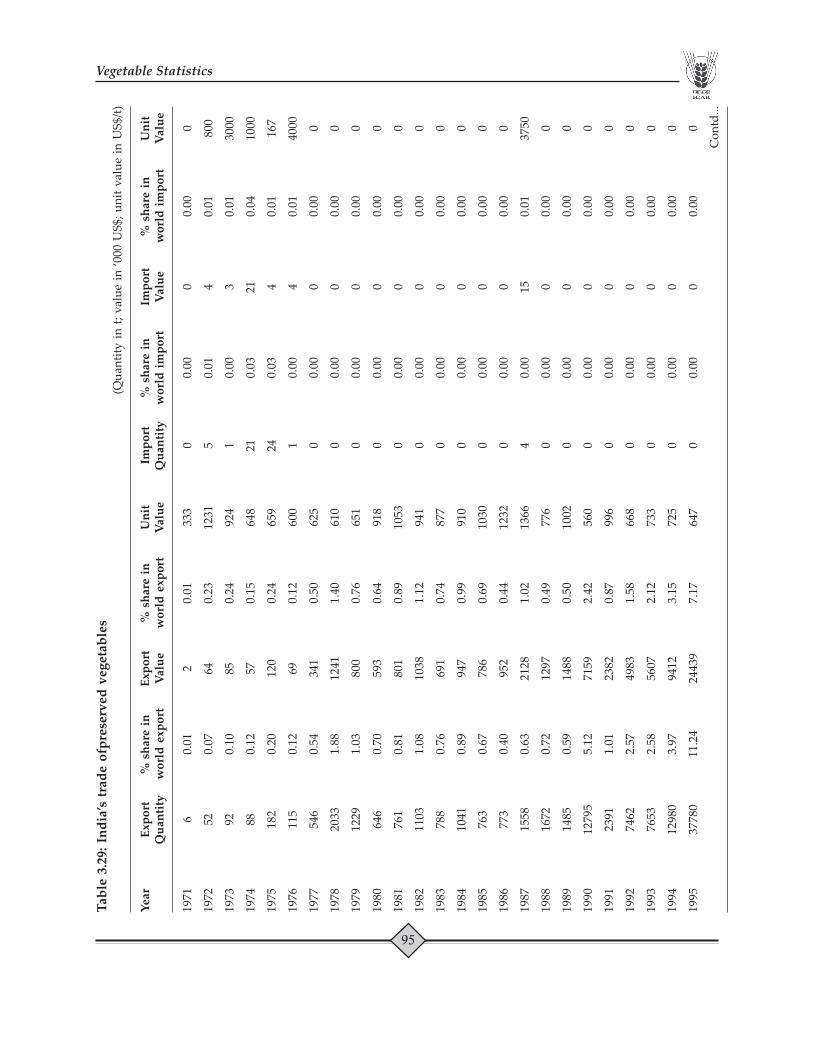
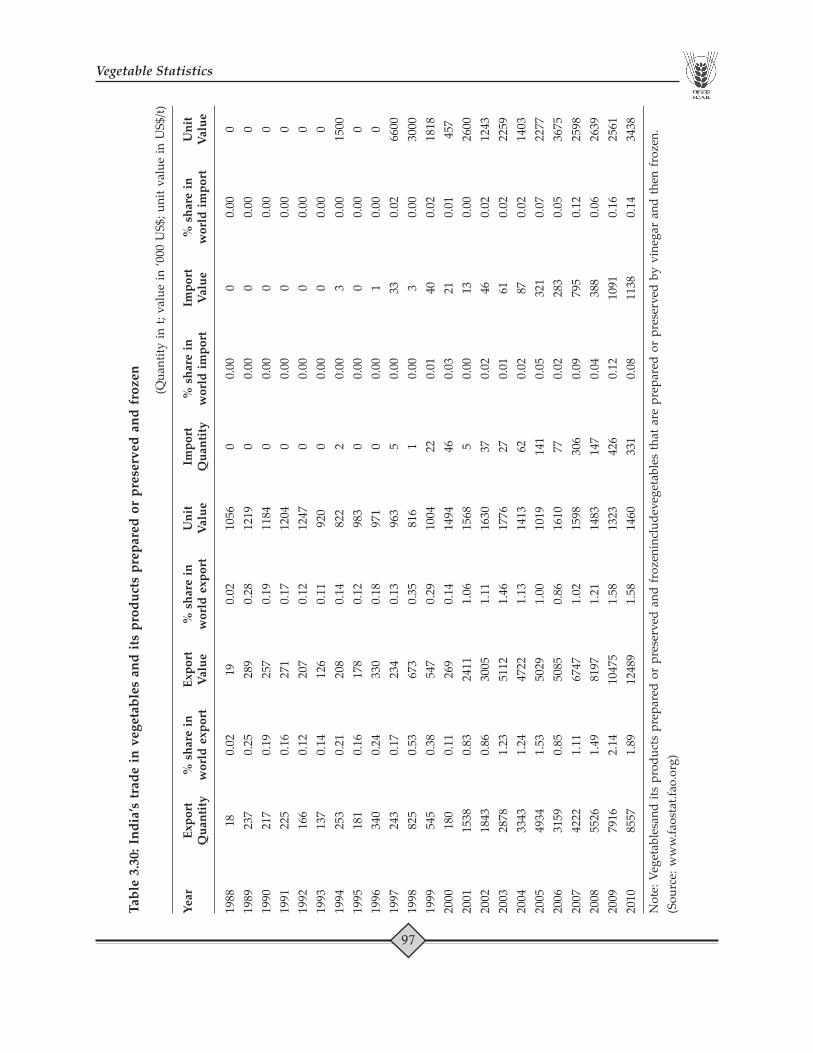
vegetables.Table 3.26 : India’s trade in leguminous vegetables. 1987-2010 90Table 3.27 : India’s trade in roots and tubers. 1962-2010 91Table 3.28 : India’s trade in vegetable products for feed. 1965-2010 93Table 3.29 : India’s trade of preserved vegetables. 1971-2010 95Table 3.30 : India’s trade in vegetables and its products prepared 1988-2010 97
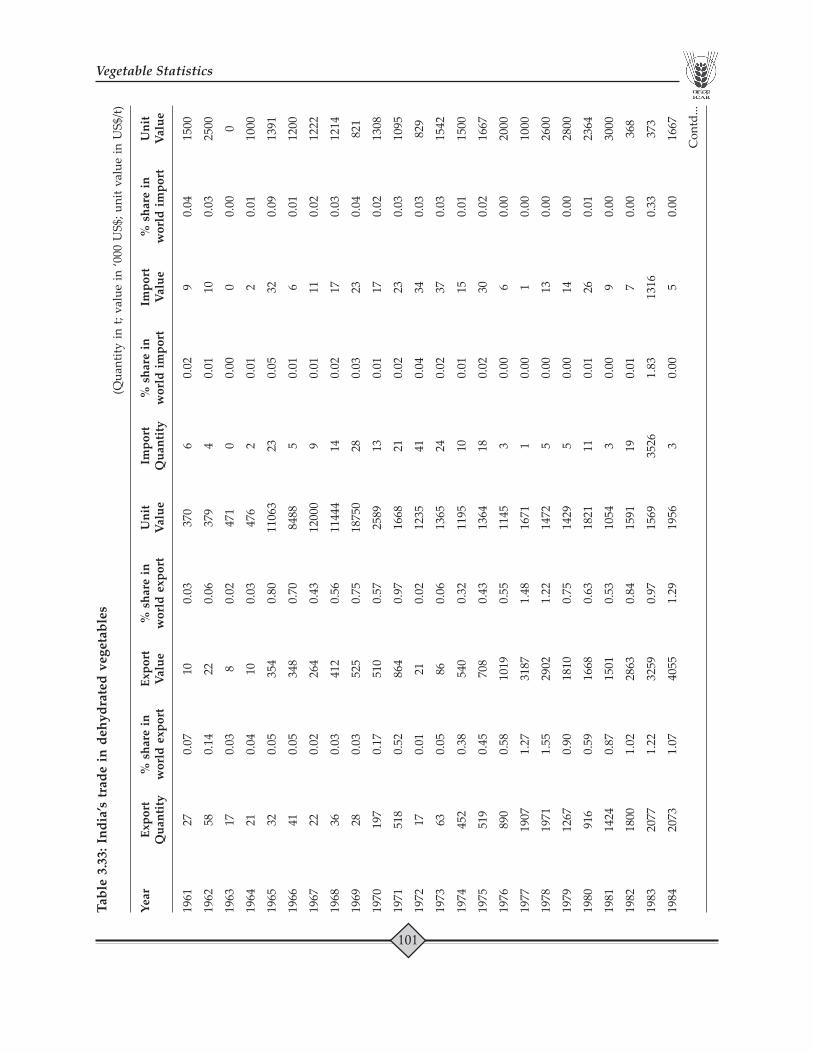
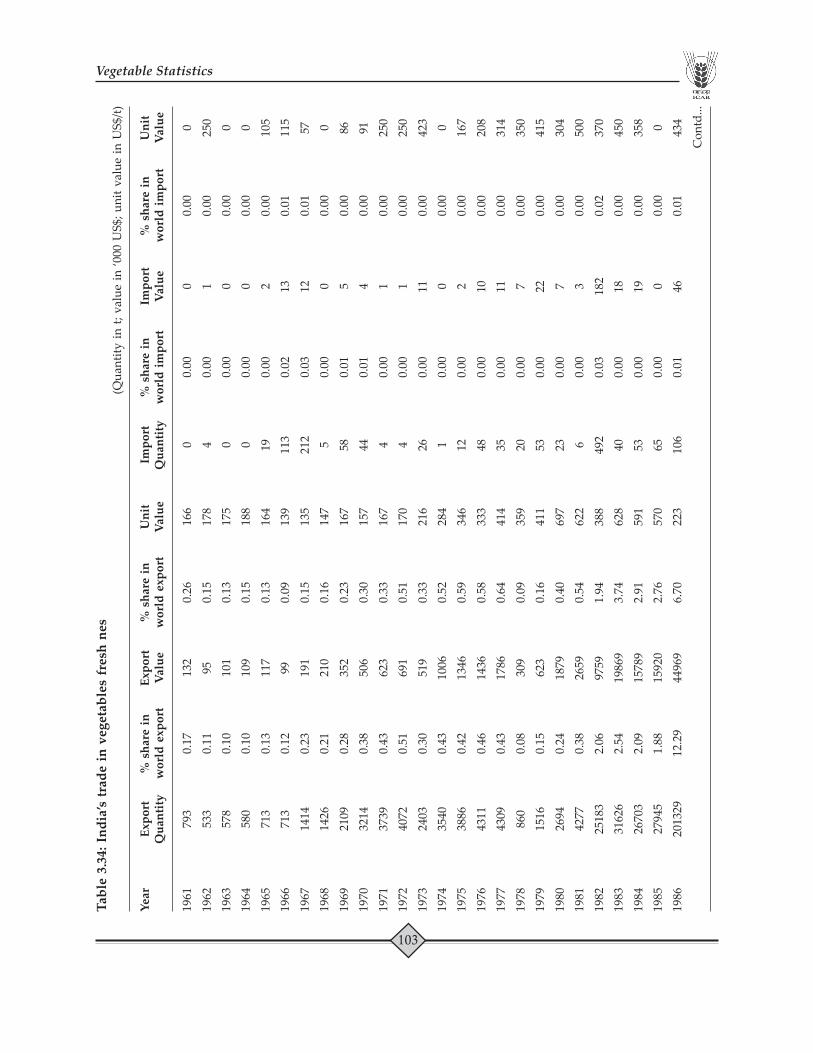
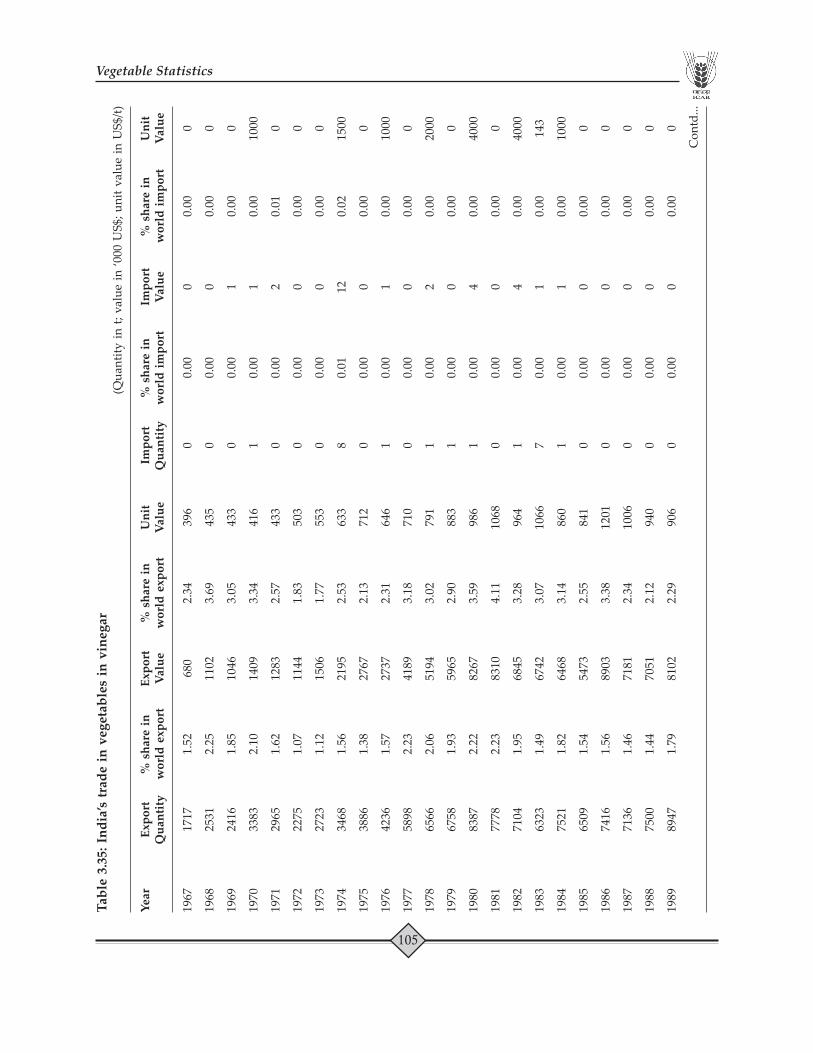
or preserved and frozen.Table 3.31 : India’s trade in vegetable products (Fresh or dried). 1971-2010 98Table 3.32 : India’s trade in frozen vegetables. 1975-2010 100Table 3.33 : India’s trade in dehydrated vegetables. 1961-2010 101Table 3.34 : India’s trade in vegetables fresh nes. 1961-2010 103Table 3.35 : India’s trade in vegetables in vinegar. 1967-2010 105Table 3.36 : India’s trade in vegetables preserved nes. 1961-2010 107
Section-IV: Crop-wise Vegetable Statistics
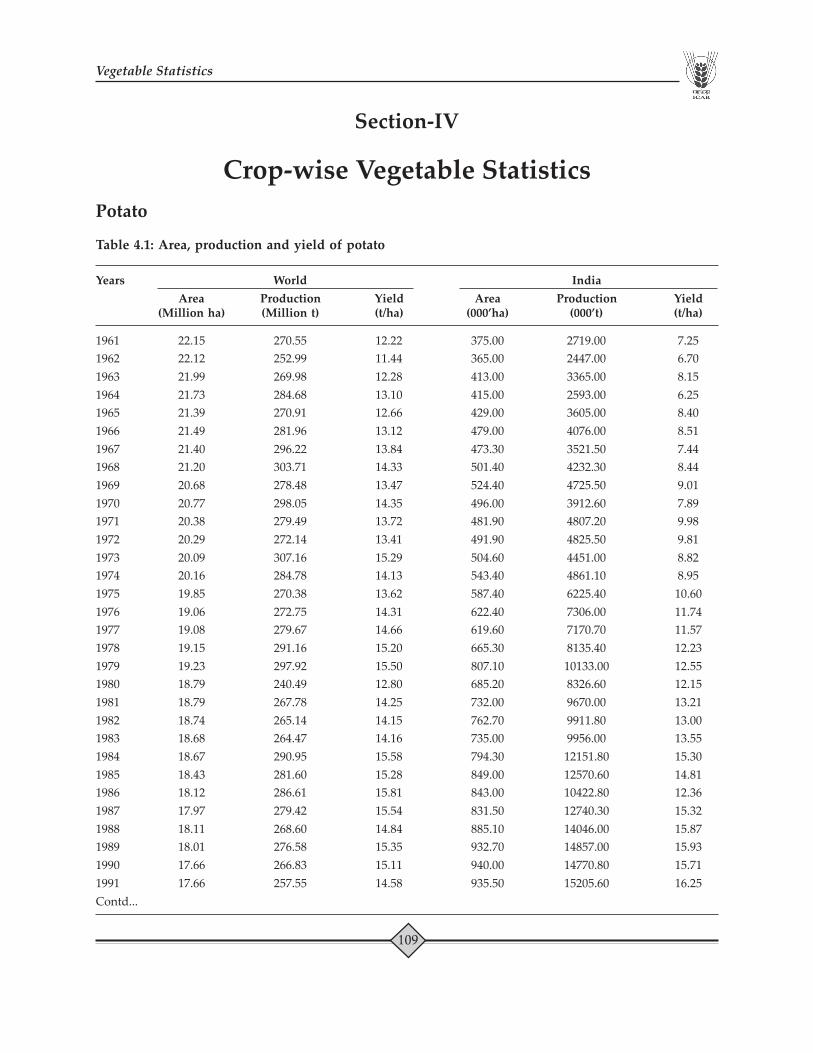
PotatoTable 4.1 : Area, production and yield of potato. 1961-2011 109Table 4.2 : Major potato producing countries in the world. 2010-2011 110
Page 11
Table 4.3 : Percent share of potato for area and production of 2001-2011 111vegetables in India.
Table 4.4 : State-wise area, production and productivity of potato 2011-2012 111in India.
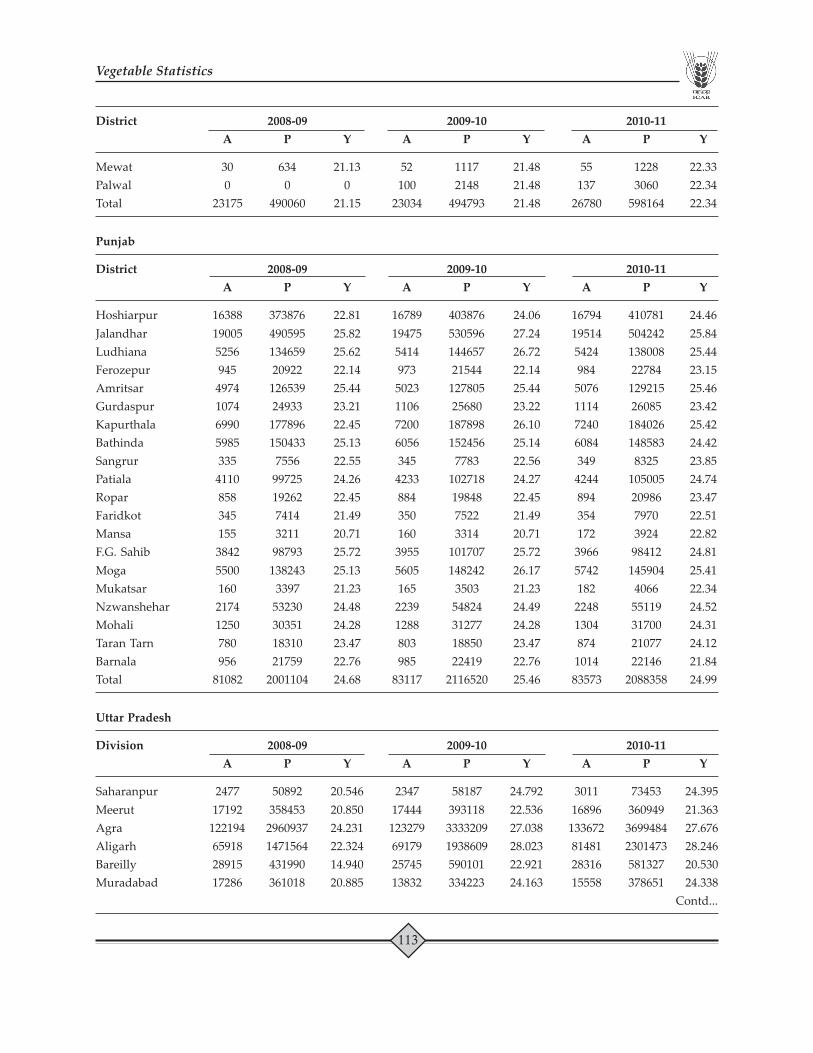
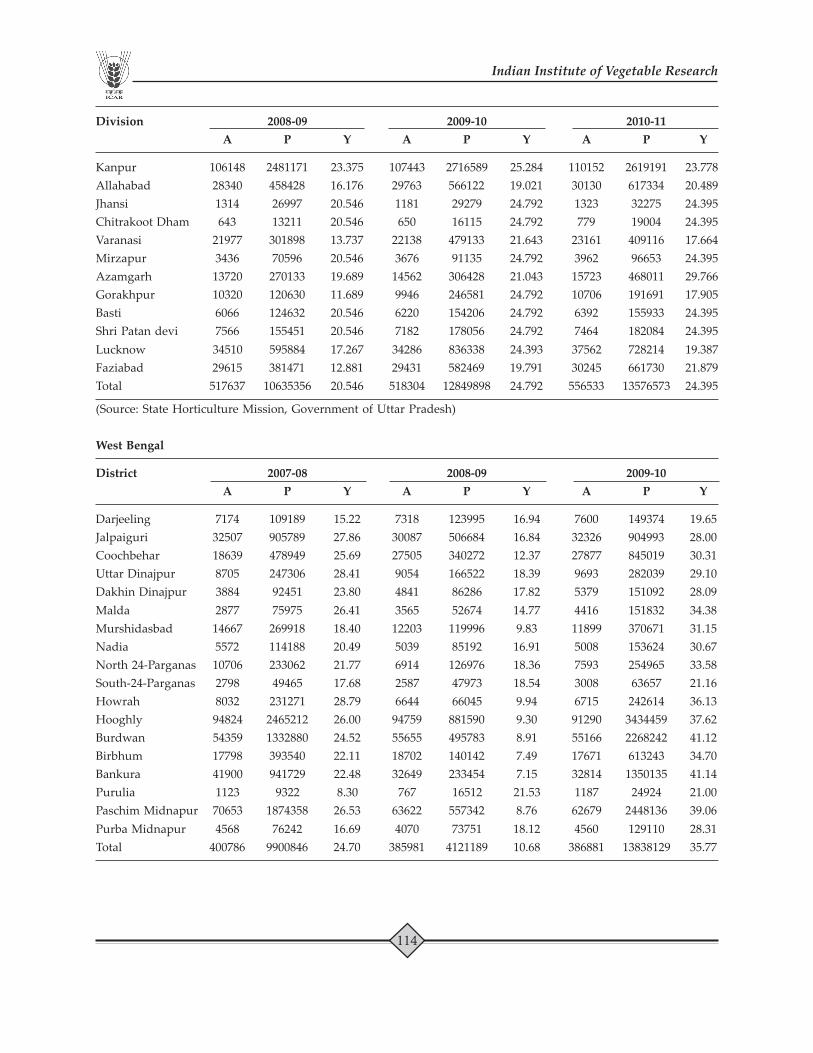
Table 4.5 : District-wise area (A), production (P) and yield (Y) 2007-2011 112of potato.
Table 4.6 : India’s trade in potato. 1961-2010 115
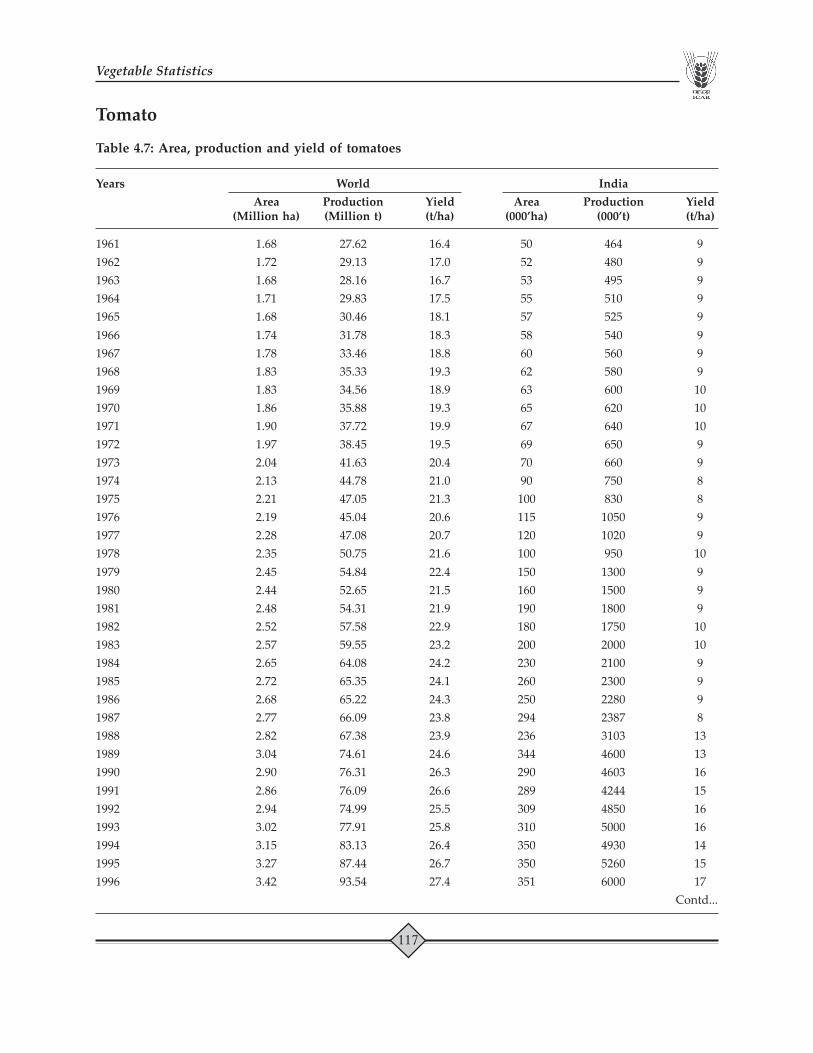
TomatoTable 4.7 : Area, production and yield of tomatoes. 1961-2011 117Table 4.8 : Major tomato producing countries in the world. 2010-2011 118Table 4.9 : Percent share in area production and productivity of 1987-2011 119
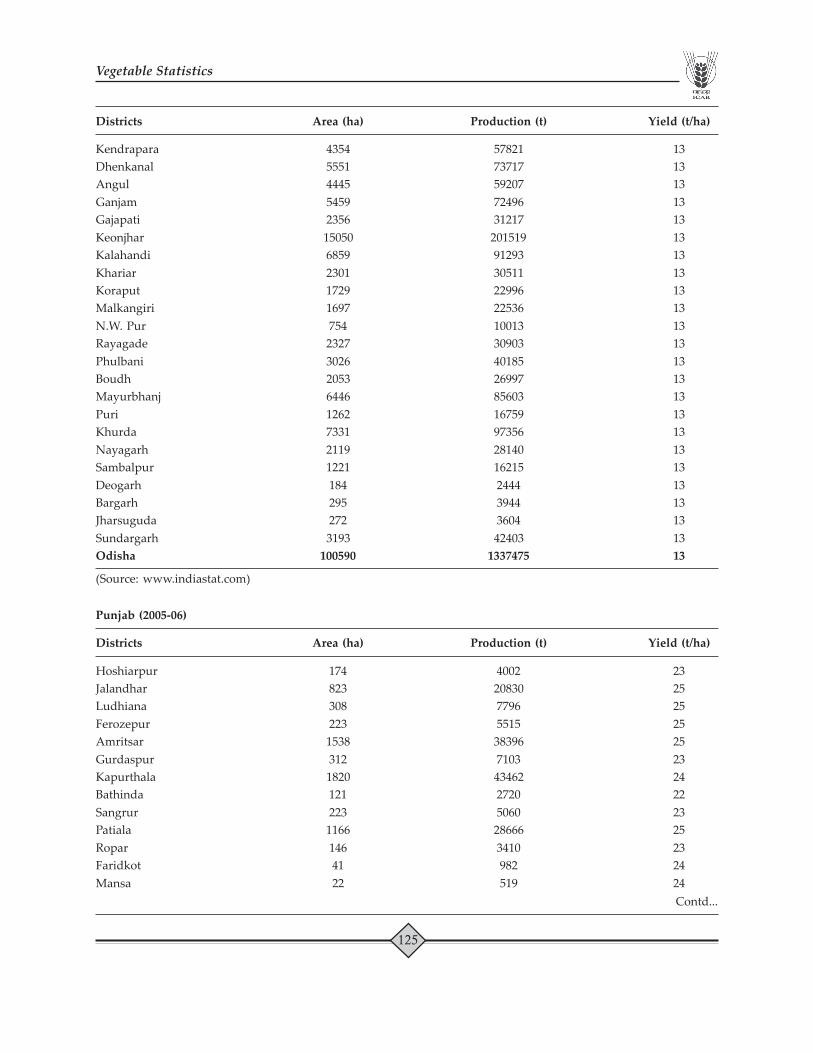
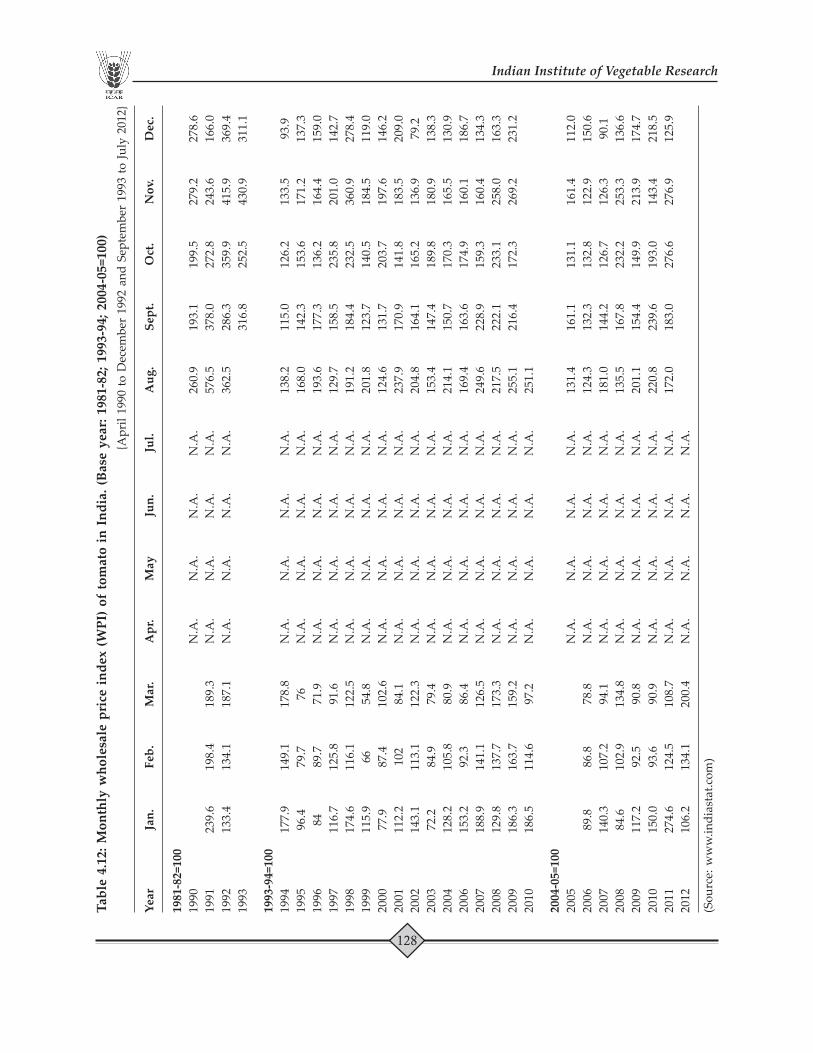
tomato in India.Table 4.10 : State-wise area, production and yield of tomato in India. 2001-2011 120Table 4.11 : District-wise area production and yield of tomato. Different years 122Table 4.12 : Monthly wholesale price index (WPI) of tomato in India. 1990-2012 128Table 4.13 : Monthly average wholesale price (WP) and arrival (AR) 2011 129
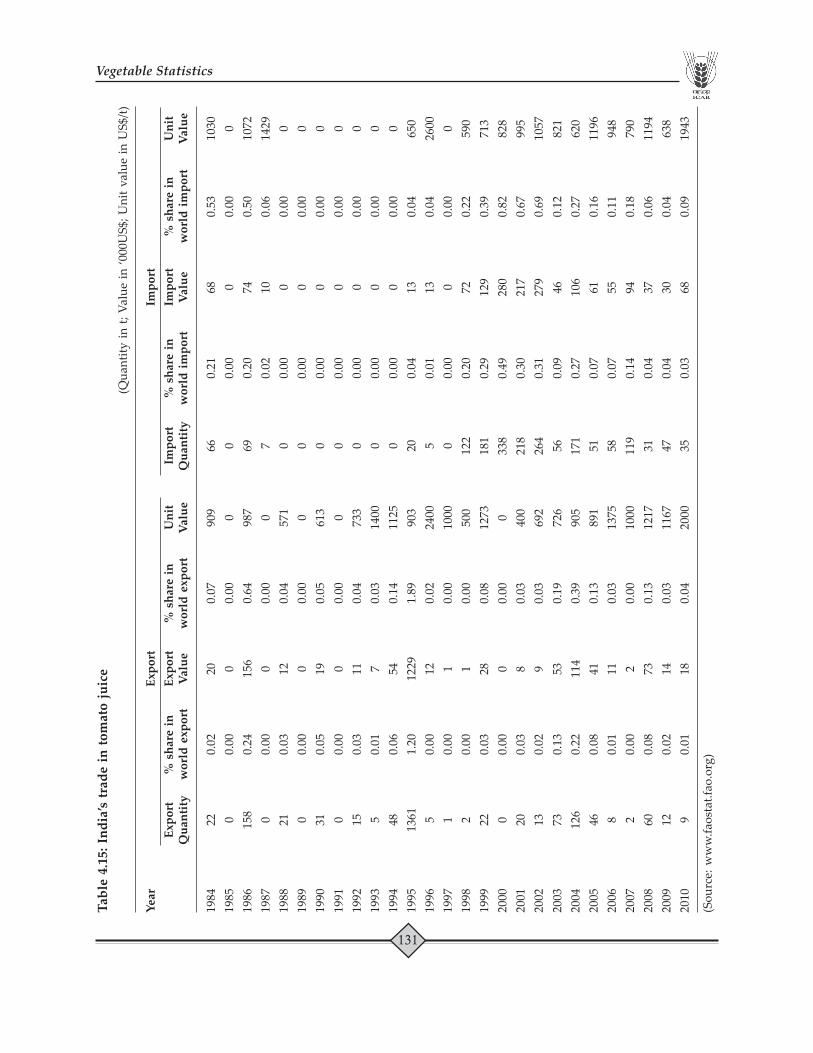
of tomato during the period January to December, 2011Table 4.14 : India’s trade in fresh tomatoes. 1978-2010 130Table 4.15 : India’s trade in tomato juice. 1984-2010 131Table 4.16 : India’s trade in tomato paste. 1988-2010 132Table 4.17 : India’s trade in peeled tomatoes. 1988-2010 133Table 4.18 : Major destinations of tomato export from India. 2008-2011 134Table 4.19 : Major destinations of tomato seed export from India. 2008-2011 134
OnionTable 4.20 : Area, production and yield of onion (dry). 1961-2011 135Table 4.21 : Major onion producing countries in the world. 2010-2011 136Table 4.22 : Percent share of area and production of onion in India. 2001-2011 137Table 4.23 : State-wise area, production and productivity of onion 2011-2012 137
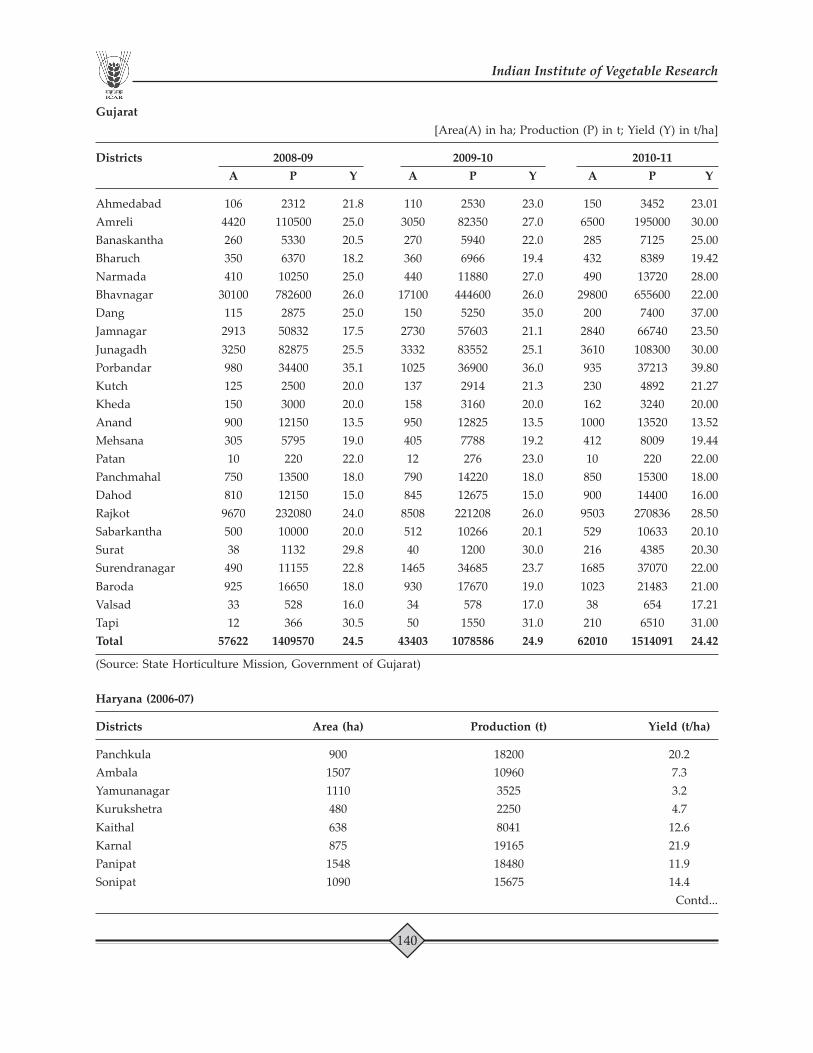
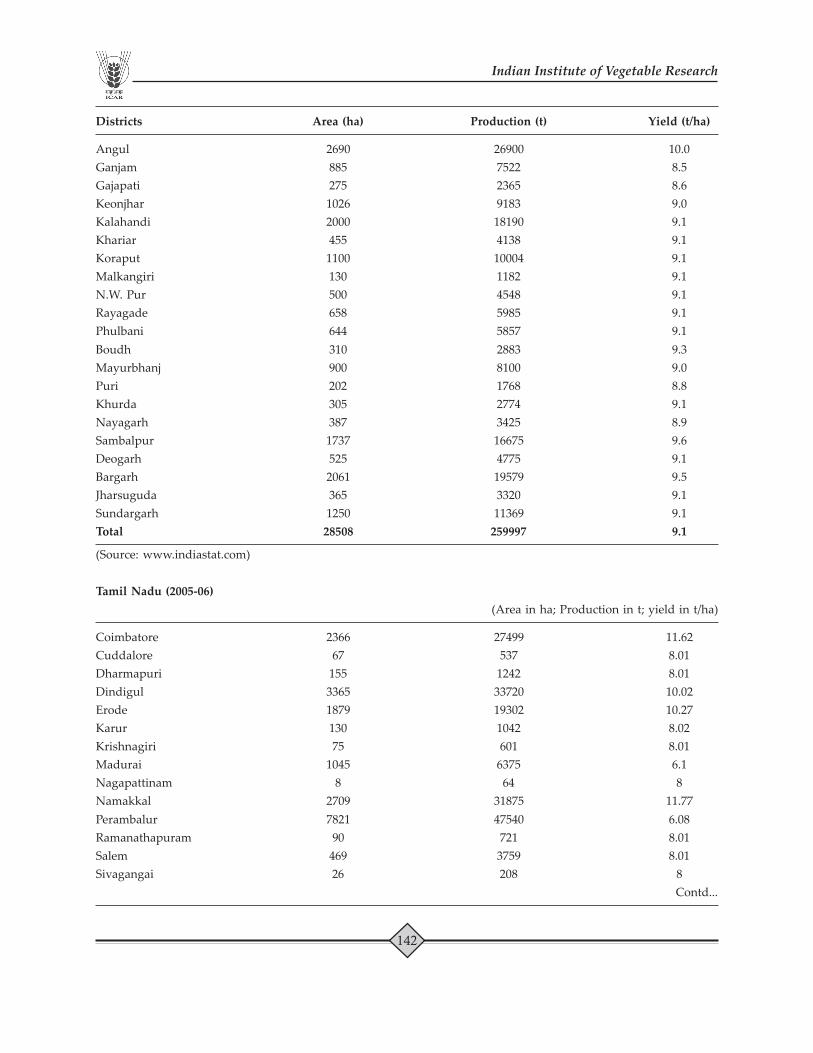
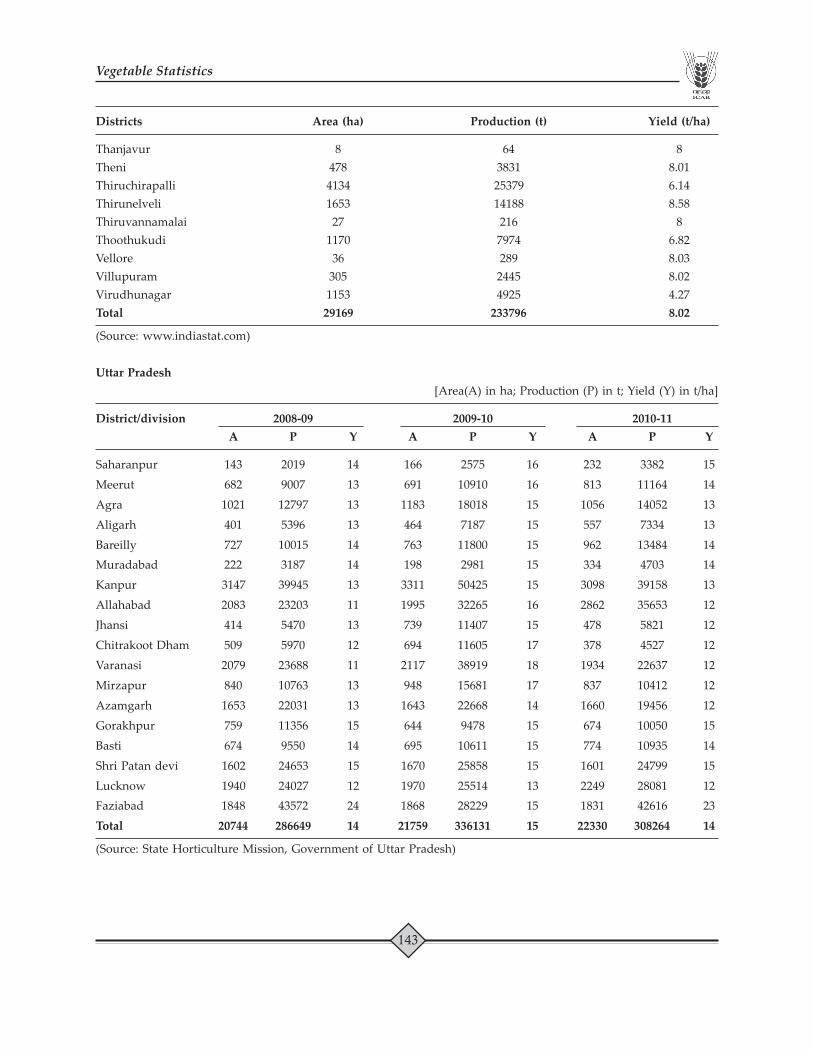
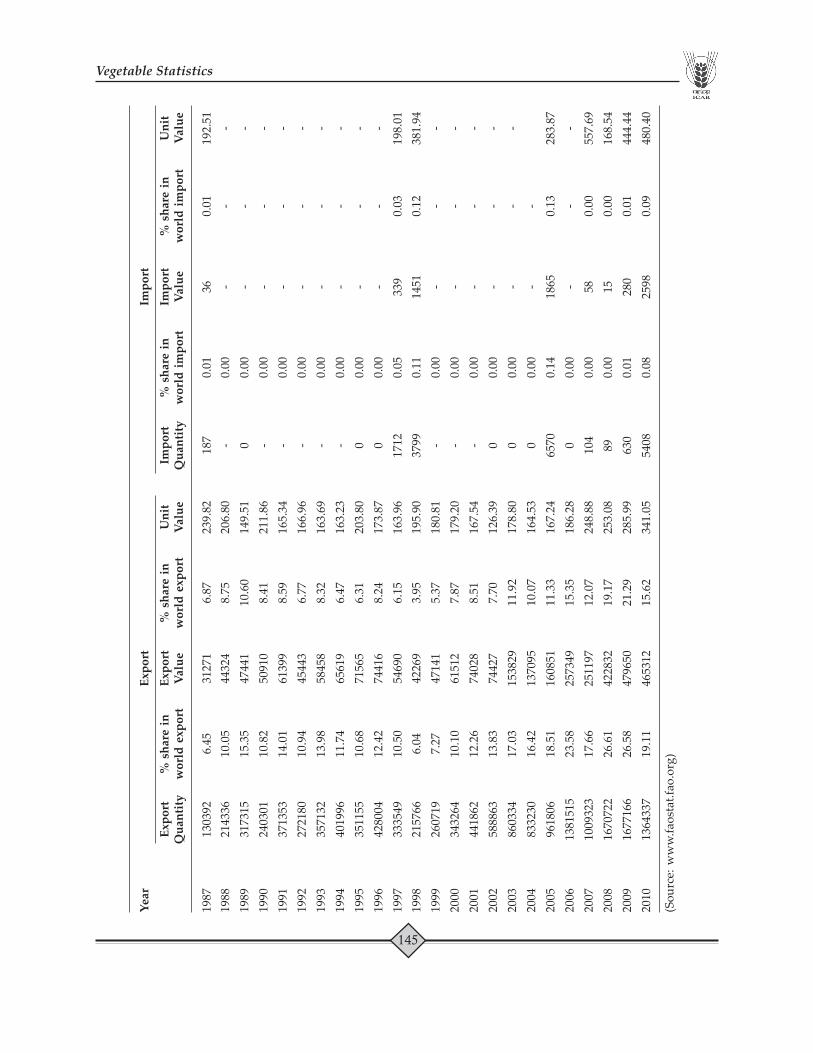
in India.Table 4.24 : State-wise area, production and yield of onion in India. 2001-2011 138Table 4.25 : District-wise area, production and yield of Onion Different years 139Table 4.26 : India’s trade in onion. 1961-2010 144
BrinjalTable 4.27 : Area, production and yield of brinjal(Eggplant or 1961-2011 146
Aubergine).Table 4.28 : Major eggplant producing countries in the world. 2010-2011 147
Page 12
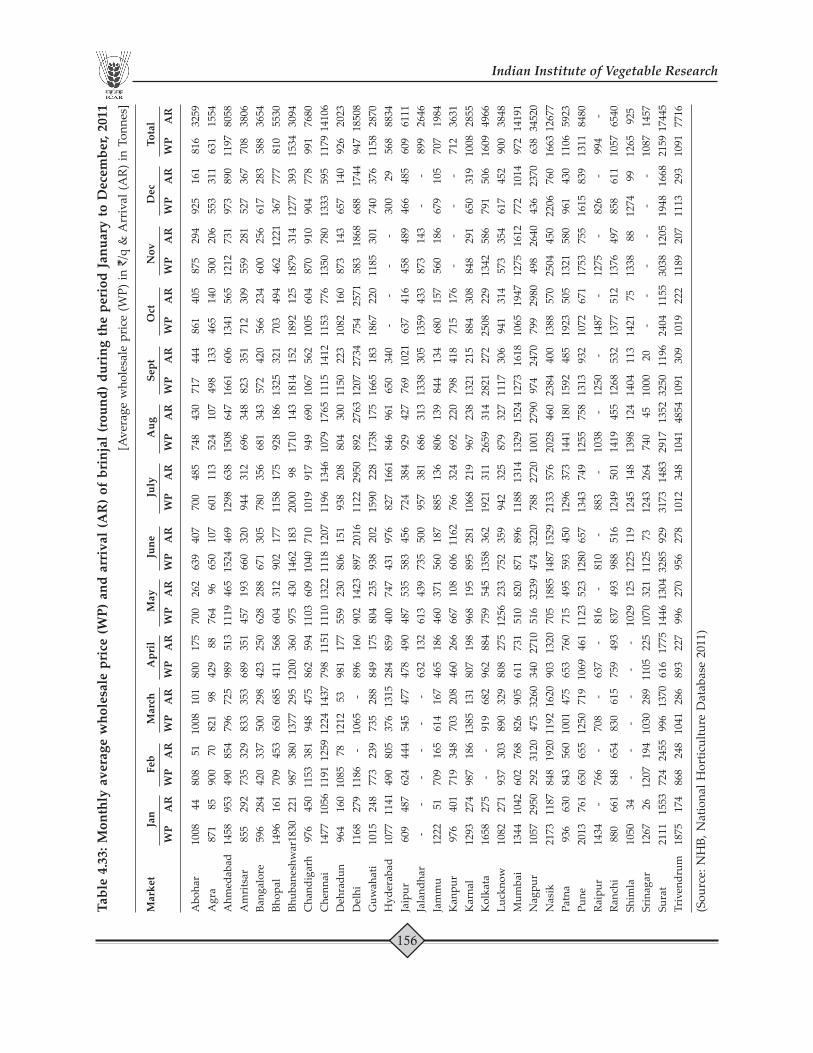
Table 4.29 : Percent share of area and production of brinjal in India. 1987-2011 147Table 4.30 : State-wise area, production and yield of brinjal in India. 2001-2011 148Table 4.31 : District-wise area, production and yield of brinjal. Different years 149Table 4.32 : Monthly wholesale price index (WPI) of brinjal in India 1994-2012 155Table 4.33 : Monthly average wholesale price (WP) and arrival (AR) 2011 156
of brinjal (round) during the period January toDecember, 2011.
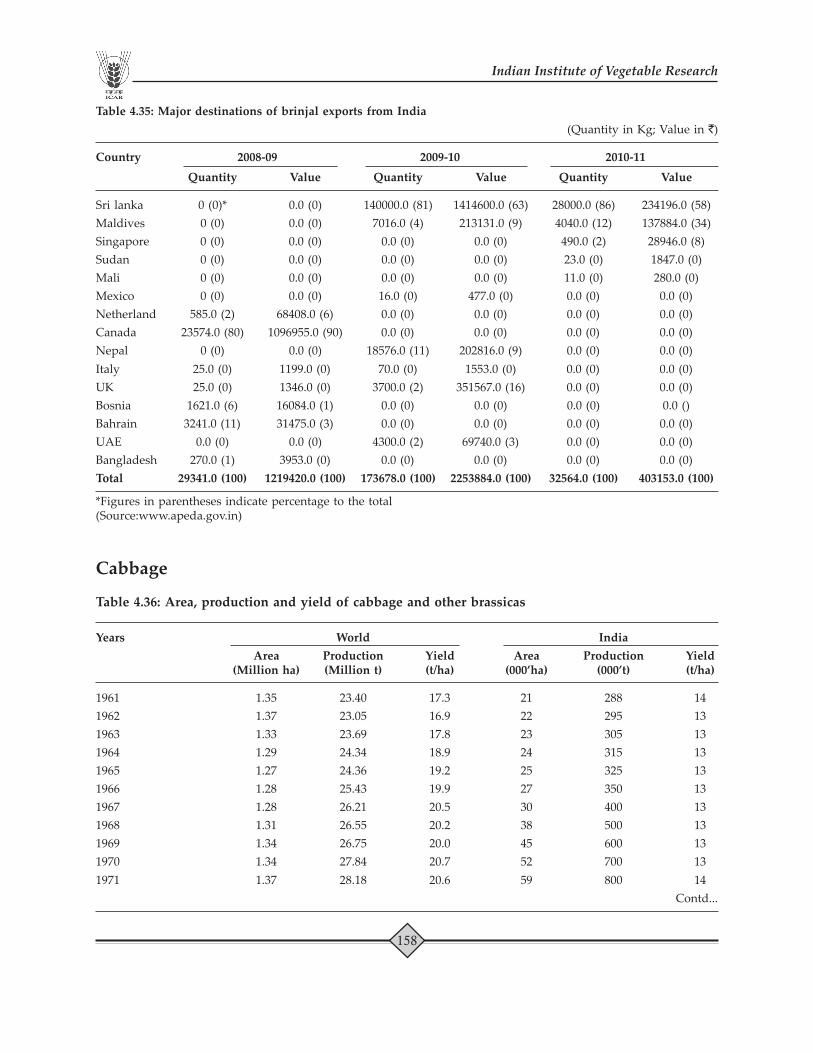
Table 4.34 : India’s trade in eggplant/brinjal. 2000-2010 157Table 4.35 : Major destinations of brinjal exports from India. 2008-2011 158
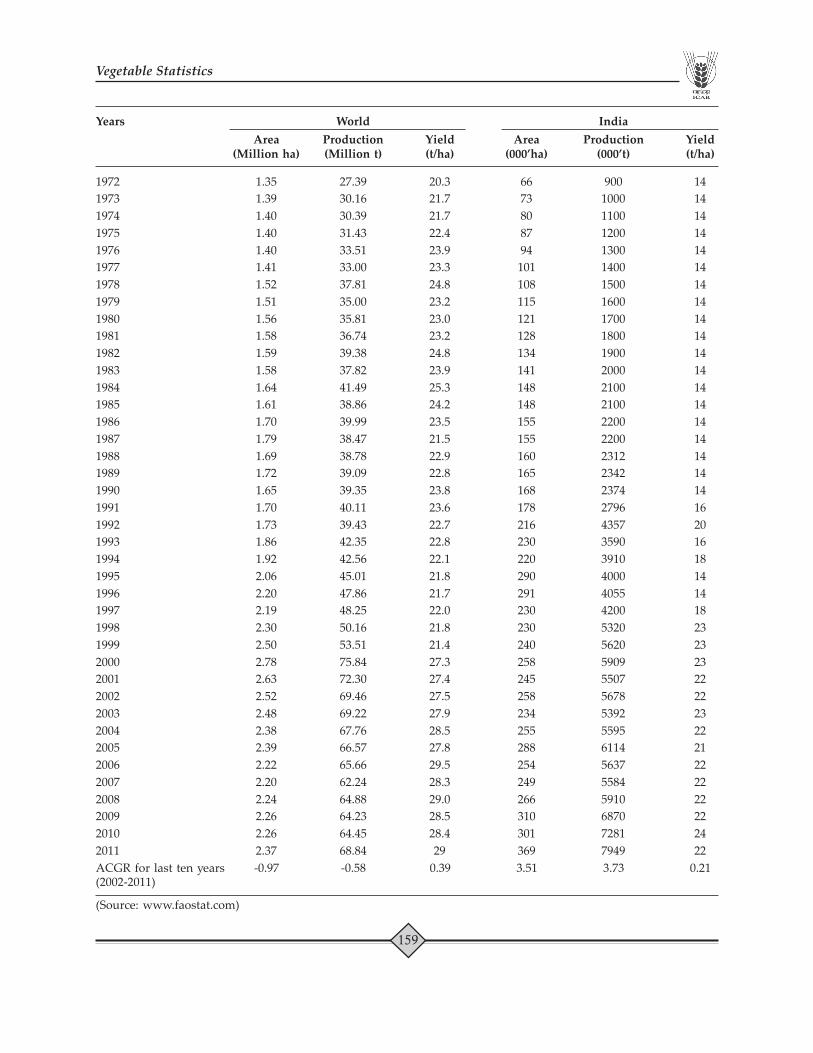
CabbageTable 4.36 : Area, production and yield of cabbage and 1961-2011 158
other brassicas.Table 4.37 : Major cabbage producing countries in the world. 2010-2011 160Table 4.38 : Percent share of area and production of cabbage 1987-2011 160
in India.Table 4.39 : State-wise area, production and yield of cabbage 2001-2011 161
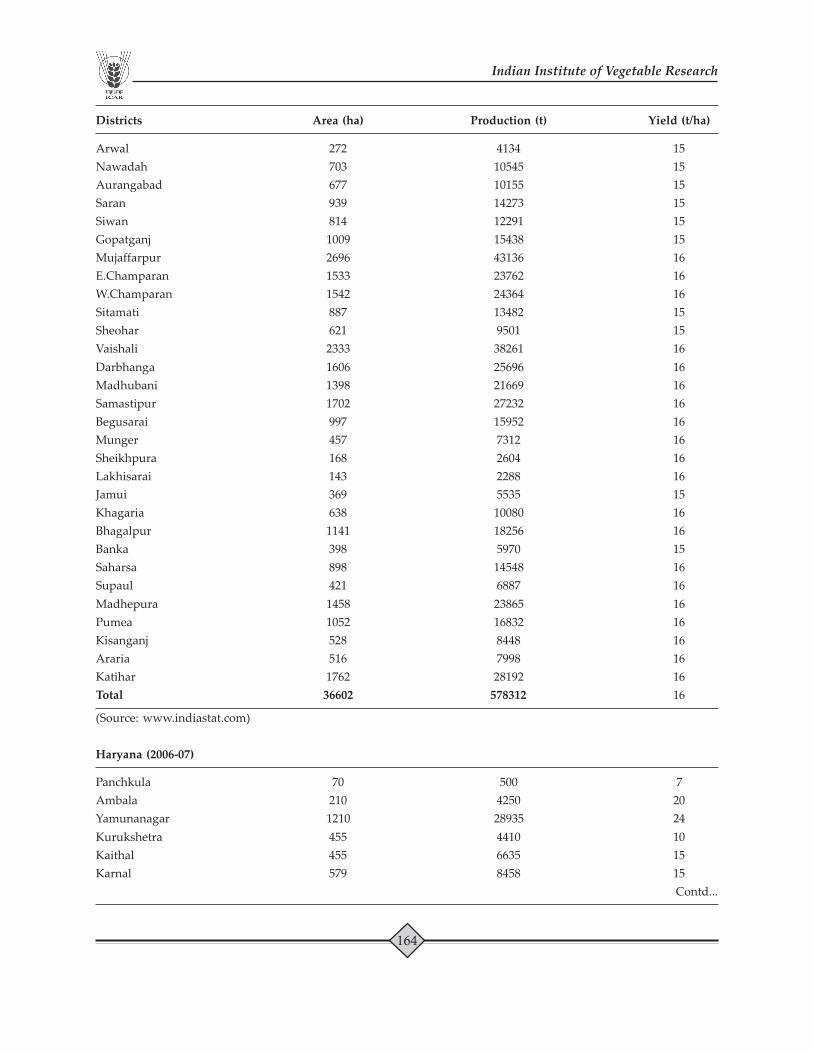
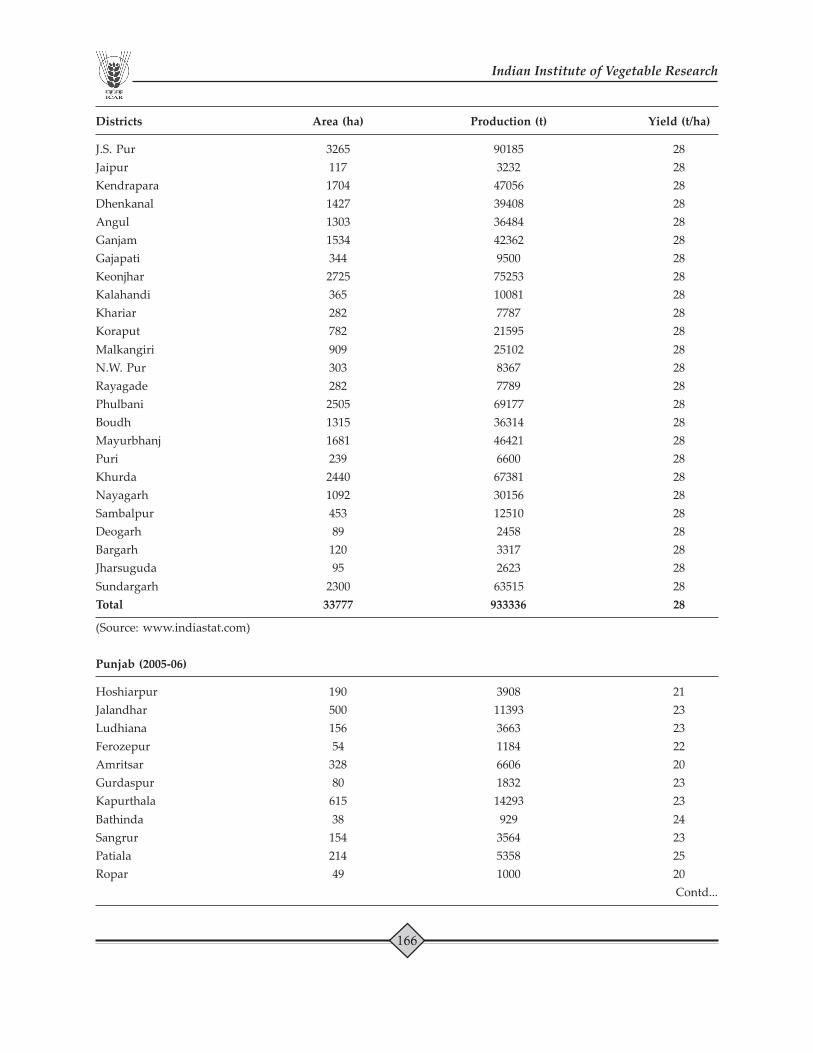
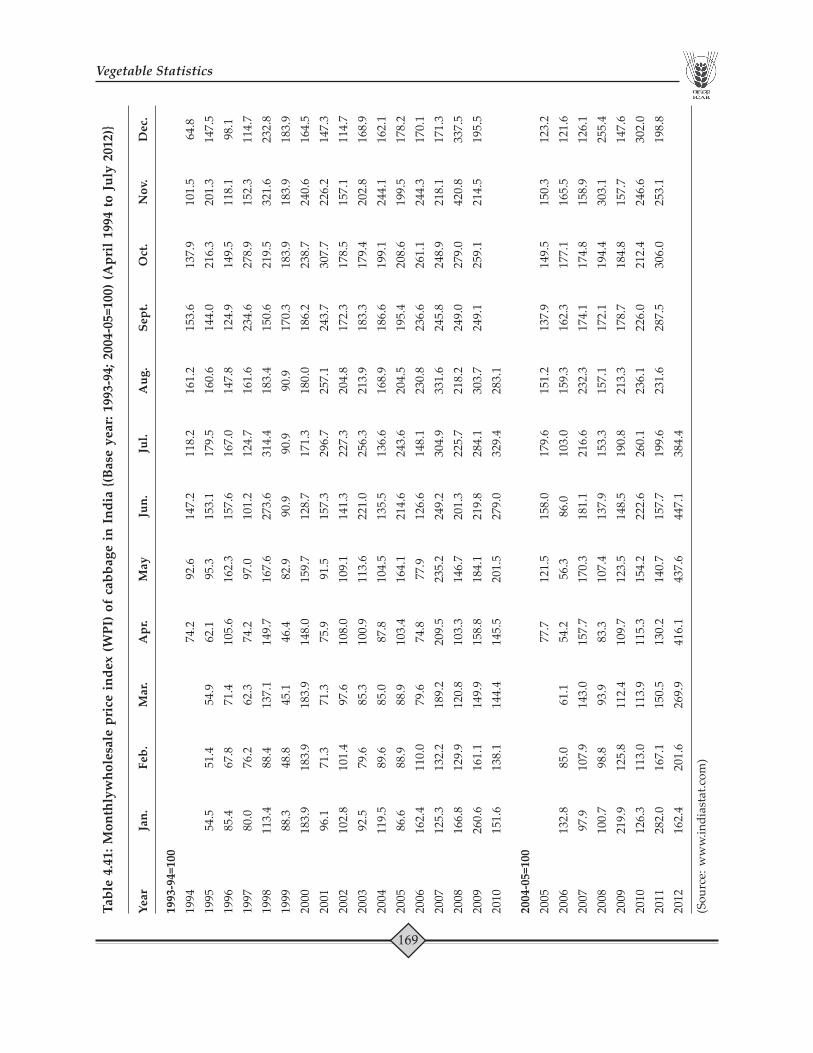
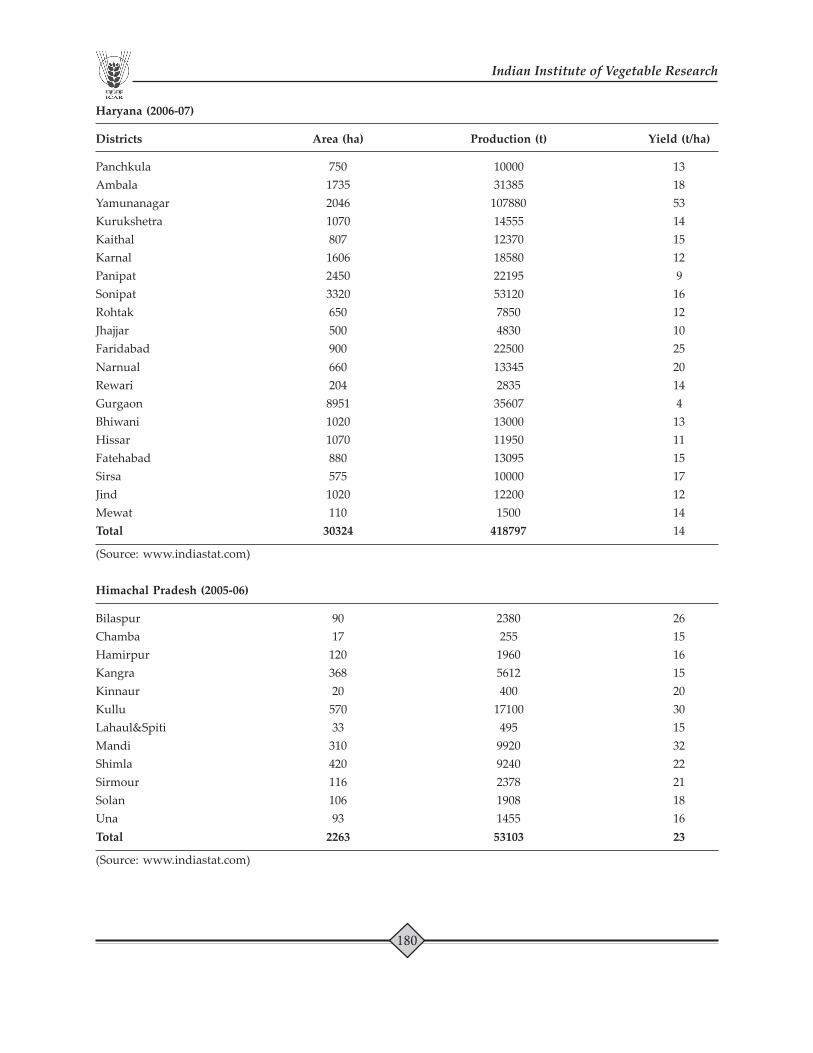
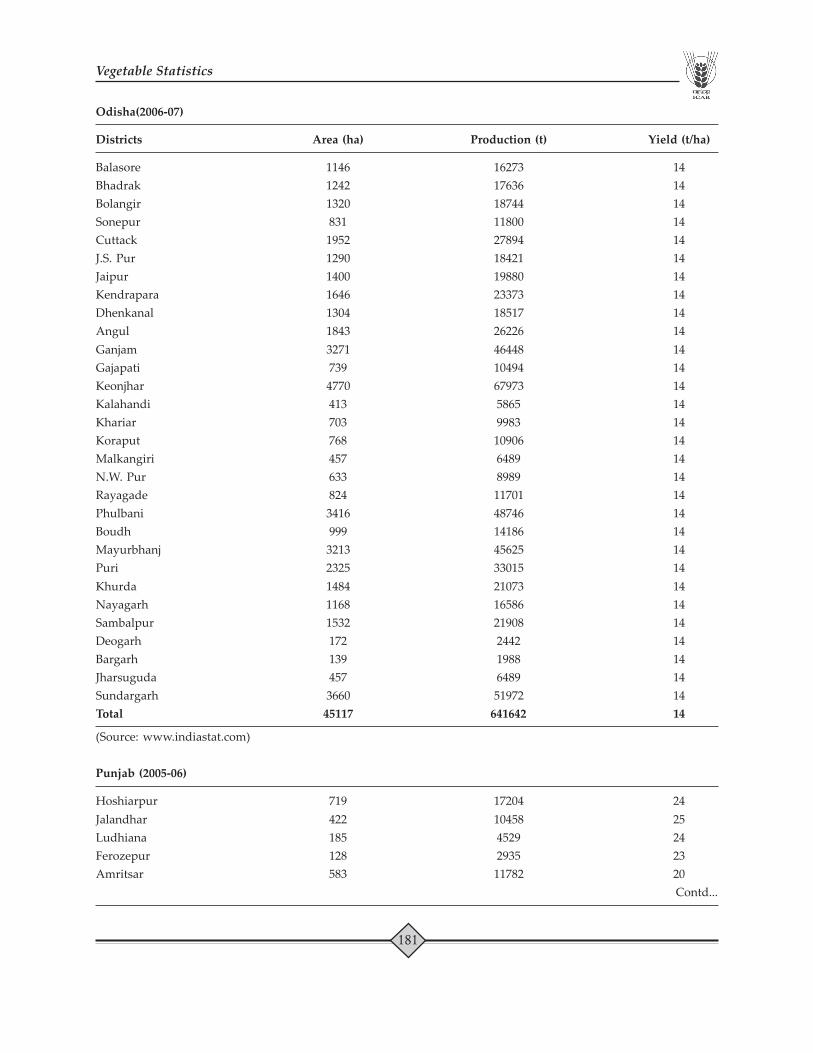
in India.Table 4.40 : District-wise area production and yield of cabbage. Different years 163Table 4.41 : Monthly wholesale price index (WPI) of cabbage 1994-2012 169
in IndiaTable 4.42 : Monthly average wholesale price (WP) and arrival 2011 170
(AR) of cabbage during the period January toDecember, 2011.
Table 4.43 : India’s trade in cabbage and other brassicas. 1961-2010 171Table 4.44 : Major destinations of cabbage from India 2008-2011 173Table 4.45 : Major destinations of cabbage seeds export from India. 2008-2011 173
CauliflowerTable 4.46 : Area, production and yield of cauliflowers and broccoli. 1961-2011 174Table 4.47 : Major cauliflower producing countries in the world. 2010-2011 175Table 4.48 : Percent share of area and production of cauliflower 1987-2011 176
in India.Table 4.49 : State-wise area production and yield of cauliflower 2001-2011 177
in IndiaTable 4.50 : District-wise area production and yield of cauliflower. Different years 179Table 4.51 : Monthly wholesale price index (WPI) of cauliflower 1990-2012 184
in IndiaTable 4.52 : Monthly average wholesale price (WP) and arrival (AR) 2011 185
of cauliflower during the period January toDecember 2011
Page 13
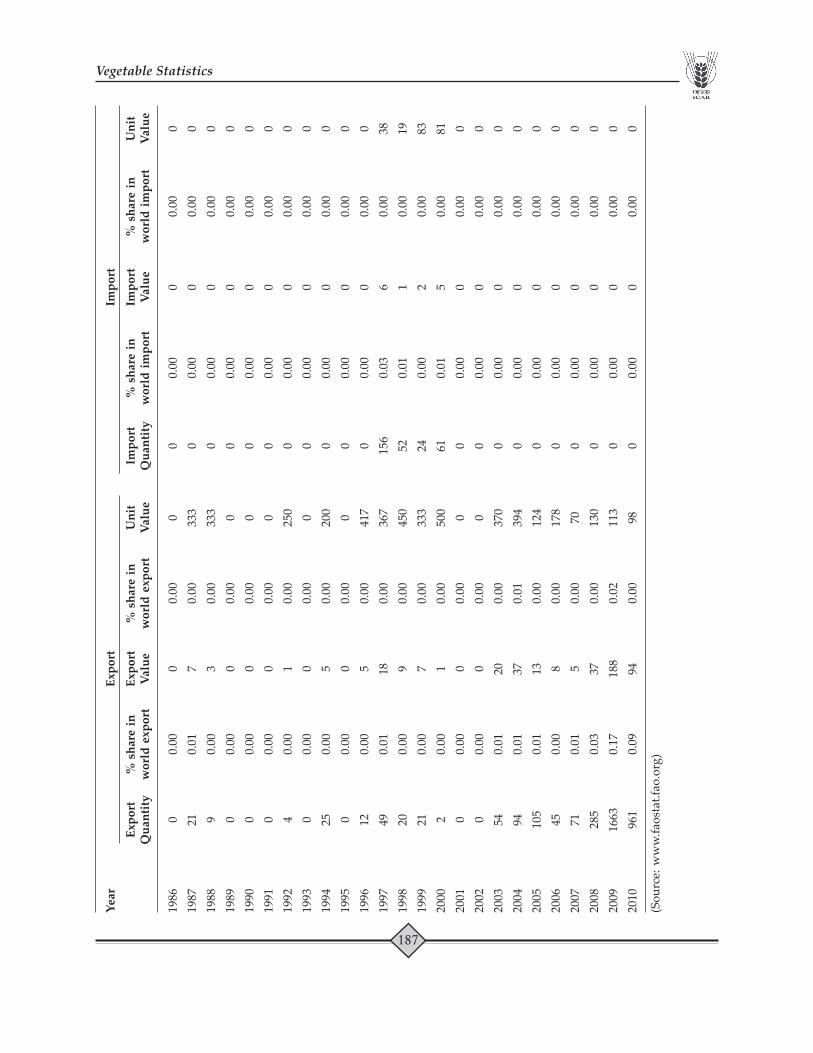
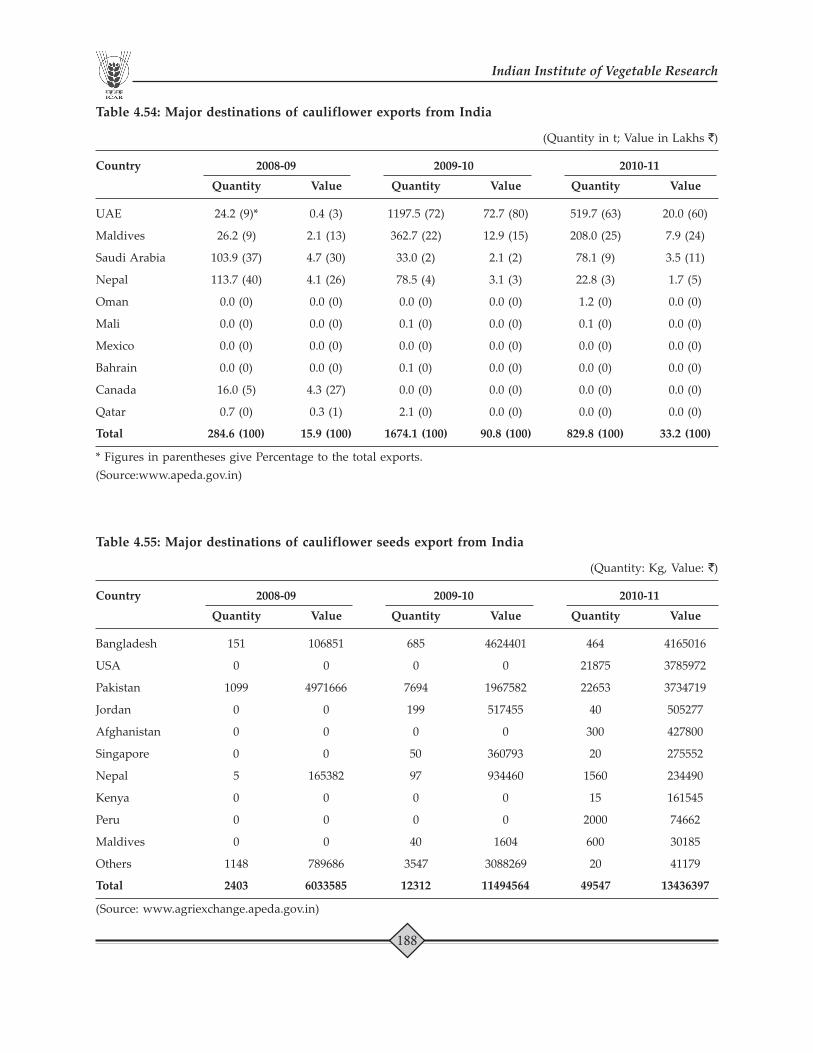
Table 4.53 : India’s trade in cauliflower and broccoli. 1961-2010 186Table 4.54 : Major destinations of cauliflower exports from India. 2008-2011 188Table 4.55 : Major destinations of cauliflower seeds export 2008-2011 188
from India.
OkraTable 4.56 : Area, production and yield of okra. 1961-2011 189Table 4.57 : Major okra producing countries in the world. 2010-2011 190Table 4.58 : Percent share of area production and productivity of 1987-2011 191
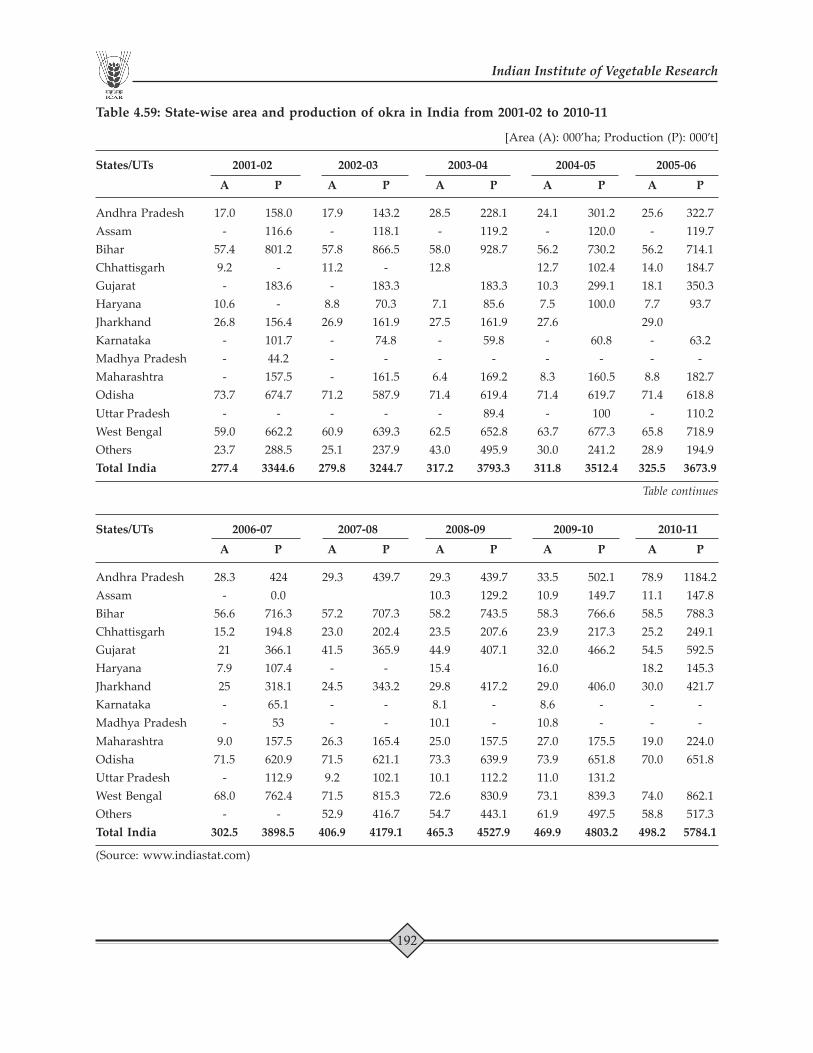
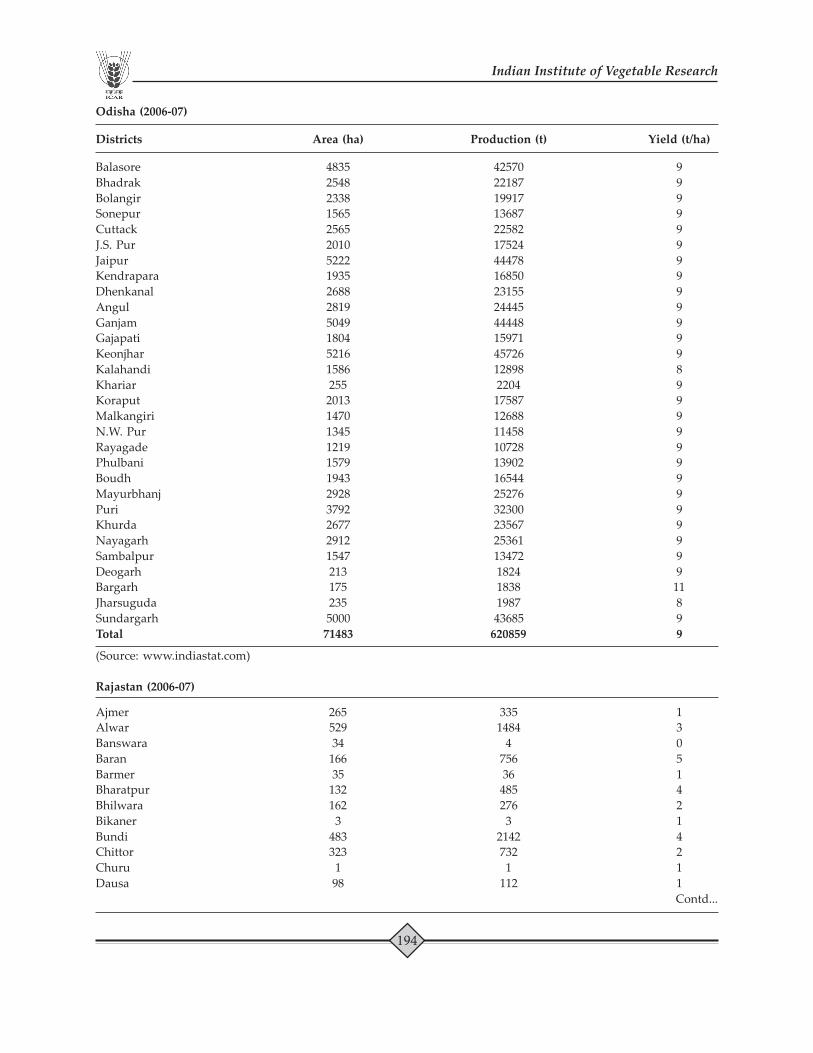
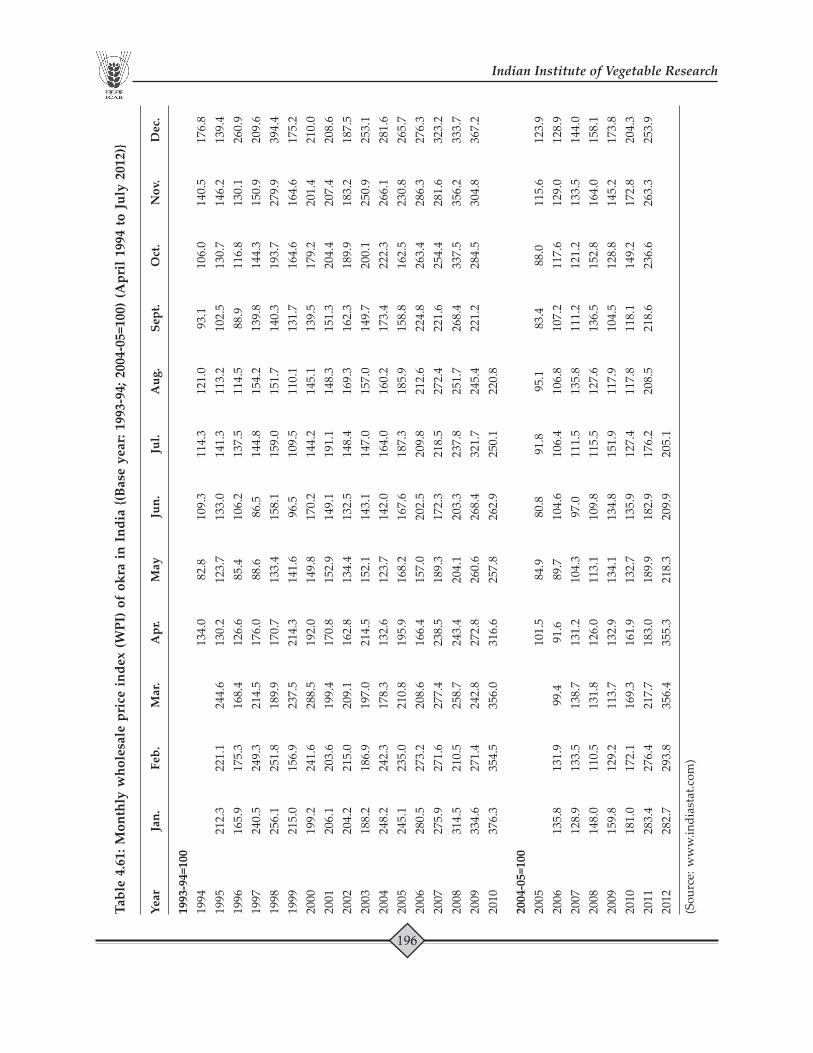
okra in India.Table 4.59 : State-wise area and production of okra in India. 2001-2011 192Table 4.60 : District-wise area production and yield of okra. Different years 193Table 4.61 : Monthly wholesale price index (WPI) of okra in India 1994-2012 196Table 4.62 : Monthly average wholesale price (WP) and arrival 2011 197
(AR) of okra during the period January to December,2011.
Green PeasTable 4.63 : Area, production and yield of peas (green). 1961-2011 198Table 4.64 : Major green pea producing countries in the world. 2010-2011 199Table 4.65 : Percent share of area production and productivity of 1987-2011 200
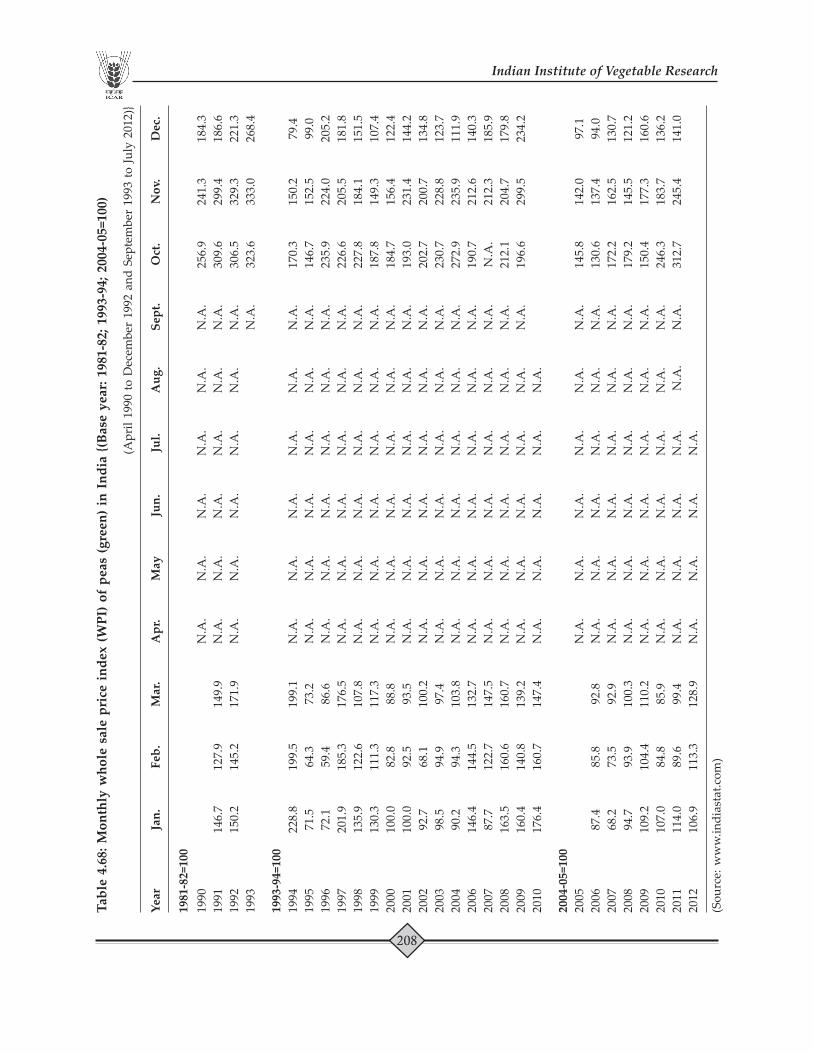
peas in India.Table 4.66 : State-wise area production and yield of peas in India. 2001-2011 201Table 4.67 : District-wise area production and yield of peas. Different years 203Table 4.68 : Monthly whole sale price index (WPI) of peas (green) 1990-2012 208
in IndiaTable 4.69 : Monthly average wholesale price (WP) and arrival (AR) 2011 209
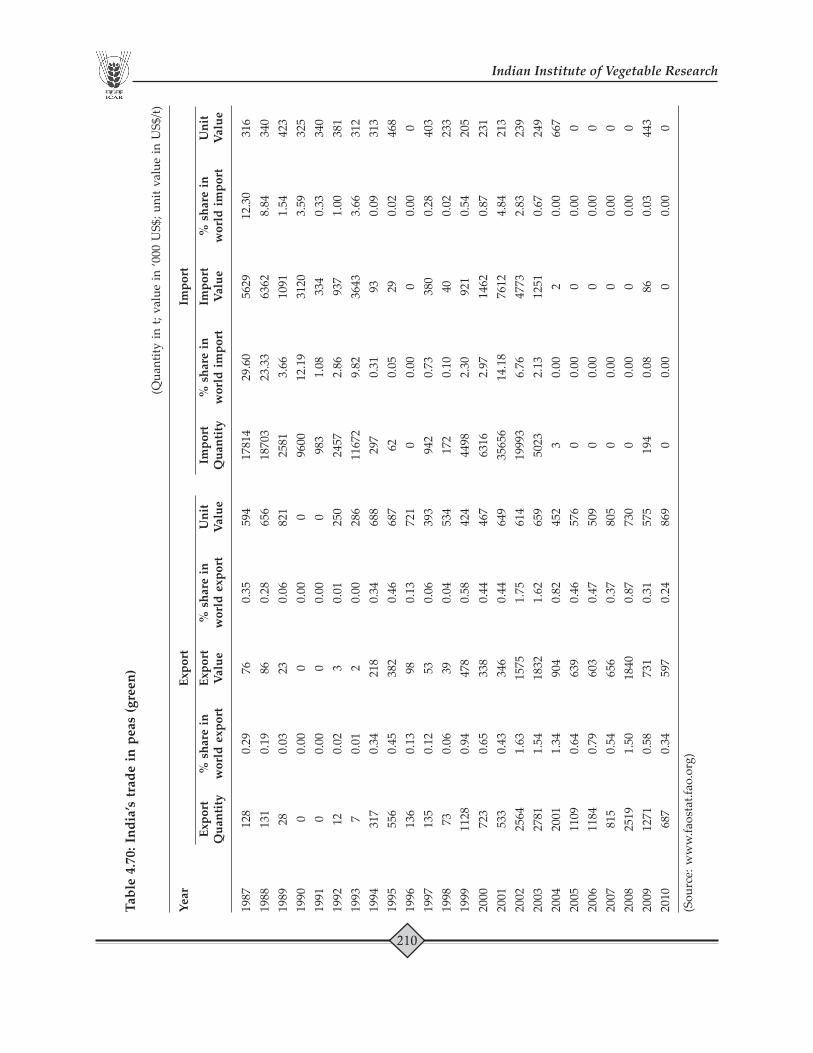
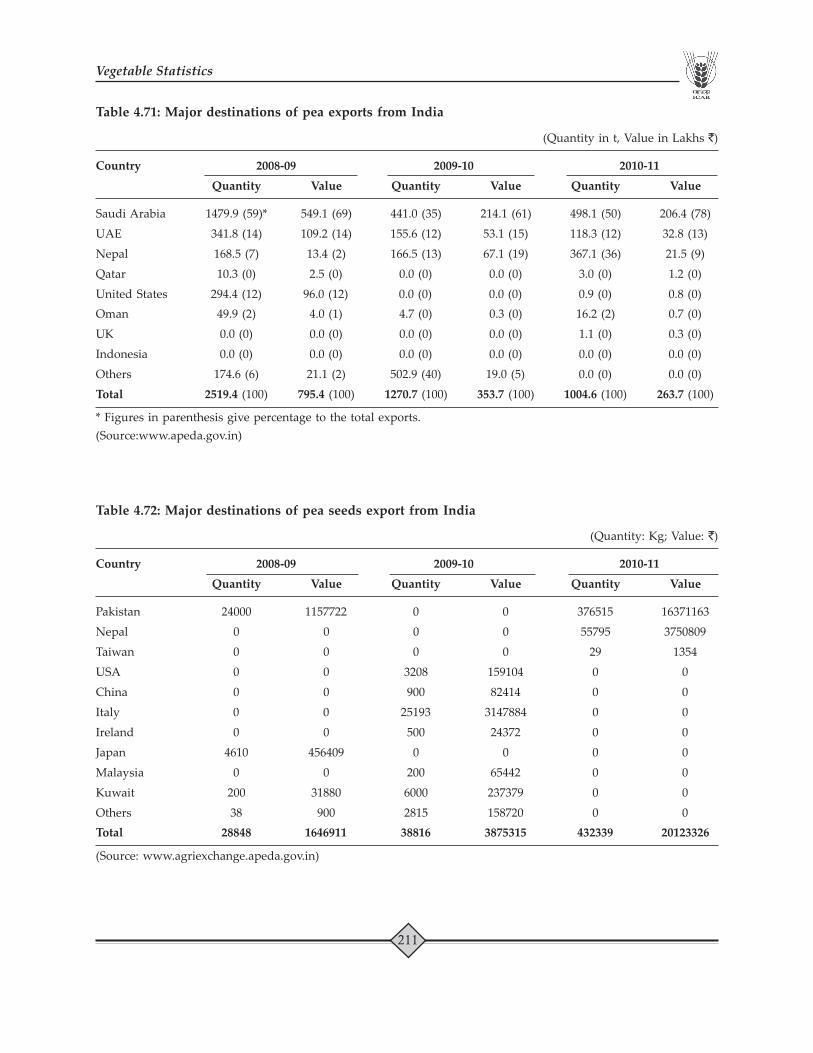
of peas during the period January to December, 2011.Table 4.70 : India’s trade in peas (green). 1987-2010 210Table 4.71 : Major destinations of pea exports from India. 2008-2011 211Table 4.72 : Major destinations of pea seeds export from India. 2008-2011 211
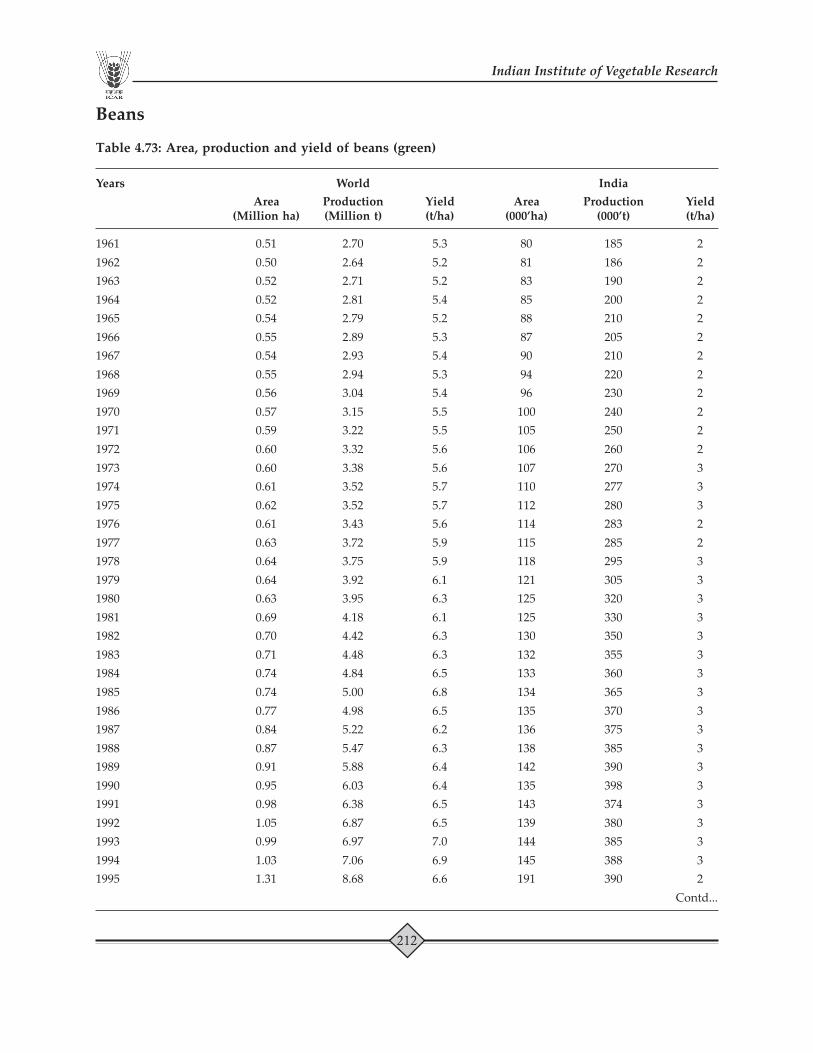
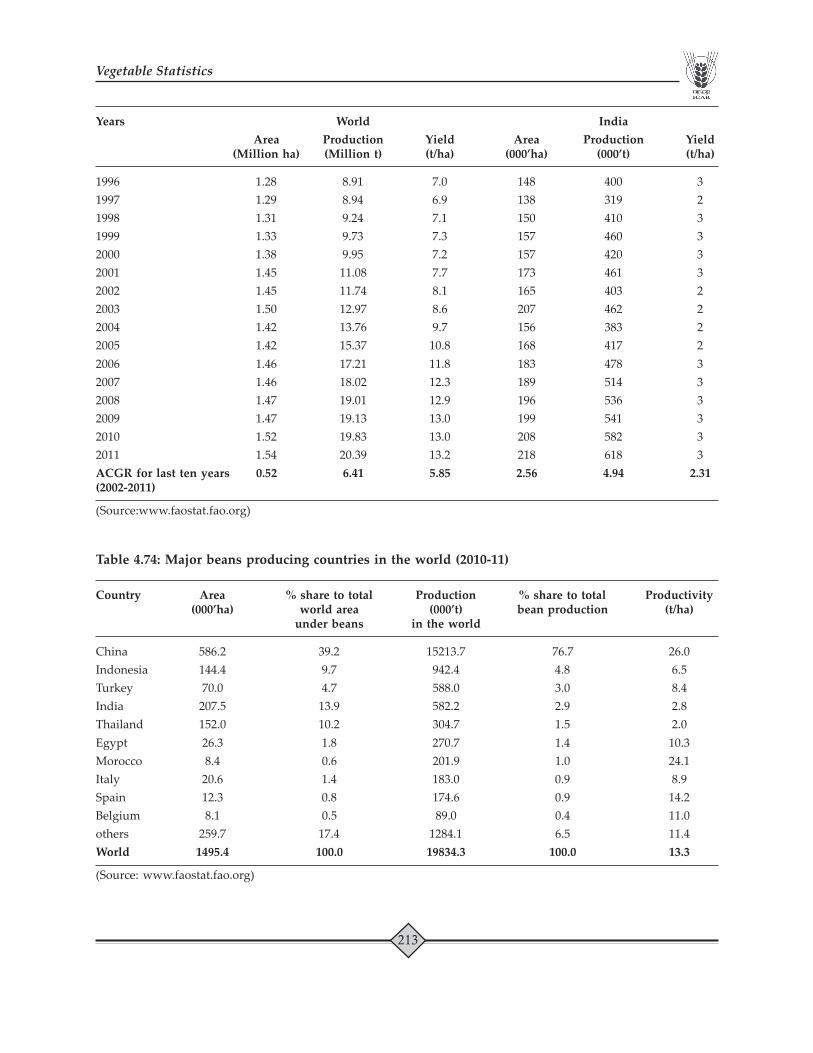
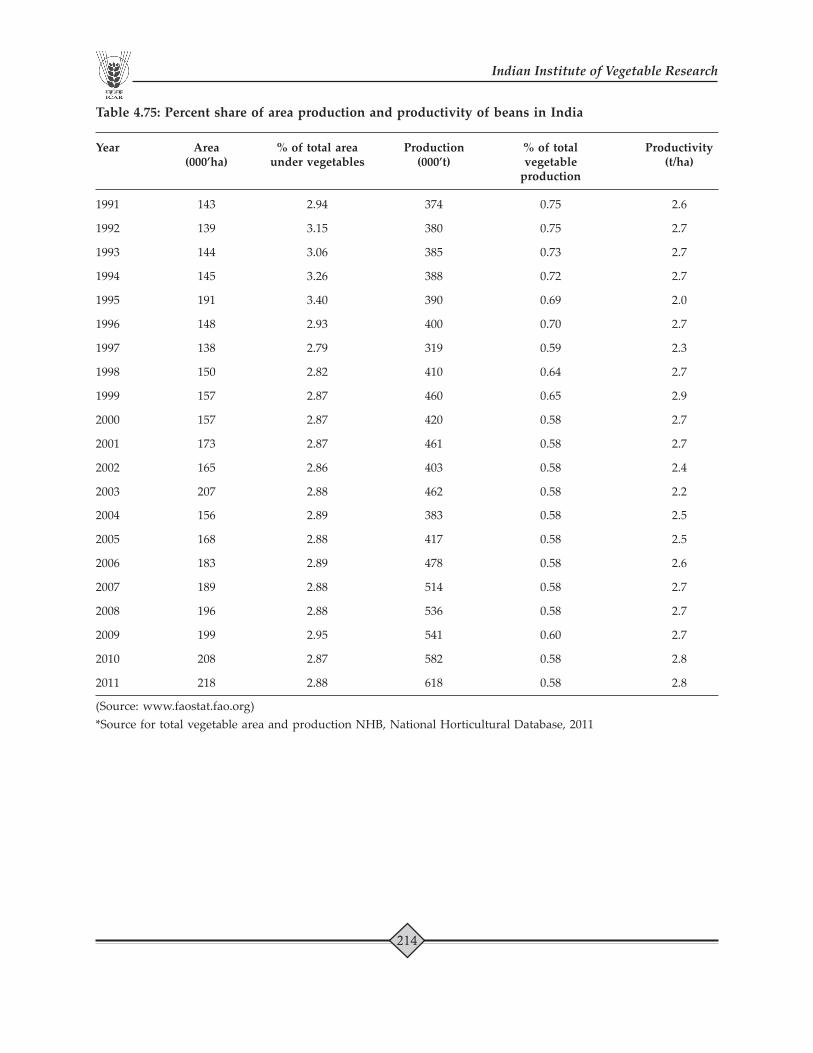
BeansTable 4.73 : Area, production and yield of beans (green). 1961-2011 212Table 4.74 : Major beans producing countries in the world (2010-11). 2010-2011 213Table 4.75 : Percent share of area production and productivity of 1991-2011 214
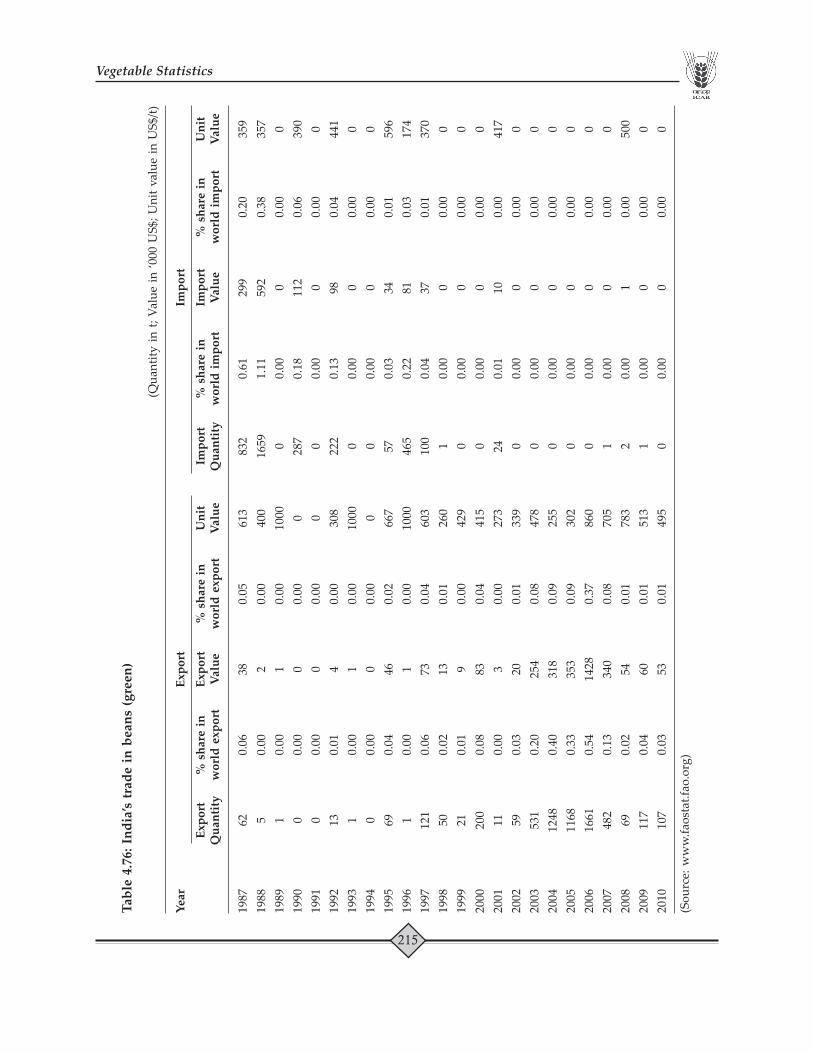
beans in India.Table 4.76 : India’s trade in beans (green). 1987-2010 215Table 4.77 : India’s trade in leguminous vegetables. 1987-2010 216
Page 14
Carrot and TurnipsTable 4.78 : Area, production and yield of carrots and turnips. 1961-2011 217Table 4.79 : Major carrot & turnips producing countries in the 2010-2011 218
world (2010-11).Table 4.80 : Percent share of area production and productivity of 1991-2011 219
carrot and turnip in India.Table 4.81 : India’s trade in carrot and turnips. 1961-2010 220
Cucumber and GherkhinsTable 4.82 : Area, production and yield of cucumber and gherkins. 1961-2011 222Table 4.83 : Major cucumber & gherkins producing countries in 2010-2011 223
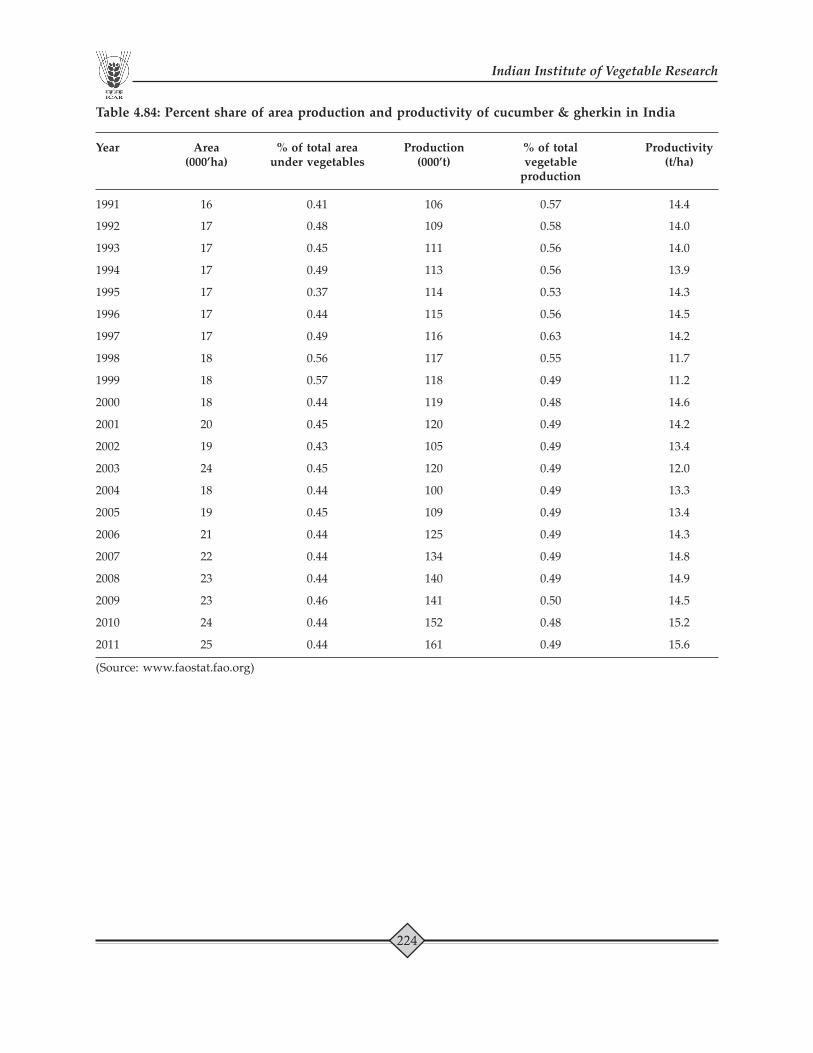
the world (2010-11).Table 4.84 : Percent share of area production and productivity of 1991-2011 224
cucumber & gherkin in India.Table 4.85 : India’s trade in cucumber & gherkins. 1987-2010 225
Pumpkin, Squashes and GourdsTable 4.86 : Area, production and yield of pumpkin, squashes 1961-2011 226
and gourds.Table 4.87 : Major pumpkin, squash & gourds producing 2010-2011 227
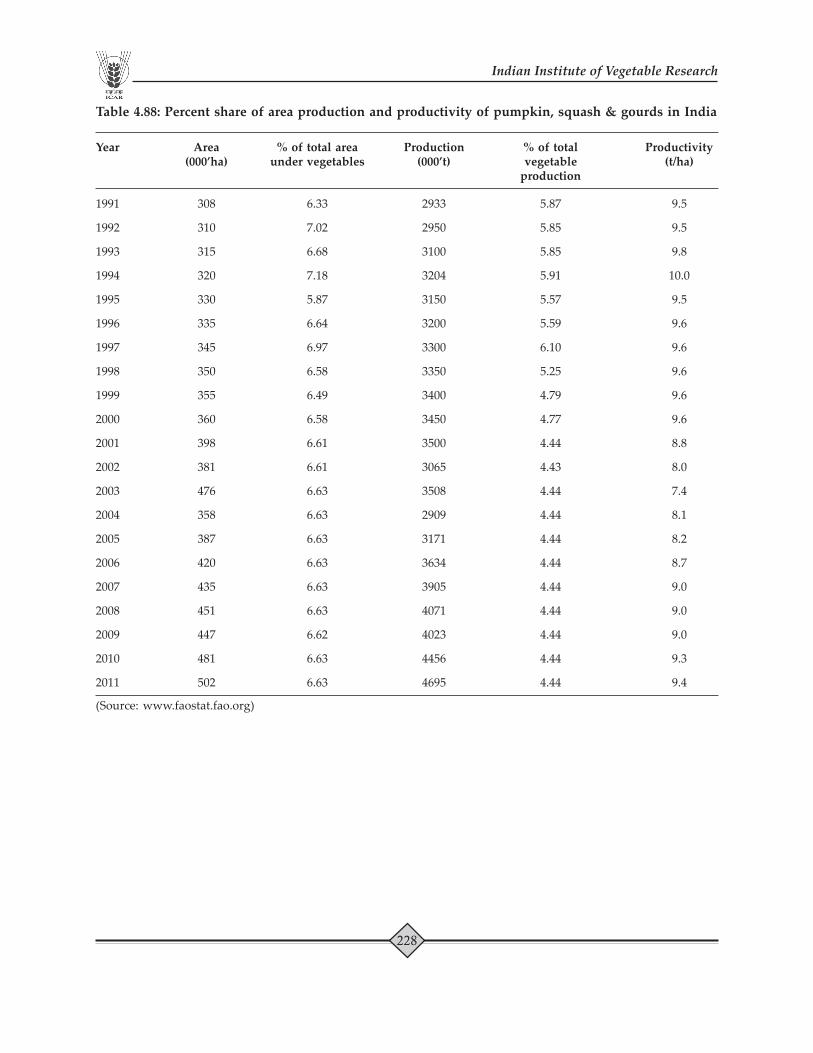
countries in the world (2010-11).Table 4.88 : Percent share of area production and productivity 1991-2011 228
of pumpkin, squash & gourds in India.Table 4.89 : India’s trade in pumpkins, squash and gourds 2001-2010 229
CassavaTable 4.90 : Area production and productivity of cassava. 1961-2011 230Table 4.91 : Major cassava producing countries in the world. 2011 231Table 4.92 : State-wise area, production and yield of tapioca 2001-2011 232
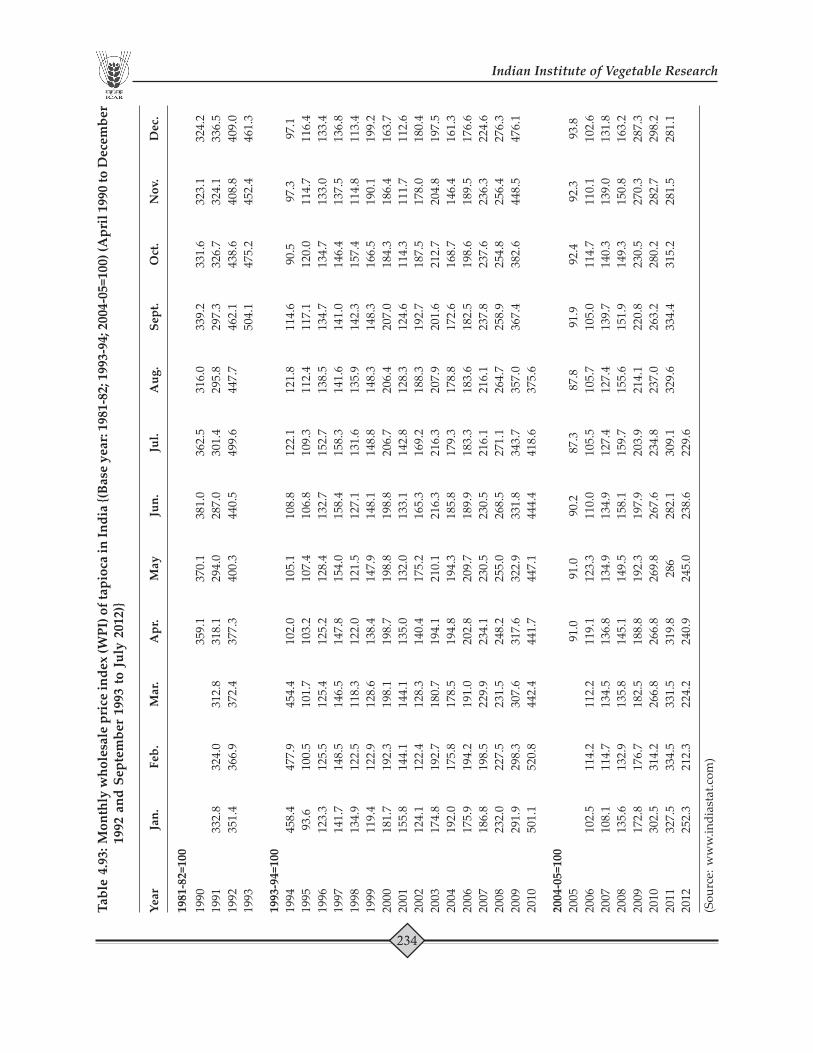
in India.Table 4.93 : Monthly wholesale price index (WPI) of tapioca 1990-2012 234
in India
Sweet potatoTable 4.94 : Area, production and yield of sweet potato. 1961-2011 235Table 4.95 : Major sweet potato producing countries in 2010-2011 236
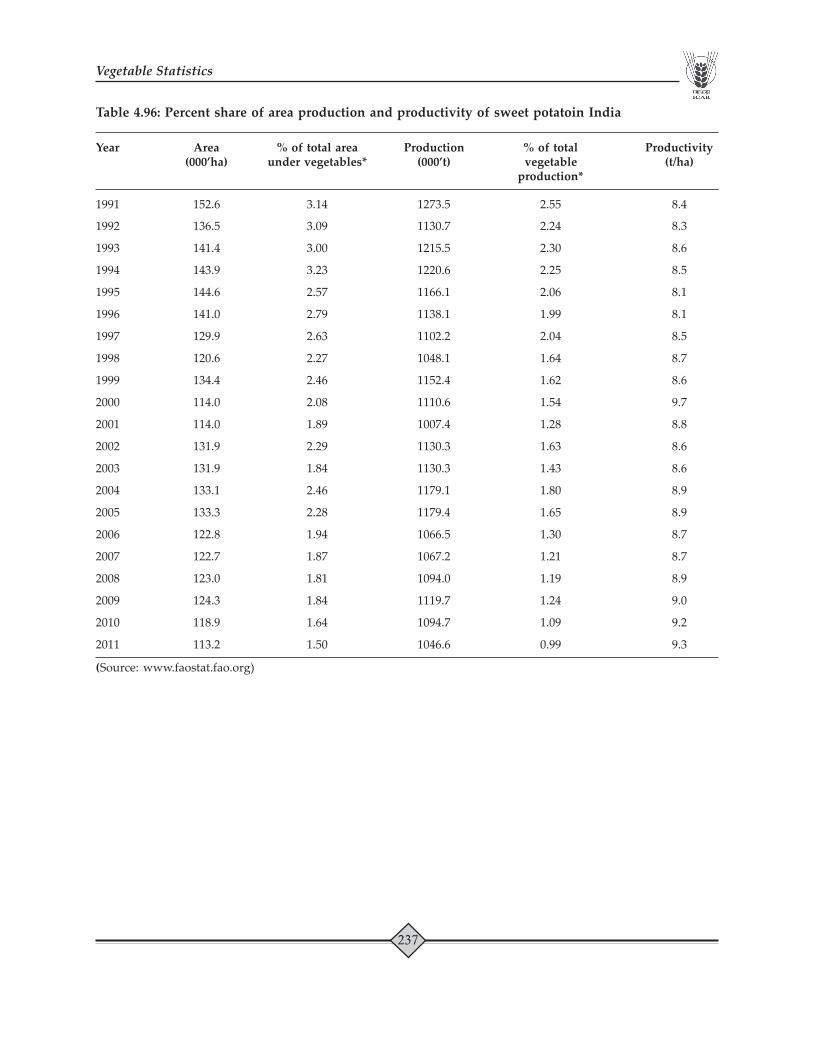
the world (2010-11).Table 4.96 : Percent share of area production and productivity 1991-2011 237
of sweet potato in India.Table 4.97 : State-wise area (A), production (P) and yield (Y) 2001-2011 238
of sweet potato in India
Page 15
Table 4.98 : Monthly whole sale price index (WPI) of sweet 1990-2012 240potato in India
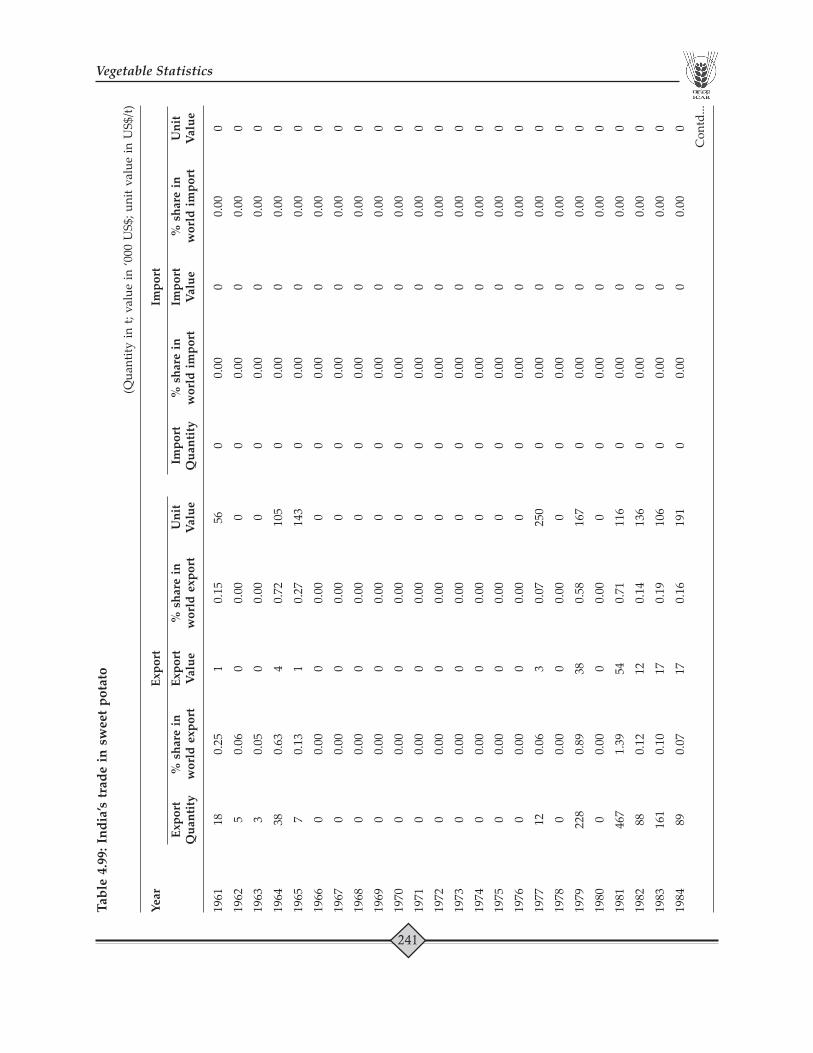
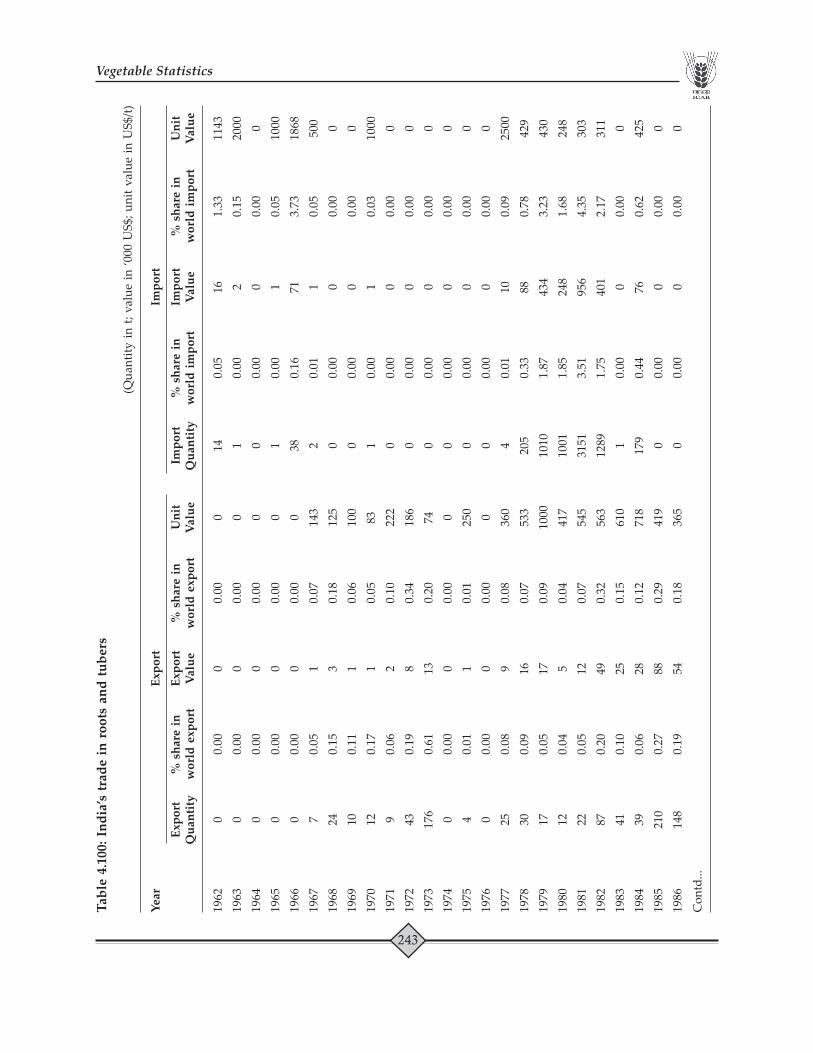
Table 4.99 : India’s trade in sweet potato. 1961-2010 241Table 4.100 : India’s trade in roots and tubers. 1962-2010 243
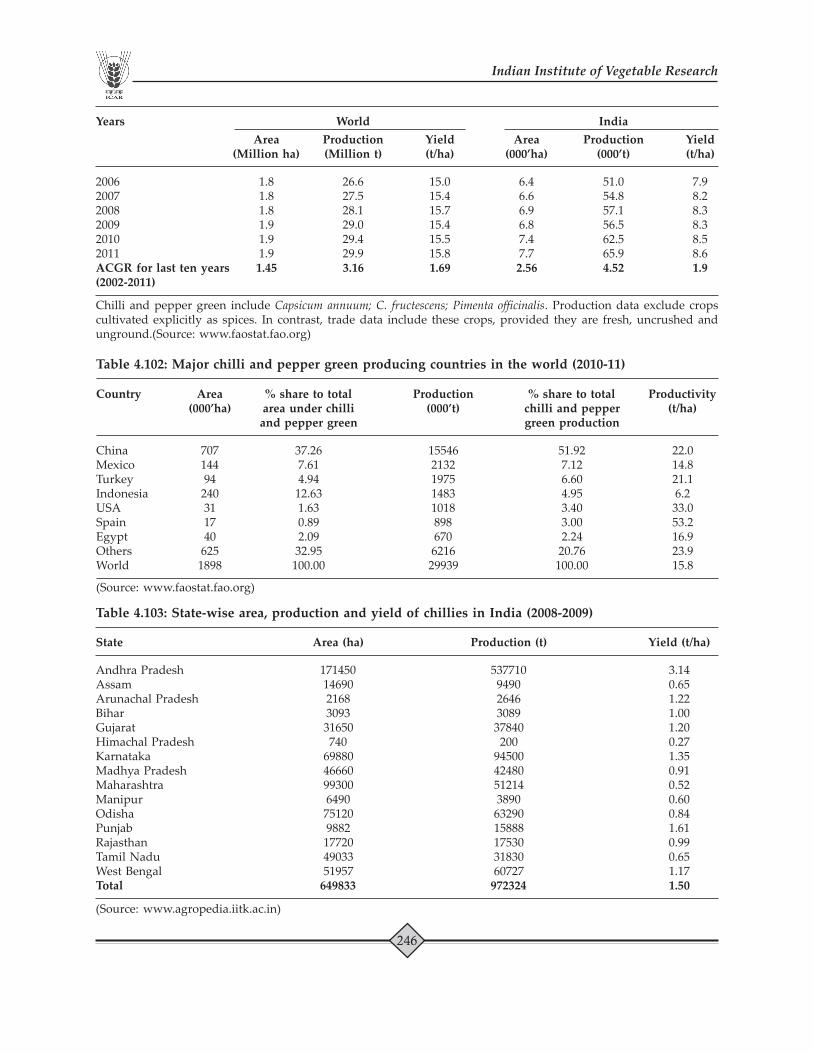
ChilliTable 4.101 : Area, production and yield of chilli and pepper green. 1961-2011 245Table 4.102 : Major chilli and pepper green producing countries 2010-2011 246
in the world (2010-11).Table 4.103 : State-wise area, production and yield of chillies in 2008-2009 246
India (2008-2009)Table 4.104 : India’s trade in chilli and pepper green 1961-2010 247Table 4.105 : Major destinations of green chilli exports from India 2008-2011 248Table 4.106 : Average whole sale price (WSP), retail price (RP) and 2012 249
total arrival of green chilli, 2012.
Page 16
Vegetable Statistics
1
Overview
Vegetables are important constituents of Indian agriculture and nutritional security due totheir short duration, high yield, nutritional richness, economic viability and ability to generateon-farm and off-farm employment. Our country is blessed with diverse agro-climates with distinctseasons, making it possible to grow wide array of vegetables. India is the second largest producerof fruits and vegetables in the world. Total area under horticultural crops is 21.83 million ha andproduction is 240.53 million t. Fruits and vegetables together contribute about 92% of the totalhorticultural production in the country.
Vegetables are vital sources of proteins, vitamins, minerals, dietary fibers, micronutrients,antioxidants and phytochemicals in our daily diet. Apart from nutrition, they also contain a widearray of potential phyto-chemicals like anti-carcinogenic principles and anti-oxidants (e.g.flavonoids, glucosinolates and isothyocynates). In India, vegetables are valuable biological assetsespecially genetic resources.They have been vividly described in the Indian scriptures like ‘Vedas’and ‘Ramayana’. India is rich in biodiversity of vegetables and is the primary/secondary centerof origin of many vegetables.
India produces 14 % (146.55 million tonnes) of world’s vegetables on 15 % (8.5 million hectares)of world area under vegetables. Productivity of vegetables in India (17.3t/ha) is less than theworld average productivity (18.8t/ha). Potato (28.9%), tomato (11.3%), onion (10.3%) and Brinjal(8.1%) are the 4major vegetables contributing 58.6% of total vegetable production in our country.Other important vegetables are cabbage (5.4%), cauliflower (4.6%), okra (3.9%) and peas(2.4%)(Figure-1). India ranks first in the production of okra in the world (73% of world production).
Figure 1: Percent share of different vegetables in total vegetable production in India
Page 17
Indian Institute of Vegetable Research
2
The country has witnessed tremendous progress in vegetable production, especially duringthe post green revolution period. Development of improved vegetable varieties/hybrids/technologies through systematic research coupled with their adoption by the farmers anddevelopmental policies of the government culminated in tremendous increase in area undervegetables (8.5 million ha), production (146.5 million t) and productivity (17.3 t/ha) in the country.Compared to area (2.84 million ha), production (16.5 million t) and productivity (5.8 t/ha) in1950-1951, there had been phenomenal increase in area (2.99 folds), production (8.88 folds) andproductivity (2.98 folds) of vegetables in our country during the last 6 decades. The per capitaavailability of vegetables is also on the increase (Figure-2). Increasing per capita income, healthconsciousness, urbanization, increasing working women, shifting of farmers to high valuevegetables due to higher income (Figure-3), favourable income elasticity of demand and annualgrowth rate for domestic demand for fruits & vegetables (Figure-4) are also important ingredientsfor fuelling vegetable growth in the country.
Figure 2: Increasing trends for area, production, productivity and per capitaavailability/consumption (g/person/day) of vegetables in India
Figure 3: Productivity values (`̀̀̀̀/ha) of different crops
Page 18
Vegetable Statistics
3
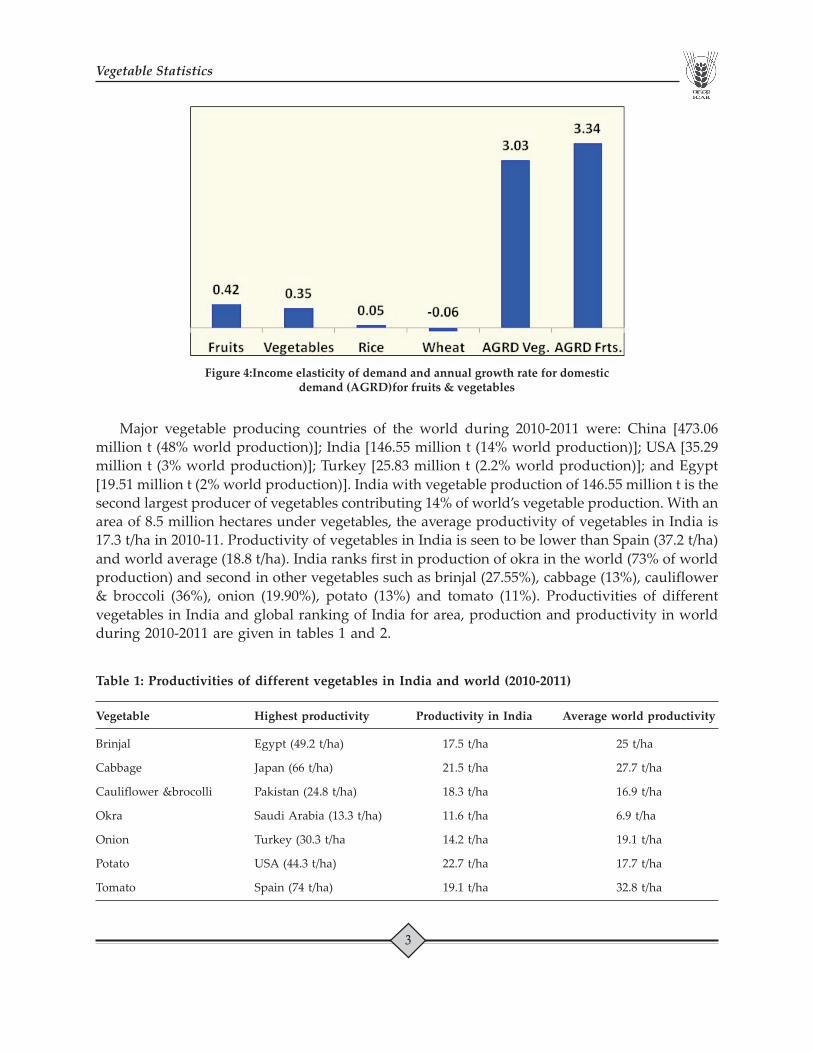
Major vegetable producing countries of the world during 2010-2011 were: China [473.06million t (48% world production)]; India [146.55 million t (14% world production)]; USA [35.29million t (3% world production)]; Turkey [25.83 million t (2.2% world production)]; and Egypt[19.51 million t (2% world production)]. India with vegetable production of 146.55 million t is thesecond largest producer of vegetables contributing 14% of world’s vegetable production. With anarea of 8.5 million hectares under vegetables, the average productivity of vegetables in India is17.3 t/ha in 2010-11. Productivity of vegetables in India is seen to be lower than Spain (37.2 t/ha)and world average (18.8 t/ha). India ranks first in production of okra in the world (73% of worldproduction) and second in other vegetables such as brinjal (27.55%), cabbage (13%), cauliflower& broccoli (36%), onion (19.90%), potato (13%) and tomato (11%). Productivities of differentvegetables in India and global ranking of India for area, production and productivity in worldduring 2010-2011 are given in tables 1 and 2.
Figure 4:Income elasticity of demand and annual growth rate for domesticdemand (AGRD)for fruits & vegetables
Table 1: Productivities of different vegetables in India and world (2010-2011)
Vegetable Highest productivity Productivity in India Average world productivity
Brinjal Egypt (49.2 t/ha) 17.5 t/ha 25 t/ha
Cabbage Japan (66 t/ha) 21.5 t/ha 27.7 t/ha
Cauliflower &brocolli Pakistan (24.8 t/ha) 18.3 t/ha 16.9 t/ha
Okra Saudi Arabia (13.3 t/ha) 11.6 t/ha 6.9 t/ha
Onion Turkey (30.3 t/ha 14.2 t/ha 19.1 t/ha
Potato USA (44.3 t/ha) 22.7 t/ha 17.7 t/ha
Tomato Spain (74 t/ha) 19.1 t/ha 32.8 t/ha
Page 19
Indian Institute of Vegetable Research
4
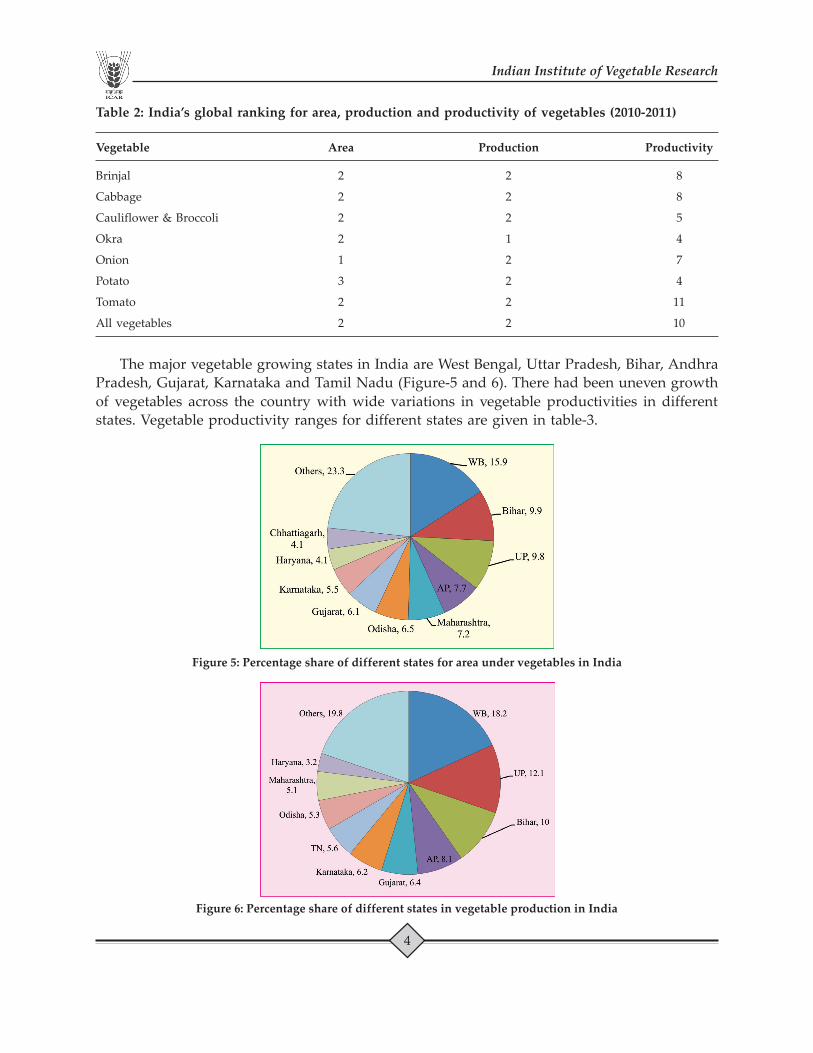
The major vegetable growing states in India are West Bengal, Uttar Pradesh, Bihar, AndhraPradesh, Gujarat, Karnataka and Tamil Nadu (Figure-5 and 6). There had been uneven growthof vegetables across the country with wide variations in vegetable productivities in differentstates. Vegetable productivity ranges for different states are given in table-3.
Table 2: India’s global ranking for area, production and productivity of vegetables (2010-2011)
Vegetable Area Production Productivity
Brinjal 2 2 8
Cabbage 2 2 8
Cauliflower & Broccoli 2 2 5
Okra 2 1 4
Onion 1 2 7
Potato 3 2 4
Tomato 2 2 11
All vegetables 2 2 10
Figure 5: Percentage share of different states for area under vegetables in India
Figure 6: Percentage share of different states in vegetable production in India
Page 20
Vegetable Statistics
5
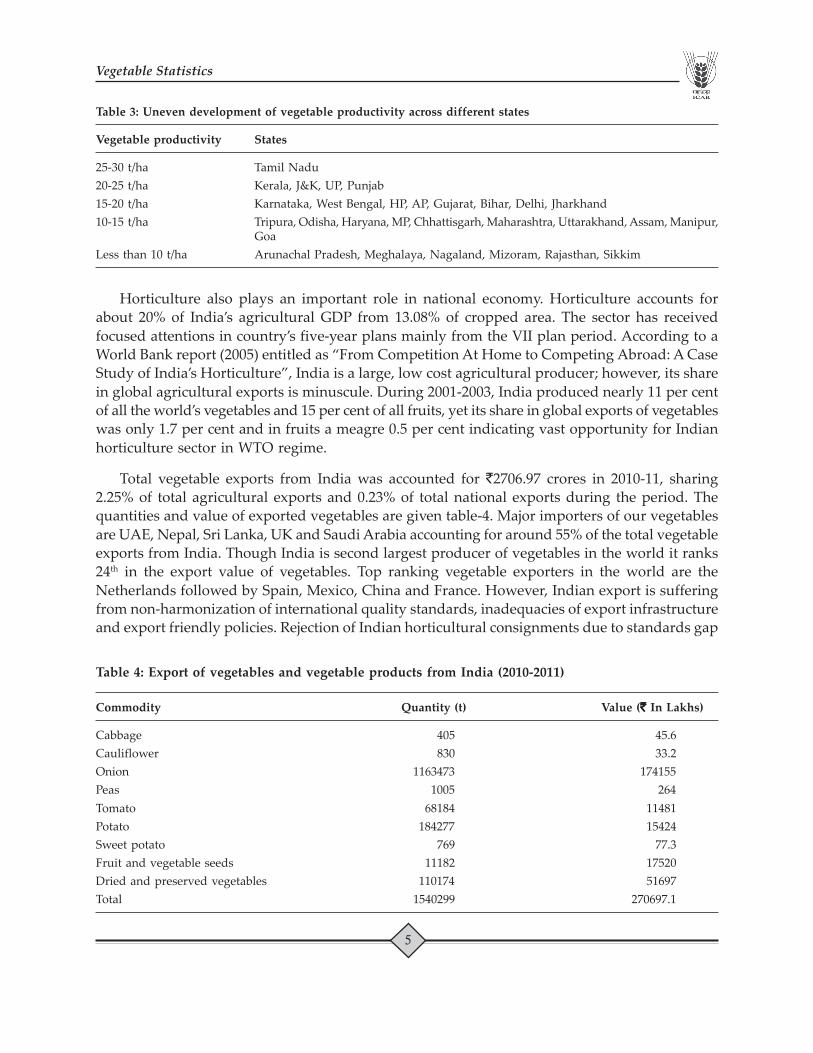
Table 3: Uneven development of vegetable productivity across different states
Vegetable productivity States
25-30 t/ha Tamil Nadu20-25 t/ha Kerala, J&K, UP, Punjab15-20 t/ha Karnataka, West Bengal, HP, AP, Gujarat, Bihar, Delhi, Jharkhand10-15 t/ha Tripura, Odisha, Haryana, MP, Chhattisgarh, Maharashtra, Uttarakhand, Assam, Manipur,
GoaLess than 10 t/ha Arunachal Pradesh, Meghalaya, Nagaland, Mizoram, Rajasthan, Sikkim
Horticulture also plays an important role in national economy. Horticulture accounts forabout 20% of India’s agricultural GDP from 13.08% of cropped area. The sector has receivedfocused attentions in country’s five-year plans mainly from the VII plan period. According to aWorld Bank report (2005) entitled as “From Competition At Home to Competing Abroad: A CaseStudy of India’s Horticulture”, India is a large, low cost agricultural producer; however, its sharein global agricultural exports is minuscule. During 2001-2003, India produced nearly 11 per centof all the world’s vegetables and 15 per cent of all fruits, yet its share in global exports of vegetableswas only 1.7 per cent and in fruits a meagre 0.5 per cent indicating vast opportunity for Indianhorticulture sector in WTO regime.
Total vegetable exports from India was accounted for `2706.97 crores in 2010-11, sharing2.25% of total agricultural exports and 0.23% of total national exports during the period. Thequantities and value of exported vegetables are given table-4. Major importers of our vegetablesare UAE, Nepal, Sri Lanka, UK and Saudi Arabia accounting for around 55% of the total vegetableexports from India. Though India is second largest producer of vegetables in the world it ranks24th in the export value of vegetables. Top ranking vegetable exporters in the world are theNetherlands followed by Spain, Mexico, China and France. However, Indian export is sufferingfrom non-harmonization of international quality standards, inadequacies of export infrastructureand export friendly policies. Rejection of Indian horticultural consignments due to standards gap
Table 4: Export of vegetables and vegetable products from India (2010-2011)
Commodity Quantity (t) Value (`̀̀̀̀ In Lakhs)
Cabbage 405 45.6Cauliflower 830 33.2Onion 1163473 174155Peas 1005 264Tomato 68184 11481Potato 184277 15424Sweet potato 769 77.3Fruit and vegetable seeds 11182 17520Dried and preserved vegetables 110174 51697Total 1540299 270697.1
Page 21
Indian Institute of Vegetable Research
6
had been a common feature. Owing to awareness among exporters and quality control initiativesby the government, such rejections are reducing in recent years.
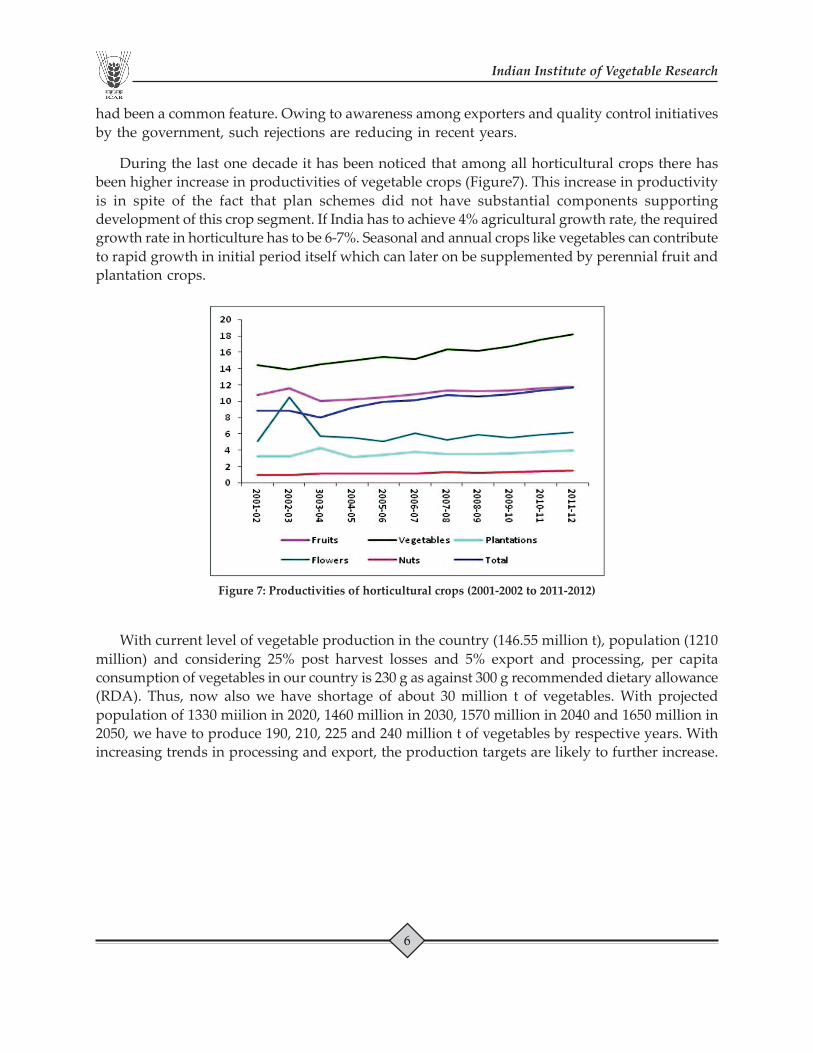
During the last one decade it has been noticed that among all horticultural crops there hasbeen higher increase in productivities of vegetable crops (Figure7). This increase in productivityis in spite of the fact that plan schemes did not have substantial components supportingdevelopment of this crop segment. If India has to achieve 4% agricultural growth rate, the requiredgrowth rate in horticulture has to be 6-7%. Seasonal and annual crops like vegetables can contributeto rapid growth in initial period itself which can later on be supplemented by perennial fruit andplantation crops.
Figure 7: Productivities of horticultural crops (2001-2002 to 2011-2012)
With current level of vegetable production in the country (146.55 million t), population (1210million) and considering 25% post harvest losses and 5% export and processing, per capitaconsumption of vegetables in our country is 230 g as against 300 g recommended dietary allowance(RDA). Thus, now also we have shortage of about 30 million t of vegetables. With projectedpopulation of 1330 miilion in 2020, 1460 million in 2030, 1570 million in 2040 and 1650 million in2050, we have to produce 190, 210, 225 and 240 million t of vegetables by respective years. Withincreasing trends in processing and export, the production targets are likely to further increase.
Page 22
Vegetable Statistics
7
Section-I
General Information on Indian Economyand Agriculture
Table 1.1: Key indicators of Indian economy
Particulars Units 2006-07 2007-08 2008-09 2009-10 2010-11 2011-12
Gross Domestic Product ` 000’Crore 4294.7 4987.1 5630.1 6457.4PE 7674.1QE 8912.2AE(GDP at Current Market Prices)Growth Rate % 16.3 16.1 12.9 14.7 18.8 16.1GDP Factor Cost at ` 000’ Crore 3564.4 3896.6 4158.7 4507.6PE 4886.0QE 5222.0AE2004-05 PricesGrowth Rate % 9.6 9.3 6.7 8.4 8.4 6.9Savings Rate % of GDP 34.6 36.8 32.0 33.8 32.3 NACapital Formation Rate % of GDP 35.7 38.1 34.3 36.6 35.1 NAPer Capita Net National Income ` 31206 35825 40775 46117 53331 60972(Factor Cost at Current Prices)Food Grains Production Million Tonnes 217.3 230.8 234.5 218.1 244.8 250.4Inflation (WPI) % Change 6.6 4.7 8.1 3.8 9.6 9.1Inflation (CPI) % Change 6.7 6.2 9.1 12.4 10.4 8.4Export Growth (US$) % Change 22.6 29.0 13.6 -3.5 40.5 23.5Import Growth (US$) % Change 24.5 35.5 20.7 -5.0 28.2 29.4Current Account Balance % -1.0 -1.3 -2.3 -2.8 -2.7 -3.6CAB/GDPForeign Exchange Reserves US$ Billion 199.2 309.7 252.0 279.1 304.8 292.8Average Exchange Rate `/US$ 45.25 40.26 45.99 47.44 45.56 47.70Population Million 1122 1138 1154 1170 1210 NA
Note: PE-Provisional estimates, QE-Quick estimates, AE- Advance estimates, NA-Not available(Source: Economic Survey 2011-12)
Table 1.2: Key census statistics of India
Items Unit 1971 1981 1991 2001 2011
Population Million 548 683 846 1027 1192Density Per km2 177 216 267 324 363Persons Per Household No. 5.46 5.55 8.51 5.35 4.80Districts No. 360 412 466 593 640Towns No. 2590 3378 3768 5545 8410Villages ’000 576 557 588 639 641Rural Population Million 439 524 629 742 833Urban Population Million 109 159 217 285 377
Contd...
Page 23
Indian Institute of Vegetable Research
8
Items Unit 1971 1981 1991 2001 2011
Urban as % of total % 19.9 23.3 25.7 27.8 31.2Male Population Million 284 353 438 531 617Female population Million 264 330 406 496 575Female per 000’ males No. 930 934 929 933 940Workers Million 181 242 307 313 384Male Million 145 179 218 240 NAFemale Million 36 63 89 72 NABirth rate Per 1000 41.2 37.2 32.5 26.1 20.97Death rate Per 1000 19.0 15.0 11.4 8.7 7.48Expectation of life at birth Years 45.6 50.5 58.2 61.1 66.8Male Years 46.4 50.9 57.7 60.4 65.77Female Years 44.7 50.0 58.7 61.8 67.95Literacy rate % 34.5 43.6 52.1 65.4 74.04Male % 46.0 56.4 63.9 75.6 82.14Female % 22.0 29.8 39.4 54.2 65.46
(Source: Agricultural Statistics at a Glance, 2011, DES, MoA, GOI)
Table 1.3: Sectoralcomposition of GDP (%)
Year Agriculture Industry Services
1950-51 53.1 16.6 30.31960-61 48.7 20.5 30.81970-71 42.3 24.0 33.81980-81 36.1 25.9 38.01990-91 29.6 27.7 42.72000-01 22.3 27.3 50.42010-11QE 14.5 27.8 57.72011-12AE 13.9 27.0 59.0
Note: QE-Quick estimates, AE-Advance estimates(Source: Economic Survey 2011-12)
Table 1.4: India’s percent share in world GDP
Year Advanced US EU UK Germany Japan B R I C SEconomies
(Current prices)1980 76.2 26.0 34.1 5.1 7.7 10.0 1.5 1.7 1.9 0.81990 79.7 26.1 31.7 4.6 7.0 13.8 2.3 1.5 1.8 0.52000 79.7 30.9 26.4 4.6 5.9 14.5 2.0 0.8 1.5 3.7 0.42005 76.1 27.7 30.2 5.0 6.1 10.0 2.0 1.7 1.8 5.0 0.52010 65.8 23.1 25.8 3.6 5.2 8.7 3.3 2.4 2.6 9.3 0.6(PPP basis)1980 69.0 24.6 31.4 4.3 6.7 8.6 3.9 2.5 2.2 1.01990 69.2 24.7 28.7 4.1 6.2 9.9 3.3 3.2 3.9 0.92000 62.8 23.5 25.0 3.6 5.1 7.6 2.9 2.7 3.7 7.1 0.72005 58.6 22.3 23.0 3.4 4.4 6.8 2.8 3.0 4.3 9.5 0.72010 52.1 19.5 20.4 2.9 4.0 5.8 2.9 3.0 5.5 13.6 0.7
PPP:- Purchasing Power Parity, BRICS:- Brazil, Russia, India, China and South-Africa(Source: Economic Survey 2011-12)
Page 24
Vegetable Statistics
9
Tabl
e 1.
5: S
tate
wis
e st
atis
tics
of I
ndia
-201
1
Stat
e/U
TA
rea
% o
fPo
pula
tion
% o
f to
tal
Den
sity
of
Sex
GSD
P%
of
Per
capi
ta(k
m2 )
tota
l are
a(M
illio
n)po
pula
tion
popu
latio
nra
tio( `̀̀̀̀
Bill
ion)
tota
l GD
Pin
com
e ( `̀̀̀̀
)
Mah
aras
htra
3077
139.
3611
2.37
9.29
365
946
1029
6.21
14.0
983
,471
Utta
r Pr
ades
h24
0928
7.33
199.
5816
.49
828
908
5884
.67
8.05
26,0
51A
ndhr
a Pr
ades
h27
5069
8.37
84.6
77.
0030
899
256
76.3
67.
7760
,458
Tam
il N
adu
1300
583.
9672
.14
5.96
555
995
5472
.67
7.49
72,9
93G
ujar
at19
6024
5.96
60.3
84.
9930
891
848
17.6
66.
5963
,961
Wes
t Ben
gal
8875
22.
7091
.35
7.55
1029
947
4436
.44
6.07
41,4
69K
arna
taka
1917
915.
8361
.13
5.05
319
968
3988
.93
5.46
59,7
63Ra
jast
han
3422
4010
.41
68.6
25.
6720
192
630
33.5
84.
1539
,967
Ker
ala
3886
31.
1833
.39
2.76
859
1084
2681
.83
3.67
59,1
79H
arya
na44
212
1.34
25.3
52.
0957
387
725
77.9
33.
5392
,327
Mad
hya
Prad
esh
3081
449.
3772
.60
6.00
236
930
2402
.39
3.29
27,2
50Pu
njab
5036
21.
5327
.70
2.29
550
893
2213
.32
3.03
67,4
73Bi
har
9416
32.
8610
3.80
8.58
1102
916
2130
.73
2.92
20,0
69O
dish
a15
5707
4.74
41.9
53.
4726
997
818
63.5
62.
5536
,923
Chh
attis
garh
1360
344.
1425
.54
2.11
189
963
1297
.18
1.78
44,0
97Jh
arkh
and
7971
42.
4232
.97
2.72
414
947
1066
.96
1.46
29,7
86A
ssam
7843
82.
3931
.17
2.58
397
954
1042
.18
1.43
30,4
13U
ttara
khan
d53
484
1.63
10.1
20.
8418
996
377
5.8
1.06
68,2
92H
imac
hal P
rade
sh55
673
1.69
6.86
0.57
123
974
524.
260.
7258
,493
Jam
mu
& K
ashm
ir22
2236
6.76
12.5
51.
0456
883
477.
090.
6533
,056
Goa
3702
0.11
1.46
0.12
394
968
298.
730.
4113
2,71
9Tr
ipur
a10
493
0.32
3.67
0.30
350
961
163.
280.
2238
,493
Meg
hala
ya22
429
0.68
2.96
0.24
132
986
146.
450.
2048
,383
Nag
alan
d16
579
0.50
1.98
0.16
119
931
109.
330.
1521
,434
Man
ipur
2232
70.
682.
720.
2212
298
791
.98
0.13
29,6
84A
runa
chal
Pra
desh
8374
32.
551.
380.
1117
920
72.6
30.
1051
,644
Miz
oram
2108
10.
641.
090.
0952
975
61.7
90.
0845
,982
Sikk
im70
960.
220.
610.
0586
889
56.5
20.
0848
,937
Del
hi14
830.
0516
.75
1.38
9340
866
2588
.08
3.54
116,
886
Cha
ndig
arh
114
0.00
1.05
0.09
9252
818
207.
040.
2812
0,91
2Pu
duch
erry
479
0.01
1.24
0.10
2598
1038
129.
290.
1882
,767
A &
N Is
land
8249
0.25
0.38
0.03
4687
843
.23
0.06
74,3
40D
adar
& N
. Hav
eli
491
0.01
0.34
0.03
698
775
19.8
40.
0351
,364
Diu
and
Dam
an11
20.
003
0.24
0.02
2169
618
12.2
0.02
39,9
70La
ksha
dwee
p32
0.00
10.
060.
005
2013
946
4.42
0.01
51,3
20In
dia
3287
240
100
1210
100
382
940
6666
4.56
0.91
1970
326
(Sou
rce:
Agr
icul
tura
l Sta
tistic
s at
a G
lanc
e 20
11; D
ES, M
oA, G
OI;
and
Econ
omic
Sur
vey
2011
-201
2)
Page 25
Indian Institute of Vegetable Research
10
Table 1.6: Gross domestic product from agriculture and allied sector and its percentage share to totalGDP (1954-55 to 2011-12). (GDP at 1999-00 prices upto 2003-04 and 2004-05 prices upto 2011-12)
Year GDP total GDP from agriculture % share of agriculture & Growth rate of(`̀̀̀̀ crores) & allied sector (`̀̀̀̀ crores) allied sector to total GDP agricultural GDP
1954-55 261615 143791 54.96 -1955-56 268316 142549 53.13 -0.861956-57 283589 150298 53.00 5.441960-61 329825 166954 50.62 11.081961-62 340060 167095 49.14 0.081962-63 347253 163771 47.16 -1.991963-64 364834 167602 45.94 2.341964-65 392503 183062 46.64 9.221965-66 378157 162848 43.06 -11.041966-67 382006 160532 42.02 -1.421967-68 413094 184404 44.64 14.871968-69 423874 184112 43.44 -0.161969-70 451496 195946 43.40 6.431970-71 474131 209843 44.26 7.091971-72 478918 205903 42.99 -1.881972-73 477392 195570 40.97 -5.021973-74 499120 209655 42.00 7.201974-75 504914 206461 40.89 -1.521975-76 550379 233074 42.35 12.891976-77 557258 219606 39.41 -5.781977-78 598885 241646 40.35 10.041978-79 631839 247210 39.13 2.301979-80 598974 215630 36.00 -12.771980-81 641921 243421 37.92 12.891981-82 678033 254622 37.55 4.601982-83 697861 253907 36.38 -0.281983-84 752669 279605 37.15 10.121984-85 782484 284037 36.30 1.591985-86 815049 284930 34.96 0.311986-87 850217 283763 33.38 -0.411987-88 880267 279257 31.72 -1.591988-89 969702 322932 33.30 15.641989-90 1029178 326773 31.75 1.191990-91 1083572 339893 31.37 4.021991-92 1099072 333256 30.32 -1.951992-93 1158025 355421 30.69 6.651993-94 1223816 367231 30.01 3.321994-95 1302076 384549 29.53 4.721995-96 1396974 381875 27.34 -0.701996-97 1508378 419759 27.83 9.921997-98 1573263 409039 26.00 -2.551998-99 1678410 434892 25.91 6.321999-00 1786526 446515 24.99 2.67Contd...
Page 26
Vegetable Statistics
11
Year GDP total GDP from agriculture % share of agriculture & Growth rate of(`̀̀̀̀ crores) & allied sector (`̀̀̀̀ crores) allied sector to total GDP agricultural GDP
2000-01 1864300 445403 23.89 -0.252001-02 1972605 473248 23.99 6.252002-03 2048287 438966 21.43 -7.242003-04 2222759 482677 21.72 9.962004-05 2971464 565426 19.03 -2005-06 3253073 594487 18.27 5.142006-07 3564364 619190 17.37 4.162007-08 3896636 655080 16.81 5.802008-09 4158676 655689 15.77 0.092009-10 4507637 662509 14.70 1.042010-11 4885954 709103 14.51 7.032011-12 5222027 727161 13.92 2.55
(Source: http://planningcommission.gov.in)
Table 1.8: Rural population and agricultural workers
Year Total Average annual Rural Agricultural workers (Million) Totalpopulation exponential population agricultural(Million) growth rate (Million) Cultivators Agricultural workers
(%) labourers (Million)
1951 361.1 1.25 298.6 (82.7)* 69.9 (71.9) 27.3 (28.1) 97.21961 439.2 1.96 360.3 (82.0) 99.6 (76.0) 31.5 (24.0) 131.11971 548.2 2.20 439.0 (80.1) 78.2 (62.2) 47.5 (37.8) 125.71981 683.3 2.22 523.9 (76.7) 92.5 (62.5) 55.5 (37.5) 148.01991 846.4 2.16 628.9 (74.3) 110.7 (59.7) 74.6 (40.3) 185.32001 1028.7 1.97 742.6 (72.2) 127.3 (54.4) 106.8 (45.6) 234.12011 1210.2 1.64 833.1 (68.8) N. A. N. A. N. A.
(Source: Agricultural Research Data Book, 2011, IASRI)*Figures in parentheses indicate % of population.
Table 1.7: Continent-wise agricultural and rural population in the world
Region Total population Agricultural population Rural population(‘000) (% of total) (% of total)
2000 2010 2000 2010 2000 2010
Africa 811099 1022237 55.10 50.22 64.09 59.99America 834718 934610 13.59 10.59 23.14 19.47Asia 3719042 4164252 52.57 46.97 63.26 57.76Australia 23022 26636 5.29 4.52 13.09 11.37Europe 726780 738197 8.48 5.89 29.20 27.22North America 313288 344529 2.25 1.68 20.87 17.88South America 347433 392556 17.40 13.12 20.33 16.05Developed Countries 662705 833145 69.73 64.50 75.36 70.81Developing Countries 331296 410365 65.47 62.84 73.79 71.90World 6122769 6895888 42.20 37.98 53.69 49.48
(Source: www.faostat.fao.org)
Page 27
Indian Institute of Vegetable Research
12
Tabl
e 1.
9: L
and
stat
istic
s of
Ind
ia
(000
’ ha)
Year
sC
ount
ry%
sha
reLa
nd%
sha
re to
Agr
icul
-% s
hare
toA
rabl
e%
sha
re to
Fore
st%
sha
re to
Inla
nd%
sha
re to
Oth
er%
sha
re to
area
to w
orld
area
coun
try
tura
lco
untr
yla
ndco
untr
yar
eaco
untr
yw
ater
coun
try
land
coun
try
area
area
area
area
area
area
area
area
1990
3287
262.
4429
7319
90.4
518
1040
55.0
716
2788
49.5
263
939
19.4
531
407
9.55
5234
015
.92
1991
3287
262.
4429
7319
90.4
518
1140
55.1
016
2340
49.3
864
084
19.4
931
407
9.55
5209
515
.85
1992
3287
262.
4529
7319
90.4
518
0940
55.0
416
1970
49.2
764
229
19.5
431
407
9.55
5215
015
.86
1993
3287
262.
4529
7319
90.4
518
1038
55.0
716
2037
49.2
964
374
19.5
831
407
9.55
5190
715
.79
1994
3287
262.
4529
7319
90.4
518
1030
55.0
716
1990
49.2
864
519
19.6
331
407
9.55
5177
015
.75
1995
3287
262.
4529
7319
90.4
518
0780
54.9
916
1750
49.2
164
665
19.6
731
407
9.55
5187
515
.78
1996
3287
262.
4529
7319
90.4
518
0881
55.0
216
1501
49.1
364
810
19.7
231
407
9.55
5162
815
.71
1997
3287
262.
4529
7319
90.4
518
0856
55.0
216
1518
49.1
364
955
19.7
631
407
9.55
5150
815
.67
1998
3287
262.
4529
7319
90.4
518
1048
55.0
816
1534
49.1
465
100
19.8
031
407
9.55
5117
115
.57
1999
3287
262.
4529
7319
90.4
518
0950
55.0
516
1002
48.9
865
245
19.8
531
407
9.55
5112
415
.55
2000
3287
262.
4529
7319
90.4
518
2573
55.5
416
2717
49.5
065
390
19.8
931
407
9.55
4935
615
.01
2001
3287
262.
4529
7319
90.4
518
0370
54.8
716
0288
48.7
665
854
20.0
331
407
9.55
5109
515
.54
2002
3287
262.
4529
7319
90.4
518
0037
54.7
715
9934
48.6
566
318
20.1
731
407
9.55
5096
415
.50
2003
3287
262.
4529
7319
90.4
518
0309
54.8
515
9865
48.6
366
781
20.3
231
407
9.55
5022
915
.28
2004
3287
262.
4529
7319
90.4
518
0083
54.7
815
9450
48.5
167
245
20.4
631
407
9.55
4999
115
.21
2005
3287
262.
4529
7319
90.4
517
9858
54.7
115
9213
48.4
367
709
20.6
031
407
9.55
4975
215
.13
2006
3287
262.
4529
7319
90.4
517
9973
54.7
515
8720
48.2
867
854
20.6
431
407
9.55
4949
215
.06
2007
3287
262.
4529
7319
90.4
517
9709
54.6
715
8104
48.1
067
999
20.6
931
407
9.55
4961
115
.09
2008
3287
262.
4429
7319
90.4
517
9708
54.6
715
8030
48.0
768
144
20.7
331
407
9.55
4946
715
.05
2009
3287
262.
4429
7319
90.4
517
9963
54.7
515
7923
48.0
468
289
20.7
731
407
9.55
4906
714
.93
(Sou
rce:
ww
w.fa
osta
t.fao
.org
)
Page 28
Vegetable Statistics
13
Table 1.10: Land use classification in India (1950-51 to 2009-10)
Year Net area Total cropped Area sown more Agricul. land/ Cultivated Croppingsown area than once cultivable land land intensity
(000’ ha) (000’ ha) ( 000’ ha) (000’ ha) (000’ ha) (%)
1950-51 118746 131893 13147 189641 129425 111.11951-52 119400 133234 13834 180172 133208 111.61952-53 123442 137675 14233 181258 136341 111.51953-54 126806 142480 15674 180279 138831 112.41954-55 127845 144087 16242 181428 139808 112.71955-56 129156 147311 18155 180705 140739 114.11956-57 130848 149492 18644 181234 142206 114.21957-58 129080 145832 16752 181089 141780 1131958-59 131828 151629 19801 181710 143280 1151959-60 132939 152824 19885 181221 144864 1151960-61 133199 152772 19573 179689 144838 114.71961-62 135399 156209 20810 180164 146554 115.41962-63 136341 156760 20419 180060 147399 1151963-64 136483 156963 20480 179802 147712 1151964-65 138120 159229 21109 179921 149276 115.31965-66 136198 155276 19078 179685 149382 1141966-67 137232 157355 20123 180496 150761 114.71967-68 139876 163736 23860 180804 151800 117.11968-69 137313 159529 22216 180540 151409 116.21969-70 138695 162265 23570 180848 151018 1171970-71 140863 165791 24928 182056 151461 117.71971-72 139721 165186 25465 182442 152390 118.21972-73 137144 162150 25006 183376 152320 118.21973-74 142416 169872 27456 183567 153708 119.31974-75 137791 164191 26400 183870 154098 119.21975-76 141652 171296 29644 184800 154198 120.91976-77 139476 167334 27858 184533 154046 1201977-78 141953 172232 30279 185422 154981 121.31978-79 142981 174802 31821 185736 155451 122.31979-80 138903 169589 30686 184812 154601 122.11980-81 140288 172630 32342 185156 155114 123.11981-82 142120 176750 34630 185170 155485 124.41982-83 140813 172748 31935 184864 155630 122.71983-84 143211 179560 36349 184983 156519 125.41984-85 140901 176330 35429 185222 156259 125.11985-86 140901 178464 37563 185127 155795 126.71986-87 139578 176405 36827 185253 155818 126.41987-88 134085 170738 36653 184898 154997 127.31988-89 141891 182277 40386 185142 156214 128.51989-90 142339 182269 39930 185211 156033 128.11990-91 142999 185742 42743 185177 156702 129.91991-92 141632 182242 40610 185000 156304 128.71992-93 142645 185618 42973 184875 156833 130.11993-94 142419 186595 44176 184734 156795 1311994-95 142960 188053 45093 184173 156210 131.51995-96 142197 187471 45274 183623 156028 131.8
Contd...
Page 29
Indian Institute of Vegetable Research
14
Year Net area Total cropped Area sown more Agricul. land/ Cultivated Croppingsown area than once cultivable land land intensity
(000’ ha) (000’ ha) (000’ ha) (000’ ha) (000’ ha) (%)
1996-97 142931 189502 46571 184121 156254 132.61997-98 141945 189988 48043 183972 156220 133.81998-99 142753 191649 48896 184024 156340 134.31999-00 141063 188396 47333 183873 156116 133.62000-01 141336 185340 44005 183455 156113 131.12001-02 140700 188286 47586 183551 156044 133.82002-03 132051 174108 42057 183449 154388 131.82003-04 140708 189669 48961 183132 155196 134.82004-05 140642 191119 50476 182946 155432 135.92005-06 141162 192756 51594 182685 155373 136.52006-07 139848 192408 52560 182508 155357 137.62007-08 141377 195138 53761 182691 155889 1382008-09 141929 195357 53428 182514 156120 137.62009-10 140022 192197 52175 182466 155774 137.3
(Source: www.indiastat.com)
Table 1.11: Area under broad soil groups
Major soil groups Area (million ha) % of total geographical area
Red loamy 23.0 7.00Red sandy 49.0 14.90Laterite 11.7 3.60Red & yellow 33.5 10.20Shallow black 6.5 2.00Medium black 41.7 12.70Deep black 16.2 4.90Mixed red & black 14.8 4.50Coastal alluvium 6.2 1.90Coastal sand 1.1 0.30Deltaic alluvium 7.1 2.20Alluvial recent 39.0 11.90Calcareous alluvium 2.2 0.70Calcareous sierozem 4.9 1.50Old alluvium 2.8 0.90Grey brown 8.9 2.70Desert soils-regosolic 13.4 4.10Desert soils-lithosolic 8.5 2.60Tarai 3.1 0.90Brown hill 12.4 3.80Sub-mountane 4.7 1.40Mountain meadow 6.6 2.00Peaty & saline peaty 0.4 0.10Skeletal 4.2 1.30Other 6.8 1.90Total geographical area 328.7 100.00
(Source: Agricultural Research Data Book, 2011, IASRI)
Page 30
Vegetable Statistics
15
Table 1.12: Water statistics of India, 2010
Sl. No. Items
1 Average precipitation in depth (mm/yr) 10832 Average precipitation in volume (109 m3/yr) 35603 Surface water: produced internally (109 m3/yr) 14044 Groundwater: produced internally (109 m3/yr) 4325 Overlap between surface water and groundwater (109 m3/yr) 3906 Water resources: total internal renewable (109 m3/yr) 14467 Water resources: total internal renewable per capita (m3/inhabitant/yr) 11818 Surface water: entering the country (natural) (109 m3/yr) 635.29 Surface water: accounted inflow (actual) (109 m3/yr) 635.210 Surface water: total entering and bordering the country (natural) (109 m3/yr) 635.211 Surface water: total entering and bordering the country (actual) (109 m3/yr) 635.212 Surface water: leaving the country (natural) (109 m3/yr) 138513 Surface water: outflow not submitted to treaties (actual) (109 m3/yr) 114214 Surface water: outflow submitted to treaties (actual) (109 m3/yr) 24315 Surface water: outflow secured through treaties (actual) (109 m3/yr) 170.316 Surface water: total external renewable (actual) (109 m3/yr) 464.917 Water resources: total external renewable (natural) (109 m3/yr) 635.218 Water resources: total external renewable (actual) (109 m3/yr) 464.919 Surface water: total renewable (natural) (109 m3/yr) 203920 Surface water: total renewable (actual) (109 m3/yr) 186921 Groundwater: total renewable (natural) (109 m3/yr) 43222 Groundwater: total renewable (actual) (109m3/yr) 43223 Water resources: total renewable (natural) (109 m3/yr) 208124 Water resources: total renewable (actual) (109 m3/yr) 191125 Water resources: total renewable per capita (actual) (m3/inhabitant/yr) 156026 Agricultural water withdrawal (109 m3/yr) 68827 Industrial water withdrawal (109 m3/yr) 1728 Municipal water withdrawal (109 m3/yr) 5629 Total water withdrawal (109 m3/yr) 76130 Agricultural water withdrawal as % of total water withdrawal (%) 90.4131 Industrial water withdrawal as % of total water withdrawal (%) 2.23432 Municipal water withdrawal as % of total withdrawal (%) 7.35933 Total water withdrawal per capita (m3/inhabitant/yr) 621.434 Municipal water withdrawal per capita (total population) (m3/inhabitant/yr) 45.7335 Fresh surface water withdrawal (primary and secondary) (109 m3/yr) 51036 Fresh groundwater withdrawal (primary and secondary) (109 m3/yr) 25137 Total freshwater withdrawal (primary and secondary) (109 m3/yr) 647.538 Direct use of agricultural drainage water (109 m3/yr) 113.539 Freshwater withdrawal as % of total actual renewable water resources (%) 33.8840 Agricultural water withdrawal as % of total actual renewable water resources (%) 36
(Source: www.faostat.fao.org)
Page 31
Indian Institute of Vegetable Research
16
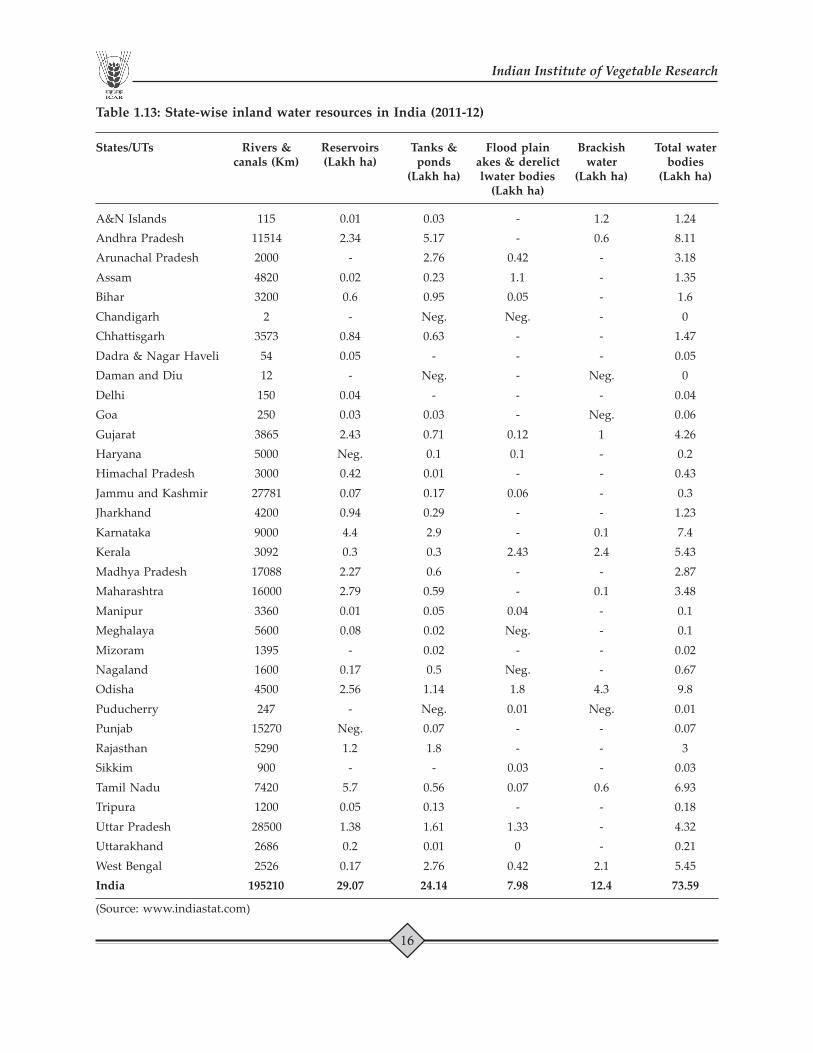
Table 1.13: State-wise inland water resources in India (2011-12)
States/UTs Rivers & Reservoirs Tanks & Flood plain Brackish Total watercanals (Km) (Lakh ha) ponds akes & derelict water bodies
(Lakh ha) lwater bodies (Lakh ha) (Lakh ha)(Lakh ha)
A&N Islands 115 0.01 0.03 - 1.2 1.24Andhra Pradesh 11514 2.34 5.17 - 0.6 8.11Arunachal Pradesh 2000 - 2.76 0.42 - 3.18Assam 4820 0.02 0.23 1.1 - 1.35Bihar 3200 0.6 0.95 0.05 - 1.6Chandigarh 2 - Neg. Neg. - 0Chhattisgarh 3573 0.84 0.63 - - 1.47Dadra & Nagar Haveli 54 0.05 - - - 0.05Daman and Diu 12 - Neg. - Neg. 0Delhi 150 0.04 - - - 0.04Goa 250 0.03 0.03 - Neg. 0.06Gujarat 3865 2.43 0.71 0.12 1 4.26Haryana 5000 Neg. 0.1 0.1 - 0.2Himachal Pradesh 3000 0.42 0.01 - - 0.43Jammu and Kashmir 27781 0.07 0.17 0.06 - 0.3Jharkhand 4200 0.94 0.29 - - 1.23Karnataka 9000 4.4 2.9 - 0.1 7.4Kerala 3092 0.3 0.3 2.43 2.4 5.43Madhya Pradesh 17088 2.27 0.6 - - 2.87Maharashtra 16000 2.79 0.59 - 0.1 3.48Manipur 3360 0.01 0.05 0.04 - 0.1Meghalaya 5600 0.08 0.02 Neg. - 0.1Mizoram 1395 - 0.02 - - 0.02Nagaland 1600 0.17 0.5 Neg. - 0.67Odisha 4500 2.56 1.14 1.8 4.3 9.8Puducherry 247 - Neg. 0.01 Neg. 0.01Punjab 15270 Neg. 0.07 - - 0.07Rajasthan 5290 1.2 1.8 - - 3Sikkim 900 - - 0.03 - 0.03Tamil Nadu 7420 5.7 0.56 0.07 0.6 6.93Tripura 1200 0.05 0.13 - - 0.18Uttar Pradesh 28500 1.38 1.61 1.33 - 4.32Uttarakhand 2686 0.2 0.01 0 - 0.21West Bengal 2526 0.17 2.76 0.42 2.1 5.45India 195210 29.07 24.14 7.98 12.4 73.59
(Source: www.indiastat.com)
Page 32
Vegetable Statistics
17
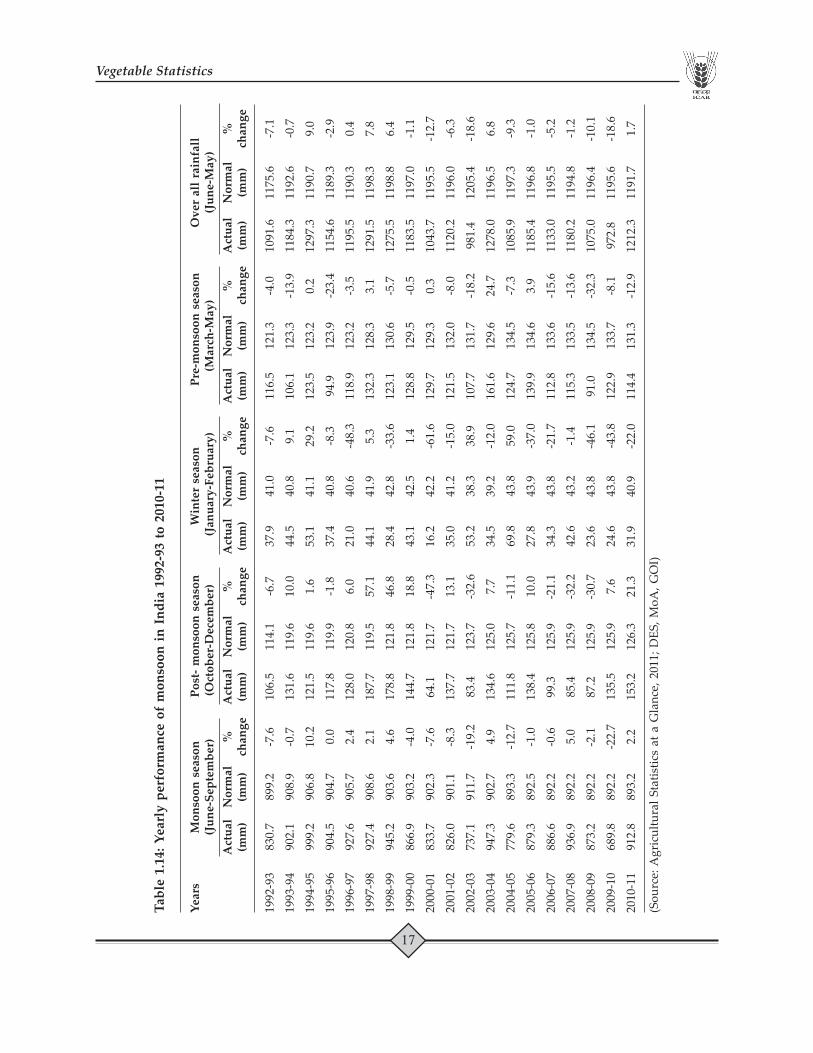
Tabl
e 1.
14: Y
earl
y pe
rfor
man
ce o
f m
onso
on in
Ind
ia 1
992-
93 to
201
0-11
Year
sM
onso
on s
easo
nPo
st- m
onso
on s
easo
nW
inte
r se
ason
Pre-
mon
soon
sea
son
Ove
r al
l rai
nfal
l(J
une-
Sept
embe
r)(O
ctob
er-D
ecem
ber)
(Jan
uary
-Feb
ruar
y)(M
arch
-May
)(J
une-
May
)A
ctua
lN
orm
al%
Act
ual
Nor
mal
%A
ctua
lN
orm
al%
Act
ual
Nor
mal
%A
ctua
lN
orm
al%
(mm
)(m
m)
chan
ge(m
m)
(mm
)ch
ange
(mm
)(m
m)
chan
ge(m
m)
(mm
)ch
ange
(mm
)(m
m)
chan
ge
1992
-93
830.
789
9.2
-7.6
106.
511
4.1
-6.7
37.9
41.0
-7.6
116.
512
1.3
-4.0
1091
.611
75.6
-7.1
1993
-94
902.
190
8.9
-0.7
131.
611
9.6
10.0
44.5
40.8
9.1
106.
112
3.3
-13.
911
84.3
1192
.6-0
.7
1994
-95
999.
290
6.8
10.2
121.
511
9.6
1.6
53.1
41.1
29.2
123.
512
3.2
0.2
1297
.311
90.7
9.0
1995
-96
904.
590
4.7
0.0
117.
811
9.9
-1.8
37.4
40.8
-8.3
94.9
123.
9-2
3.4
1154
.611
89.3
-2.9
1996
-97
927.
690
5.7
2.4
128.
012
0.8
6.0
21.0
40.6
-48.
311
8.9
123.
2-3
.511
95.5
1190
.30.
4
1997
-98
927.
490
8.6
2.1
187.
711
9.5
57.1
44.1
41.9
5.3
132.
312
8.3
3.1
1291
.511
98.3
7.8
1998
-99
945.
290
3.6
4.6
178.
812
1.8
46.8
28.4
42.8
-33.
612
3.1
130.
6-5
.712
75.5
1198
.86.
4
1999
-00
866.
990
3.2
-4.0
144.
712
1.8
18.8
43.1
42.5
1.4
128.
812
9.5
-0.5
1183
.511
97.0
-1.1
2000
-01
833.
790
2.3
-7.6
64.1
121.
7-4
7.3
16.2
42.2
-61.
612
9.7
129.
30.
310
43.7
1195
.5-1
2.7
2001
-02
826.
090
1.1
-8.3
137.
712
1.7
13.1
35.0
41.2
-15.
012
1.5
132.
0-8
.011
20.2
1196
.0-6
.3
2002
-03
737.
191
1.7
-19.
283
.412
3.7
-32.
653
.238
.338
.910
7.7
131.
7-1
8.2
981.
412
05.4
-18.
6
2003
-04
947.
390
2.7
4.9
134.
612
5.0
7.7
34.5
39.2
-12.
016
1.6
129.
624
.712
78.0
1196
.56.
8
2004
-05
779.
689
3.3
-12.
711
1.8
125.
7-1
1.1
69.8
43.8
59.0
124.
713
4.5
-7.3
1085
.911
97.3
-9.3
2005
-06
879.
389
2.5
-1.0
138.
412
5.8
10.0
27.8
43.9
-37.
013
9.9
134.
63.
911
85.4
1196
.8-1
.0
2006
-07
886.
689
2.2
-0.6
99.3
125.
9-2
1.1
34.3
43.8
-21.
711
2.8
133.
6-1
5.6
1133
.011
95.5
-5.2
2007
-08
936.
989
2.2
5.0
85.4
125.
9-3
2.2
42.6
43.2
-1.4
115.
313
3.5
-13.
611
80.2
1194
.8-1
.2
2008
-09
873.
289
2.2
-2.1
87.2
125.
9-3
0.7
23.6
43.8
-46.
191
.013
4.5
-32.
310
75.0
1196
.4-1
0.1
2009
-10
689.
889
2.2
-22.
713
5.5
125.
97.
624
.643
.8-4
3.8
122.
913
3.7
-8.1
972.
811
95.6
-18.
6
2010
-11
912.
889
3.2
2.2
153.
212
6.3
21.3
31.9
40.9
-22.
011
4.4
131.
3-1
2.9
1212
.311
91.7
1.7
(Sou
rce:
Agr
icul
tura
l Sta
tistic
s at
a G
lanc
e, 2
011;
DES
, MoA
, GO
I)
Page 33
Indian Institute of Vegetable Research
18
Tabl
e 1.
15:C
hang
es in
foo
d co
nsum
ptio
n pa
ttern
in r
ural
and
urb
an a
reas
: All-
Indi
a, 1
987–
88 to
200
9–10
Food
Ite
mR
ural
(% s
hare
of
cons
umpt
ion)
Urb
an (%
sha
re o
f co
nsum
ptio
n)19
87-8
819
93-9
419
99-0
020
04-0
520
09-1
019
87-8
819
93-9
419
99-0
020
04-0
520
09-1
0
Cer
eals
26.3
24.2
22.2
18.0
15.6
15.0
14.0
12.4
10.1
9.1
Gra
in0.
20.
20.
10.
10.
20.
20.
20.
10.
10.
1
Cer
eal S
ubst
itute
s0.
10.
10.
10.
10.
10.
10.
10.
00.
00.
0
Puls
es &
its
prod
ucts
4.0
3.8
3.8
3.1
3.7
3.4
3.0
2.8
2.1
2.7
Milk
& it
s pr
oduc
ts8.
69.
58.
88.
58.
69.
59.
88.
77.
97.
8
Edib
le O
il5.
04.
43.
74.
63.
75.
34.
43.
13.
52.
6
Egg,
Fis
h &
Mea
t3.
33.
33.
33.
33.
53.
63.
43.
12.
72.
7
Vege
tabl
es5.
26.
06.
26.
16.
25.
35.
55.
14.
54.
3
Frui
ts &
Nut
s1.
61.
71.
71.
91.
62.
52.
72.
42.
22.
1
Suga
r2.
93.
12.
42.
42.
42.
42.
41.
61.
51.
5
Salt
& S
pice
s2.
922
.73.
02.
52.
42.
32.
02.
21.
71.
5
Beve
rage
s et
c3.
94.
24.
24.
55.
66.
87.
26.
46.
26.
3
Food
Tot
al64
.063
.259
.455
.053
.656
.454
.748
.142
.540
.7
Non
-Foo
d To
tal
36.0
36.8
40.6
45.0
46.4
43.6
45.3
51.9
57.5
59.3
(Sou
rce:
Hou
seho
ld C
onsu
mpt
ion
Expe
nditu
re 2
009-
10, 6
6th R
ound
Sur
vey
Repo
rt o
f NSS
O)
Page 34
Vegetable Statistics
19
Tabl
e1.1
6: F
low
of
inst
itutio
nal c
redi
t for
agr
icul
ture
in I
ndia
fro
m 2
001-
02 to
201
0-11
` in
Cro
res
Item
2001
-02
2002
-03
2003
-04
2004
-05
2005
-06
2006
-07
2007
-08
2008
-09
2009
-10
2010
-11
Prod
uctio
n (s
hort
term
) cre
dit
Co-
Ope
rativ
e Ba
nks
1878
719
668
2264
027
157
3493
038
622
4051
540
230
5694
664
527
Regi
onal
Rur
al B
anks
3777
4775
6088
1001
012
712
1663
120
715
2241
329
802
3780
8
Com
mer
cial
Ban
ks17
904
2110
426
192
3679
357
640
8320
212
2289
1478
1818
9908
2167
73
Oth
er A
genc
ies
4139
5710
468
00
00
0
Sub
Tota
l (A
)40
509
4558
654
977
7406
410
5350
1384
5518
3519
2104
6127
6656
3191
08
Med
ium
/long
-term
cre
dit c
omm
erci
al &
rur
al b
anks
Co-
Ope
rativ
e Ba
nks
4737
3968
4235
4074
4474
3858
3169
5962
6551
5578
Regi
onal
Rur
al B
anks
1077
1295
1493
2394
2511
3804
4099
4352
5415
6160
Com
mer
cial
Ban
ks15
683
1867
026
249
4468
867
837
8328
358
798
8113
395
892
1159
33
Oth
er A
genc
ies
3941
2789
314
00
00
0
Sub
Tota
l (B)
2153
623
974
3200
451
245
7513
690
945
6606
691
447
1078
5812
7671
Shor
t ter
m +
med
ium
/ lon
g-te
rm c
redi
tC
o-O
pera
tive
Bank
s23
524
2363
626
875
3123
139
403
4248
048
258
4619
263
497
7010
5
Regi
onal
Rur
al B
anks
4854
6070
7581
1240
415
223
2043
525
312
2676
535
217
4396
8
Com
mer
cial
Ban
ks33
587
3977
452
441
8148
112
5477
1664
8518
1088
2289
5128
5800
3327
06
Oth
er A
genc
ies
8080
8419
338
20
00
00
Sub
Tota
l (A
+B)
6204
569
560
8698
112
5309
1804
8522
9400
2546
5830
1908
3845
1444
6779
(Sou
rce:
ww
w.in
dias
tat.c
om)
Page 35
Indian Institute of Vegetable Research
20
Table 1.17: India’s position in world agriculture, 2008
Item India World India’s Next to% share Rankin world
Area (million ha)Total area 329 13442 2.4 7 Russian Federation, Canada, USA, China, Brazil,AustraliaLand area 297 13009 2.3 7 Russian Federation, China, USA, Canada, Brazil,AustraliaArable land 159 1411 11.3 2 USAPopulation (million)Total 1181 6750 17.5 2 ChinaAgriculture 583 2617 22.3 2 ChinaEconomically active population (million)Total 472 3178 14.9 2 ChinaAgriculture 262 1295 20.2 2 ChinaCrop production (million t)Total cereals 267 2521 10.6 3 China, USAWheat 79 683 11.5 2 ChinaRice (paddy) 148 686 21.6 2 ChinaTotal pulses 15 61 24.6 1Oilseed 7 38 18.8 2 ChinaRapeseed 6 58 10.3 3 Canada, ChinaFruits & vegetables (million t)Vegetables & melon 90 932 9.7 2 ChinaFruits 67 580 11.6 2 ChinaPotatoes 35 326 10.6 2 ChinaOnion (dry) 14 73 18.5 2 ChinaCommercial crops (million t)Sugarcane 348 1736 20.1 2 BrazilTea 0.81 3.90 20.7 3 China, TurkeyCoffee 0.26 8.25 3.2 7 Brazil, Vietnam, Colombia, Indonesia, Ethiopia,
MexicoJute & allied fibers 2.02 3.20 63.1 1Cotton (lint) 3.77 22.85 16.5 2 ChinaTobacco leaves 0.52 6.88 7.6 3 China, BrazilLivestock (million heads)Cattle 175 1372 12.7 2 BrazilBuffaloes 105 185 56.7 1Camels 0.63 24.73 2.5 10 Somalia, Sudan, Ethiopia, Niger, Mauritania,
Kenya, Mali, Pakistan, ChadSheep 65 1086 6.0 3 China, AustraliaGoats 126 864 14.5 2 ChinaChicken 584 18139 3.2 5 China, USA, Indonesia, BrazilImplements (000’ numbers)Tractors in use 3149 29320 10.7 2 USAAnimal productsMilk (000’t) 109000 694235 15.7 1Eggs (000’t) 3060 66103 4.6 3 China, USAMeat (000’t) 4353 277848 1.6 5 China, USA, Brazil, Germany
(Source: Agricultural Research Data Book, 2011, IASRI)
Page 36
Vegetable Statistics
21
Table 1.18: Indices for agricultural production in India (1980-81 to 2011-12)
Year All Crops Food Grains Pulses Oil Seeds Plantation Spices & Fruits &Crops Condiments Vegetables
(Base : Triennium Ending 1981-82=100)Weight 100 62.92 7.94 12.64 2.29 2.59 4.91980-81 102.1 104.9 104.1 95.1 98.4 98.3 102.41981-82 109.2 107.6 126.7 116.4 101.5 104 104.41982-83 104.8 103.7 115.8 101.8 100.3 106.9 101.91983-84 118.6 122.8 126.5 120.2 100.3 112.2 116.71984-85 117.9 117.5 117.7 126.7 120.7 119.1 123.11985-86 119.5 123.4 131 109.8 102.4 142.1 110.71986-87 115.2 116.9 115.2 110.8 121.8 123.6 121.91987-88 115.3 113.5 105.3 125.7 119.1 131.3 130.51988-89 140 138.1 136.4 170.7 138.6 138.7 136.71989-90 143 139.1 127.1 166.1 131.6 153.8 137.61990-91 148.4 143.7 140.5 179.5 144.9 143.9 145.11991-92 145.5 137.6 118.6 181.9 146.1 138.3 1561992-93 151.6 144.3 126.5 193.6 146.6 164.1 154.5(Base : Triennium Ending 1993-94 = 100)Weight 100 50.63 8.02 11.97 2.29 2.59 7.391993-94 123 135.1 117.6 134.1 - - -1994-95 130.1 141 128.1 133.8 - - -1995-96 126.8 131.4 109.4 137.3 - - -1996-97 137.8 145.1 127.9 151.7 - - -1997-98 130.8 140.9 119.5 130.3 - - 122.61998-99 137.8 150 137.6 151.3 - - 137.61999-00 140.7 152.9 121.8 125.7 - - 132.42000-01 134.1 141.9 99.6 113 - - 136.12001-02 142.1 155.3 121.5 126.9 - - 140.72002-03 123.9 126.6 100.9 90.7 - - 129.62003-04 133 155.1 134.2 154 - - 134.62004-05 130.9 144.2 119.8 150.2 - - 138.32005-06 146.8 152.5 122.6 171.6 - - 151.72006-07 167.8 158.8 130.3 147.1 - - 162.62007-08 172.9 168.6 135.4 180.2 - - 184.92008-09 161.8 171.3 133.7 167.9 - - 241.92009-10 159.6 159.4 134.5 150.7 - - 240.32010-11 185.3 178.9 167.4 196.7 - - 274.52011-12 192 188.1 157.9 181.8 - - 274.5
(Source: www.indiastat.com)
Page 37
Indian Institute of Vegetable Research
22
Table 1.19: Area under principal crops in India (1950-51 to 2009-10)(000’ha)
Year Cereals & Millet Pulses Total Food Spices & Fruits & VegetablesGrains Condiments
1950-51 149742 20554 101196 1244 22491951-52 151130 20308 100853 1314 21701952-53 84420 20792 105212 1177 20201953-54 88438 21999 110437 1190 21561954-55 86348 23007 109355 1327 21561955-56 87717 23608 111325 1438 23561956-57 88798 23864 112662 1528 23371957-58 87139 22629 109768 1386 24591958-59 90403 24442 114845 1301 25771959-60 91238 25119 116357 1429 25811960-61 91899 23665 115564 1569 26491961-62 92893 24388 117281 1471 26691962-63 93779 24378 118157 1471 28871963-64 93372 24324 117696 1594 29401964-65 94256 24163 118419 1696 30391965-66 92106 22781 114887 1516 32081966-67 93940 22058 115998 1680 33141967-68 98237 23017 121254 1770 34651968-69 97444 21865 119309 1550 36081969-70 99705 23009 122714 1655 36161970-71 101784 23126 124910 1864 36831971-72 100312 22534 122846 1909 35661972-73 99701 21642 121343 1665 36741973-74 103716 23667 127383 1784 37801974-75 99305 22491 121796 1752 39711975-76 103719 24819 128538 1790 42031976-77 101423 23654 125077 1873 41621977-78 103807 23918 127725 2213 44091978-79 105310 23956 129266 2200 46921979-80 103251 22347 125598 2077 46991980-81 104900 22708 127608 2065 49241981-82 105517 24180 129697 2070 50771982-83 102588 22974 125562 2224 49981983-84 107896 23527 131423 2261 53431984-85 104246 22802 127048 2187 57281985-86 104319 24437 128756 2232 57711986-87 104607 23385 127992 2213 58881987-88 99321 21555 120876 2419 61171988-89 104454 23119 127573 2499 63651988-89 104454 23119 127573 2499 63651989-90 103117 23409 126526 2456 65671990-91 103065 24883 127948 2325 66921991-92 99841 22679 122520 2371 68921992-93 101646 23569 125215 2719 70071993-94 101414 23411 124825 2857 72011994-95 101666 24283 125949 2677 75281995-96 99826 23637 123463 2665 75631996-97 101785 23317 125101 2832 75351997-98 101718 23998 125716 2991 7708
Contd...
Page 38
Vegetable Statistics
23
Year Cereals & Millet Pulses Total Food Spices & Fruits & VegetablesGrains Condiments
1998-99 102364 24515 126879 2895 81431999-00 102600 22118 124719 2898 82252000-01 101354 21325 122680 2802 82202001-02 101234 23196 124430 3229 87052002-03 93996 21442 115438 2912 91212003-04 100494 24458 124952 3203 93362004-05 98808 23889 122697 3074 96492005-06 99930 23671 123601 2903 99232006-07 100616 23490 124106 3020 97282007-08 100889 24821 125710 3265 100952008-09 100868 23767 124635 3140 10200
(Source: www.indiastat.com)
Table1.21: Pesticide use in IndiaIn tonnes
Items 2003 2004 2005 2006 2007 2008 2009 2010
Benzimidazoles 859 400 603 2167 774 638 1195 1992Chlorinated Hydrocarbons 2655 2907 2242 4209 3639 2841 3228 4485Dinitroanilines 213 115 289 82 98 81 49 71Dithiocarbamates 4065 3222 2575 4417 1898 1503 2640 4198Inorganics 5573 4629 2318 5907 5410 5061 5580 6298Organo-Phosphates 20039 18582 19541 12704 10979 437 11582 16134Other Fungicides 531 184 1070 876 216 289 211 567Other Herbicides 4445 2706 5223 3971 2596 2276 2956 4430Plant Growth Regulators 23 35 34 839 43 141 50 84Urea derivates 2842 2333 1447 2251 1428 1217 1215 1834Fungicides& Bactericides 11028 8435 6566 13367 8297 7491 9627 13055Herbicides 7500 5154 6959 6304 11972 3814 4557 6705Insecticides 22694 21489 21783 16913 14618 3278 14810 20619
(Source: Agricultural Research Data Book, 2011, IASRI)
Table 1.20: Fertilizer use in India from 1999-00 to 2010-11(00000’t)
Year Urea DAP MOP N P K Total Kg/ha
1999-00 202.78 69.37 20.49 115.92 47.98 16.78 180.69 94.92000-01 191.86 58.84 18.29 109.2 42.15 15.67 167.02 89.632001-02 199.17 61.81 19.93 113.1 43.82 16.67 173.6 91.132002-03 184.93 54.73 19.12 104.74 40.19 16.01 160.94 84.492003-04 197.67 56.24 18.41 110.77 41.24 15.98 167.99 88.192004-05 206.65 62.56 24.06 117.13 46.24 20.61 183.98 96.592005-06 222.97 67.64 27.31 127.23 52.04 24.13 203.4 105.52006-07 243.37 73.81 25.86 137.73 55.43 23.35 216.51 -2007-08 259.63 74.97 28.8 144.19 55.15 26.36 225.7 -2008-09 266.49 92.31 40.78 150.9 65.06 33.13 249.09 -2009-10 266.74 104.92 46.34 155.8 72.74 36.32 264.86 135.762010-11 281.12 108.7 39.32 165.58 80.5 35.14 281.22 144.142011-12 292.74 111.87 29.79 - - - 113.75 -
(Source: www.indiastat.com)
Page 39
Indian Institute of Vegetable Research
24
Tabl
e 1.
22: S
tatu
s of
far
m p
ower
sou
rces
in I
ndia
Year
Agr
icul
tura
l wor
kers
Dra
ft a
nim
als
Trac
tors
Pow
er ti
llers
Die
sel e
ngin
esEl
ectr
ic m
otor
sN
umbe
rPo
wer
Num
ber
Pow
erN
umbe
rPo
wer
Num
ber
Pow
erN
umbe
rPo
wer
Num
ber
Pow
er(m
illio
n)(m
kW)
(mill
ion)
(mkW
)(m
illio
n)(m
kW)
(mill
ion)
(mkW
)(m
illio
n)(m
kW)
(mill
ion)
(mkW
)
1999
-00
206.
1910
.660
.022
.82.
369
61.8
30.
1046
0.58
65.
933
.04
12.8
547
.55
2000
-01
213.
8310
.760
.322
.92.
531
66.0
60.
1147
0.64
26.
226
34.8
613
.25
49.0
3
2001
-02
234.
0910
.959
.322
.52.
643
68.9
80.
1232
0.69
06.
523
36.5
313
.601
50.3
2
2002
-03
235.
2611
.158
.422
.22.
736
71.4
10.
1333
0.74
77.
053
39.5
13.9
2151
.51
2003
-04
236.
4411
.257
.521
.82.
855
74.5
20.
1449
0.81
17.
028
39.3
614
.21
52.5
8
2004
-05
237.
6211
.456
.521
.52.
992
78.0
90.
1555
0.87
17.
595
42.5
314
.467
53.5
3
2005
-06
238.
8111
.47
55.8
21.2
3.15
382
.29
0.16
590.
929
7.62
742
.71
14.7
554
.57
2006
-07
240.
0011
.63
54.9
20.8
63.
3787
.96
0.17
851.
000
7.82
243
.815
.054
55.7
2007
-08
241.
0011
.754
.020
.52
3.55
392
.73
0.19
211.
076
7.90
044
.24
15.8
58.4
6
2008
-09
242.
2112
.10
53.3
220
.26
3.68
996
.28
0.22
211.
244
8.17
345
.77
16.2
0359
.95
2009
-10
243.
4212
.17
52.6
520
.01
3.91
510
2.18
0.25
711.
439
8.45
647
.35
16.6
161
61.4
8
Not
e: H
uman
= 0
.05
kW, D
roug
ht a
nim
al =
0.3
8 kW
, Tra
ctor
= 2
6.1
kW, P
ower
tille
r =
5.6
kW, E
lect
ric
mot
or =
3.7
kW
, Die
sel e
ngin
e =
5.6k
w(S
ourc
e: S
ingh
, S. P
., R.
S. S
ingh
and
Sur
ende
r Si
ngh.
201
1. S
ale
tren
d of
trac
tors
and
farm
pow
er a
vaila
bilit
y in
Indi
a.A
gril.
Engg
. Tod
ay, 3
5(2)
: 25-
35)
Page 40
Vegetable Statistics
25
Table 1.23: Contract farming companies in India
State Crop Company/Corporate
Karnataka Ashwagandha Himalaya Health Care Ltd.Dhavana Mysore S.N.C. Oil CompanyMarigold &Caprica chilies AVT Natural Products Ltd.Coleus Natural Remedies Private Ltd.Gherkins 20 Pvt. CompaniesMedicinal Plants Sami Labs Limited, Bangalore
Maharashtra Soybean Tinna Oils and ChemicalsSeveral fruits, vegetables, cereals, Ion Exchange Enviro Farms Ltd. (IEEFL)spices and pulsesPotato PepsiCo (India) Ltd., Mahindra SulabhSugarcane, Orange Cooperative Societies
Madhya Pradesh Wheat, Maize and Soybean Cargil India Ltd.Several fruits, vegetables, cereals, spices Ion Exchange Enviro Farms Ltd. (IEEFL)and pulsesSoyabean ITC-IBDSoyabean M/s Mahindra SulabhGarlic and White onion M/s Garlico Industries Limited.
Punjab Tomato and Chilly Nijjer Agro Foods Ltd.Barley United Breweries Ltd.Basmati, Maize Satnam overseas Sukhjit Starch (Mahindra
Shubhlabh Services Ltd.)Basmati Satnam Overseas, DD Intl. Incorp., Amira Foods
India Ltd. (Escorts Ltd. And Grain tech)Basmati, Groundnut, Potato and Tomato PepsiCo India Ltd.Green vegetables and exotic vegetables Punjab Agro Foods Park Limited, a joint venture
of Punjab Agro Export Corporation and IDMA,a corporate body.
Tamil Nadu Cotton Super Spinning MillsMaize Bhuvi Care Pvt. Ltd.Paddy Bhuvi Care Pvt. Ltd.Cotton Appache Cotton CompanyMaize, Gherkins M/s Mahindra Sulabh
Chhattisgarh SafedMusli M/s Larson & TurboTomato BEC Co.
Uttaranchal Guar Gum M/s Mahindra Sulabh
Haryana Turmeric, Mentha, Sunflower, White Musli HAFED
Andhra Pradesh White Viagra Nandan Farms (P) Ltd. Hyderabad, SprearheadNational Products, SARI of Switzerland.
Contd...
Page 41
Indian Institute of Vegetable Research
26
State Crop Company/Corporate
Fruits, Vegetables and flowers. Horticulture DepartmentGherkins Aduri Natural Products, ACE Agrotech,
Copricorn Natural Products and Mahendra andMahendra
Cocoa Cadbury India Ltd.Oil palm M/s Godrej, Palm Tech, SICAL, Simapuri
Industry and Radhika Vegetables Oil Industries.
Gujarat Processing of Medicinal Plants Reliance Group
Odisha Seeds (Paddy, Raggi, Green Gram, Arhar, Odisha Seeds Production CorporationGroundnut, Seamum, Niger and vegetablesseedsSugar M/s Shakti Sugar Ltd. of Tamil NaduEucalyptus Plantation M/s J.K.Paper MillsTomato and Mango M/s BilatiOdisha
Sikkim Spices M/s High Altitude Spices RabonglaOrange M/s Bulk Consumer, Government Fruit
Preservation factory, Singtom.
Kerala Pineapple M/S Agreenco, Paliikunnu,KanurSafedMusli, Steevia M/s Herbs India, Calicut
West Bengal Potato M/s FritoLay India LimitedPineapple M/s Dabur India Limited
(Source: www.indiastat.com)
Table 1.24: Agricultural produce markets in India (2009-10)
Sl. No Name of the Area in Total population Total regulated Area covered RequirementState/UT (Km2 ) (crore) markets (Km2) of markets
1 Andhra Pradesh 275045 7.57 901 305.27 35012 Arunachal Pradesh 83743 0.11 69 1213.67 10663 Assam 78438 2.66 226 347.07 9984 Bihar 94163 8.29 - - 11985 Jharkhand 79714 2.69 201 396.59 10156 Goa 3702 0.13 8 462.75 477 Gujarat 196024 5.06 414 473.49 24958 Haryana 44212 2.11 284 155.68 5639 Himachal Pradesh 55673 0.61 47 1184.53 70910 Jammu & Kashmir 222236 1.01 0 0 282911 Karnataka 191791 5.27 501 382.82 244112 Kerala 38863 3.18 0 0 495
Contd...
Page 42
Vegetable Statistics
27
Sl. No Name of the Area in Total population Total regulated Area covered RequirementState/UT (Km2 ) (crore) markets (Km2) of markets
13 Madhya Pradesh 308346 6.04 513 601.06 392414 Chhattisgarh 135100 2.08 184 734.24 171915 Maharashtra 307690 9.68 880 349.65 391616 Manipur 22327 0.24 0 0 28417 Meghalaya 22429 0.23 2 11214.5 28518 Mizoram 21081 0.09 0 0 26819 Nagaland 16579 0.20 0 0 21120 Odisha 155707 3.67 314 495.88 198221 Punjab 50362 2.43 488 103.2 64122 Rajasthan 342239 5.65 430 795.9 435623 Sikkim 7096 0.05 1 7096 9024 Tamil Nadu 130058 6.21 292 445.4 165525 Tripura 10486 0.32 21 499.33 13326 Uttar Pradesh 238566 16.61 605 394.32 303627 Uttrakhand 55845 0.85 58 962.84 71128 West Bengal 88752 8.02 687 129.19 113029 A&N Islands 8249 0.04 0 0 10530 Chandigarh 114 0.09 1 114 131 D & N Haveli 491 0.02 0 0 632 Daman and Diu 112 0.02 0 0 133 Delhi 1483 1.38 21 70.62 1934 Lakshadweep 32 0.01 0 0 035 Puducherry 492 0.10 9 54.67 6 Total 3287240 102.70 7157 28982.67 41836
(Source: www.agmarknet.nic.in)
Table 1.25: Whole sale price index (WPI) of Agricultural commodities and their weights
(Base Year 2004-05=100)
Particulars 2004-05 2005-06 2006-07 2007-08 2008-09 2009-10 2010-11
CEREALS 3.37323 105.99 116.74 127.86 143.09 161.18 169.67Rice 1.79348 105.23 110.03 122.46 140.62 157.93 167.19Wheat 1.11595 105.02 125.12 134.28 147.57 166.47 171.44Jowar 0.09572 109.53 124.62 147.99 151.19 168.60 189.54Bajra 0.11522 110.48 122.46 128.02 139.15 168.07 175.58Maize 0.21727 113.10 122.49 130.23 139.10 153.34 168.94Barley 0.01671 114.84 123.71 136.59 152.86 150.60 165.68Ragi 0.01885 101.36 112.17 123.36 134.93 174.67 173.79PULSES 0.71662 113.34 149.18 144.93 155.84 190.76 196.86
Contd...
Page 43
Indian Institute of Vegetable Research
28
Particulars 2004-05 2005-06 2006-07 2007-08 2008-09 2009-10 2010-11
Gram 0.33490 113.94 156.15 148.98 153.79 152.16 149.97Arhar 0.13740 98.05 108.31 126.08 144.28 214.70 205.06Moong 0.08429 121.66 160.30 141.18 150.42 233.80 280.44Masur 0.05764 102.51 114.97 145.68 196.16 228.16 194.45Urad 0.10239 131.08 191.33 159.77 159.78 228.43 271.75FRUITS & VEGETABLES 3.84270 108.00 111.78 124.63 134.86 147.76 172.05VEGETABLES 1.73553 113.71 114.28 137.07 141.89 161.80 182.83Potato 0.20150 118.51 132.59 146.85 110.29 206.24 131.95Sweet Potato 0.01750 114.66 146.48 145.81 148.81 184.70 194.14Onion 0.17794 126.62 115.90 174.68 177.75 204.30 259.60Tapioca 0.06781 95.55 112.78 134.71 159.60 240.78 282.82Ginger(Fresh) 0.04514 70.39 44.18 57.72 98.22 106.65 114.54Peas(Green) 0.10999 108.48 99.43 125.72 128.28 127.67 144.87Tomato 0.26738 119.05 125.56 123.82 153.24 153.56 190.39Cauliflower 0.23627 101.32 97.45 101.45 125.52 124.38 169.87Brinjal 0.29840 114.31 116.43 130.53 142.75 139.13 164.66Okra (Lady finger) 0.12604 102.68 115.24 123.33 133.84 145.53 174.80Cabbage 0.18756 127.32 119.51 157.11 168.51 150.65 214.58FRUITS 2.10717 103.27 109.68 114.38 129.08 136.17 163.17Banana 0.34264 110.57 115.28 120.56 132.45 146.62 163.01Mango 0.65134 95.03 101.93 110.40 151.65 141.97 191.52Apple 0.10397 100.88 124.79 124.62 134.74 171.23 173.59Orange 0.13309 113.30 123.23 113.49 138.25 148.63 185.32Cashew nut 0.16399 106.67 110.64 106.12 117.04 136.57 151.04Coconut(Fresh) 0.24113 85.03 82.19 83.05 95.88 85.58 97.77Papaya 0.10340 92.08 94.97 110.14 137.11 154.80 189.62Grapes 0.09399 98.72 109.85 126.48 127.17 124.78 188.85Pineapple 0.04577 94.25 97.89 116.28 128.82 154.43 177.92Guava 0.07609 119.92 121.32 120.38 125.20 110.43 177.67Litchi 0.03716 - - 79.70 77.10 102.70 179.20Lemon 0.07225 131.73 165.05 194.99 183.42 164.70 197.49Sapota 0.04235 101.28 100.43 124.07 116.20 149.04 174.02MILK 3.23818 101.01 108.98 114.58 123.24 146.41 175.88Milk 3.23818 101.01 108.98 114.58 123.24 146.41 175.88EGGS,MEAT & FISH 2.41384 106.29 112.77 116.37 125.38 151.48 190.13Egg 0.18675 102.12 104.83 119.89 126.47 143.58 165.44Fish-Inland 0.57256 118.14 108.52 101.38 101.37 152.63 193.43Fish-Marine 0.72259 103.20 120.97 125.65 146.23 160.53 222.84Mutton 0.34586 105.05 117.81 124.79 139.50 175.06 187.17Beef & Buffalo Meat 0.11585 111.66 116.55 119.69 121.20 142.99 188.20Poultry Chicken 0.41028 96.39 101.19 105.78 106.40 117.70 141.16Pork 0.05995 108.62 122.91 154.15 156.62 167.45 197.50
Contd...
Page 44
Vegetable Statistics
29
Particulars 2004-05 2005-06 2006-07 2007-08 2008-09 2009-10 2010-11
CONDIMENTS & SPICES 0.56908 94.54 136.71 142.93 151.24 182.68 243.98Black Pepper 0.02959 92.71 132.45 184.63 180.80 186.27 247.12Chillies(Dry) 0.15812 83.92 162.35 157.08 182.61 205.20 221.80Turmeric 0.07573 90.45 88.14 82.77 105.42 210.32 401.72Cardamom 0.01703 84.65 93.49 124.40 141.33 206.56 348.22Ginger(Dry) 0.05150 100.02 81.89 82.57 98.60 103.10 119.25Betelnut/Arecanut 0.10437 107.91 139.47 141.09 139.29 141.61 154.69Cummin 0.04393 100.13 107.36 125.76 124.42 150.33 163.35Garlic 0.06437 92.77 202.27 211.47 132.02 228.07 410.12Corriander 0.02444 110.63 140.64 185.46 321.91 212.26 174.06OTHER FOOD ARTICLES 0.18347 107.77 126.62 132.78 175.03 196.17 181.94Tea 0.11233 88.88 104.21 104.40 153.21 174.06 148.33Coffee 0.07114 137.63 162.04 177.61 209.48 231.07 235.01FLOWERS 0.21326 103.82 106.13 129.78 152.28 179.20 181.91Rose 0.14928 103.66 100.30 114.78 135.46 158.62 187.80Jasmine 0.03199 109.36 123.88 155.57 194.31 262.40 160.96Marigold 0.03199 98.94 115.67 173.97 188.51 191.80 175.47DAIRY PRODUCTS 0.56798 99.47 105.41 116.37 122.94 138.79 152.07Powder Milk 0.20061 99.46 108.97 125.73 130.00 137.03 150.22Ghee 0.21595 97.79 102.11 111.63 122.06 149.81 163.71Butter 0.06118 101.15 109.27 116.72 122.34 141.38 159.79Ice Cream 0.05063 103.48 98.46 98.11 100.79 104.50 115.59Condensed Milk 0.03961 100.89 108.21 117.35 121.22 127.67 132.57PROCESSING OF FOOD 0.35785 101.66 103.90 105.12 106.32 121.09 127.21Canned Fish 0.05534 108.32 114.51 118.05 122.49 136.20 136.59Fish Meal 0.05941 100.68 92.68 98.49 102.60 105.68 100.20Processed Prawn 0.11517 96.80 105.81 100.01 97.88 110.67 122.53Canned Meat 0.03554 112.19 121.52 135.97 148.78 162.96 175.87Vegetables Seeds 0.09239 100.30 95.60 96.20 93.27 118.80 126.02GRAIN MILL PRODUCTS 1.34017 104.80 120.09 125.02 130.05 137.97 145.79Maida 0.45224 104.61 121.98 125.79 130.08 138.44 146.73Wheat Flour ( Atta) 0.39334 105.73 126.33 130.58 136.58 147.00 158.94Gram Powder (Besan) 0.09734 113.55 128.92 124.90 126.33 127.18 134.23Sooji ( Rawa ) 0.08499 105.95 129.53 135.97 141.71 158.41 168.91Rice Bran 0.11785 96.21 102.42 119.29 128.20 125.67 122.29Wheat Bran 0.09066 103.19 103.40 108.27 105.19 117.38 130.37Beaten Rice Flakes (Chire) 0.03750 101.75 107.00 107.00 107.00 107.00 107.00Maize Atta 0.01572 112.50 118.80 125.00 135.14 140.60 140.60Other Grain Mill Products 0.05053 103.52 103.33 113.02 131.02 137.63 131.33BAKERY PRODUCTS 0.44354 101.27 103.96 105.30 109.94 116.25 126.25Biscuit / Cookies 0.35095 100.22 100.47 100.31 104.42 110.46 121.02Bread & Buns 0.06304 105.47 121.06 128.69 133.19 139.26 147.45Cakes & Muffins 0.02955 105.06 108.88 114.98 126.14 136.14 143.71
Contd...
Page 45
Indian Institute of Vegetable Research
30
Particulars 2004-05 2005-06 2006-07 2007-08 2008-09 2009-10 2010-11
SUGAR, KHANDSARI & GUR 2.08859 108.76 107.42 90.90 106.82 161.93 160.50Sugar 1.73731 109.67 109.57 93.40 108.54 166.79 165.02Gur 0.07763 115.59 109.21 95.71 127.23 195.37 197.20Khandsari 0.06133 111.63 108.15 90.20 106.75 155.87 159.87Molasses 0.12926 96.42 90.18 59.36 82.28 118.49 105.10Bagasse 0.03946 100.48 72.36 63.51 73.07 83.98 118.17Sugar Confectionary 0.04360 99.20 101.10 102.77 103.63 116.64 119.48EDIBLE OILS 3.04293 94.08 102.45 116.02 121.55 114.38 120.58Vanaspati 0.71494 93.25 102.50 105.73 109.98 107.25 116.32Groundnut Oil 0.30438 97.03 109.45 133.59 131.23 127.82 145.25Palm Oil 0.41999 93.23 99.38 109.31 113.21 111.33 111.30Rice Bran Oil 0.18489 99.29 108.63 133.64 135.32 120.87 120.12Cotton Seed Oil 0.26101 93.40 106.25 132.86 142.72 118.12 124.31Mustard & Rapeseed Oil 0.45094 94.49 96.90 109.29 122.36 115.27 116.30Soyabean Oil 0.37971 90.64 103.06 118.65 126.17 117.59 125.57Copra Oil 0.10231 99.88 94.14 93.68 99.87 94.60 100.08Sunflower Oil 0.17348 94.42 104.67 125.13 124.09 113.16 120.43Gingelly Oil 0.05128 89.05 97.15 113.36 129.47 127.93 134.22OIL CAKES 0.49441 97.68 103.41 122.24 145.11 167.32 168.63Cotton Seed Oil Cake 0.12928 98.44 102.78 114.26 120.67 142.06 142.74Rice Bran Extraction 0.09174 111.40 129.12 151.15 167.42 197.25 223.69Mustard Oil Cake 0.04018 100.79 99.83 117.69 153.47 184.45 180.16Groundnut Oil Cake 0.04463 98.83 105.81 128.21 181.30 226.76 240.19Other Oil Cakes 0.18858 89.48 91.53 113.20 140.64 152.32 140.17TEA & COFFEE PROCCESSING 0.71106 99.37 103.76 108.73 125.05 144.76 149.80Tea Leaf (Blended) 0.27219 101.03 104.35 111.31 130.31 147.22 153.89Tea Leaf (Unblended) 0.18048 97.24 101.36 103.87 119.23 145.33 145.55Tea Dust (Blended) 0.13716 99.54 106.07 106.67 113.74 125.16 134.03Tea Dust (Unblended) 0.09813 96.05 100.89 104.37 126.29 153.90 157.62Coffee Powder 0.02310 109.35 114.12 147.29 170.41 188.96 195.80OTHER FOOD PRODUCTS 0.87933 106.52 104.18 107.82 117.37 134.78 141.15Cashew Kernel 0.38299 112.55 98.23 94.56 103.33 130.38 135.81Gola (Cattle Feed) 0.11247 101.62 112.19 125.19 143.40 165.50 178.61Papad 0.08081 105.07 116.58 122.43 125.97 136.03 144.16Cashew nut (Roasted) 0.01367 105.43 104.10 105.46 111.50 127.88 130.84Mixed Spices 0.06599 103.10 108.28 122.59 130.04 134.89 142.67Pickles 0.02476 101.25 103.88 106.32 108.22 112.85 117.15Soya Preparations (Excluding Oil) 0.05937 98.50 99.85 112.79 136.15 142.78 140.94Instant Food Powder 0.13927 100.78 106.87 113.11 118.25 122.56 128.44AGRICULTURAL MACHINERY 0.13899 106.42 110.88 115.21 120.36 123.16 133.73Harvester 0.00929 108.37 115.16 124.43 131.77 139.19 139.52Sprinkler 0.00916 110.74 134.31 131.60 116.22 121.65 116.82Thresher 0.01024 102.50 107.20 118.14 139.53 142.48 145.38Separators & Driers 0.01689 117.43 124.62 137.23 145.14 137.28 138.37Other Agriculture Implements 0.09341 104.25 106.09 108.38 113.06 117.05 132.68
(Source: www.indiastat.com)
Page 46
Vegetable Statistics
31
Table 1.26: Export of agricultural products from India from 2008-09 to 2010-11(Quantity in 000’ tonnes, Value in ‘Crore)
Commodity 2008-09 2009-10 2010-11Quantity Value Quantity Value Quantity Value
Pulses 136.27 540.22 99.91 407.35 205.69 852.79Rice basmati 1556.41 9477.03 2016.87 10889.46 2186.45 10581.51Rice (Other than basmati) 931.89 1687.37 139.54 365.3 96.08 220.25Wheat 1.12 1.46 0.03 0.05 0.44 0.74Other cereals 3999.65 3920.58 2892.41 2973.19 3187.86 3596.1Tea 207.45 2688.87 207.53 2943.53 233.4 3174.5Coffee 174.08 2255.76 157.41 2032.06 222.86 2912.07Tobacco unmanufactured 208.31 2766.26 230.8 3621.44 207.55 3007.6Tobacco manufactured - 294.78 - 722.96 - 791.07Poultry & dairy products - 1130.08 - 549.37 - 780.33Floriculture products - 368.81 - 294.46 - 286.52Spices 673.87 6338.41 663.21 6157.23 749.03 7870.14Cashew nut shell liquid 10.82 29.69 11.23 27.62 11.36 31.85Cashew 126.15 2900.97 117.99 2801.58 91.56 2598.15Sesamum seed 196.98 1494.26 215.73 1494.1 343.03 2194.44Nigerseed 13.72 64.23 6 24.23 11.82 41.14Groundnut 297.89 1239.01 340.24 1425.93 418.56 2099.77Guar gum meal 258.57 1338.99 218.47 1133.31 403 2805.75Oil meals 6742.93 10269.24 4671.13 7831.79 6797.86 10845.91Castor oil 357.26 2128.72 398 2179.27 411.21 2851.67Shellac 6.03 103.89 4.18 71.3 3.88 112.95Sugar 3332.08 4448.74 44.74 110.21 3241.34 10339.01Molasses 172.2 82.7 31.1 19.77 1822.88 996.46Fruits/vegetable seeds 8.54 119.99 8.89 145.08 11.14 170.63Fresh fruits - 1945.24 - 2269.08 - 2144.3Fresh vegetables - 2454.15 - 2941.73 - 2530.82Processed vegetables - 711.22 - 752.3 - 732.97Processed fruit juices - 1099.15 - 1159.32 - 1006.41Miscellaneous processed items - 2077.44 - 2195.29 - 2569.38Meat & preparations - 5371.42 - 6286.1 - 8775.91Marine products 465 7066.37 709.88 9899.98 800.95 11547.97Cotton raw including waste 457.56 2865.85 1357.99 9537.08 1258.09 12981.04Jute hessian - 415.59 - 307.63 - 699.93Poultry products - 413.53 - 366.1 - 272.11Paper/wood products - 5441.63 - 5506.04 - 7763.3Total agricultural exports - 85951.67 - 89341.33 - 20185.48Total national exports - 840755.1 - 845533.6 - 1148170% share of agricultural exports in national exports - 10.22 - 10.57 - 10.47
(Source: www.indiastat.com)
Page 47
Indian Institute of Vegetable Research
32
Table 1.27: India’s imports and exports of agricultural commodities vis-à-vis total national imports/exports
(` Crores)
Year Agricultural Total national %age agri. Agriculture Total national %age agri.imports imports imports to exports exports exports to
total national total nationalimports exports
1990-91 1205.86 43170.82 2.79 6012.76 32527.28 18.491991-92 1478.27 47850.84 3.09 7838.04 44041.81 17.801992-93 2876.25 63374.52 4.54 9040.30 53688.26 16.841993-94 2327.33 73101.01 3.18 12586.55 69748.85 18.051994-95 5937.21 89970.70 6.60 13222.76 82673.40 15.991995-96 5890.10 122678.14 4.80 20397.74 106353.35 19.181996-97 6612.60 138919.88 4.76 24161.29 118817.32 20.331997-98 8784.19 154176.29 5.70 24832.45 130100.64 19.091998-99 14566.48 178331.69 8.17 25510.64 139751.77 18.251999-00 16066.73 215528.53 7.45 25313.66 159095.20 15.912000-01 12086.23 228306.64 5.29 28657.37 201356.45 14.232001-02 16256.61 245199.72 6.63 29728.61 209017.97 14.222002-03 17608.83 297205.87 5.92 34653.94 255137.28 13.582003-04 21972.68 359107.66 6.12 37266.52 293366.75 12.702004-05 22811.84 501064.54 4.55 41602.65 375339.53 11.082005-06 21499.22 660408.90 3.26 49216.96 456417.86 10.782006-07 29637.86 840506.31 3.53 62411.42 571779.28 10.922007-08 29906.24 1012311.70 2.95 79039.72 655863.52 12.052008-09 37183.03 1374435.55 2.71 85951.67 840755.06 10.222009-10 59528.34 1363735.55 4.37 89341.33 845533.64 10.572010-11 56196.20 1605314.63 3.50 120185.48 1148169.56 10.47ACGR (%) 19.05 19.93 - 13.96 17.98 -
(Source: DGCIS, Ministry of Commerce, Kolkata)
Page 48
Vegetable Statistics
33
Section-II
Horticultural ScenarioTable 2.1: Indian horticultural production at a glance
(Area: 000ha, Production: 000t)
Year Fruits Vegetables Flowers Plantation Crops Spices TotalArea Prod- Area Prod- Area Prod- Area Prod- Area Prod- Area Prod-
uction uction uction uction uction uction
1993-94 3184 37255 4876 65787 53 233 2448 8866 2472 2515 13033 1146611994-95 3246 38603 5013 67286 60 261 2546 9767 2215 2477 13080 1183941995-96 3357 41507 5335 71594 82 334 2733 9630 2216 2410 13723 1254831996-97 3580 40458 5515 75074 71 366 2824 9730 2372 2805 14362 1284821997-98 3702 43263 5607 72683 74 366 2847 9449 2524 2801 14754 1286111998-99 3727 44042 5866 87536 74 419 2905 11063 2531 3091 15103 1462001999-00 3797 45496 5993 90831 89 509 2788 9278 2500 3023 15247 1492242000-01 3869 43138 6250 93850 98 556 2862 9458 2500 3023 15694 1501972001-02 4010 43001 6156 88622 106 535 2984 9697 3220 3765 16592 1457852002-03 3788 45203 6092 84815 70 735 2984 9697 3220 3765 16270 1443802003-04 4675 45645 6309 93165 101 580 3102 13161 5155 5113 19449 1578352004-05 5049 50867 6744 101246 118 659 3147 9835 3150 4001 18445 1669382005-06 5324 55356 7213 111399 129 654 3283 11263 2366 3705 18707 1828162006-07 5554 59563 7581 114993 144 880 3207 12007 2448 3953 19389 1918132007-08 5857 65587 7848 128449 166 868 3190 11300 2617 4357 20207 2112342008-09 6101 68466 7981 129077 167 987 3217 11336 2629 4145 20662 2147162009-10 6329 71516 7985 133738 183 1021 3265 11928 2464 4016 20876 2230892010-11 6383 74878 8495 146554 191 1031 3306 12007 2940 5350 21825 240531ACGR (%) 4.55 4.02 3.18 4.62 7.28 8.84 1.57 1.61 1.08 4.14 3.19 4.26
(Source: Agricultural Research Data Book, 2011, IASRI)
Table 2.2: State-wise status of cold storage capacity in India (As on 04.05.2012)(000’tonnes)
States Cold storage requirement Present capacity Gap
Andhra Pradesh 2324 901 1423Assam 919 88 831Bihar 4241 1147 3094Chhattisgarh 543 342 201Gujarat 2748 1267 1481Haryana 804 393 411
Contd...
Page 49
Indian Institute of Vegetable Research
34
States Cold storage requirement Present capacity Gap
Himachal Pradesh 487 20 467Jammu and Kashmir 737 43 694Jharkhand 796 170 626Karnataka 2404 407 1997Kerala 2771 58 2713Maharashtra 6273 547 5726Manipur 80 0 80Meghalaya 239 3 236Mizoram 74 0 74Madhya Pradesh 1213 808 405Nagaland 70 6 64Odisha 1835 291 1544Punjab 1318 1345 -27Rajasthan 391 324 67Tamil Nadu 7906 239 7667Tripura 163 30 133Uttar Pradesh and Uttarakhand 12228 10187 2041West Bengal 10566 5682 4884All India 61130 24298 36832
(Source: www.indiastat.com)
Table 2.3: State-wise grading facilities in India
States No. of grading facilities No. of grading facilities per ‘000Km2 Million t
Andhra Pradesh 44 0.17 1.12Arunachal Pradesh - 0.00 0.00Assam - 0.00 0.00Bihar 12 0.13 0.39Chhattisgarh 2 0.01 0.20Goa - 0.00 0.00Gujarat 43 0.22 1.75Haryana 82 1.85 3.93Himachal Pradesh 10 0.18 3.28Jammu & Kashmir 46 0.21 9.82Jharkhand 1 0.01 0.12Karnataka 44 0.23 1.62Kerala 52 1.34 7.80Madhya Pradesh 46 0.15 1.62Maharashtra 68 0.22 2.17Manipur - 0.00 0.00Meghalaya - 0.00 0.00
Contd...
Page 50
Vegetable Statistics
35
States No. of grading facilities No. of grading facilities per ‘000Km2 Million t
Mizoram - 0.00 0.00Nagaland - 0.00 0.00Odisha 6 0.04 0.33Punjab 62 1.23 1.92Rajasthan 209 0.61 8.67Sikkim - 0.00 0.00Tamil Nadu 47 0.36 1.86Tripura - 0.00 0.00Uttar Pradesh 153 0.64 2.09Uttrakhand 5 0.09 1.39West Bengal 24 0.27 0.58All India 956 0.29 2.03
(Source: Compiled from the data of DMI, MoA, GOI, Faridabad)
Table 2.4: State-wise marketing facilities in India
States Food parks Agri-export zones Commodity exchanges Pack houses
Andhra Pradesh 1 5 0 6Arunachal Pradesh 0 0 0 0Assam 1 1 0 0Bihar 1 3 0 2Chhattisgarh 1 0Goa 0 0 0 0Gujarat 0 3 4 6Haryana 2 0 0 0Himachal Pradesh 0 1 0 1Jammu & Kashmir 3 2 0 1Jharkhand 1Karnataka 4 4 1 4Kerala 4 2 2 0Madhya Pradesh 6 5 2 0Maharashtra 7 8 4 89Manipur 2 0 0 0Meghalaya 0 0 0 0Mizoram 1 0 0 0Nagaland 1 0 0 0Odisha 1 1 0 0Punjab 1 3 1 1Rajasthan 4 2 1 0Sikkim 0 2 0 0Tamil Nadu 2 4 0 1
Contd...
Page 51
Indian Institute of Vegetable Research
36
States Food parks Agri-export zones Commodity exchanges Pack houses
Tripura 1 1 0 0Uttar Pradesh 5 4 4 0Uttarakhand 4West Bengal 8 6 1 0All India 56 62 20 111
(Source: Compiled from the data of DMI, MoA, GOI, Faridabad)
Table 2.5: State-wise fruits & vegetable processing units and their installed capacities in India (As on01.04.2007)
Sates/UTs No. of units Installed capacity (tonnes)
Maharashtra 865 283430Goa 38 8180Madhya Pradesh 95 40590Chhattisgarh 4 420Gujarat 234 120870Dadra & Nagar Haveli 6 480Assam 44 8260Arunachal Pradesh 2 60Manipur 14 2510Meghalaya 10 390Mizoram 3 885Nagaland 7 1920Sikkim 3 770Tripura 6 2770Delhi 181 43510Chandigarh 15 4620Rajasthan 111 20100Haryana 176 101540Jammu & Kashmir 102 20330Punjab 240 121410Himachal Pradesh 130 91625Uttar Pradesh 497 138780Uttrakhand 108 29510Andaman & Nicobar Islands 3 200Bihar 39 12440Jharkhand 23 4160Odisha 17 11310West Bengal 267 109341Andhra Pradesh 237 887658Karnataka 247 208904Kerala 368 41340Puducherry 9 1680Tamil Nadu 432 360826India 4533 2680819
(Source: www.indiastat.com)
Page 52
Vegetable Statistics
37
Table 2.6: Monthly wholesale price index (WPI) of fruits and vegetables in India
{(Base year: 1981-82; 1993-94; 2004-05=100) (April 1990 to December 1992 and September 1993 to July 2012)}
Year Jan. Feb. Mar. Apr. May Jun. Jul. Aug. Sept. Oct. Nov. Dec.
1981-82=100
1990 178.0 192.0 205.7 214.8 211.9 212.9 210.2 207.7 202.8
1991 201.8 205.5 205.4 219.8 233.4 252.1 270.4 278.2 274.5 267.6 277.4 252.5
1992 234.6 234.2 239.8 256.7 257.8 280.9 282.9 288.7 277.1 281.0 281.0 269.1
1993 304.6 306.3 293.3 278.3
1993-94=100
1994 257.8 243.1 243.4 94.7 94.2 110.6 116.9 125.0 115.8 117.2 114.9 102.2
1995 102.3 100.3 102.3 117.0 115.5 126.0 127.5 132.9 133.8 139.2 139.3 119.0
1996 105.7 110.1 116.5 139.1 143.1 149.5 150.1 154.5 149.7 153.0 156.8 159.4
1997 147.4 148.7 135.2 143.2 119.3 122.6 135.3 147.5 152.0 167.1 152.0 145.2
1998 155.4 136.4 138.1 166.3 181.1 198.3 210.8 188.8 196.1 228.5 230.2 197.4
1999 150.7 135.5 140.7 171.6 148.8 147.8 147.1 162.2 157.4 167.6 167.6 149.3
2000 141.6 143.3 149.3 159.5 149.8 157.3 152.0 151.3 159.6 176.7 173.2 164.1
2001 157.1 159.5 160.4 172.9 179.9 185.3 180.3 187.4 197.9 204.4 210.2 204.5
2002 184.2 178.1 181.8 190.1 184.0 198.5 189.0 199.0 204.1 208.6 203.6 176.7
2003 171.4 176.5 180.7 196.4 194.7 212.3 189.3 185.1 203.1 219.8 213.2 191.2
2004 188.1 182.7 171.4 200.5 209.2 208.3 192.2 210.1 215.9 227.2 222.7 192.9
2005 187.5 189.4 194.5 219.0 222.0 220.1 219.6 217.9 231.5 238.2 243.7 219.7
2006 208.4 194.2 192.8 209.0 217.8 229.4 213.4 216.6 249.4 251.7 246.0 232.6
2007 228.7 221.0 222.3 238.3 244.7 232.9 245.8 243.6 258.3 242.3 234.1 222.1
2008 218.5 220.3 236.1 245.4 252.7 241.4 252.0 255.1 276.0 277.0 278.4 249.4
2009 256.2 241.3 240.9 271.1 272.2 274.0 294.7 285.7 305.8 294.9 318.5 300.8
2010 283.5 276.9 268.2 287.1 292.2 294.3 289.6 284.7
2004-05=100
2005 101.7 99.9 103.1 113.8 113.0 116.2 122.2 123.3 105.3
2006 102.3 98.9 96.3 98.5 99.5 106.4 107.8 115.2 120.5 123.4 119.7 112.1
2007 111.9 110.9 115.4 121.5 123.3 123.6 132.3 137.6 136.5 133.2 127.4 115.8
2008 109.0 113.8 121.6 128.1 129.3 128.5 135.7 135.6 140.2 151.8 153.7 135.9
2009 136.8 122.7 120.0 134.1 136.1 141.6 151.3 156.6 150.9 155.8 161.5 155.9
2010 147.6 142.2 139.5 153.3 157.6 168.3 171.3 161.8 169.3 175.1 174.2 196.1
2011 206.6 165.1 165.9 193.9 181.6 185.9 191.2 191.4 194.8 198.7 189.8 166.2
2012 160.8 166.0 182.5 215.3 208.5 213.1 211.3
(Source: www.indiastat.com)
Page 53
Indian Institute of Vegetable Research
38
Tabl
e 2.
7: A
gri E
xpor
t Zon
es (A
EZ) f
or h
ortic
ultu
ral p
rodu
cts
Stat
eFo
cus
prod
ucts
Are
as
And
hra
Prad
esh
Man
go P
ulp
& F
resh
Veg
etab
les
Chi
ttor
Man
go &
Gra
peRa
nga
Redd
y, M
edak
and
Mah
aboo
bnag
arM
ango
Kri
shna
Dis
tric
tG
herk
ins
Mah
boob
naga
r, Ra
ngar
eddy
, Med
ak, K
arin
agar
, War
anga
l, A
nant
hpur
and
Nal
gond
aC
hilli
Gun
tur
Ass
amFr
esh
and
Proc
esse
d G
inge
rK
amru
p, N
alba
ri, B
arpe
ta, D
arra
ng, N
agao
n, M
orig
aon,
Kar
bi A
nglo
ng a
nd N
orth
Cac
har
Biha
rLi
tchi
, Veg
etab
les
and
Hon
eyM
uzaf
farp
ur, S
amas
tipur
, Haj
ipur
, Vai
shal
i, Ea
st a
nd W
estC
ham
para
n, B
haga
lpur
, Beg
ulsa
rai,
Kha
gari
a, S
itam
arhi
, Sar
an a
nd G
opal
ganj
Guj
arat
Man
go &
Veg
etab
les
Ahm
edab
ad, K
haid
a, A
nand
, Vad
odra
, Sur
at, N
avsa
ri, V
alsa
d, B
haru
ch a
nd N
arm
ada
Deh
ydra
ted
Oni
on a
nd G
arlic
Bhav
naga
r, Su
rend
rana
gar,
Am
reli,
Raj
kot,
Juna
gadh
and
Jam
naga
rSe
sam
e Se
eds
Am
eral
i, Bh
avna
gar,
Sure
ndra
naga
r, Ra
jkot
and
Jam
naga
rH
imac
hal P
rade
shA
pple
Kin
naur
, Shi
mla
, Sir
mor
, Kul
u, M
andi
and
Cha
mba
Jam
mu
& K
ashm
irA
pple
Srin
agar
, Bar
amul
a, A
nant
nag,
Kup
war
a, B
adgu
am a
nd P
ulw
ana
Wal
nut
Bara
mul
la, A
nant
nag,
Pul
wam
a, B
udga
m, K
upw
ara
and
Srin
agar
, Dod
a, P
oonc
h, U
dham
pur,
Rajo
uri a
nd K
athu
aJh
arkh
and
Vege
tabl
eRa
nchi
, Haz
arib
agh
and
Loha
rdag
aK
arna
taka
Ghe
rkin
Tum
kur,
Bang
alor
e (U
rban
), Ba
ngal
ore
(Rur
al)
Has
san,
Kol
ar,
Chi
trad
urga
, D
hraw
ad a
ndBa
galk
otRo
se O
nion
Bang
alor
e (U
rban
) , B
anga
lore
(Rur
al) ,
Kol
arFl
ower
sBa
ngal
ore
(Urb
an),B
anga
lore
(Rur
al) ,
Kol
ar, T
umku
r, K
odag
u an
d Be
lgau
mVa
nilla
Dak
shin
Kan
nada
, Utta
ra K
anna
da, U
dupi
, Shi
mog
a, K
odag
u, a
nd C
hick
amag
alur
Ker
ala
Hor
ticul
tura
l Pro
duct
sTh
riss
ur,
Erna
kula
m,
Kot
taya
m, A
lapp
uzha
, Pa
than
umth
itta,
Kol
lam
, Th
iruv
anan
thpu
ram
,Id
ukki
and
Pal
lako
dM
edic
inal
Pla
nts
Way
anad
, Mal
lapu
ram
, Pal
akka
d, T
hris
sur,
Erna
kula
m, I
dukk
i, K
olla
m, P
atha
nam
ittha
and
Thir
uvan
anth
apur
amM
adhy
a Pr
ades
hPo
tato
es, O
nion
and
Gar
licM
alw
a, U
jjain
, Ind
ore,
Dew
as, D
har,
Shaj
apur
, Rat
lam
, Nim
ach
and
Man
dsau
rSe
ed s
pice
sG
una,
Man
dsau
r, U
jjain
, Raj
garh
, Rat
lam
, Sha
japu
r an
dNee
muc
hW
heat
Ujja
inN
eem
uch,
Rat
lam
, Man
dsau
r, In
dore
, Dha
r, Sh
ajap
ur, D
ewas
, Bho
pal,
Sheh
ore,
Vid
isha
,ra
isen
, Hos
hang
abad
, Har
da a
nd N
arsi
nghp
urO
rang
eC
hhin
dwar
a, H
osha
ngab
ad a
nd B
etu
Lent
ils &
Gra
ms
Shiv
puri
, Gun
a, V
idis
ha, R
aise
n, N
arsi
nghp
ura
and
Chh
indw
ara
Con
td...
Page 54
Vegetable Statistics
39
Stat
eFo
cus
prod
ucts
Are
as
Mah
aras
htra
Gra
pes
and
Gra
pew
ine
Nas
ik, S
angl
i, Pu
ne, S
atar
a, A
hmed
naga
r an
d Sh
olap
urA
lpho
nso
Man
goRa
tnag
iri,
Sind
hudu
rg, R
aiga
rh a
nd T
hane
Kes
ar M
ango
Aur
anga
bad,
Jaln
a, B
eed,
Lat
ur, A
hmed
naga
r an
d N
asik
Flow
ers
Pune
, Nas
ik, K
olha
pur
and
Sang
liO
nion
sN
asik
, Ahm
edna
gar,
Pune
, Sat
ara
and
Sola
pur
Pom
egra
nate
Sola
pur,
Sang
li, A
heda
baga
r, Pu
ne, N
asik
, Osm
anab
ad, L
atur
Bana
naJa
lgao
n, D
hule
, Nan
durb
ar, B
uldh
ana,
Par
bhan
i, H
indo
li, N
ande
d an
d W
ardh
aO
rang
esN
agpu
r an
d A
mra
oti
Odi
sha
Gin
ger
and
Turm
eric
Kan
dham
alPu
njab
Vege
tabl
esFa
tehg
arh
Sahi
b, P
atia
la, S
angr
ur, R
opar
and
Lud
hian
aPo
tato
esSi
nghp
ura,
Zir
akpu
r (P
atia
la) ,
Ram
pura
Phu
l, M
ukts
ar, L
udhi
ana,
Jalla
ndha
rBa
smat
i Ric
eA
mri
tsar
, Gur
dasp
ur, K
apur
thal
a, Ja
land
har,
Hos
hiar
pur
and
Naw
ansh
ahr
Raja
stha
nC
oria
nder
Kot
a, B
undi
, Bar
an, J
hala
war
and
Chi
ttoor
Cum
inN
agau
r, Ba
rmer
, Jal
ore,
Pal
i and
Jodh
pur
Sikk
imFl
ower
s (O
rchi
ds) &
Che
rry
Pepp
erEa
st S
ikki
mG
inge
rN
orth
, Eas
t, So
uth
& W
est S
ikki
mTa
mil
Nad
uC
ashe
wnu
tsC
udda
lore
, Tha
njav
ur, P
uduk
otta
i and
Siv
agan
gaFl
ower
sD
hara
mpu
riFl
ower
sN
ilgir
iM
ango
esM
adhu
rai,
Then
i, D
indi
gul,
Vir
udhu
naga
r an
d Ti
rune
lvel
iTr
ipur
aO
rgan
ic P
inea
pple
Kum
argh
at, M
anu,
Mel
agha
r, M
atab
ari a
nd K
akra
ban
Bloc
ksU
ttarP
rade
shPo
tato
esA
gra,
Hat
hras
, Far
rukh
abad
, Kan
noj,
Mer
rut,
alig
arh
and
Bagp
atM
ango
es a
nd V
eget
able
sLu
ckno
w, U
nnao
, Har
doi,
Sita
pur
and
Bara
bank
iM
ango
esSa
hara
npur
, Muz
zafa
rnag
ar, B
ijnau
r, M
erru
t, Bh
agpa
t and
Bul
ands
haha
rBa
smat
i Ric
eBa
reill
y, S
haha
jaha
npur
, Pi
libhi
t, R
ampu
r, Ba
daun
, bi
jnor
, M
orad
abad
, J
B Ph
ulen
agar
,Sa
hara
npur
, ujja
farn
agar
, Mer
rut,
Bula
ndsa
har,
Gha
ziab
adU
ttara
khan
dLi
tchi
Udh
amsi
ngh
Nag
ar, N
aini
tal a
nd D
ehra
dun
Flow
ers
Deh
radu
n an
d Pa
ntna
gar
Basm
ati r
ice
Udh
am S
ingh
Nag
ar, N
aini
tal,
Deh
radu
n an
d H
arid
war
Med
icin
al &
Aro
mat
icPl
ants
Utta
rkas
hi, C
ham
oli.P
ithor
agar
h, D
ehra
dun
and
Nai
nita
lW
est B
enga
lLi
tchi
Mur
shid
abad
, Mal
da, 2
4 Pa
rgan
a s(
N) a
nd 2
4 Pa
rgan
as (S
)Po
tato
esH
oogl
y, B
urdw
an, M
idna
pore
(W),
Uda
y N
aray
anpu
r an
d H
owra
hM
ango
esM
alda
and
Mur
shid
abad
Vege
tabl
eN
adia
, Mur
shid
abad
and
Nor
th 2
4 Pa
rgan
asD
arje
elin
g Te
aD
arje
elin
g
(Sou
rce:
ww
w.a
peda
.gov
.in)
Page 55
Indian Institute of Vegetable Research
40
Tabl
e 2.
8: E
xpor
t of
hort
icul
tura
l pro
duct
s fr
om I
ndia
(200
6-07
to 2
010-
11)
(Qua
ntity
in to
nnes
; Val
ue in
` C
rore
)
Item
s20
06-0
720
07-0
820
08-0
920
09-1
020
10-1
1Q
uant
ityVa
lue
Qua
ntity
Valu
eQ
uant
ityVa
lue
Qua
ntity
Valu
eQ
uant
ityVa
lue
Flor
icul
ture
and
See
dsFl
oric
ultu
re42
016.
664
9.83
3624
0.7
3401
4.42
3079
8.3
3688
1.41
2681
4.5
2944
6.36
2777
6.1
2864
5.41
Frui
ts a
nd v
eget
able
s se
eds
8031
.112
1.47
1015
7.1
1421
2.29
8535
.511
999.
0988
83.8
1450
7.51
1118
2.5
1751
9.52
Tota
l50
047.
777
1.30
4639
7.8
4822
6.71
3933
3.8
4880
.50
3569
8.3
4395
.87
3895
8.6
4616
4.93
Frui
ts a
nd v
eget
able
sFr
esh
onio
ns13
7837
3.0
1163
.31
1008
606.
010
3577
.90
1670
186.
018
2752
.20
1664
922.
023
1943
.00
1163
473.
017
4155
.40
Oth
er fr
esh
vege
tabl
es27
5907
.243
0.01
3502
35.5
4894
9.01
5052
85.5
6802
0.32
4192
41.4
7318
5.90
4909
14.1
8929
3.61
Dri
ed n
uts
(Wal
nuts
)50
62.1
118.
030.
0716
2.08
0.06
141.
2490
73.3
1978
9.51
5244
.515
650.
59Fr
esh
man
goes
7906
0.9
141.
9454
350.
812
741.
7683
703.
217
071.
2574
460.
620
053.
9859
220.
716
292.
13Fr
esh
grap
es85
897.
830
1.92
9696
3.5
3178
2.51
1246
28.0
4086
1.28
1311
53.6
5453
3.89
9931
1.8
4120
6.32
Oth
er fr
esh
frui
ts15
9569
.425
6.44
2077
00.8
3045
2.60
2567
68.5
4308
6.84
2606
75.4
5228
3.32
2538
51.0
4896
4.74
Tota
l19
8387
1.0
2411
.65
1717
857.
022
7665
.90
2640
571.
035
1933
.10
2550
453.
043
2000
.10
2072
015.
038
5562
.80
Proc
esse
d fr
uits
and
veg
etab
les
Dri
ed a
nd p
rese
rved
Veg
etab
les
1187
87.5
424.
0612
5726
.342
993.
8114
7861
.249
641.
5112
4613
.553
207.
4811
0173
.951
697.
09M
ango
pul
p15
6835
.550
5.83
1667
52.2
5096
8.51
1730
13.6
7529
8.90
1861
97.9
7446
0.77
1719
29.4
8140
0.66
Pick
le a
nd c
hutn
ey14
5216
.029
3.59
1452
16.0
293.
5914
5216
.029
3.59
--
--
Oth
er p
roce
ssed
frui
ts a
nd12
9110
.150
8.14
3117
56.3
9628
1.65
3871
26.4
1371
79.0
039
7978
.214
3550
.60
3400
68.0
1316
35.5
0ve
geta
bles
Tota
l54
9949
.017
31.6
260
4234
.719
0244
.00
7080
01.2
2621
19.4
070
8789
.527
1218
.90
6221
71.3
2647
33.3
0G
rand
Tot
al25
8386
7.0
4914
.57
2375
206.
048
2182
.30
3393
603.
067
6915
.40
3304
015.
076
6962
.30
2733
145.
069
6461
.00
(Sou
rce:
ww
w.in
dias
tat.c
om)
Page 56
Vegetable Statistics
41
Table 2.9: Percent export share of major horticultural crops
Produce / Product Percent share of exports2007-08 2008-09 2009-10 2010-11
Floriculture 7.1 5.4 3.8 4.1Fruits & vegetable seeds 2.9 1.8 1.9 2.5Fresh onions 21.5 27.0 30.2 25.0Other fresh vegetables 10.2 10.0 9.5 12.8Dried nuts (Walnuts) 3.4 2.1 2.6 2.2Fresh mangoes 2.6 2.5 2.6 2.4Fresh grapes 6.6 6.0 7.1 5.9Other fresh fruits 6.3 6.4 6.8 7.0Dried & preserved vegetables 8.9 7.3 6.9 7.4Mango pulp 10.6 11.1 9.7 11.7Other processed fruits & vegetables 20.0 20.3 18.7 18.9Total (Horticulture) 100.0 100.0 100.0 100.0
(Source: Agricultural Research Data Book, 2011, IASRI)
Table 2.10: Progress under national horticulture mission (NHM) in India (2010-11)
Description 2005-06 to 2008-09 2009-10 2010-11
Nurseries (No.) 1905 201 2295Area Coverage 12.79 2.96 18.96Rejuvenation of Senile Orchards 2.09 0.37 3.25Organic Farming 1.03 0.17 1.4Integrated Pest Management/Integrated Nutrient Management 5.54 1.73 8.61Pack House (No.) 662 153 2202Cold Storage (No.) 97 157 367Mobile/Primary Processing units (No.) - - 540Markets (No.) 134 83 198(a) Whole Sale - - 23(b) Rural - - 175
(Source: www.indiastat.com)
Page 57
Indian Institute of Vegetable Research
42
Section-III
Vegetable Statistics at A GlanceTable 3.1: Area, production and yield of vegetables in world and India
Years World IndiaArea Production Yield Seed Area Production Yield
(Million ha) (Million t) (t/ha) (000’t) (Million ha) (Million t) (t/ha)
1961 23.75 222.59 9.37 46.34 2.78 18.47 6.641962 23.47 222.61 9.49 50.91 3.06 19.28 6.301963 23.26 223.48 9.61 51.04 2.98 20.05 6.721964 23.01 226.38 9.84 48.02 3.05 20.77 6.811965 22.86 228.79 10.01 54.85 3.15 21.51 6.821966 22.91 236.96 10.34 50.23 3.20 22.40 7.011967 23.05 245.37 10.64 52.55 3.24 23.14 7.131968 23.04 251.80 10.93 58.26 3.30 23.93 7.251969 23.11 254.10 10.99 57.42 3.40 24.95 7.341970 22.63 250.97 11.09 50.39 3.49 25.99 7.451971 22.98 263.35 11.46 48.35 3.58 26.98 7.531972 23.17 260.70 11.25 49.26 3.70 28.06 7.591973 23.69 274.77 11.60 45.65 3.79 29.01 7.661974 23.83 282.05 11.84 50.04 3.85 30.02 7.791975 24.18 289.70 11.98 51.27 3.98 30.97 7.791976 24.11 291.98 12.11 51.56 4.00 32.01 8.011977 24.48 303.71 12.41 46.37 4.09 32.95 8.071978 25.55 321.24 12.57 43.94 4.25 33.99 8.001979 25.61 328.09 12.81 54.47 4.31 34.94 8.101980 25.70 325.63 12.67 60.28 4.35 35.98 8.271981 26.25 341.84 13.02 63.66 4.40 37.44 8.501982 27.13 360.23 13.28 65.91 4.53 38.97 8.611983 27.36 366.62 13.40 68.96 4.70 40.54 8.631984 28.10 393.75 14.01 58.12 4.73 41.99 8.881985 29.58 404.72 13.68 63.73 4.83 42.96 8.901986 30.46 427.05 14.02 69.26 4.96 44.54 8.991987 31.32 437.54 13.97 67.43 5.11 45.92 8.981988 31.49 446.41 14.18 70.28 4.84 47.01 9.711989 32.15 456.04 14.18 75.64 4.88 48.01 9.841990 31.76 466.67 14.69 76.75 4.79 48.94 10.21
Contd...
Page 58
Vegetable Statistics
43
Years World IndiaArea Production Yield Seed Area Production Yield
(Million ha) (Million t) (t/ha) (000’t) (Million ha) (Million t) (t/ha)
1991 32.16 469.19 14.59 74.23 4.86 49.97 10.271992 32.62 486.25 14.91 93.68 4.42 50.47 11.42
1993 34.25 516.98 15.09 95.44 4.71 52.96 11.24
1994 35.34 539.60 15.27 103.38 4.45 54.18 12.16
1995 38.02 571.04 15.02 109.11 5.62 56.53 10.051996 39.29 605.77 15.42 126.11 5.05 57.26 11.34
1997 39.77 618.11 15.54 121.56 4.95 54.11 10.94
1998 42.00 649.44 15.46 100.44 5.32 63.82 11.99
1999 44.49 707.46 15.90 108.29 5.47 70.98 12.97
2000 46.70 777.28 16.65 108.38 5.47 72.28 13.22
2001 47.95 804.99 16.79 111.50 6.02 78.90 13.10
2002 48.88 833.18 17.04 106.44 5.76 69.18 12.00
2003 51.51 863.52 16.76 101.26 7.18 79.04 11.02
2004 50.83 875.42 17.22 101.08 5.40 65.56 12.14
2005 51.86 898.42 17.32 96.20 5.84 71.45 12.23
2006 52.55 931.77 17.73 97.60 6.33 81.88 12.93
2007 52.46 962.34 18.34 102.64 6.56 87.98 13.412008 52.76 994.65 18.85 98.08 6.80 91.73 13.49
2009 54.01 1019.11 18.87 103.29 6.75 90.63 13.43
2010 55.60 1044.38 18.78 111.85 7.26 100.41 13.84
2011 56.69 1087.59 19.18 111.99 7.57 105.80 13.97
ACGR for last ten 1.36 2.97 1.59 0.83 2.54 4.93 2.33years (2002-2011)
Note: Vegetables include cabbage, cauliflower, okra, tomato, cucumber & gherkin, pumpkin, squash & gourds, eggplants,carrot & turnips, water melons, green peas, chilli& pepper green, beans, garlic, lettuce & chicory, onion dry, mushroomsand other melons. (Source: www.faostat.fao.org.in)
Table 3.2: Decade-wise annual compound growth rate (ACGRs) in area, production and yield ofvegetables in the world.
Period Annual compound growth rate (%)
Area Production Yield
1961-1970 -0.35 1.76 2.12
1971-1980 1.32 2.78 1.45
1981-1990 2.43 3.58 1.12
1991-2000 4.28 5.46 1.13
2001-2010 1.25 2.88 1.61
(Source: Calculated by the authors from FAO data)
Page 59
Indian Institute of Vegetable Research
44
Table 3.3: Continent-wise area, production and yield of vegetables
Years Area (Million ha) Production (Million t) Yield (t/ha)
Africa1961 1.99 13.59 6.831962 2.00 14.28 7.141963 2.04 14.84 7.281964 2.12 15.31 7.201965 2.15 15.84 7.371966 2.21 16.41 7.441967 2.24 16.24 7.261968 2.31 16.88 7.301969 2.37 17.48 7.361970 2.50 18.02 7.211971 2.52 18.53 7.371972 2.58 18.70 7.241973 2.63 19.44 7.401974 2.66 20.54 7.711975 2.76 21.92 7.951976 2.82 22.29 7.911977 2.77 22.15 8.001978 2.79 22.40 8.021979 2.85 23.16 8.141980 2.90 23.98 8.261981 2.93 24.48 8.371982 2.98 24.80 8.331983 3.06 25.48 8.321984 3.19 26.62 8.351985 3.39 28.72 8.481986 3.51 30.99 8.821987 3.49 32.43 9.291988 3.54 31.40 8.871989 3.64 32.27 8.871990 3.84 33.59 8.741991 3.90 34.79 8.911992 4.03 35.97 8.941993 4.07 36.73 9.011994 4.47 38.38 8.581995 4.73 39.14 8.281996 5.44 43.47 7.991997 5.25 44.72 8.521998 5.48 46.12 8.421999 5.68 49.20 8.66
Contd...
Page 60
Vegetable Statistics
45
Years Area (Million ha) Production (Million t) Yield (t/ha)
2000 5.83 49.95 8.572001 5.49 49.59 9.032002 5.72 51.89 9.082003 5.95 55.97 9.412004 6.30 59.50 9.442005 6.36 60.41 9.502006 6.24 63.86 10.242007 6.16 64.06 10.412008 6.36 66.36 10.432009 6.70 68.80 10.272010 7.08 71.16 10.062011 6.81 67.85 9.96ACGR for last ten years (2002-2011) 1.89 3.14 1.23
Asia1961 12.48 112.34 9.001962 12.30 112.02 9.111963 11.69 108.68 9.301964 11.36 105.26 9.271965 11.62 110.13 9.481966 11.60 112.11 9.671967 11.79 116.03 9.841968 11.81 122.31 10.351969 11.97 125.82 10.511970 11.19 118.14 10.551971 11.72 127.75 10.901972 11.76 125.23 10.651973 12.11 129.55 10.701974 12.23 133.27 10.891975 12.49 140.25 11.231976 12.54 143.68 11.451977 12.83 148.46 11.571978 13.55 159.26 11.751979 13.67 162.60 11.891980 13.80 162.79 11.791981 14.38 175.45 12.201982 15.17 185.19 12.211983 15.46 194.56 12.591984 15.90 209.67 13.191985 17.22 222.51 12.921986 18.11 243.24 13.43
Contd...
Page 61
Indian Institute of Vegetable Research
46
Years Area (Million ha) Production (Million t) Yield (t/ha)
1987 18.62 250.67 13.461988 18.62 257.93 13.851989 19.02 262.56 13.811990 18.88 273.88 14.511991 19.12 273.98 14.331992 19.95 305.04 15.291993 21.68 331.94 15.311994 22.38 350.78 15.671995 24.62 376.98 15.311996 25.29 404.62 16.001997 25.96 415.62 16.011998 27.80 441.75 15.891999 29.77 483.98 16.262000 31.84 554.12 17.402001 33.68 583.81 17.342002 34.41 607.75 17.662003 36.56 626.64 17.142004 35.62 627.88 17.632005 36.75 655.49 17.842006 37.64 686.04 18.222007 37.91 720.82 19.012008 38.01 750.17 19.742009 38.84 765.67 19.722010 40.24 794.28 19.742011 41.64 836.57 20.09ACGR for last ten years (2002-2011) 1.79 3.69 1.87
Australia1961 0.07 0.67 10.041962 0.07 0.68 10.301963 0.07 0.68 10.071964 0.06 0.71 11.181965 0.07 0.74 10.881966 0.07 0.82 11.641967 0.07 0.82 11.761968 0.07 0.82 11.261969 0.07 0.89 12.281970 0.07 0.83 12.701971 0.07 0.94 12.861972 0.07 0.93 12.661973 0.07 0.87 12.36
Contd...
Page 62
Vegetable Statistics
47
Years Area (Million ha) Production (Million t) Yield (t/ha)
1974 0.07 0.89 12.601975 0.07 0.89 12.741976 0.07 0.93 13.281977 0.07 0.97 14.481978 0.07 1.13 15.981979 0.07 0.99 14.891980 0.07 1.03 15.721981 0.07 1.04 15.641982 0.07 1.07 15.351983 0.07 1.14 16.441984 0.07 1.19 17.291985 0.07 1.27 18.131986 0.07 1.28 17.891987 0.07 1.35 18.481988 0.08 1.42 18.481989 0.08 1.50 18.721990 0.08 1.48 19.651991 0.07 1.53 20.661992 0.08 1.53 20.331993 0.07 1.44 19.301994 0.08 1.61 20.801995 0.08 1.64 20.761996 0.08 1.79 21.171997 0.08 1.77 20.821998 0.08 1.81 21.731999 0.08 1.80 21.562000 0.08 1.93 22.722001 0.08 2.08 24.612002 0.07 1.90 26.882003 0.08 1.77 23.022004 0.08 1.97 25.492005 0.07 1.89 25.282006 0.07 1.91 25.752007 0.07 1.88 26.662008 0.06 1.88 30.782009 0.06 1.93 30.122010 0.07 1.95 28.022011 0.07 1.79 24.35ACGR for last ten years (2002-2011) -1.18 -0.001 1.19
Contd...
Page 63
Indian Institute of Vegetable Research
48
Years Area (Million ha) Production (Million t) Yield (t/ha)
Europe1961 6.25 66.44 10.631962 6.13 64.34 10.501963 6.53 68.93 10.551964 6.48 74.31 11.471965 6.09 70.32 11.561966 6.01 75.36 12.531967 5.86 78.18 13.351968 5.74 75.69 13.181969 5.72 76.28 13.341970 5.91 79.26 13.411971 5.68 79.62 14.031972 5.68 78.56 13.821973 5.81 87.45 15.051974 5.79 87.47 15.111975 5.78 85.63 14.821976 5.64 84.46 14.971977 5.75 89.24 15.511978 5.99 93.92 15.691979 5.86 94.80 16.181980 5.80 92.88 16.021981 5.82 95.97 16.481982 5.77 100.46 17.411983 5.73 99.00 17.281984 5.74 106.35 18.521985 5.65 102.02 18.041986 5.60 101.45 18.131987 5.83 100.67 17.251988 5.89 102.80 17.461989 5.94 103.08 17.371990 5.51 99.87 18.121991 5.59 100.72 18.021992 5.02 85.52 17.041993 4.94 87.38 17.681994 4.78 83.38 17.441995 4.98 87.27 17.521996 4.80 87.92 18.311997 4.80 87.00 18.111998 4.81 89.75 18.671999 4.99 94.75 19.002000 4.92 93.10 18.932001 4.73 92.54 19.55
Contd...
Page 64
Vegetable Statistics
49
Years Area (Million ha) Production (Million t) Yield (t/ha)
2002 4.68 90.36 19.302003 4.85 96.37 19.872004 4.75 101.26 21.322005 4.60 98.49 21.422006 4.59 97.90 21.322007 4.32 90.85 21.032008 4.31 94.12 21.832009 4.30 99.05 23.012010 4.20 94.23 22.452011 4.26 99.59 23.40ACGR for last ten years (2002-2011) -1.57 0.24 1.84
North America1961 1.55 20.09 12.971962 1.53 21.12 13.841963 1.48 20.06 13.541964 1.49 19.92 13.401965 1.48 20.60 13.911966 1.54 20.69 13.441967 1.59 22.11 13.901968 1.62 24.21 14.981969 1.52 21.64 14.281970 1.46 22.14 15.151971 1.47 23.22 15.811972 1.49 23.45 15.721973 1.51 23.40 15.541974 1.51 24.96 16.511975 1.53 26.11 17.031976 1.48 25.40 17.181977 1.48 27.12 18.281978 1.55 27.27 17.651979 1.52 28.29 18.621980 1.42 26.31 18.521981 1.40 26.67 19.051982 1.41 29.12 20.681983 1.36 27.32 20.071984 1.40 29.30 20.981985 1.40 29.22 20.871986 1.32 28.50 21.571987 1.37 30.08 21.961988 1.38 29.14 21.04
Contd...
Page 65
Indian Institute of Vegetable Research
50
Years Area (Million ha) Production (Million t) Yield (t/ha)
1989 1.44 32.63 22.681990 1.45 33.54 23.171991 1.43 33.27 23.301992 1.45 33.78 23.241993 1.42 34.11 24.021994 1.52 38.72 25.491995 1.50 37.28 24.801996 1.48 37.91 25.621997 1.44 38.00 26.411998 1.45 36.73 25.311999 1.50 41.38 27.542000 1.51 41.74 27.602001 1.46 39.26 26.932002 1.44 41.45 28.792003 1.43 40.35 28.142004 1.37 42.35 30.852005 1.34 39.44 29.402006 1.33 39.85 30.062007 1.30 41.10 31.652008 1.25 38.28 30.552009 1.26 39.67 31.432010 1.21 37.93 31.292011 1.16 36.93 31.74ACGR for last ten years (2002-2011) -2.24 -1.12 1.15
South America1961 1.03 6.91 6.691962 1.04 7.28 6.981963 1.04 7.30 7.041964 1.06 7.75 7.311965 1.05 7.81 7.411966 1.08 8.23 7.601967 1.10 8.49 7.741968 1.07 8.36 7.811969 1.06 8.49 7.991970 1.07 8.81 8.241971 1.07 8.92 8.371972 1.06 8.98 8.481973 1.04 9.02 8.701974 1.04 9.54 9.21
Contd...
Page 66
Vegetable Statistics
51
Years Area (Million ha) Production (Million t) Yield (t/ha)
1975 1.04 9.94 9.591976 1.04 10.24 9.871977 1.02 10.32 10.071978 1.04 10.98 10.551979 1.06 11.57 10.961980 1.06 11.76 11.061981 1.04 11.44 10.961982 1.09 12.19 11.241983 1.04 11.82 11.331984 1.10 12.39 11.211985 1.09 12.56 11.57
1986 1.11 12.89 11.641987 1.16 13.38 11.561988 1.16 14.12 12.121989 1.18 13.98 11.891990 1.14 14.33 12.571991 1.16 14.52 12.561992 1.14 14.31 12.551993 1.16 14.99 12.951994 1.23 16.45 13.331995 1.23 17.42 14.151996 1.27 17.71 13.981997 1.27 17.74 13.961998 1.30 18.56 14.29
1999 1.31 19.47 14.862000 1.32 19.06 14.392001 1.31 19.21 14.702002 1.32 21.09 15.932003 1.35 22.00 16.282004 1.38 21.70 15.692005 1.40 21.91 15.692006 1.41 22.15 15.722007 1.44 22.72 15.732008 1.42 22.88 16.072009 1.49 23.85 16.002010 1.50 24.45 16.25
2011 1.50 25.04 16.67ACGR for last ten years (2002-2011) 1.43 1.80 0.35
(Source: www.faostat.fao.org.in)
Page 67
Indian Institute of Vegetable Research
52
Table 3.4: Major vegetables producing countries in the world (2010-11)
Country Area (Million ha) Production (Million t) Productivity (t/ha)
China 24.05 (42.19%) 473.06 (46.74%) 22.5India 8.50 (14.90%) 146.55 (14.48%) 17.3USA 1.12 (1.95%) 35.29 (3.48) 31.4Turkey 1.11 (1.94%) 25.83 (2.56) 23.7Egypt 0.76 (1.32%) 19.52 (1.92) 25.7Iran 0.71 (1.25%) 18.68 (1.85) 26.2Italy 0.54 (0.95%) 13.05 (1.29) 25.1Russian Fed 0.76 (1.32%) 13.23 (1.32) 17.4Spain 0.34 (0.60%) 12.68 (1.25) 37.2Mexico 0.66 (1.21%) 12.13 (1.19) 18.5Others 18.46 (32.37%) 242.05 (23.92) 13.1World 57.01 (100%) 1012.07 (100%) 18.8
(Source: NHB, National Horticulture Database 2011)(Figures in parenthesis is percentage share to the world total)
Table 3.5: Area, production and yield of vegetables in leading vegetable growing countries.
Years Area (Million ha) Production (Million t) Yield (t/ha)
China1961 5.76 59.05 10.261962 5.16 55.21 10.701963 4.48 49.04 10.961964 4.02 44.06 10.961965 4.09 46.67 11.421966 3.95 46.09 11.681967 3.95 47.02 11.901968 3.86 49.59 12.841969 3.83 51.31 13.391970 2.90 42.02 14.511971 3.20 46.78 14.621972 3.09 42.87 13.881973 3.39 47.81 14.101974 3.31 48.01 14.501975 3.43 49.77 14.491976 3.43 49.50 14.431977 3.60 52.00 14.451978 4.05 57.49 14.211979 4.01 58.15 14.501980 3.93 56.56 14.39
Contd...
Page 68
Vegetable Statistics
53
Years Area (Million ha) Production (Million t) Yield (t/ha)
1981 4.26 64.77 15.201982 4.72 69.66 14.751983 4.98 78.46 15.761984 5.18 88.81 17.131985 6.06 96.15 15.861986 6.69 112.86 16.861987 7.10 118.44 16.681988 7.57 126.76 16.731989 7.73 128.55 16.631990 7.66 131.86 17.221991 7.94 135.06 17.011992 8.26 151.41 18.331993 9.81 177.16 18.051994 10.65 194.03 18.211995 11.30 209.20 18.511996 12.40 233.40 18.821997 13.28 250.40 18.861998 14.45 260.03 18.001999 16.02 289.54 18.082000 18.11 356.08 19.662001 19.31 379.56 19.662002 20.26 409.42 20.212003 20.80 416.91 20.052004 21.55 426.80 19.812005 21.97 442.82 20.162006 22.42 462.07 20.612007 22.30 487.08 21.852008 22.19 512.03 23.082009 22.74 522.72 22.982010 23.46 540.03 23.022011 24.28 561.74 23.14ACGR for last ten years (2002-2011) 1.69 3.80 2.08
Egypt1961 0.22 3.72 16.611962 0.22 4.13 18.421963 0.25 4.55 18.381964 0.25 4.63 18.401965 0.26 4.86 18.721966 0.27 5.28 19.241967 0.27 4.80 17.72
Contd...
Page 69
Indian Institute of Vegetable Research
54
Years Area (Million ha) Production (Million t) Yield (t/ha)
1968 0.29 5.14 17.701969 0.30 5.40 17.871970 0.29 5.20 17.861971 0.30 5.47 18.061972 0.30 5.40 18.041973 0.32 5.56 17.461974 0.33 6.06 18.181975 0.35 6.39 18.111976 0.37 6.74 18.431977 0.36 6.52 18.341978 0.36 6.79 19.101979 0.38 7.18 19.141980 0.38 7.40 19.501981 0.37 7.45 20.091982 0.37 7.53 20.361983 0.37 7.79 20.821984 0.37 7.96 21.441985 0.39 8.96 22.891986 0.44 10.16 23.181987 0.43 10.66 24.601988 0.43 9.55 22.111989 0.41 8.71 21.081990 0.39 9.25 23.721991 0.38 8.81 23.271992 0.37 9.33 25.151993 0.37 9.49 25.991994 0.38 9.73 25.721995 0.43 10.35 24.321996 0.46 11.85 25.771997 0.49 12.51 25.571998 0.52 12.55 24.251999 0.57 14.03 24.522000 0.62 14.90 23.882001 0.57 13.79 24.152002 0.59 14.42 24.272003 0.64 15.52 24.252004 0.62 15.94 25.572005 0.65 16.65 25.792006 0.71 18.24 25.812007 0.73 18.95 25.912008 0.75 19.71 26.442009 0.80 21.35 26.702010 0.78 19.49 25.142011 0.78 18.95 24.41ACGR for last ten years (2002-2011) 3.36 3.74 0.36
Page 70
Vegetable Statistics
55
Years Area (Million ha) Production (Million t) Yield (t/ha)
Iran1961 0.22 1.49 6.881962 0.23 1.60 6.931963 0.25 1.74 7.041964 0.26 1.81 7.101965 0.27 1.90 7.161966 0.27 2.03 7.381967 0.28 2.14 7.521968 0.29 2.25 7.691969 0.30 2.43 8.161970 0.30 2.50 8.271971 0.32 2.63 8.321972 0.34 2.77 8.111973 0.36 3.06 8.491974 0.38 3.28 8.721975 0.39 3.52 9.021976 0.40 3.78 9.361977 0.42 4.19 10.041978 0.42 4.62 10.901979 0.43 4.28 10.041980 0.45 5.00 11.131981 0.46 5.63 12.161982 0.50 6.57 13.091983 0.53 6.73 12.761984 0.54 7.39 13.571985 0.60 8.17 13.641986 0.66 9.08 13.661987 0.65 8.83 13.571988 0.41 6.13 14.931989 0.47 6.31 13.301990 0.65 10.39 16.051991 0.53 7.43 14.071992 0.62 9.84 15.911993 0.57 8.86 15.471994 0.44 7.83 17.941995 0.46 8.27 17.911996 0.56 10.73 19.121997 0.55 10.43 18.911998 0.63 12.21 19.231999 0.61 12.81 20.872000 0.56 11.66 21.00
Contd...
Page 71
Indian Institute of Vegetable Research
56
Years Area (Million ha) Production (Million t) Yield (t/ha)
2001 0.56 11.74 20.962002 0.61 13.85 22.822003 0.64 13.77 21.632004 0.63 14.85 23.432005 0.81 17.77 21.852006 0.70 17.61 25.242007 0.76 18.99 24.872008 0.61 15.87 26.102009 0.75 18.42 24.722010 0.77 20.00 26.052011 0.96 25.96 27.03ACGR for last ten years (2002-2011) 3.37 5.66 2.21
Mexico1961 0.21 1.25 5.961962 0.22 1.51 6.861963 0.22 1.55 6.971964 0.23 1.58 6.971965 0.21 1.78 8.471966 0.21 1.76 8.471967 0.20 1.81 8.991968 0.20 1.85 9.061969 0.20 1.85 9.031970 0.22 2.10 9.591971 0.24 2.56 10.581972 0.29 3.02 10.581973 0.29 3.01 10.521974 0.27 3.06 11.221975 0.24 2.68 11.041976 0.25 2.73 11.101977 0.28 3.25 11.471978 0.30 4.01 13.331979 0.32 4.36 13.701980 0.36 4.30 11.981981 0.31 3.95 12.531982 0.35 4.62 13.371983 0.32 4.47 13.991984 0.37 5.23 14.121985 0.42 5.27 12.561986 0.39 5.52 14.001987 0.42 5.69 13.711988 0.46 6.18 13.571989 0.48 6.49 13.40
Contd...
Page 72
Vegetable Statistics
57
Years Area (Million ha) Production (Million t) Yield (t/ha)
1990 0.48 6.48 13.601991 0.50 6.85 13.731992 0.52 6.35 12.151993 0.50 6.59 13.191994 0.46 6.09 13.181995 0.46 6.90 14.871996 0.49 7.50 15.421997 0.53 8.58 16.091998 0.61 9.57 15.771999 0.67 10.89 16.312000 0.65 10.26 15.762001 0.66 10.95 16.662002 0.65 10.56 16.162003 0.67 11.15 16.722004 0.64 11.34 17.672005 0.66 11.19 17.052006 0.67 11.45 17.222007 0.64 12.12 18.912008 0.69 12.42 17.952009 0.69 11.73 17.102010 0.68 12.51 18.392011 0.67 11.91 17.72ACGR for last ten years (2002-2011) 0.52 1.48 0.96
United States of America1961 1.45 18.95 13.021962 1.43 19.90 13.921963 1.39 18.93 13.651964 1.38 18.70 13.581965 1.37 19.30 14.071966 1.44 19.48 13.561967 1.49 20.90 14.051968 1.51 22.87 15.171969 1.41 20.45 14.481970 1.36 20.76 15.291971 1.37 21.88 15.931972 1.39 22.24 15.961973 1.40 22.02 15.701974 1.41 23.59 16.781975 1.42 24.59 17.271976 1.38 23.93 17.37
Contd...
Page 73
Indian Institute of Vegetable Research
58
Years Area (Million ha) Production (Million t) Yield (t/ha)
1977 1.39 25.60 18.451978 1.45 25.61 17.721979 1.42 26.52 18.721980 1.32 24.66 18.681981 1.29 24.83 19.241982 1.29 27.17 21.001983 1.26 25.50 20.311984 1.28 27.25 21.221985 1.29 27.28 21.111986 1.22 26.70 21.851987 1.27 28.13 22.201988 1.27 27.19 21.441989 1.32 30.57 23.081990 1.34 31.37 23.471991 1.32 31.42 23.751992 1.35 31.88 23.671993 1.32 32.09 24.301994 1.41 36.47 25.791995 1.39 35.04 25.151996 1.37 35.60 26.071997 1.33 35.71 26.921998 1.34 34.35 25.611999 1.39 38.97 28.022000 1.40 39.44 28.122001 1.34 36.93 27.462002 1.33 39.05 29.442003 1.32 37.88 28.752004 1.26 39.80 31.532005 1.24 36.97 29.832006 1.23 37.30 30.392007 1.19 38.51 32.262008 1.16 35.86 30.972009 1.17 37.29 31.962010 1.12 35.61 31.802011 1.08 34.67 32.21ACGR for last ten years (2002-2011) -2.18 -1.14 1.07
Turkey1961 0.55 6.62 12.081962 0.54 6.86 12.801963 0.53 7.12 13.431964 0.54 7.55 13.88
Contd...
Page 74
Vegetable Statistics
59
Years Area (Million ha) Production (Million t) Yield (t/ha)
1965 0.54 7.61 14.061966 0.55 7.69 13.861967 0.56 7.89 14.081968 0.55 8.14 14.731969 0.59 8.60 14.511970 0.63 9.17 14.641971 0.63 9.23 14.591972 0.65 9.56 14.721973 0.62 8.87 14.251974 0.65 9.59 14.751975 0.66 10.29 15.601976 0.68 11.42 16.911977 0.68 11.05 16.191978 0.72 12.01 16.761979 0.73 13.65 18.761980 0.73 13.03 17.961981 0.79 13.34 16.911982 0.76 13.52 17.671983 0.76 13.72 18.001984 0.76 14.54 19.011985 0.81 16.60 20.621986 0.78 16.20 20.711987 0.77 16.59 21.411988 0.78 16.86 21.611989 0.79 16.71 21.091990 0.79 18.08 22.981991 0.83 19.11 22.961992 0.88 19.24 21.831993 0.80 18.53 23.091994 0.85 19.59 22.971995 0.94 21.87 23.371996 0.93 22.20 23.921997 0.93 20.97 22.671998 0.96 23.50 24.541999 1.02 24.60 24.222000 1.00 24.61 24.622001 1.01 24.17 24.002002 1.06 25.83 24.322003 1.05 25.91 24.602004 1.03 25.27 24.442005 1.07 26.36 24.67
Contd...
Page 75
Indian Institute of Vegetable Research
60
Years Area (Million ha) Production (Million t) Yield (t/ha)
2006 0.99 25.74 26.082007 1.00 25.58 25.582008 1.09 27.14 24.972009 1.13 26.70 23.592010 1.09 25.90 23.772011 1.03 27.41 26.72ACGR for last ten years (2002-2011) 0.27 0.54 0.27
Spain1961 0.34 6.06 17.581962 0.35 5.94 16.951963 0.36 6.24 17.221964 0.38 6.33 16.891965 0.36 6.04 16.581966 0.37 6.04 16.311967 0.38 6.16 16.411968 0.39 6.30 16.211969 0.37 6.25 16.741970 0.40 6.51 16.211971 0.41 6.78 16.551972 0.41 6.98 16.861973 0.45 7.53 16.711974 0.47 7.98 16.921975 0.47 8.23 17.421976 0.47 7.92 16.951977 0.47 8.53 18.251978 0.47 8.42 17.811979 0.47 8.50 18.091980 0.45 8.54 18.791981 0.46 8.60 18.551982 0.46 8.93 19.351983 0.46 8.73 19.081984 0.48 9.32 19.351985 0.48 9.53 20.041986 0.47 9.60 20.541987 0.47 9.81 20.751988 0.50 10.40 20.941989 0.51 10.98 21.691990 0.50 11.51 22.961991 0.47 10.59 22.331992 0.46 10.52 23.11
Contd...
Page 76
Vegetable Statistics
61
Years Area (Million ha) Production (Million t) Yield (t/ha)
1993 0.43 10.21 23.851994 0.42 10.57 25.061995 0.39 10.33 26.361996 0.39 11.21 28.571997 0.39 11.48 29.381998 0.39 11.84 30.511999 0.40 12.50 31.422000 0.39 12.19 31.352001 0.38 12.28 31.932002 0.38 12.76 33.452003 0.38 12.81 33.672004 0.40 13.41 33.652005 0.39 13.39 34.092006 0.38 12.88 33.862007 0.36 13.07 36.242008 0.35 12.61 35.742009 0.35 13.46 37.992010 0.35 12.68 36.432011 0.34 12.41 36.86ACGR for last ten years (2002-2011) -1.63 -0.28 1.37
Italy1961 0.60 9.29 15.381962 0.61 8.85 14.431963 0.63 9.97 15.771964 0.63 10.44 16.561965 0.64 10.75 16.691966 0.66 11.25 17.011967 0.67 11.51 17.241968 0.67 11.34 16.961969 0.67 12.13 18.191970 0.67 12.13 18.161971 0.63 11.82 18.701972 0.61 11.36 18.601973 0.60 11.49 19.311974 0.60 12.31 20.491975 0.60 12.40 20.761976 0.58 11.79 20.261977 0.59 12.12 20.631978 0.60 12.43 20.691979 0.61 13.50 21.96
Contd...
Page 77
Indian Institute of Vegetable Research
62
Years Area (Million ha) Production (Million t) Yield (t/ha)
1980 0.61 13.43 22.091981 0.60 13.27 22.261982 0.62 13.17 21.361983 0.63 14.87 23.421984 0.64 15.36 23.981985 0.63 15.22 24.151986 0.61 14.83 24.351987 0.59 13.60 22.871988 0.61 13.40 22.121989 0.63 14.53 23.241990 0.62 14.14 22.801991 0.63 14.64 23.421992 0.61 14.54 23.661993 0.61 14.13 23.321994 0.60 14.33 23.941995 0.59 13.81 23.421996 0.60 15.19 25.391997 0.59 14.33 24.211998 0.60 14.78 24.661999 0.61 15.67 25.842000 0.61 16.52 27.202001 0.59 14.88 25.432002 0.58 13.86 23.712003 0.60 15.04 25.212004 0.60 16.47 27.632005 0.59 15.83 26.682006 0.57 14.73 25.782007 0.57 14.68 25.742008 0.53 13.97 26.472009 0.54 15.08 28.102010 0.54 14.20 26.452011 0.47 13.29 28.02ACGR for last ten years (2002-2011) -2.10 -0.97 1.16
Russia1992 0.82 10.71 13.061993 0.79 10.40 13.211994 0.81 10.06 12.491995 0.83 11.82 14.211996 0.81 11.17 13.851997 0.82 11.77 14.42
Contd...
Page 78
Vegetable Statistics
63
Years Area (Million ha) Production (Million t) Yield (t/ha)
1998 0.76 10.98 14.451999 0.87 12.48 14.382000 0.87 12.45 14.302001 0.87 13.26 15.232002 0.89 13.03 14.582003 0.95 14.78 15.572004 0.94 14.81 15.682005 0.93 16.13 17.372006 0.88 16.63 18.952007 0.72 12.37 17.152008 0.77 14.35 18.692009 0.77 14.83 19.372010 0.76 13.28 17.502011 0.84 16.28 19.41ACGR for last ten years (2002-2011) -2.37 0.37 2.81
(Source: www.faostat.fao.org)
Table 3.6: Area, production and yield of vegetables in SAARC countries.
Years Area (000’ha) Production (000’t) Yield (t/ha)
Afghanistan1961 85.00 370.00 4.351962 85.00 385.00 4.531963 85.00 408.00 4.801964 90.00 431.00 4.791965 96.00 448.00 4.671966 95.00 454.00 4.781967 85.70 491.00 5.731968 76.00 504.00 6.631969 76.60 517.00 6.751970 76.40 482.00 6.311971 76.00 558.00 7.341972 76.80 500.00 6.511973 76.00 515.00 6.781974 78.10 518.00 6.631975 75.00 525.50 7.011976 119.20 564.20 4.731977 76.00 460.00 6.051978 75.80 516.00 6.811979 74.40 523.00 7.031980 71.40 512.00 7.17
Contd...
Page 79
Indian Institute of Vegetable Research
64
Years Area (000’ha) Production (000’t) Yield (t/ha)
1981 69.70 514.00 7.371982 71.70 529.00 7.381983 69.20 522.00 7.541984 66.10 503.00 7.611985 64.40 488.00 7.581986 56.80 441.00 7.761987 57.00 454.00 7.961988 56.40 448.00 7.941989 52.50 420.00 8.001990 54.68 490.00 8.961991 52.50 488.00 9.301992 53.72 492.40 9.171993 55.63 513.53 9.231994 55.14 508.03 9.211995 57.75 553.42 9.581996 60.92 590.09 9.691997 62.13 613.73 9.881998 65.12 657.74 10.101999 65.96 685.38 10.392000 63.27 707.73 11.192001 73.11 836.79 11.452002 69.81 686.42 9.832003 98.25 837.32 8.522004 60.47 696.21 11.512005 102.88 968.79 9.422006 90.84 847.65 9.332007 90.70 909.47 10.032008 90.42 875.11 9.682009 99.98 964.02 9.642010 96.89 968.28 9.992011 78.41 934.56 11.92ACGR for last ten years (2002-2011) 1.88 3.19 1.29
Bangladesh1961 163.15 906.50 5.561962 156.35 879.20 5.621963 169.00 907.90 5.371964 170.40 938.20 5.511965 170.85 1005.70 5.891966 172.28 1126.32 6.541967 181.88 1210.95 6.66
Contd...
Page 80
Vegetable Statistics
65
Years Area (000’ha) Production (000’t) Yield (t/ha)
1968 184.55 1270.43 6.881969 175.07 1239.21 7.081970 177.82 1262.17 7.101971 177.06 1243.39 7.021972 155.71 1041.17 6.691973 155.94 979.89 6.281974 158.79 978.85 6.161975 167.16 1095.14 6.551976 170.89 1060.94 6.211977 166.92 1002.22 6.001978 171.72 1061.84 6.181979 173.57 1071.56 6.171980 177.43 1081.79 6.101981 176.88 1044.59 5.911982 186.55 1117.39 5.991983 193.12 1175.63 6.091984 195.73 1205.35 6.161985 196.82 1197.43 6.081986 199.45 1200.08 6.021987 201.57 1199.25 5.951988 208.36 1251.34 6.011989 217.61 1264.97 5.811990 212.80 1346.14 6.331991 230.91 1383.65 5.991992 232.49 1393.70 5.991993 237.12 1415.25 5.971994 240.18 1452.88 6.051995 243.41 1485.83 6.101996 249.69 1507.25 6.041997 252.01 1559.37 6.191998 257.10 1571.61 6.111999 316.51 1785.00 5.642000 300.28 1802.00 6.002001 301.56 1795.00 5.952002 306.79 1831.00 5.972003 311.37 1828.20 5.872004 344.36 2097.64 6.092005 389.38 2567.78 6.592006 422.24 2904.85 6.882007 453.01 3197.01 7.062008 477.03 3472.54 7.28
Contd...
Page 81
Indian Institute of Vegetable Research
66
Years Area (000’ha) Production (000’t) Yield (t/ha)
2009 466.19 3420.76 7.342010 487.92 3661.11 7.502011 519.74 4189.15 8.06ACGR for last ten years (2002-2011) 6.30 10.02 3.50
Bhutan1961 2.30 8.00 3.481962 2.32 8.10 3.491963 2.34 8.20 3.501964 2.36 8.30 3.521965 2.38 8.40 3.531966 2.40 8.50 3.541967 2.42 8.60 3.551968 2.44 8.70 3.571969 2.46 8.80 3.581970 2.48 8.90 3.591971 2.50 9.00 3.601972 2.50 9.10 3.641973 2.53 9.20 3.641974 2.55 9.30 3.651975 2.57 9.40 3.661976 2.58 9.50 3.681977 2.59 9.60 3.711978 2.60 9.70 3.731979 2.61 9.80 3.751980 2.62 9.90 3.781981 3.10 12.20 3.941982 2.90 9.60 3.311983 2.20 6.90 3.141984 1.71 5.39 3.151985 2.10 7.00 3.331986 2.60 8.70 3.351987 2.80 11.20 4.001988 2.63 8.80 3.351989 2.70 8.80 3.261990 3.23 10.14 3.141991 2.83 9.21 3.251992 2.98 10.19 3.421993 3.11 10.28 3.301994 3.12 10.56 3.381995 4.03 11.22 2.79
Contd...
Page 82
Vegetable Statistics
67
Years Area (000’ha) Production (000’t) Yield (t/ha)
1996 4.44 8.96 2.021997 4.35 8.72 2.011998 4.84 8.26 1.711999 5.17 8.30 1.602000 2.14 5.82 2.722001 2.35 5.65 2.402002 2.52 6.59 2.622003 3.55 10.08 2.842004 3.83 14.28 3.732005 6.10 25.58 4.192006 7.93 33.23 4.192007 7.27 26.95 3.712008 6.62 21.31 3.222009 7.23 24.94 3.452010 6.70 20.62 3.082011 7.07 21.48 3.04ACGR for last ten years (2002-2011) 10.91 11.31 0.36
Nepal1961 13.87 90.00 6.491962 15.45 100.00 6.471963 16.95 110.00 6.491964 18.50 120.00 6.491965 20.00 130.00 6.501966 19.25 125.00 6.491967 20.79 135.00 6.491968 24.63 160.00 6.501969 27.70 180.00 6.501970 28.48 185.00 6.501971 30.75 200.00 6.501972 31.00 200.00 6.451973 31.00 200.00 6.451974 38.00 250.00 6.581975 45.00 300.00 6.671976 45.00 300.00 6.671977 59.00 400.00 6.781978 59.00 400.00 6.781979 71.00 500.00 7.041980 72.00 500.00 6.941981 76.00 550.00 7.241982 76.00 550.00 7.24
Contd...
Page 83
Indian Institute of Vegetable Research
68
Years Area (000’ha) Production (000’t) Yield (t/ha)
1983 90.00 672.00 7.471984 95.00 700.00 7.371985 100.00 742.00 7.421986 100.00 774.00 7.741987 110.00 875.34 7.961988 110.00 875.00 7.951989 120.00 922.00 7.681990 125.00 993.56 7.951991 128.12 970.20 7.571992 140.00 1128.00 8.061993 145.00 1197.00 8.261994 150.00 1197.00 7.981995 140.50 1256.85 8.951996 144.37 1327.29 9.191997 146.50 1357.44 9.271998 151.48 1418.61 9.371999 143.01 1351.79 9.452000 153.56 1505.21 9.802001 163.00 1674.84 10.282002 167.49 1762.30 10.522003 173.27 1835.71 10.592004 180.27 1933.35 10.722005 189.04 2109.43 11.162006 198.48 2236.60 11.272007 208.14 2379.83 11.432008 229.70 2607.68 11.352009 236.61 2818.95 11.912010 247.17 3077.09 12.452011 258.28 3320.02 12.85ACGR for last ten years (2002-2011) 5.21 7.48 2.16
Pakistan1961 134.80 849.70 6.301962 133.90 917.80 6.851963 138.00 869.10 6.301964 135.20 922.60 6.821965 123.00 909.10 7.391966 138.70 1055.30 7.611967 129.03 1176.40 9.121968 157.00 1825.60 11.631969 137.16 1548.77 11.29
Contd...
Page 84
Vegetable Statistics
69
Years Area (000’ha) Production (000’t) Yield (t/ha)
1970 124.76 1516.86 12.161971 136.73 1661.50 12.151972 148.60 1834.64 12.351973 146.65 1872.21 12.771974 161.07 1979.59 12.291975 165.83 2028.01 12.231976 153.64 1863.41 12.131977 140.19 1674.95 11.951978 153.98 1817.85 11.811979 170.08 2014.62 11.851980 151.91 1697.79 11.181981 162.35 1859.03 11.451982 162.25 1897.93 11.701983 178.63 2052.31 11.491984 187.63 2218.81 11.831985 188.46 2217.39 11.771986 201.27 2412.70 11.991987 227.76 2814.14 12.361988 238.37 2924.94 12.271989 247.32 3124.56 12.631990 255.81 3236.58 12.651991 256.58 3218.68 12.541992 268.11 3423.93 12.771993 278.64 3592.22 12.891994 291.37 3787.37 13.001995 304.56 4060.75 13.331996 318.10 4370.57 13.741997 327.19 4504.35 13.771998 332.17 4480.70 13.491999 338.87 4581.68 13.522000 356.99 4861.00 13.622001 344.45 4636.27 13.462002 346.80 4542.55 13.102003 351.69 4572.26 13.002004 366.91 4744.40 12.932005 385.29 5031.83 13.062006 421.13 5433.74 12.902007 405.28 5164.93 12.742008 434.76 5481.03 12.612009 414.85 5268.77 12.702010 400.54 5063.58 12.642011 432.14 5456.86 12.63ACGR for last ten years (2002-2011) 2.35 1.89 -0.44
Contd...
Page 85
Indian Institute of Vegetable Research
70
Years Area (000’ha) Production (000’t) Yield (t/ha)
Sri Lanka1961 41.36 161.96 3.921962 38.22 128.03 3.351963 47.64 159.51 3.351964 46.84 182.05 3.891965 56.47 180.08 3.191966 51.44 147.71 2.871967 56.89 146.20 2.571968 57.41 148.34 2.581969 55.63 148.22 2.661970 49.37 177.21 3.591971 52.59 182.84 3.481972 64.48 184.02 2.851973 76.06 201.25 2.651974 85.11 204.75 2.411975 95.25 314.38 3.301976 98.26 309.47 3.151977 91.91 295.60 3.221978 89.23 276.35 3.101979 77.96 403.74 5.181980 80.97 426.87 5.271981 87.39 397.82 4.551982 80.32 343.87 4.281983 85.47 537.73 6.291984 84.83 647.15 7.631985 81.85 571.21 6.981986 87.55 627.02 7.161987 77.07 562.95 7.301988 83.51 675.13 8.081989 77.07 571.04 7.411990 83.41 593.59 7.121991 79.02 562.10 7.111992 82.47 586.39 7.111993 86.72 582.50 6.721994 90.33 592.74 6.561995 90.97 604.48 6.641996 85.69 550.38 6.421997 82.80 550.55 6.651998 77.13 525.70 6.821999 83.98 625.20 7.442000 78.61 579.41 7.37
Contd...
Page 86
Vegetable Statistics
71
Years Area (000’ha) Production (000’t) Yield (t/ha)
2001 73.13 529.14 7.242002 71.96 530.40 7.372003 75.22 526.13 7.002004 69.92 561.72 8.032005 80.78 642.55 7.952006 81.22 674.17 8.302007 78.79 720.58 9.152008 78.42 723.31 9.222009 77.02 732.24 9.512010 75.95 733.40 9.662011 78.15 758.69 9.71ACGR for last ten years (2002-2011) 0.72 4.52 3.78
(Source: www.faostat.fao.org)
Table 3.7:Year-wise area,production and productivity of vegetables in India
Year Area (000’ha) Production (000’t) Productivity (t/ha)
1987-1988 4120 48927 11.91991-1992 5593 58532 10.51992-1993 5045 63806 12.61993-1994 4876 65787 13.51994-1995 5013 67286 13.41995-1996 5335 71594 13.41996-1997 5515 75074 13.61997-1998 5607 72683 131998-1999 5873 87536 14.91999-2000 5991 90823 15.22000-2001 6250 93849 152001-2002 6156 88622 14.42002-2003 6092 84815 13.92003-2004 6082 88334 14.52004-2005 6744 101246 152005-2006 7213 111399 15.42006-2007 7581 114993 15.22007-2008 7848 128449 16.42008-2009 7981 129077 16.22009-2010 7985 133738 16.72010-2011 8495 146555 17.3ACGR 3.72% 5.62% 1.86%
(Source: www.indiastat.com)
Page 87
Indian Institute of Vegetable Research
72
Table 3.8: State-wise area production and productivity of vegetables in India
States/UTs Area (000’ha) Production (000’t) Productivity (t/ha)2009-10 2010-11 2009-10 2010-11 2009-10 2010-11
West Bengal 1302.7 1349.7 22704.3 21907.0 16.8 19.8Uttar Pradesh 1020.1 829.4 18950.1 22436.0 22.0 21.3Bihar 836.0 845.0 13385.7 13907.0 16.6 17.3Andhra Pradesh 331.3 651.2 5267.5 5426.2 16.4 18.2Gujarat 406.8 515.9 6807.1 7255.5 17.8 18.2Karnataka 441.2 466.3 7724.9 7082.2 16.1 19.4Tamil Nadu 263.7 277.3 8693.5 7627.7 28.9 29.9Odisha 694.2 553.8 8467.4 8963.6 12.9 14.1Maharashtra 451.8 611.0 6368.0 6172.6 13.7 12.3Haryana 300.9 346.4 3893.4 3987.0 13.3 13.4Chhattisgarh 315.4 345.8 3041.0 3601.1 11.4 12.3Jharkhand 212.1 259.5 3637.0 3469.2 16.4 15.8Madhya Pradesh 250.7 283.7 4105.8 3112.6 12.4 13.0Punjab 183.3 174.1 3410.3 3522.5 19.2 20.6Kerala 151.6 149.5 3509.4 3518.1 23.2 22.7Assam 255.2 260.1 2916.7 4569.9 17.9 11.2Jammu and Kashmir 69.8 69.7 1023.6 1374.2 19.7 22.4Himachal Pradesh 79.8 80.4 1263.9 1390.7 17.4 18.3Uttarakhand 82.6 85.8 1077.6 997.3 12.1 12.0Rajasthan 131.9 140.3 736.7 1071.9 8.1 6.3Tripura 32.5 36.0 294.7 446.9 13.7 14.8Delhi 36.1 29.8 617.4 617.4 17.1 16.7Meghalaya 44.3 41.8 415.8 415.8 9.4 8.5Manipur 19.9 22.2 174.3 221.8 11.2 10.7Sikkim 28.7 23.9 98.0 147.7 5.1 5.1Mizoram 10.6 17.5 114.4 179.1 16.9 6.6Nagaland 10.4 10.7 78.3 78.3 7.5 7.4Goa 5.7 5.7 57.6 57.8 10.1 10.1Arunachal Pradesh 4.2 4.2 110 38.5 9.1 9.2Andaman and Nicobar Islands 5.2 5.7 30.8 41.5 8.0 6.1Lakshadweep 0.4 0.4 14.1 14.1 31.7 35.3Puducherry 4.5 0.6 81.0 81.0 18.2 14.7Dadra and Nagar Haveli 1.0 1.1 4.5 4.5 4.6 5.0Chandigarh 0.1 0.1 1.7 1.7 17.0 17.0Daman and Diu 0.2 0.0 0.2 0.2 1.2 -India 7984.8 8494.6 106372.5 133738.0 16.7 17.3
(Source: www.indiastat.com)
Page 88
Vegetable Statistics
73
Tabl
e 3.
9: A
rea,
pro
duct
ion
and
prod
uctiv
ity o
f m
ajor
veg
etab
les
in I
ndia [Are
a (A
) 000
’ ha;
Pro
duct
ion
(Pdn
) 000
’t; a
nd P
rodu
ctiv
ity (P
y) t/
ha]
Vege
tabl
es20
01-0
220
02-0
320
03-0
420
04-0
520
05-0
6A
Pdn
PyA
Pdn
PyA
Pdn
PyA
Pdn
PyA
Pdn
Py
Pota
to12
6024
456
19.4
1337
2316
117
.314
8527
926
18.8
1524
2878
818
.915
6929
175
18.6
Tom
ato
458
7462
16.3
479
7617
15.9
503
8126
16.2
505
8825
17.5
546
9820
18.0
Oni
on49
652
5210
.642
542
109.
955
462
6811
.361
477
6112
.670
494
3313
.4Br
inja
l50
283
4716
.650
780
0115
.851
684
7716
.452
786
0116
.356
093
6516
.7Ta
pioc
a23
965
1627
.320
754
2626
.222
059
5027
.024
574
6330
.524
578
5532
.1C
abba
ge25
856
7822
.023
453
9223
.125
555
9521
.928
861
1421
.225
456
3722
.2C
aulif
low
er27
048
9118
.125
544
4417
.526
849
4018
.423
945
1518
.928
953
2318
.4O
kra
347
3325
9.6
329
3245
9.9
353
3631
10.3
357
3512
9.8
392
3975
10.1
Peas
303
2038
6.7
305
2062
6.8
285
1901
6.7
276
1945
7.0
286
2270
7.9
Swee
t Pot
ato
132
1130
8.6
132
1130
8.6
133
1179
8.9
133
1179
8.8
123
1067
8.7
Oth
ers
1891
1952
7-
1882
2012
7-
1737
1917
2-
2036
2254
3-
2196
2513
0-
Tota
l61
5688
622
14.4
6092
8481
513
.963
0993
165
14.5
6744
1012
4615
.071
6410
9050
15.4
Tabl
e co
ntin
ues
Vege
tabl
es20
06-0
720
07-0
820
08-0
920
09-1
020
10-1
1A
Pdn
PyA
Pdn
PyA
Pdn
PyA
Pdn
PyA
Pdn
Py
Pota
to17
4328
600
16.4
1786
3446
319
.318
2834
391
18.8
1835
3657
719
.918
6342
339
22.7
Tom
ato
596
1005
516
.957
210
261
17.9
599
1114
918
.663
412
433
19.6
865
1682
619
.5O
nion
768
1084
714
.180
512
157
15.1
834
1356
516
.375
612
159
16.1
1064
1511
814
.2Br
inja
l56
894
5316
.656
695
9617
.060
010
378
17.3
590
1016
517
.268
011
896
17.5
Tapi
oca
256
8232
32.2
270
9054
33.5
280
9623
34.3
232
8060
34.8
221
8076
36.5
Cab
bage
250
5589
22.4
265
5888
22.2
310
6870
22.1
331
7281
22.0
369
7949
21.5
Cau
liflo
wer
311
5579
18.0
321
5797
18.1
349
6532
18.7
338
6410
19.0
369
6745
18.3
Okr
a39
640
7010
.340
941
9310
.343
245
2810
.545
248
0310
.649
857
8411
.6Pe
as29
824
028.
131
425
608.
234
829
168.
436
530
298.
337
035
179.
5Sw
eet P
otat
o12
310
678.
712
611
469.
112
411
209.
011
910
959.
211
310
479.
3O
ther
s22
7729
117
12.8
2370
3077
413
.022
7528
006
12.3
2332
3172
413
.620
8327
557
13.2
Tota
l75
8411
5012
15.2
7803
1258
8716
.179
8112
9077
16.2
7985
1337
3816
.784
9514
6554
17.3
(Sou
rce:
NH
B, N
atio
nal H
ortic
ultu
re D
atab
ase,
201
1)
Page 89
Indian Institute of Vegetable Research
74
Tabl
e 3.
10: S
tate
and
crop
-wis
e ar
ea a
nd p
rodu
ctio
n of
veg
etab
les
in 2
010-
11
[Are
a (A
) in
000’
ha
and
Prod
uctio
n (P
dn) i
n 00
0’t]
Stat
esBr
inja
lC
abba
geC
aulif
low
erO
kra
Peas
Swee
t Pot
ato
Tapi
oca
Tom
ato
Tota
lA
Pdn
APd
nA
Pdn
APd
nA
Pdn
APd
nA
Pdn
APd
nA
Pdn
Chh
attis
garh
26.7
439.
514
.725
7.7
18.4
306.
025
.224
9.1
10.8
99.7
3.7
36.7
--
42.9
627.
934
5.8
4248
.8D
& N
Hav
eli
0.5
2.2
--
--
--
--
--
--
0.4
1.8
1.1
5.5
Del
hi1.
630
.7-
-5.
194
.81.
622
.70.
811
.1-
--
-1.
631
.029
.849
6.8
Guj
arat
72.0
1236
.328
.255
3.6
21.1
387.
454
.559
2.5
--
--
--
38.8
978.
451
5.9
9379
.5H
arya
na14
.625
5.2
13.8
262.
430
.353
1.9
18.2
145.
312
.779
.0-
--
-27
.239
2.4
346.
446
49.3
Him
acha
l Pra
desh
1.0
25.1
4.5
144.
23.
060
.72.
429
.622
.825
4.2
--
--
9.9
388.
480
.414
74.9
Jam
mu
& K
ashm
ir2.
645
.33.
595
.54.
513
4.8
2.9
47.5
6.8
212.
5-
--
-8.
313
6.6
69.7
1559
.1Jh
arkh
and
16.4
212.
627
.045
1.7
22.2
355.
430
.042
1.7
21.3
329.
1-
--
-22
.340
1.6
259.
541
12.4
Kar
nata
ka14
.235
4.5
9.4
187.
24.
577
.48.
671
.41.
215
.42.
633
.50.
912
.351
.217
56.7
466.
390
56.4
Ker
ala
--
--
--
--
--
0.3
4.9
72.3
2409
.0-
-14
9.5
3392
.7M
.P.
23.4
281.
09.
017
9.5
12.2
195.
910
.160
.322
.825
1.3
5.1
29.7
--
27.8
346.
928
3.7
3698
.6M
ahar
asht
ra35
.049
0.0
18.0
360.
012
.018
0.0
19.0
224.
08.
035
.0-
--
-52
.073
8.0
611.
075
04.0
Man
ipur
--
5.8
74.7
2.4
23.8
--
4.7
46.5
--
--
2.3
28.6
22.2
236.
5M
egha
laya
--
--
--
--
--
5.5
19.2
4.9
26.4
--
41.8
356.
5M
izor
am2.
012
.92.
633
.60.
43.
72.
818
.70.
52.
00.
10.
70.
10.
70.
76.
217
.511
5.6
Nag
alan
d0.
12.
20.
33.
00.
10.
20.
31.
20.
11.
00.
10.
41.
06.
00.
74.
010
.779
.4O
dish
a13
3.2
2204
.841
.211
52.1
45.1
677.
370
.065
1.8
5.9
52.4
44.1
410.
2-
-96
.613
67.2
553.
877
90.1
Pudu
cher
ry0.
21.
5-
--
-0.
10.
6-
--
-0.
24.
00.
00.
10.
68.
8Pu
njab
3.2
68.9
4.4
76.8
8.7
154.
72.
627
.519
.720
0.6
--
--
6.3
154.
517
4.1
3585
.8Ra
jast
han
6.3
30.9
1.0
8.5
8.4
39.2
4.3
12.4
3.6
4.1
1.0
2.8
--
16.9
67.5
140.
388
5.0
Sikk
im0.
31.
61.
26.
90.
73.
91.
17.
22.
08.
6-
--
-0.
98.
123
.912
0.9
Tam
il N
adu
12.4
203.
51.
478
.60.
713
.35.
746
.8-
-0.
812
.413
4.6
5522
.727
.258
0.6
277.
382
79.9
Trip
ura
3.2
43.9
1.9
45.6
1.8
33.8
1.6
12.5
--
--
--
1.4
30.2
36.0
532.
3U
.P.
3.0
92.1
1.6
49.5
9.3
188.
511
.112
8.8
159.
215
32.4
16.8
206.
6-
-6.
724
8.6
829.
417
679.
4U
ttrak
hand
2.2
25.9
5.6
70.5
2.6
34.0
3.3
27.1
11.2
86.9
--
--
8.8
97.1
85.8
1030
.9W
est B
enga
l15
8.4
2870
.675
.320
87.8
70.0
1777
.274
.086
2.1
21.4
129.
422
.923
5.7
--
54.1
1063
.713
49.7
2672
5.5
Tota
l68
0.0
1189
5.8
368.
879
48.9
368.
767
44.9
498.
357
84.0
369.
835
17.4
113.
210
46.6
221.
480
76.0
864.
916
826.
484
94.5
1465
54.5
(Sou
rce:
NH
B, N
atio
nal H
ortic
ultu
re D
atab
ase
2011
)
Page 90
Vegetable Statistics
75
Table 3.11: Different profitable crop rotations for irrigated areas of Indo-Gangetic plains
Cropping systems Crop circle Yield Sowing time Harvest time Estimated(t / ha) income (`̀̀̀̀/ha)
(at prices inMarch 2010)
2 crops Rice 5-6 June / July October 50000-60000Wheat 4.5 to 5 November AprilPaddy 5-6 June / July October 70000-80000Barsim 60-70 October MayBasmati rice 4-5 June / July November 60000-65000Sunflower 2 to 2.5 February MayMaize, 4 to 4.5 June October 40000-50000Wheat 5 to 5.5 November AprilTur 1.8 to 2 June Nov.-Dec. 45000-50000Wheat 5 to 5.5 December AprilCotton 2 to 2.5 May Nov.-Dec. 40000-50000Wheat 4.5 to 5 December AprilPeanuts, 1.8 to 2 July October 40000-50000Wheat 5 to 5.5 November AprilPaddy 5-6 June / July October 40000-50000Gam 1.8 to 2 October AprilSoybean 1.8 to 2 July November 40000-50000Wheat 5 to 5.5 November AprilSoybeans 1.8 to 2 July November 45000-55000Potatoes 20-25 November February
3 crops Green manure - April June 55000-65000Rice 5.5 to 6 June / July October Wheat 4.5 to 5 October AprilLobia/Millet/Sorghum 2 to 2.5 April June 65000-70000Maize 4 to 4.5 July OctoberWheat 5 to 5.5 November April 55000-65000Green manure - April JuneMaize 4 to 4.5 July OctoberWheat 5 to 5.5 November AprilCorn, 4 to 4.5 Mid June September 80000-90000Potatoes, 20-25 September end DecemberWheat 3.5 to 4 December AprilCorn, 4 to 4.5 July October 90000-95000Potato, 25-30 October Jan. / Feb.Bean 1-1.2 March JuneCorn, 4 to 4.5 July OctoberWheat, 4.5-5 November AprilMoong 0.8 to 1.0 April June 50000-60000Corn, 4 to 4.5 June September 85000-95000Potato, 25-30 October JanuarySunflower 2 to 2.2 February MayMaize, 4 to 4.5 June September 65000-70000Rapeseed / Mustard, 0.8 to 1.2 Sept. /Oct JanuarySunflower 2 to 2.2 February May
Contd...
Page 91
Indian Institute of Vegetable Research
76
Cropping systems Crop circle Yield Sowing time Harvest time Estimated(t / ha) income (`̀̀̀̀/ha)
(at prices inMarch 2010)
Maize 4 to 4.5 June September 60000-65000Mustard 2 to 2.2 October MarchMoong / Urd 1-1.2 April June
Corn, 4-4.5 June September 90000-100000Potatoes, 25-30 October DecemberOnions 20-25 January April
Rice 5-6 June / July September 90000-95000Potatoes, 20-25 September last DecemberWheat 3.5 to 4 December April
Paddy 5-6 July October 95000-100000Potato 20-22 October Jan. / Feb.Bean 1-1.2 March June
Paddy 5-6 June / July October 100000-110000Potato 20-25 October JanuarySunflower 2 to 2.2 February April
Paddy 5-6 June Mid-Sept. 70000-80000Rapeseed / Mustard, 0.8 to 1.2 Sept. / Oct. JanuarySunflower 1.8 to 2 February May
Paddy, 5-6 June / July October 60000-70000Wheat, 4-4.5 November AprilMoong 0.8 to 1.0 April June
Paddy 5-6 Junjulai October 60000-70000Mustard 1.8 to 2 October MarchMoong / Urd 1-1.2 April June
4 crops Maize, 4-4.5 Mid-June September 110000Potatoes, 20-25 September DecemberWheat, 3.5 to 4 December AprilMoong 0.6 to 0.8 April June
Maize 4-4.5 Mid-June September 95000-100000Rapeseed 0.6-0.8 September DecemberWheat 3.5 to 4 December AprilMoong 0.6 to 0.8 April June
Paddy 5-6 Mid-June September 110000-112000Green Peas 3-4 October DecemberWheat 3.5 to 4 December AprilMoong 0.6 to 0.8 April June
Maize 4-4.5 Mid-June SeptemberRadish /turnip 18-22 September NovemberWheat 3.5 to 4 November AprilMoong 0.6 to 0.8 April June 80000-850000
(Source: www.krishiseva.com)
Page 92
Vegetable Statistics
77
Table 3.12: Vegetable based profitable crop rotations
Area Crop circle Yield Estimated Estimated Estimated Sales Price(q/acre) cost income Benefits (`̀̀̀̀ / kg)
(`̀̀̀̀ / acre) (`̀̀̀̀ / acre) (`̀̀̀̀ / acre)
Northern Plains Early cabbage (July - October) 50 20000 100000 80000 20Pea (October –January) 35 8000 35000 27000 10Tomato (January - June) 100 25000 100000 75000 10Bhindi (June - September) 50 15000 40000 25000 8Carrot (October- December) 100 12000 50000 38000 5Cauliflower (Dec.- Marh) 100 15000 30000 15000 3Radish (April - May) 70 6000 21000 15000 3Cucumber (July-September) 50 12000 50000 38000 10Potato (October-December) 100 15000 60000 45000 6Onion (January - June) 110 25000 110000 85000 10
North East Cauliflower (June - August) 50 16000 75000 59000 15Plains Pea (September - November) 40 10000 40000 30000 10
Radish (December-January) 70 8000 21000 13000 3Shimla Mirch (January - May) 70 25000 105000 80000 15Green Mirch (June–September) 50 20000 50000 30000 10Broccoli (October to December) 50 12000 75000 63000 15Radish (January - February) 60 6000 18000 12000 3Potato (February - May) 100 20000 100000 80000 10
North West French Bean (July - August) 45 15000 45000 30000 10Plains Cabbage (Sept.– Oct.) 70 10000 35000 25000 5
Pea (November to April) 40 10000 60000 50000 15Shimla Mirch (April - June) 60 25000 120000 95000 20Tomato (June - September) 100 25000 100000 75000 10Knol-rabi (Sept.- November) 90 15000 45000 30000 5Coriander (Dec.- February) 25 7000 50000 43000 20Potato (March - May) 100 20000 100000 80000 10
Eastern Plains Parval (February - June) 50 15000 40000 25000 8Eggplant (July - October) 120 18000 60000 42000 5Cauliflower (Nov.to January) 100 15000 40000 25000 4Cowpea (July - October) 50 10000 40000 30000 8Tomato (November - February) 110 25000 88000 63000 8Bitter gourd (February - April) 80 12000 64000 52000 8Amaranth (May - June) 30 7000 15000 8000 5
Southern Region Tomato (June - October) 125 20000 125000 95000 10French Bean (Nov. - January 50 10000 50000 40000 10Okra (February - May) 60 12000 60000 48000 10Cowpea (June - August) 65 10000 52000 42000 8Tomato (Sept.- December) 120 20000 120000 100000 10Watermelon (Dec - May) 100 15000 100000 85000 10
(Source: www.krishiseva.com)
Page 93
Indian Institute of Vegetable Research
78
Table 3.13: Number of vegetable varieties released during 1951-2009
Crops 1951-1960 1961-1970 1971-1980 1981-1990 1991-2000 2001-2009 Unknown Total
Potato 6 11 5 4 9 15 - 50
Cassava - - 5 1 5 2 - 13
Sweet potato - - 2 3 8 17 - 30
Greater yam - - - 2 1 3 - 6
White yam - - - 2 1 - - 3
Lesser yam - - - 1 1 1 - 3
Elephant foot yam - - - - 3 4 - 7
Colocasia (Taro) - - - 2 2 9 - 13
Colocasia (Bunda) - - - - - 3 - 3
Chinese potato - - - - 1 - - 1
Xanthosoma - - - - 1 - - 1
Coleus - - - - 1 - - 1
Yam bean - - - - 1 - - 1
Tomato - - 14 11 12 17 - 54
Brinjal - - 9 16 21 13 - 59
Chillies - - 3 12 7 15 - 37
Sweet pepper - - 3 3 2 1 - 9
Cauliflower - - 7 3 3 3 - 16
Cabbage - - 5 1 2 - - 8
Broccoli - - - - - 3 - 3
Knoll-kohl - - 3 - - 1 - 3
Bitter gourd - - 2 4 3 3 - 12
Pumpkin - - 1 3 - 6 - 10
Squash - - 1 2 - - - 3
Bottle gourd - - 1 4 2 11 - 18
Musk melon - - 5 5 5 5 - 20
Water melon - - 4 2 2 5 - 13
Ash gourd - - - 1 - 1 - 02
Cucumber - - 2 2 - 6 - 10
Long melon - - - - 1 1 1 02
Contd...
Page 94
Vegetable Statistics
79
Crops 1951-1960 1961-1970 1971-1980 1981-1990 1991-2000 2001-2009 Unknown Total
Round melon - - - - - - - 1
Pointed gourd - - - - 2 3 - 5
Ivy gourd - - - - - 5 - 5
Ridge gourd - - 1 2 - 5 - 8
Sponge gourd - - 1 1 1 5 - 8
Round gourd - - 1 1 - 1 - 3
Snake gourd - - 1 2 1 2 - 6
Snap melon - - - - 2 1 - 3
Onion - - 6 6 8 8 23 51
Garlic - - - 4 3 2 14 23
Carrot - - 1 2 2 1 6 12
French bean - - - 4 3 4 6 17
Cowpea - - - 2 3 5 2 12
Dolichos bean - - - 2 1 2 2 7
Garden peas - - 4 3 3 3 9 22
Cluster bean - - - - 1 - 1 2
Sword bean - - - - - - 1 1
Kanchri (melon) - - - - - 2 - 2
Kakri (cucumber) - - - - - 2 - 2
Spin gourd - - - - - 1 - 1
Teasel gourd - - - - - 1 - 1
Total 6 11 86 113 124 198 65 603
(Source: Agricultural Research Data Book, 2011, IASRI)
Table 3.14: Vegetable seed production
Seeds 2009-10 2010-11Purchase Sale Purchase Sale
Breeder’s seed (Qtls) 56 63 270 456
Foundation seed (Qtls) 143 82 624 393
Certified seed (Qtls) 4973 4303 24035 22155
Sale of certified quality seeds (` lakhs) 994.68 2893.28
(Source: Annual Report, 2010-11, National Seeds Corporation, GOI)
Page 95
Indian Institute of Vegetable Research
80
Table 3.15: Post-harvest losses in vegetables at different stages
(Quintals)
Vegetables Total Stages of losses Totalproduction Harvesting Grading & Handling & Marketing losses
packing transportation
Pea 20.22 0.98 0.21 0.75 0.09 2.03(4.87) (1.05) (3.70) (0.44) (10.06)
Tomato 872.53 61.14 13.87 56.06 1.21 132.27(7.01) (1.59) (6.42) (0.14) (15.16)
Potato 122.86 4.38 1.69 - 2.46 8.53(3.56) (1.38) (2.00) (6.94)
French bean 20.66 0.80 0.16 1.22 0.11 2.29(3.86) (0.80) (5.89) (0.51) (11.06)
Cauliflower 17.18 0.24 0.49 0.42 0.28 1.42(1.38) (2.82) (2.46) (1.60) (8.27)
Cabbage 40.62 0.68 0.59 0.40 0.50 2.17(1.68) (1.46) (0.98) (1.22) (5.33)
Onion 71.35 2.32 1.08 - 0.86 4.25(3.25) (1.51) (1.20) (5.95)
Chilly 5.90 0.19 0.10 0.27 0.03 0.58(3.17) (1.63) (4.56) (0.53) (9.89)
Radish 13.50 0.35 0.18 - - 0.53(2.59) (1.30) (3.89)
Capsicum 2.25 0.04 0.02 0.04 - 0.10(1.93) (0.89) (1.78) (4.59)
Okra 42.41 1.63 1.60 0.40 - 3.62(3.83) (3.76) (0.94) (8.54)
Brinjal 152.00 6.84 9.12 0.76 - 16.72(4.50) (6.00) (0.50) (11.00)
Note: Figures within the parentheses show percentage loss to total production(Source: Sharma, G and S. P. Singh. 2011. Economic analysis of post-harvest losses in marketing ofvegetablesinUttarakhand. Agricultural Economic Research Review24: 309-315)
Table 3.16: Post-harvest losses in vegetables at grower, wholesaler and retailer levels
Vegetable Losses at different levels (%)Grower Wholesaler Retailers Total
Tomato 15.16 - 8.03 23.19Potato 6.94 5.00 4.94 16.88Onion 5.95 3.50 4.32 13.77French bean 11.06 - 5.67 16.73Cauliflower 8.27 - 5.16 13.43Cabbage 5.33 - 3.32 8.65Pea 10.06 - 6.31 16.37Chilly 9.89 - 6.86 16.75Radish 3.89 - 2.63 6.52Capsicum 4.59 - 5.84 10.43Okra 8.54 - 7.09 15.63Brinjal 11.00 - 5.81 16.81
(Source: Sharma, G and S. P. Singh, 2011. Economic analysis of post-harvest losses in marketing ofvegetables inUttarakhand. Agricultural Economic Research Review24: 309-315.)
Page 96
Vegetable Statistics
81
Tabl
e 3.
17: M
onth
ly w
hole
sale
pri
ce i
ndex
(W
PI)
of v
eget
able
s in
Ind
ia {(
Base
Yea
r: 19
81-8
2; 1
993-
94; 2
004-
05=1
00)
Year
Janu
ary
Febr
uary
Mar
chA
pril
May
June
July
Aug
ust
Sept
embe
rO
ctob
erN
ovem
ber
Dec
embe
r
1981
-82=
100
1990
194.
622
6.9
241.
424
824
8.7
246.
526
4.6
268.
625
2.3
1991
228.
420
3.2
192.
421
8.8
238.
226
1.6
286.
333
5.4
328.
431
5.3
316.
424
1.2
1992
190.
618
3.7
203.
420
9.1
233.
326
729
8.4
302.
629
330
5.3
298.
525
5.5
1993
373.
439
2.7
380.
634
3.7
1993
-94=
100
1994
288.
325
3.9
251.
886
.485
.611
6.1
124.
513
6.4
130.
513
1.9
126.
610
1.7
1995
98.2
91.6
95.2
101.
811
2.8
134.
814
7.4
156.
115
7.1
167.
916
5.3
121.
819
9692
.392
.796
.513
0.7
139.
215
1.5
152.
317
1.1
161
162.
416
516
5.2
1997
137.
713
812
4.6
124
9810
5.7
132
135.
614
8.2
185.
815
5.9
143.
519
9816
7.9
138.
613
8.4
170.
118
321
9.5
232.
722
323
2.4
291
301.
722
9.4
1999
131.
298
.610
3.7
143.
313
614
2.3
146.
216
5.7
141.
616
6.3
167.
713
2.9
2000
114.
611
6.6
132.
313
7.3
128.
114
1.6
142.
814
7.8
147.
217
7.7
166.
913
9.3
2001
118.
611
3.8
112.
314
0.8
158
178.
320
3.7
210.
917
9.5
192.
420
5.2
184
2002
142.
812
813
6.9
157.
215
4.3
176.
920
2.5
213.
519
6.8
200.
818
4.6
121.
120
0311
211
6.6
118.
314
5.3
140.
316
7.9
183.
816
8.5
171.
320
4.1
187.
415
3.6
2004
148.
213
0.7
120.
516
0.6
173
189.
218
5.9
207.
418
7.5
214.
819
6.8
144.
820
0513
212
5.7
135.
717
5.7
182.
118
9.3
220.
820
8.9
208.
922
3.8
233.
719
2.9
2006
173.
514
3.2
142.
317
217
7.4
217.
321
7.7
209.
721
8.4
227.
421
6.4
191.
420
0718
3.1
168.
317
821
4.6
222.
323
6.2
273.
226
8.7
259
231.
321
8.1
198.
720
0818
6.8
181.
620
322
5.6
223.
524
0.5
259.
824
5.8
252.
126
0.8
271.
221
3.9
2009
215.
519
3.5
192.
326
2.6
270.
529
9.5
339.
330
3.1
292.
327
9.2
322.
128
6.6
2010
247.
521
2.6
197.
325
9.4
271.
430
4.5
293.
826
2.1
2004
-05=
100
2005
93.9
99.6
108.
512
7.1
123
128.
114
1.9
147.
811
1.7
2006
104.
492
.286
.386
.592
.310
911
1.6
124.
812
913
5.8
130
117.
320
0711
2.3
108.
311
4.5
124.
413
0.8
140.
316
2.4
169.
315
915
3.3
144.
512
2.6
2008
108.
910
9.4
119.
911
4.4
118.
612
9.9
139.
814
5.1
152.
517
3.6
188.
315
3.8
2009
149.
512
111
6.2
133.
214
0.4
156
178.
518
4.5
170.
717
9.3
191.
818
020
1015
6.8
138.
413
214
3.9
150.
917
5.1
172
176.
218
9.5
193.
918
9.2
240.
520
1126
1.1
158.
314
3.3
146.
814
9.9
163.
818
5.4
199.
421
6.8
224.
320
9.4
157.
420
1214
6.9
161
190
237.
622
4.7
243.
823
0.1
(Sou
rce:
ww
w.in
dias
tat.c
om)
Page 97
Indian Institute of Vegetable Research
82
Table 3.18: Monthly percapita consumption of vegetables & its products in India (July 2009-June 2010)
Item Description Rural India Urban IndiaQty (Kg) Value (`̀̀̀̀) Qty (Kg) Value (`̀̀̀̀)
Potato 1.666 18.4 1.368 17.29Onion 0.741 10.89 0.854 13.34Radish 0.186 1.43 0.176 1.79Carrot 0.073 1.08 0.153 2.77Turnip 0.006 0.07 0.008 0.11Beet 0.013 0.2 0.036 0.66Sweet Potato 0.01 0.13 0.009 0.15Arum 0.063 0.86 0.046 0.84Pumpkin 0.25 2.21 0.166 1.89Gourd 0.302 2.95 0.284 3.7Bitter Gourd 0.08 1.43 0.117 2.56Cucumber 0.136 1.57 0.208 2.93Parwal, Patal 0.097 1.42 0.087 1.68Jhinga, Torai 0.209 2.48 0.148 2.44Snake Gourd 0.022 0.29 0.036 0.58Papaya Green 0.085 0.7 0.039 0.43Cauliflower 0.302 3.53 0.362 5.92Cabbage 0.275 2.9 0.337 4.6Brinjal 0.518 6.42 0.441 6.86Lady’s Finger 0.202 3.13 0.282 5.86Other Leafy Vegetables 0.605 5.84 0.497 6.76French Beans, Barbati 0.073 1.2 0.092 2.07Tomato 0.537 7.47 0.757 11.66Peas 0.05 0.88 0.09 2.02Chillis Green 0.145 4.09 0.148 4.42Capsicum 0.005 0.11 0.021 0.65Plantain Green 0.022 0.3 0.02 0.34Jackfruit Green 0.024 0.23 0.015 0.24Lemon (No.) 1.27 1.19 1.72 3Other Vegetables 0.284 3.94 0.27 4.9Vegetables Sub Total - 87.33 - 112.44Pickles (gm) 8.08 0.68 14.3 1.52Sauce (gm) 0.34 0.04 4.68 0.56Jam, Jelly (gm) 0.54 0.06 3 0.45Other Processed Food - 7.58 - 17.48Total Food - 600.36 - 880.83
(Source: www.indiastat.com)
Page 98
Vegetable Statistics
83
Table 3.19: Food and nutrient supply from vegetables in India
Years Food supply Food supply Food supply Food supply Protein supply Fat supplyquantity quantity quantity (kcal/capita/ quantity quantity
(million t) (kg/capita/year) (g/capita/day) day) (g/capita/day) (g/capita/day)
1961 16.925 37.00 101.00 25.00 1.40 0.201962 17.664 37.90 104.00 26.00 1.50 0.201963 18.395 38.60 106.00 26.00 1.50 0.201964 19.054 39.20 107.00 26.00 1.50 0.201965 19.749 39.80 109.00 27.00 1.50 0.201966 20.590 40.60 111.00 27.00 1.60 0.201967 21.273 41.10 112.00 28.00 1.60 0.201968 22.022 41.60 114.00 28.00 1.60 0.201969 22.938 42.40 116.00 28.00 1.60 0.201970 23.887 43.10 118.00 29.00 1.70 0.201971 24.873 43.90 120.00 29.00 1.70 0.201972 25.929 44.70 123.00 30.00 1.70 0.201973 26.792 45.10 124.00 30.00 1.70 0.201974 27.723 45.60 125.00 30.00 1.80 0.301975 28.571 45.90 126.00 31.00 1.80 0.301976 29.470 46.30 127.00 31.00 1.80 0.301977 30.430 46.70 128.00 31.00 1.80 0.301978 31.430 47.10 129.00 31.00 1.80 0.301979 32.303 47.20 129.00 32.00 1.80 0.301980 33.240 47.50 130.00 32.00 1.80 0.301981 34.554 48.20 132.00 32.00 1.80 0.301982 35.939 49.00 134.00 32.00 1.90 0.301983 37.464 49.90 137.00 33.00 1.90 0.301984 38.727 50.50 138.00 34.00 1.90 0.301985 39.633 50.50 138.00 33.00 1.90 0.301986 40.922 51.00 140.00 33.00 1.90 0.301987 42.515 51.90 142.00 34.00 2.00 0.301988 43.470 51.90 142.00 34.00 2.00 0.301989 44.280 51.70 142.00 34.00 1.90 0.301990 45.238 51.80 142.00 34.00 1.90 0.301991 46.056 51.60 141.00 34.00 2.00 0.301992 46.711 51.30 141.00 34.00 2.00 0.301993 49.037 52.80 145.00 35.00 2.00 0.301994 50.158 53.00 145.00 35.00 2.00 0.301995 52.312 54.20 149.00 36.00 2.00 0.301996 52.643 53.60 147.00 35.00 2.00 0.301997 49.661 49.60 136.00 32.00 1.80 0.301998 59.528 58.40 160.00 39.00 2.20 0.301999 65.962 63.70 174.00 42.00 2.40 0.302000 67.007 63.60 174.00 42.00 2.40 0.302001 72.827 68.00 186.00 45.00 2.60 0.402002 63.818 58.60 161.00 38.00 2.20 0.302003 72.529 65.60 180.00 43.00 2.40 0.402004 60.496 53.90 148.00 36.00 2.00 0.302005 65.546 57.50 158.00 39.00 2.10 0.302006 74.756 64.60 177.00 44.00 2.40 0.402007 80.657 68.70 188.00 47.00 2.50 0.402008 83.416 70.00 192.00 48.00 2.60 0.402009 82.718 68.50 188.00 46.00 2.50 0.40
(Source: www.faostat.fao.org)
Page 99
Indian Institute of Vegetable Research
84
Table 3.20: Commodity balance sheet of vegetables in India(Tonnes)
Years Total Import Food supply Export, processing and wastageproduction quantity Food supply % of total Export Processing Wastage % of total
quantity production quantity quantity quantity production
1961 18468500 111 16925419 91.6 111745 0 1431450 8.41962 19280200 75 17663770 91.6 121803 0 1494701 8.41963 20050300 56 18395144 91.7 103760 0 1551451 8.31964 20765500 48 19054280 91.8 108718 0 1602550 8.21965 21511000 232 19748547 91.8 103027 1 1659652 8.21966 22400600 143 20589796 91.9 90930 0 1720011 8.11967 23139050 291 21272506 91.9 110863 0 1755972 8.11968 23930200 104 22022494 92.0 102307 0 1805501 81969 24947800 201 22938422 91.9 134069 1 1875506 8.11970 25985900 117 23887361 91.9 157142 1 1941504 8.11971 26982000 115 24872930 92.2 98680 0 2010500 7.81972 28063400 244 25929493 92.4 47645 0 2086500 7.61973 29006500 178 26792287 92.4 63386 1 2151003 7.61974 30022200 115 27722899 92.3 79534 0 2219880 7.71975 30974900 136 28571408 92.2 119589 0 2284031 7.81976 32010800 109 29470328 92.1 180495 1 2362287 7.91977 32953900 70 30430099 92.3 110321 1 2413670 7.71978 33991050 56 31430131 92.5 78487 1 2482862 7.51979 34942600 85 32303110 92.4 126823 1 2512770 7.61980 35975100 89 33240095 92.4 154667 1 2580517 7.61981 37441100 23 34553657 92.3 220747 0 2666881 7.71982 38970400 622 35938832 92.2 249554 1 2782631 7.81983 40541000 17702 37463625 92.4 209119 1 2886010 7.61984 41994400 179 38727087 92.2 303250 1 2964385 7.81985 42961000 90 39633162 92.3 295842 1 3032121 7.71986 44537000 318 40921623 91.9 455646 1 3160051 8.11987 45916076 20528 42515075 92.6 173907 1 3246519 7.41988 47007890 21547 43470028 92.5 280087 0 3278501 7.51989 48009361 2581 44280233 92.2 376539 0 3355226 7.81990 48944659 10019 45238126 92.4 298061 0 3418399 7.61991 49967236 1984 46056089 92.2 443134 0 3470030 7.81992 50470471 2684 46711251 92.6 347549 0 3414370 7.41993 52958500 11790 49036850 92.6 429967 2 3503475 7.41994 54182905 766 50158077 92.6 487113 0 3538511 7.41995 56267800 179 52311933 93.0 494263 0 3461778 71996 56700869 944 52643068 92.8 560030 1 3498713 7.21997 53344563 4786 49661029 93.1 496383 1 3192120 6.91998 63818194 21344 59528219 93.3 365181 0 3946155 6.71999 70978662 60572 65962089 92.9 444790 0 4632431 7.12000 72283100 13016 67006778 92.7 575560 0 4713648 7.32001 78890142 77644 72826698 92.3 733274 0 5407829 7.72002 69173618 69651 63817896 92.3 948910 0 4476631 7.72003 79048764 36355 72529004 91.8 1222008 2 5335290 8.22004 65585737 29902 60495903 92.2 1212481 0 3908646 7.82005 71450657 25271 65546343 91.7 1564397 0 4367063 8.32006 81898241 21113 74755956 91.3 2038362 1 5125449 8.72007 87979231 35973 80656704 91.7 1858120 1 5502083 8.32008 91729122 23147 83415733 90.9 2548566 1 5789478 9.12009 90791033 22918 82717668 91.1 2519360 1 5580933 8.9
(Source: www.faostat.fao.org )
Page 100
Vegetable Statistics
85
Table 3.21: India’s import of vegetable seeds (2007-08)(Quantity in t; value in lakh `)
Peas seeds Radish seeds Tomato seedsCountry Qty Value Country Qty Value Country Qty Value
New Zealand 90 37.77 New Zealand 141.66 169.89 China 4.99 351.12U S A 10 7.61 Italy 72.88 138.6 Hong Kong 0.49 26.11Netherland 5 6.21 Japan 14.07 114.18 U S A 0.19 24.82Total 105 51.59 Korea 23.43 47.45 Thailand 0.2 15.06
China 0.51 3.6 Japan 0.06 2.74France 0.08 0.2 Korea 0.02 2.67Total 252.63 473.92 Italy 0.02 1.74
France 0.05 0.4Total 6.02 424.66
Cabbage seeds Cauliflower seeds Other vegetable seedsCountry Qty Value Country Qty Value Country Qty Value
U S A 42.17 1055.0 Chile 7.83 670.56 Thailand 264.74 2,271.2Chile 9.46 522.02 France 4.21 420.57 Taiwan 10.9 1,326.4Italy 12.82 501.17 Japan 5.91 312.73 Netherland 93.7 978.06Korea 10.31 393.01 USA 4.06 298.09 China 36.3 767.82Netherland 6.14 274.59 China 8.65 260.61 USA 175.56 754.87Japan 4.38 190.73 Denmark 1.35 100.91 Japan 80.22 687.94Australia 4.57 165.57 Netherland 2.33 96.79 Italy 212.29 438.96New Zealand 9.2 118.28 Taiwan 0.9 48.23 Korea 10.48 380.8China 2.14 59.54 Italy 1.48 46.52 France 30.78 376.8France 0.82 32.87 New Zealand 0.84 7.09 Australia 23.72 107.95Korea 0.35 7.9 Korea 0.02 1.42 Indonesia 1.65 76.73Indonesia 0.15 5.93 Total 37.62 2265.13 Chile 4.46 73.85Thailand 0.1 1.43 NewZealand 41.92 40.1Total 104.97 3343.5 Mexico 0.06 22.89
Costa Rica 1.5 19.34Denmark 9.6 17.03Afghanistan 13.62 14.38South Africa 0.9 10.88Germany 2 8.4Vietnam 0.57 7.43Philippines 0.38 4.92Israel 0.2 3.25Zimbabwe 1 2.63Hong Kong 0.01 0.05Total 1,019.14 8,470.9
(Source: www.agriexchange.apeda.gov.in)
Page 101
Indian Institute of Vegetable Research
86
Table 3.22: Export of radish seeds from India (Quantity: Kg, Value: `)
Country 2008-09 2009-10 2010-11Qty Value Qty Value Qty Value
Pakistan 30283 3081568 23171 1427838 48593 7161519Saudi Arabia 0 0 2540 597502 3600 1497370Korea 0 0 0 0 26150 1204141Sudan 0 0 0 0 5000 660768Oman 4060 781198 8000 1175920 3275 527493Sri lanka 150 56400 0 0 500 236808Bangladesh 1020 337641 30 10859 15000 233800Jordan 2000 99769 0 0 2000 149478Nepal 0 0 155 18628 620 121700UAE 0 0 0 0 400 25831Others 1213 301225 5157 441134 20 9303Total 38726 4657801 39053 3671881 105158 11828211
(Source: www.agriexchange.apeda.gov.in)
Table 3.23: Export ofother vegetable seeds from India(Quantity: Tonnes, Value: Lakhs `)
Country 2008-09 2009-10 2010-11Qty Value Qty Value Qty Value
Pakistan 1976 1447 2635 2761 4394 4511Bangladesh 94 177 41 164 247 377Nepal 102 85 100 114 251 307USA 24 373 45 304 17 197Oman 18 117 17 134 24 192Italy 45 162 48 96 146 181Sri lanka 15 68 81 206 56 152Japan 94 759 54 517 47 138France 14 80 12 93 14 134Saudi Arabia 160 144 43 100 127 131Others 198 1792 469 1592 377 1109Total 2740 5204 3545 6081 5700 7429
(Source: www.agriexchange.apeda.gov.in)
Table 3.24: Export specifications of vegetables
Commodity Parameters for export
Okra 3-5 inch length, green tender, packing 5 KgTondali 1-2 inch length green tender, packing 5 KgBottle gourd 12 inch length, greenish tender, straight, packing 5 KgPeas 5-6 inch length, green tender, straight, packing 5 KgGawar 4-5 inch length, not over matured, packing 5 KgSuran Cleaned, weighing around 5-10 KgGreen chilli 3-4 inch length, green, packing 5 KgDrum sticks 24 inch length, straight, thick, packing 5 KgLime 20-25mm, green, packing 5 Kg gunny bags, 20 Kg wooden boxesMode of transport By air or by sea
(Source: NHB, National Horticulture Database 2011)
Page 102
Vegetable Statistics
87
Tabl
e 3.
25: S
tate
/Por
t-wis
e ex
port
s of
fre
sh a
nd p
roce
ssed
veg
etab
les
(201
0-11
)(Q
uant
ity in
t; v
alue
in la
kh `
)
Stat
e/ P
ort
Fres
h ve
geta
bles
Dri
ed &
pre
serv
edFr
esh
onio
nsO
ther
pro
cess
edFr
uits
&ve
geta
bles
frui
ts &
vege
tabl
esve
geta
bles
see
dsQ
uant
ityVa
lue
Qua
ntity
Valu
eQ
uant
ityVa
lue
Qua
ntity
Valu
eQ
uant
ityVa
lue
And
hra
Prad
esh
Hyd
erab
ad A
irpo
rt36
2.22
153.
1512
.26
11.3
90.
040.
031.
831.
4779
.49
757.
54IC
D H
yder
abad
1835
.02
342.
5417
44.4
844
6.56
482.
8051
8.18
Vis
akha
patn
am S
ea19
.00
10.4
3
Ass
amK
arim
ganj
Ste
amer
ghat
18.2
72.
58
Biha
rBa
irag
nia
69.4
74.
490.
450.
420.
520.
31Bh
itham
ore
8969
.69
428.
2125
3.20
52.7
310
47.6
215
4.31
12.1
08.
62Jo
gban
i14
40.3
912
8.44
757.
4216
8.79
981.
2611
9.67
163.
3391
.77
17.5
05.
54Pa
tna
Cus
tom
s A
irpo
rt16
9.00
7.57
58.0
03.
000.
200.
08Ra
xaul
Lan
d12
22.6
411
1.67
893.
3511
3.06
1623
.93
809.
7649
.99
59.0
8
Goa
Dab
olim
129.
0034
.24
Mar
mag
oa S
ea20
6.40
13.3
410
69.3
729
1.03
126.
2836
.35
Guj
arat
Ahm
edab
ad A
IR29
.70
28.2
437
.65
126.
7510
4.92
224.
040.
695.
38C
argo
Com
plex
ICD
Sab
arm
ati
106.
0455
.60
110.
3281
.15
17.2
71.
6718
46.2
095
3.10
3.51
7.46
Kan
dla
Sea
8.00
6.97
53.9
45.
2749
.02
12.5
9M
undr
a26
35.3
066
3.21
4870
.40
3911
.21
2042
.50
199.
1153
91.0
128
97.5
515
0.14
64.4
3O
kha
229.
8846
.17
Pipa
vab
(Vic
yor)
5780
.59
1412
.12
2291
0.52
1833
9.07
2212
.14
386.
6557
60.4
736
37.9
424
.00
6.87
Porb
anda
r27
5.00
36.8
835
73.2
437
8.96
Vadi
nar
46.1
735
.27
Har
yana
ICD
Far
idab
ad8.
1060
.54
ICD
Gar
hiha
rsar
u8.
054.
40C
ontd
...
Page 103
Indian Institute of Vegetable Research
88
Stat
e/ P
ort
Fres
h ve
geta
bles
Dri
ed &
pre
serv
edFr
esh
onio
nsO
ther
pro
cess
edFr
uits
&ve
geta
bles
frui
ts &
vege
tabl
esve
geta
bles
see
dsQ
uant
ityVa
lue
Qua
ntity
Valu
eQ
uant
ityVa
lue
Qua
ntity
Valu
eQ
uant
ityVa
lue
Del
hiC
FS P
atpa
rgan
j5.
872.
0413
.00
6.98
5.06
0.62
82.6
947
.63
35.2
310
1.75
Del
hi A
IR19
.22
7.71
35.3
520
00.1
463
.50
83.1
413
6.40
481.
87D
elhi
(IC
D)
10.7
03.
696.
692.
3020
44.3
819
18.3
759
.26
71.9
8
Punj
abA
mri
tsar
Rly
. Stn
.30
0.00
61.0
210
00.3
412
4.58
2082
.68
616.
0256
34.0
860
09.7
2A
ttari
road
, Am
rits
ar50
27.4
264
3.65
3578
7.95
4396
.84
ICD
Lud
hian
a18
.59
8.94
1455
2.51
7719
.17
ICD
/CFS
Jala
ndha
r10
5.84
794.
68
Trip
ura
Aga
rtal
a14
.39
3.33
Joyn
agar
2525
.04
77.0
125
25.0
477
.01
Mah
aras
htra
CFS
Mul
und
0.30
0.41
111.
4472
.81
108.
3152
.38
0.20
0.06
ICD
Dig
hi, P
une
3.20
3.93
ICD
Nag
pur
192.
0982
.20
Mum
bai A
IR35
113.
2111
417.
8832
.39
32.2
477
2.66
66.2
311
3.21
72.1
011
4.76
2578
.95
Mum
bai S
ea93
.00
64.2
427
67.4
626
6.49
Nha
va s
heva
Sea
1822
40.1
3545
6.63
1015
5.5
5449
.44
5594
94.8
7475
4.79
9608
5.04
4171
8.48
1725
.41
1650
.03
Pim
pri,
Pune
2.80
2.64
Tam
il N
adu
AC
C C
oim
bato
re60
5.32
186.
071.
600.
62C
henn
ai A
IR18
05.9
968
1.66
154.
4554
.33
6.70
1.76
47.7
547
.22
7.95
54.1
8C
henn
ai S
ea17
20.3
740
8.75
2146
8.5
7789
.04
1187
55.8
3063
9.25
1105
23.0
3759
3.82
175.
6017
5.29
ICD
Coi
mba
tore
3.02
0.48
4.06
1.43
ICD
Sin
gana
llur
12.0
012
.51
ICD
Tud
iyal
ur45
.10
11.4
7IC
D T
utic
orin
12.8
01.
8118
.02
4.07
130.
8446
.29
67.1
339
0.14
Tutic
orin
Sea
3029
0.83
4062
.18
1556
2.1
3598
.84
1506
0.07
3080
.24
2079
9.98
5776
.63
52.1
060
.00
Kar
nata
kaBa
ngal
ore
Air
port
1525
.43
1323
.88
58.0
346
.27
0.69
0.06
51.9
718
.20
61.6
019
00.3
5IC
D B
anga
lore
56.3
940
.30
2220
3.4
5335
.41
4778
6.62
1292
1.21
131.
4952
3.92
New
Man
galo
re S
ea71
.05
11.8
5C
ontd
...
Page 104
Vegetable Statistics
89
Stat
e/ P
ort
Fres
h ve
geta
bles
Dri
ed &
pre
serv
edFr
esh
onio
nsO
ther
pro
cess
edFr
uits
&ve
geta
bles
frui
ts &
vege
tabl
esve
geta
bles
see
dsQ
uant
ityVa
lue
Qua
ntity
Valu
eQ
uant
ityVa
lue
Qua
ntity
Valu
eQ
uant
ityVa
lue
Ker
ala
Coc
hin
Air
port
2545
8.68
9377
.74
52.2
813
6.50
23.8
44.
7747
.70
44.0
510
.52
150.
30C
ochi
n Se
a97
0.77
252.
6116
43.8
495
4.10
24.1
812
.07
1010
7.63
4900
.14
73.3
470
1.46
Triv
andr
um A
irpo
rt12
508.
4531
92.5
93.
043.
2151
.12
5.26
107.
6191
.11
7.87
66.6
4K
arip
ur (C
ochi
n C
ust.
Zone
)772
4.17
2933
.25
5.34
5.97
Wes
t Ben
gal
Che
ngra
band
ha R
ly. S
tn.
797.
0056
0.67
125.
0018
.54
1392
.34
755.
88G
haja
dang
a12
652.
7220
01.5
421
4569
.532
784.
1535
92.8
736
0.91
151.
0024
.43
Hili
(W
est)
5785
.63
744.
2520
9.92
184.
2541
700.
3759
63.4
486
.04
15.7
4Ja
igao
n27
4.83
155.
70K
olka
ta A
IR16
58.0
854
0.78
1.83
1.62
6.29
0.40
55.8
520
.83
4.53
22.5
9K
olka
ta S
ea27
70.6
721
0.68
11.5
04.
217.
001.
7663
30.2
935
85.0
625
.00
46.0
3K
otw
alig
ate
(Moh
edip
ur)
9004
.13
1919
.46
1310
86.4
1791
0.79
15.6
01.
38Pa
nita
nki
2436
9.50
1160
.89
491.
8356
.66
0.86
0.51
0.01
8.72
Petr
apol
e La
nd26
66.1
983
9.70
60.0
036
.96
4584
.87
605.
7534
.59
57.6
337
5.92
252.
08
Meg
hala
yaD
awki
21.7
12.
98M
ahen
drag
anj
20.0
01.
35Pu
duch
erry
ICD
Sat
tva
345.
8416
1.09
Uttr
akha
ndTa
nakp
ur (N
aina
tal)
1738
.61
173.
689.
516.
1465
.09
8.19
30.6
218
.44
0.02
0.03
Utta
r Pr
ades
hG
ouri
phan
ta14
413.
4817
51.5
523
34.6
735
1.10
107.
6015
.55
0.10
0.16
LCS
Khu
nwa
1529
0.33
626.
1544
6.30
85.5
9N
auta
nwa
(San
auli)
5943
0.63
2708
.70
2328
.57
676.
5124
002.
4517
30.2
552
5.96
334.
0818
.60
7.42
Nep
alga
nj54
05.2
531
0.95
7.31
0.85
24.8
02.
2717
.70
19.2
5Ti
kuni
a30
60.3
420
6.80
1.00
0.18
2.23
1.15
0.78
2.44
Mad
hya
Prad
esh
ICD
Pith
ampu
r (I
ndor
e)70
.77
54.9
1
(Sou
rce:
Com
pile
d da
ta fr
om d
iffer
ent s
ourc
es)
Page 105
Indian Institute of Vegetable Research
90
Tabl
e 3.
26: I
ndia
’s tr
ade
in le
gum
inou
s ve
geta
bles
(Qua
ntity
in t;
val
ue in
‘000
US$
; uni
t val
ue in
US$
/t)
Year
Expo
rt%
sha
re in
Expo
rt%
sha
re in
Uni
tIm
port
% s
hare
inIm
port
% s
hare
inU
nit
Qua
ntity
wor
ld e
xpor
tVa
lue
wor
ld e
xpor
tVa
lue
Qua
ntity
wor
ld im
port
Valu
ew
orld
impo
rtVa
lue
1987
225
0.88
880.
4639
11,
506.
009.
8854
66.
9136
319
8826
0.12
100.
0538
51,
122.
005.
8259
63.
6453
119
8912
0.05
40.
0233
30
0.00
00.
000
1990
150.
0610
0.04
667
127
0.82
560.
3544
119
9137
0.15
270.
1273
00
0.00
00.
000
1992
00.
000
0.00
00
0.00
00.
000
1993
00.
000
0.00
00
0.00
00.
000
1994
270.
0410
0.02
370
00.
000
0.00
019
950
0.00
00.
000
00.
000
0.00
019
960
0.00
00.
000
00.
000
0.00
019
970
0.00
00.
000
00.
000
0.00
019
988
0.02
70.
0387
50
0.00
00.
000
1999
60.
014
0.01
667
00.
000
0.00
020
0024
0.03
140.
0358
317
50.
4068
0.22
389
2001
230.
0338
0.08
1652
00.
000
0.00
020
028
0.01
80.
0210
000
0.00
00.
000
2003
620.
0959
0.12
952
00.
000
0.00
020
0498
0.14
590.
1260
20
0.00
00.
000
2005
234
0.26
106
0.21
453
00.
000
0.00
020
0646
0.04
520.
0911
300
0.00
00.
000
2007
450.
069
0.01
200
00.
000
0.00
020
0815
60.
2348
0.07
308
00.
000
0.00
020
0916
641.
9210
131.
2960
90
0.00
00.
000
2010
1326
1.23
1026
1.07
774
00.
000
0.00
0
(Sou
rce:
ww
w.fa
osta
t.fao
.org
)
Page 106
Vegetable Statistics
91
Tabl
e 3.
27: I
ndia
’s tr
ade
in r
oots
and
tube
rs(Q
uant
ity in
t; v
alue
in ‘0
00 U
S$; u
nit v
alue
in U
S$/t)
Year
Expo
rt%
sha
re in
Expo
rt%
sha
re in
Uni
tIm
port
% s
hare
inIm
port
% s
hare
inU
nit
Qua
ntity
wor
ld e
xpor
tVa
lue
wor
ld e
xpor
tVa
lue
Qua
ntity
wor
ld im
port
Valu
ew
orld
impo
rtVa
lue
1962
00.
000
0.00
014
0.05
161.
3311
4319
630
0.00
00.
000
10.
002
0.15
2000
1964
00.
000
0.00
00
0.00
00.
000
1965
00.
000
0.00
01
0.00
10.
0510
0019
660
0.00
00.
000
380.
1671
3.73
1868
1967
70.
051
0.07
143
20.
011
0.05
500
1968
240.
153
0.18
125
00.
000
0.00
019
6910
0.11
10.
0610
00
0.00
00.
000
1970
120.
171
0.05
831
0.00
10.
0310
0019
719
0.06
20.
1022
20
0.00
00.
000
1972
430.
198
0.34
186
00.
000
0.00
019
7317
60.
6113
0.20
740
0.00
00.
000
1974
00.
000
0.00
00
0.00
00.
000
1975
40.
011
0.01
250
00.
000
0.00
019
760
0.00
00.
000
00.
000
0.00
019
7725
0.08
90.
0836
04
0.01
100.
0925
0019
7830
0.09
160.
0753
320
50.
3388
0.78
429
1979
170.
0517
0.09
1000
1010
1.87
434
3.23
430
1980
120.
045
0.04
417
1001
1.85
248
1.68
248
1981
220.
0512
0.07
545
3151
3.51
956
4.35
303
1982
870.
2049
0.32
563
1289
1.75
401
2.17
311
1983
410.
1025
0.15
610
10.
000
0.00
019
8439
0.06
280.
1271
817
90.
4476
0.62
425
1985
210
0.27
880.
2941
90
0.00
00.
000
1986
148
0.19
540.
1836
50
0.00
00.
000
1987
220
0.23
860.
2939
119
0.04
400.
2721
0519
8824
90.
2597
0.22
390
180.
0212
0.03
667
1989
208
0.32
132
0.38
635
00.
000
0.00
0C
ontd
...
Page 107
Indian Institute of Vegetable Research
92
Year
Expo
rt%
sha
re in
Expo
rt%
sha
re in
Uni
tIm
port
% s
hare
inIm
port
% s
hare
inU
nit
Qua
ntity
wor
ld e
xpor
tVa
lue
wor
ld e
xpor
tVa
lue
Qua
ntity
wor
ld im
port
Valu
ew
orld
impo
rtVa
lue
1990
157
0.26
730.
2046
50
0.00
00.
000
1991
522
0.74
175
0.38
335
00.
000
0.00
019
9229
40.
3910
00.
2634
00
0.00
00.
000
1993
170
0.25
101
0.30
594
00.
000
0.00
019
9448
70.
9116
00.
4432
90
0.00
00.
000
1995
2546
3.90
796
1.90
313
10.
0014
0.02
1400
019
9664
70.
9021
40.
4433
11
0.00
40.
0040
0019
9717
382.
2051
70.
8829
71
0.00
30.
0030
0019
9857
20.
8626
40.
5646
26
0.01
110.
0218
3319
9961
20.
7746
41.
1975
83
0.00
30.
0010
0020
0053
50.
6514
70.
3827
548
0.04
230.
0347
920
0166
70.
6721
60.
4232
415
0.01
170.
0211
3320
0243
30.
5315
90.
3036
722
0.02
110.
0150
020
0324
672.
4464
21.
0026
01
0.00
40.
0140
0020
0410
170.
9751
90.
7551
012
0.01
170.
0214
1720
0546
10.
3921
70.
2847
120
0.01
190.
0295
020
0654
60.
4837
10.
5767
90
0.00
00.
000
2007
583
0.53
268
0.38
460
170.
0127
0.02
1588
2008
1703
1.08
1123
0.94
659
230.
0239
0.02
1696
2009
1850
1.12
978
0.72
529
150.
0118
0.01
1200
2010
1630
1.00
876
0.73
537
40.
0033
0.02
8250
(Sou
rce:
ww
w.fa
osta
t.fao
.org
)
Page 108
Vegetable Statistics
93
Tabl
e 3.
28: I
ndia
’s tr
ade
in v
eget
able
pro
duct
s fo
r fe
ed(Q
uant
ity in
t; v
alue
in ‘0
00 U
S$; u
nit v
alue
in U
S$/t)
Year
Expo
rt%
sha
re in
Expo
rt%
sha
re in
Uni
tIm
port
% s
hare
inIm
port
% s
hare
inU
nit
Qua
ntity
wor
ld e
xpor
tVa
lue
wor
ld e
xpor
tVa
lue
Qua
ntity
wor
ld im
port
Valu
ew
orld
impo
rtVa
lue
1965
20.
000
0.00
00
0.00
00.
000
1966
100.
010
0.00
00
0.00
00.
000
1967
106
0.10
50.
1447
00.
000
0.00
019
680
0.00
00.
000
00.
000
0.00
019
690
0.00
00.
000
00.
000
0.00
019
700
0.00
00.
000
350.
014
0.01
114
1971
00.
000
0.00
00
0.00
00.
000
1972
550.
025
0.03
9123
0.01
40.
0217
419
7321
60.
0420
0.06
9350
0.02
90.
0218
019
7418
0.00
40.
0122
212
0.00
10.
0083
1975
320
0.07
620.
1619
40
0.00
00.
000
1976
00.
000
0.00
017
0.00
10.
0059
1977
650
0.08
123
0.14
189
10.
000
0.00
019
780
0.00
00.
000
490.
015
0.01
102
1979
2959
0.87
442
1.30
149
230.
002
0.00
8719
8060
0.02
100.
0216
712
20.
0210
0.01
8219
8151
80.
1292
0.20
178
150.
001
0.00
6719
8226
10.
0539
0.08
149
190.
0010
0.01
526
1983
00.
000
0.00
034
0.00
100.
0129
419
8470
0.01
40.
0157
00.
000
0.00
019
8510
320.
1210
50.
1910
20
0.00
00.
000
1986
10.
001
0.00
1000
221
0.01
200.
0290
1987
00.
000
0.00
071
70.
0654
0.04
7519
8816
0.00
110.
0268
80
0.00
00.
000
1989
120.
004
0.00
333
00.
000
0.00
019
9012
0.00
20.
0016
70
0.00
00.
000
1991
570.
014
0.00
700
0.00
00.
000
1992
360.
009
0.00
250
00.
000
0.00
0C
ontd
...
Page 109
Indian Institute of Vegetable Research
94
Year
Expo
rt%
sha
re in
Expo
rt%
sha
re in
Uni
tIm
port
% s
hare
inIm
port
% s
hare
inU
nit
Qua
ntity
wor
ld e
xpor
tVa
lue
wor
ld e
xpor
tVa
lue
Qua
ntity
wor
ld im
port
Valu
ew
orld
impo
rtVa
lue
1993
240.
002
0.00
830
0.00
00.
000
1994
00.
000
0.00
00
0.00
00.
000
1995
150
0.02
330.
0222
00
0.00
00.
000
1996
130.
001
0.00
7710
0.00
10.
0010
019
9724
40.
0368
0.04
279
00.
000
0.00
019
9836
0.00
60.
0016
70
0.00
00.
000
1999
200.
0012
0.01
600
00.
000
0.00
020
0016
90.
0337
0.03
219
00.
000
0.00
020
0124
70.
0342
0.03
170
00.
001
0.00
020
0221
90.
0325
70.
1511
7413
90.
0127
0.01
194
2003
520.
0127
0.02
519
1951
0.13
635
0.34
325
2004
00.
000
0.00
013
610.
0449
10.
2236
120
0525
70.
0379
0.05
307
369
0.02
114
0.05
309
2006
342
0.03
510.
0314
911
050.
0632
20.
1229
120
0710
70.
0126
0.01
243
149
0.01
860.
0257
720
0840
10.
0363
0.02
157
490.
0015
0.00
306
2009
1034
0.07
343
0.11
332
133
0.01
420.
0131
620
1076
70.
0416
50.
0421
595
0.00
230.
0024
2
Not
e: V
eget
able
pro
duct
s fo
r fe
ed in
clud
e ve
geta
ble
prod
ucts
, veg
etab
le w
aste
, res
idue
s an
d by
-pro
duct
s fr
om t
he in
dust
rial
pro
cess
ing
of v
eget
able
mat
eria
ls.
(Sou
rce:
ww
w.fa
osta
t.fao
.org
)
Page 110
Vegetable Statistics
95
Tabl
e 3.
29: I
ndia
’s tr
ade
ofpr
eser
ved
vege
tabl
es(Q
uant
ity in
t; v
alue
in ‘0
00 U
S$; u
nit v
alue
in U
S$/t)
Year
Expo
rt%
sha
re in
Expo
rt%
sha
re in
Uni
tIm
port
% s
hare
inIm
port
% s
hare
inU
nit
Qua
ntity
wor
ld e
xpor
tVa
lue
wor
ld e
xpor
tVa
lue
Qua
ntity
wor
ld im
port
Valu
ew
orld
impo
rtVa
lue
1971
60.
012
0.01
333
00.
000
0.00
0
1972
520.
0764
0.23
1231
50.
014
0.01
800
1973
920.
1085
0.24
924
10.
003
0.01
3000
1974
880.
1257
0.15
648
210.
0321
0.04
1000
1975
182
0.20
120
0.24
659
240.
034
0.01
167
1976
115
0.12
690.
1260
01
0.00
40.
0140
00
1977
546
0.54
341
0.50
625
00.
000
0.00
0
1978
2033
1.88
1241
1.40
610
00.
000
0.00
0
1979
1229
1.03
800
0.76
651
00.
000
0.00
0
1980
646
0.70
593
0.64
918
00.
000
0.00
0
1981
761
0.81
801
0.89
1053
00.
000
0.00
0
1982
1103
1.08
1038
1.12
941
00.
000
0.00
0
1983
788
0.76
691
0.74
877
00.
000
0.00
0
1984
1041
0.89
947
0.99
910
00.
000
0.00
0
1985
763
0.67
786
0.69
1030
00.
000
0.00
0
1986
773
0.40
952
0.44
1232
00.
000
0.00
0
1987
1558
0.63
2128
1.02
1366
40.
0015
0.01
3750
1988
1672
0.72
1297
0.49
776
00.
000
0.00
0
1989
1485
0.59
1488
0.50
1002
00.
000
0.00
0
1990
1279
55.
1271
592.
4256
00
0.00
00.
000
1991
2391
1.01
2382
0.87
996
00.
000
0.00
0
1992
7462
2.57
4983
1.58
668
00.
000
0.00
0
1993
7653
2.58
5607
2.12
733
00.
000
0.00
0
1994
1298
03.
9794
123.
1572
50
0.00
00.
000
1995
3778
011
.24
2443
97.
1764
70
0.00
00.
000
Con
td...
Page 111
Indian Institute of Vegetable Research
96
Year
Expo
rt%
sha
re in
Expo
rt%
sha
re in
Uni
tIm
port
% s
hare
inIm
port
% s
hare
inU
nit
Qua
ntity
wor
ld e
xpor
tVa
lue
wor
ld e
xpor
tVa
lue
Qua
ntity
wor
ld im
port
Valu
ew
orld
impo
rtVa
lue
1996
2668
87.
3815
070
4.07
565
10.
005
0.00
5000
1997
2251
76.
4114
113
4.38
627
210.
0025
0.01
1190
1998
3609
59.
2124
084
7.23
667
130.
0018
0.00
1385
1999
3251
47.
7319
642
5.80
604
590.
0189
0.02
1508
2000
3331
97.
3620
165
5.86
605
260.
0139
0.01
1500
2001
3766
68.
0419
520
5.65
518
400.
0165
0.02
1625
2002
4836
611
.20
2492
17.
7551
528
0.01
420.
0115
00
2003
4153
18.
7622
447
6.28
540
330.
0176
0.02
2303
2004
4630
19.
3628
291
7.33
611
170.
0068
0.02
4000
2005
1002
1119
.10
5268
613
.05
526
260.
0116
10.
0461
92
2006
9226
417
.90
4900
911
.48
531
440.
0116
70.
0437
95
2007
6426
313
.54
3912
78.
2960
915
80.
0330
30.
0719
18
2008
1118
2021
.01
7432
313
.67
665
125
0.03
290
0.06
2320
2009
9299
320
.90
5521
112
.70
594
151
0.04
258
0.06
1709
2010
6624
715
.70
3693
88.
3055
832
40.
0761
20.
1218
89
Not
e: P
rese
rved
veg
etab
les
incl
ude
vege
tabl
es p
rese
rved
with
SO
2, br
ine,
etc
., bu
t whi
ch a
re u
nsui
tabl
e fo
r co
nsum
ptio
n in
that
sta
te.
(Sou
rce:
ww
w.fa
osta
t.fao
.org
)
Page 112
Vegetable Statistics
97
Tabl
e 3.
30: I
ndia
’s tr
ade
in v
eget
able
s an
d its
pro
duct
s pr
epar
ed o
r pr
eser
ved
and
froz
en
(Qua
ntity
in t;
val
ue in
‘000
US$
; uni
t val
ue in
US$
/t)
Year
Expo
rt%
sha
re in
Expo
rt%
sha
re in
Uni
tIm
port
% s
hare
inIm
port
% s
hare
inU
nit
Qua
ntity
wor
ld e
xpor
tVa
lue
wor
ld e
xpor
tVa
lue
Qua
ntity
wor
ld im
port
Valu
ew
orld
impo
rtVa
lue
1988
180.
0219
0.02
1056
00.
000
0.00
019
8923
70.
2528
90.
2812
190
0.00
00.
000
1990
217
0.19
257
0.19
1184
00.
000
0.00
019
9122
50.
1627
10.
1712
040
0.00
00.
000
1992
166
0.12
207
0.12
1247
00.
000
0.00
019
9313
70.
1412
60.
1192
00
0.00
00.
000
1994
253
0.21
208
0.14
822
20.
003
0.00
1500
1995
181
0.16
178
0.12
983
00.
000
0.00
019
9634
00.
2433
00.
1897
10
0.00
10.
000
1997
243
0.17
234
0.13
963
50.
0033
0.02
6600
1998
825
0.53
673
0.35
816
10.
003
0.00
3000
1999
545
0.38
547
0.29
1004
220.
0140
0.02
1818
2000
180
0.11
269
0.14
1494
460.
0321
0.01
457
2001
1538
0.83
2411
1.06
1568
50.
0013
0.00
2600
2002
1843
0.86
3005
1.11
1630
370.
0246
0.02
1243
2003
2878
1.23
5112
1.46
1776
270.
0161
0.02
2259
2004
3343
1.24
4722
1.13
1413
620.
0287
0.02
1403
2005
4934
1.53
5029
1.00
1019
141
0.05
321
0.07
2277
2006
3159
0.85
5085
0.86
1610
770.
0228
30.
0536
7520
0742
221.
1167
471.
0215
9830
60.
0979
50.
1225
9820
0855
261.
4981
971.
2114
8314
70.
0438
80.
0626
3920
0979
162.
1410
475
1.58
1323
426
0.12
1091
0.16
2561
2010
8557
1.89
1248
91.
5814
6033
10.
0811
380.
1434
38
Not
e: V
eget
able
sand
its
prod
ucts
pre
pare
d or
pre
serv
ed a
nd fr
ozen
incl
udev
eget
able
s th
at a
re p
repa
red
or p
rese
rved
by
vine
gar
and
then
froz
en.
(Sou
rce:
ww
w.fa
osta
t.fao
.org
)
Page 113
Indian Institute of Vegetable Research
98
Tabl
e 3.
31: I
ndia
’s tr
ade
in v
eget
able
pro
duct
s (F
resh
or
drie
d)(Q
uant
ity in
t; v
alue
in ‘0
00 U
S$; u
nit v
alue
in U
S$/t)
Year
Expo
rt%
sha
re in
Expo
rt%
sha
re in
Uni
tIm
port
% s
hare
inIm
port
% s
hare
inU
nit
Qua
ntity
wor
ld e
xpor
tVa
lue
wor
ld e
xpor
tVa
lue
Qua
ntity
wor
ld im
port
Valu
ew
orld
impo
rtVa
lue
1961
730.
5444
0.63
603
00.
000
0.00
019
6275
0.58
310.
3141
30
0.00
00.
000
1963
580.
3132
0.17
552
00.
000
0.00
019
6411
357.
1022
91.
4120
20
0.00
00.
000
1965
1075
4.29
180
0.70
167
00.
000
0.00
019
6644
32.
0162
0.27
140
00.
000
0.00
019
6787
0.39
240.
1027
611
20.
2997
0.94
866
1968
770.
3428
0.11
364
139
0.32
960.
3369
119
6961
0.27
270.
1144
323
30.
5020
80.
6489
319
7073
0.31
280.
1238
412
10.
2185
0.28
702
1971
275
1.10
109
0.48
396
350.
0744
0.21
1257
1972
406
1.50
194
0.96
478
590.
1170
0.23
1186
1973
408
1.25
533
1.91
1306
530.
1169
0.15
1302
1974
434
1.37
431
1.56
993
300.
0565
0.17
2167
1975
373
1.28
155
0.45
416
00.
001
0.00
019
7669
42.
3521
20.
6130
58
0.01
80.
0110
0019
7737
41.
4834
61.
0392
54
0.01
180.
0345
0019
7845
71.
2045
80.
9110
0259
0.08
165
0.22
2797
1979
581
1.83
679
1.48
1169
191
0.24
418
0.42
2188
1980
377
1.63
558
1.24
1480
700.
0813
50.
1119
2919
8110
102.
8511
461.
9611
3546
50.
5227
80.
2459
819
8250
91.
5659
81.
0211
7515
0.01
160.
0110
6719
8323
00.
8526
60.
5311
5726
10.
2894
0.08
360
1984
304
1.04
212
0.40
697
800.
0912
90.
1116
1319
8523
80.
8626
50.
5011
130
0.00
00.
000
1986
275
0.78
190
0.27
691
730.
0910
00.
0713
7019
8712
80.
2387
0.10
680
30.
004
0.00
1333
Con
td...
Page 114
Vegetable Statistics
99
Year
Expo
rt%
sha
re in
Expo
rt%
sha
re in
Uni
tIm
port
% s
hare
inIm
port
% s
hare
inU
nit
Qua
ntity
wor
ld e
xpor
tVa
lue
wor
ld e
xpor
tVa
lue
Qua
ntity
wor
ld im
port
Valu
ew
orld
impo
rtVa
lue
1988
470.
0947
0.07
1000
60.
018
0.01
1333
1989
222
0.33
153
0.18
689
00.
000
0.00
019
9080
0.12
500.
0662
50
0.00
00.
000
1991
740.
0863
0.06
851
30.
002
0.00
667
1992
820.
1182
0.08
1000
280.
0339
0.03
1393
1993
260.
0339
0.04
1500
390.
0657
0.05
1462
1994
560.
0494
0.06
1679
240.
0253
0.04
2208
1995
330.
0377
0.05
2333
280.
0359
0.04
2107
1996
170
0.19
231
0.15
1359
430.
0493
0.06
2163
1997
239
0.24
435
0.27
1820
300.
0485
0.06
2833
1998
248
0.25
240
0.17
968
275
0.35
662
0.48
2407
1999
116
0.09
161
0.12
1388
108
0.12
196
0.15
1815
2000
201
0.13
247
0.17
1229
126
0.11
243
0.17
1929
2001
259
0.18
295
0.19
1139
232
0.23
281
0.22
1211
2002
172
0.10
350
0.18
2035
161
0.14
178
0.13
1106
2003
326
0.16
379
0.16
1163
471
0.43
304
0.20
645
2004
453
0.21
395
0.13
872
428
0.30
496
0.26
1159
2005
924
0.38
1205
0.35
1304
2027
1.30
2116
1.13
1044
2006
348
0.15
460
0.14
1322
1656
0.82
1717
0.86
1037
2007
1091
0.40
714
0.17
654
497
0.17
512
0.19
1030
2008
1440
0.43
1761
0.34
1223
384
0.14
450
0.13
1172
2009
367
0.10
568
0.10
1548
342
0.14
351
0.10
1026
2010
419
0.18
571
0.28
1363
105
0.03
135
0.03
1286
Not
e: V
eget
able
Pro
duct
s (Fr
esh
or d
ried
) inc
lude
frui
t sto
nes,
ker
nels
and
oth
er v
eget
able
pro
duct
s use
d pr
imar
ily fo
r hum
an fo
od th
at a
re n
ot sp
ecifi
edor
incl
uded
els
ewhe
re.(S
ourc
e: w
ww
.faos
tat.f
ao.o
rg)
Page 115
Indian Institute of Vegetable Research
100
Tabl
e 3.
32: I
ndia
’s tr
ade
in f
roze
n ve
geta
bles
(Qua
ntity
in t;
val
ue in
‘000
US$
; uni
t val
ue in
US$
/t)
Year
Expo
rt%
sha
re in
Expo
rt%
sha
re in
Uni
tIm
port
% s
hare
inIm
port
% s
hare
inU
nit
Qua
ntity
wor
ld e
xpor
tVa
lue
wor
ld e
xpor
tVa
lue
Qua
ntity
wor
ld im
port
Valu
ew
orld
impo
rtVa
lue
1975
500.
0228
0.02
560
30.
004
0.00
1333
1976
346
0.09
191
0.10
552
20.
002
0.00
1000
1977
160.
0012
0.00
750
00.
000
0.00
019
7838
50.
0816
60.
0543
10
0.00
00.
000
1979
710
0.14
589
0.16
830
00.
000
0.00
019
8016
90.
0314
60.
0386
40
0.00
00.
000
1981
220.
0019
0.00
864
00.
000
0.00
019
8212
70.
0213
00.
0310
240
0.00
00.
000
1983
101
0.02
610.
0260
40
0.00
00.
000
1984
200.
0010
0.00
500
00.
000
0.00
019
8543
0.01
570.
0113
260
0.00
00.
000
1986
20.
001
0.00
500
00.
000
0.00
019
8720
285
1.87
1064
51.
2852
577
0.01
300.
0039
019
8837
638
3.27
9802
1.05
260
00.
000
0.00
019
8925
180
2.07
8841
0.87
351
00.
000
0.00
019
9015
558
1.22
5427
0.45
349
00.
000
0.00
019
9114
901
1.03
4313
0.33
289
1000
0.07
253
0.02
253
1992
1531
31.
0751
370.
3733
50
0.00
00.
000
1993
1009
10.
6328
490.
2028
20
0.00
00.
000
1994
8011
0.44
2569
0.16
321
00.
000
0.00
019
9510
251
0.54
3475
0.20
339
10.
001
0.00
1000
1996
6398
0.31
2478
0.13
387
50.
0028
0.00
5600
1997
5436
0.25
2438
0.13
448
140.
0043
0.00
3071
1998
3465
0.15
2002
0.10
578
460.
0055
0.00
1196
1999
5294
0.21
2722
0.13
514
133
0.00
107
0.00
805
2000
1724
70.
6173
870.
3742
815
0.00
140.
0093
320
0121
019
0.72
9138
0.42
435
360.
0032
0.00
889
2002
2005
70.
7010
620
0.47
529
740.
0070
0.00
946
2003
2293
10.
7311
913
0.45
520
700.
0088
0.00
1257
2004
2557
30.
7713
649
0.45
534
306
0.01
105
0.00
343
2005
1635
90.
4810
708
0.34
655
366
0.01
189
0.01
516
2006
1534
20.
4210
992
0.31
716
200.
0059
0.00
2950
2007
1527
70.
3911
545
0.28
756
470.
0021
90.
0146
6020
0821
761
0.54
1687
50.
3677
560
0.00
199
0.00
3317
2009
1442
10.
3610
861
0.24
753
666
0.02
318
0.01
477
2010
1614
80.
3813
795
0.30
854
670.
0063
0.00
940
Not
e: F
roze
n ve
geta
bles
incl
ude
vege
tabl
es, e
ither
unc
ooke
d or
coo
ked
by s
team
ing
or b
oilin
g in
wat
er a
nd th
en fr
ozen
.(S
ourc
e: w
ww
.faos
tat.f
ao.o
rg)
Page 116
Vegetable Statistics
101
Tabl
e 3.
33: I
ndia
’s tr
ade
in d
ehyd
rate
d ve
geta
bles
(Qua
ntity
in t;
val
ue in
‘000
US$
; uni
t val
ue in
US$
/t)
Year
Expo
rt%
sha
re in
Expo
rt%
sha
re in
Uni
tIm
port
% s
hare
inIm
port
% s
hare
inU
nit
Qua
ntity
wor
ld e
xpor
tVa
lue
wor
ld e
xpor
tVa
lue
Qua
ntity
wor
ld im
port
Valu
ew
orld
impo
rtVa
lue
1961
270.
0710
0.03
370
60.
029
0.04
1500
1962
580.
1422
0.06
379
40.
0110
0.03
2500
1963
170.
038
0.02
471
00.
000
0.00
0
1964
210.
0410
0.03
476
20.
012
0.01
1000
1965
320.
0535
40.
8011
063
230.
0532
0.09
1391
1966
410.
0534
80.
7084
885
0.01
60.
0112
00
1967
220.
0226
40.
4312
000
90.
0111
0.02
1222
1968
360.
0341
20.
5611
444
140.
0217
0.03
1214
1969
280.
0352
50.
7518
750
280.
0323
0.04
821
1970
197
0.17
510
0.57
2589
130.
0117
0.02
1308
1971
518
0.52
864
0.97
1668
210.
0223
0.03
1095
1972
170.
0121
0.02
1235
410.
0434
0.03
829
1973
630.
0586
0.06
1365
240.
0237
0.03
1542
1974
452
0.38
540
0.32
1195
100.
0115
0.01
1500
1975
519
0.45
708
0.43
1364
180.
0230
0.02
1667
1976
890
0.58
1019
0.55
1145
30.
006
0.00
2000
1977
1907
1.27
3187
1.48
1671
10.
001
0.00
1000
1978
1971
1.55
2902
1.22
1472
50.
0013
0.00
2600
1979
1267
0.90
1810
0.75
1429
50.
0014
0.00
2800
1980
916
0.59
1668
0.63
1821
110.
0126
0.01
2364
1981
1424
0.87
1501
0.53
1054
30.
009
0.00
3000
1982
1800
1.02
2863
0.84
1591
190.
017
0.00
368
1983
2077
1.22
3259
0.97
1569
3526
1.83
1316
0.33
373
1984
2073
1.07
4055
1.29
1956
30.
005
0.00
1667
Con
td...
Page 117
Indian Institute of Vegetable Research
102
Year
Expo
rt%
sha
re in
Expo
rt%
sha
re in
Uni
tIm
port
% s
hare
inIm
port
% s
hare
inU
nit
Qua
ntity
wor
ld e
xpor
tVa
lue
wor
ld e
xpor
tVa
lue
Qua
ntity
wor
ld im
port
Valu
ew
orld
impo
rtVa
lue
1985
2070
0.93
2829
0.80
1367
50.
0013
0.00
2600
1986
1384
0.54
1934
0.46
1397
140.
0120
0.00
1429
1987
1271
0.51
1565
0.35
1231
90.
0028
0.01
3111
1988
1069
0.47
1228
0.27
1149
00.
000
0.00
0
1989
2009
0.83
2224
0.45
1107
00.
000
0.00
0
1990
1171
0.41
1062
0.17
907
00.
000
0.00
0
1991
2176
0.66
2792
0.40
1283
00.
000
0.00
0
1992
2920
0.91
3806
0.53
1303
00.
000
0.00
0
1993
2204
0.59
2350
0.34
1066
00.
000
0.00
0
1994
1689
0.42
2147
0.30
1271
00.
000
0.00
0
1995
4715
1.36
5570
0.75
1181
00.
000
0.00
0
1996
6731
1.99
6911
0.87
1027
00.
002
0.00
0
1997
6917
1.93
8538
1.05
1234
10.
0010
0.00
1000
0
1998
4932
1.23
7530
0.97
1527
1133
0.30
723
0.09
638
1999
8871
2.39
1194
71.
5413
4782
142.
0840
270.
4849
0
2000
9011
2.73
9782
1.43
1086
40.
0014
0.00
3500
2001
9314
2.41
1161
61.
6112
4729
50.
0776
90.
1026
07
2002
1677
34.
0615
134
1.77
902
218
0.05
888
0.10
4073
2003
1785
84.
2216
732
1.84
937
131
0.03
722
0.08
5511
2004
1676
23.
7715
055
1.55
898
114
0.02
729
0.07
6395
2005
3344
87.
0430
337
2.80
907
314
0.06
1472
0.13
4688
2006
2689
25.
2237
970
2.93
1412
873
0.16
2361
0.19
2704
2007
6132
510
.29
5896
23.
9696
110
010.
1626
020.
1825
99
2008
3570
35.
9737
357
2.44
1046
1104
0.18
2547
0.17
2307
2009
3147
35.
3151
491
3.46
1636
878
0.15
2965
0.21
3377
2010
4427
96.
9868
848
3.78
1555
978
0.15
3478
0.21
3556
Not
e: D
ehyd
rate
d ve
geta
bles
are
vege
tabl
es th
at a
re d
ried
, deh
ydra
ted,
eva
pora
ted
or fr
eeze
-dri
ed in
clud
ingd
ried
veg
etab
les t
hat a
re b
roke
n or
pow
dere
d.(S
ourc
e: w
ww
.faos
tat.f
ao.o
rg)
Page 118
Vegetable Statistics
103
Tabl
e 3.
34: I
ndia
’s tr
ade
in v
eget
able
s fr
esh
nes
(Qua
ntity
in t;
val
ue in
‘000
US$
; uni
t val
ue in
US$
/t)
Year
Expo
rt%
sha
re in
Expo
rt%
sha
re in
Uni
tIm
port
% s
hare
inIm
port
% s
hare
inU
nit
Qua
ntity
wor
ld e
xpor
tVa
lue
wor
ld e
xpor
tVa
lue
Qua
ntity
wor
ld im
port
Valu
ew
orld
impo
rtVa
lue
1961
793
0.17
132
0.26
166
00.
000
0.00
019
6253
30.
1195
0.15
178
40.
001
0.00
250
1963
578
0.10
101
0.13
175
00.
000
0.00
019
6458
00.
1010
90.
1518
80
0.00
00.
000
1965
713
0.13
117
0.13
164
190.
002
0.00
105
1966
713
0.12
990.
0913
911
30.
0213
0.01
115
1967
1414
0.23
191
0.15
135
212
0.03
120.
0157
1968
1426
0.21
210
0.16
147
50.
000
0.00
019
6921
090.
2835
20.
2316
758
0.01
50.
0086
1970
3214
0.38
506
0.30
157
440.
014
0.00
9119
7137
390.
4362
30.
3316
74
0.00
10.
0025
019
7240
720.
5169
10.
5117
04
0.00
10.
0025
019
7324
030.
3051
90.
3321
626
0.00
110.
0042
319
7435
400.
4310
060.
5228
41
0.00
00.
000
1975
3886
0.42
1346
0.59
346
120.
002
0.00
167
1976
4311
0.46
1436
0.58
333
480.
0010
0.00
208
1977
4309
0.43
1786
0.64
414
350.
0011
0.00
314
1978
860
0.08
309
0.09
359
200.
007
0.00
350
1979
1516
0.15
623
0.16
411
530.
0022
0.00
415
1980
2694
0.24
1879
0.40
697
230.
007
0.00
304
1981
4277
0.38
2659
0.54
622
60.
003
0.00
500
1982
2518
32.
0697
591.
9438
849
20.
0318
20.
0237
019
8331
626
2.54
1986
93.
7462
840
0.00
180.
0045
019
8426
703
2.09
1578
92.
9159
153
0.00
190.
0035
819
8527
945
1.88
1592
02.
7657
065
0.00
00.
000
1986
2013
2912
.29
4496
96.
7022
310
60.
0146
0.01
434
Con
td...
Page 119
Indian Institute of Vegetable Research
104
Year
Expo
rt%
sha
re in
Expo
rt%
sha
re in
Uni
tIm
port
% s
hare
inIm
port
% s
hare
inU
nit
Qua
ntity
wor
ld e
xpor
tVa
lue
wor
ld e
xpor
tVa
lue
Qua
ntity
wor
ld im
port
Valu
ew
orld
impo
rtVa
lue
1987
2657
0.20
1102
0.15
415
300.
0010
0.00
333
1988
2605
0.21
930
0.14
357
90.
001
0.00
111
1989
2552
0.21
939
0.16
368
00.
000
0.00
019
9055
440.
4521
550.
3138
90
0.00
00.
000
1991
8306
0.67
2124
0.27
256
00.
000
0.00
019
9269
350.
5620
450.
2929
50
0.00
00.
000
1993
1101
70.
8227
140.
3624
650
0.00
80.
0016
019
9414
813
0.98
3950
0.49
267
00.
000
0.00
019
9521
879
1.38
5642
0.61
258
00.
000
0.00
019
9616
862
1.12
4315
0.45
256
190.
0012
80.
0167
3719
9748
799
2.90
1439
51.
5429
555
0.01
110
0.01
2000
1998
3901
02.
2515
297
1.63
392
90.
0095
0.01
1055
619
9940
523
2.47
1421
31.
6635
176
0.01
108
0.01
1421
2000
5568
63.
3916
120
1.81
289
60.
0021
0.00
3500
2001
9451
85.
3324
042
2.53
254
50.
0019
0.00
3800
2002
6773
03.
8020
334
2.04
300
320.
0096
0.01
3000
2003
3478
91.
5813
627
0.87
392
280.
0051
0.00
1821
2004
5097
52.
2615
880
0.97
312
40.
0016
0.00
4000
2005
4986
02.
1519
040
1.06
382
310.
0015
50.
0150
0020
0678
509
3.03
4318
41.
9455
050
0.00
950.
0119
0020
0765
856
2.39
3686
01.
4656
012
10.
0133
60.
0227
7720
0896
455
3.04
5774
52.
0759
990
0.00
545
0.02
6056
2009
1259
463.
9571
876
2.54
571
261
0.01
506
0.02
1939
2010
1295
824.
1475
751
2.33
585
177
0.01
444
0.02
2508
Not
e: V
eget
able
s fr
esh
nes
incl
udes
bam
boo
shoo
ts (B
ambu
sa s
pp.);
bee
ts, c
hard
s (B
eta
vulg
aris)
; cap
ers
(Cap
paris
spi
nosa
); ca
rdoo
ns (C
ynar
a ca
rdun
culu
s);
cele
ry (A
pium
gra
veol
ens)
; che
rvil
(Ant
hrisc
us ce
refo
lium
); cr
ess (
Lepi
dium
sativ
um);
fenn
el (F
oeni
culu
m v
ulga
re);
hors
erad
ish
(Coc
hlea
ria ar
mor
acia
); m
arjo
ram
,sw
eet
(Maj
oran
a ho
rten
sis);
oyst
er p
lant
(Tr
agop
ogon
por
rifol
ius)
; pa
rsle
y (P
etro
selin
um c
rispu
m);
pars
nips
(Pa
stin
aca
sativ
a);
radi
sh (
Raph
anus
sat
ivus
);rh
ubar
b (R
heum
spp
.); r
utab
agas
, sw
edes
(Br
assic
a na
pus)
; sav
ory
(Sat
ureja
hor
tens
is); s
corz
oner
a (S
corz
oner
a hi
span
ica)
; sor
rel (
Rum
ex a
ceto
sa);
soyb
ean
spro
uts
tarr
agon
(A
rtem
isia
drac
uncu
lus)
; wat
ercr
ess
(Nas
turt
ium
offi
cina
le). O
ther
veg
etab
les
that
are
not
ide
ntifi
ed s
epar
atel
y be
caus
e of
the
ir m
inor
rele
vanc
e at
the
inte
rnat
iona
l lev
el. B
ecau
se o
f th
eir
limite
d lo
cal i
mpo
rtan
ce, s
ome
coun
trie
s re
port
veg
etab
les
unde
r th
is h
eadi
ng t
hat
are
clas
sifie
din
divi
dual
ly b
y FA
O. (
Sour
ce: w
ww
.faos
tat.f
ao.o
rg)
Page 120
Vegetable Statistics
105
Tabl
e 3.
35: I
ndia
’s tr
ade
in v
eget
able
s in
vin
egar
(Qua
ntity
in t;
val
ue in
‘000
US$
; uni
t val
ue in
US$
/t)
Year
Expo
rt%
sha
re in
Expo
rt%
sha
re in
Uni
tIm
port
% s
hare
inIm
port
% s
hare
inU
nit
Qua
ntity
wor
ld e
xpor
tVa
lue
wor
ld e
xpor
tVa
lue
Qua
ntity
wor
ld im
port
Valu
ew
orld
impo
rtVa
lue
1967
1717
1.52
680
2.34
396
00.
000
0.00
0
1968
2531
2.25
1102
3.69
435
00.
000
0.00
0
1969
2416
1.85
1046
3.05
433
00.
001
0.00
0
1970
3383
2.10
1409
3.34
416
10.
001
0.00
1000
1971
2965
1.62
1283
2.57
433
00.
002
0.01
0
1972
2275
1.07
1144
1.83
503
00.
000
0.00
0
1973
2723
1.12
1506
1.77
553
00.
000
0.00
0
1974
3468
1.56
2195
2.53
633
80.
0112
0.02
1500
1975
3886
1.38
2767
2.13
712
00.
000
0.00
0
1976
4236
1.57
2737
2.31
646
10.
001
0.00
1000
1977
5898
2.23
4189
3.18
710
00.
000
0.00
0
1978
6566
2.06
5194
3.02
791
10.
002
0.00
2000
1979
6758
1.93
5965
2.90
883
10.
000
0.00
0
1980
8387
2.22
8267
3.59
986
10.
004
0.00
4000
1981
7778
2.23
8310
4.11
1068
00.
000
0.00
0
1982
7104
1.95
6845
3.28
964
10.
004
0.00
4000
1983
6323
1.49
6742
3.07
1066
70.
001
0.00
143
1984
7521
1.82
6468
3.14
860
10.
001
0.00
1000
1985
6509
1.54
5473
2.55
841
00.
000
0.00
0
1986
7416
1.56
8903
3.38
1201
00.
000
0.00
0
1987
7136
1.46
7181
2.34
1006
00.
000
0.00
0
1988
7500
1.44
7051
2.12
940
00.
000
0.00
0
1989
8947
1.79
8102
2.29
906
00.
000
0.00
0
Con
td...
Page 121
Indian Institute of Vegetable Research
106
Year
Expo
rt%
sha
re in
Expo
rt%
sha
re in
Uni
tIm
port
% s
hare
inIm
port
% s
hare
inU
nit
Qua
ntity
wor
ld e
xpor
tVa
lue
wor
ld e
xpor
tVa
lue
Qua
ntity
wor
ld im
port
Valu
ew
orld
impo
rtVa
lue
1990
7822
1.62
7149
1.66
914
00.
000
0.00
0
1991
1100
52.
2810
776
2.23
979
00.
000
0.00
0
1992
1013
01.
8610
887
2.09
1075
00.
000
0.00
0
1993
1310
62.
2011
562
2.12
882
00.
000
0.00
0
1994
1771
92.
4415
920
2.36
898
00.
000
0.00
0
1995
1559
72.
3716
291
2.44
1044
00.
000
0.00
0
1996
1839
02.
6815
801
2.35
859
00.
000
0.00
0
1997
2437
23.
3220
710
3.10
850
260.
0037
0.01
1423
1998
2113
83.
0918
230
3.00
862
390.
0159
0.01
1513
1999
2673
83.
7420
901
3.38
782
310.
0078
0.01
2516
2000
4070
45.
5430
387
5.05
747
220.
0041
0.01
1864
2001
3875
94.
6726
797
4.03
691
232
0.03
121
0.02
522
2002
5638
46.
0531
703
4.29
562
1109
0.12
949
0.11
856
2003
7982
87.
8438
754
4.53
485
1518
0.15
1276
0.13
841
2004
8359
77.
4339
624
4.01
474
450.
0024
40.
0254
22
2005
1563
8112
.72
7635
67.
3648
832
0.00
175
0.01
5469
2006
1800
1914
.56
9046
58.
2150
367
0.00
204
0.02
3045
2007
1711
0913
.48
9438
57.
4955
210
60.
0125
60.
0224
15
2008
2308
6917
.72
1439
579.
9162
442
60.
0355
50.
0413
03
2009
2141
0515
.51
1362
659.
3963
610
730.
0913
070.
0812
18
2010
2051
2315
.17
1293
678.
9363
185
80.
0799
90.
0611
64
Not
e: V
eget
able
s in
vin
egar
incl
udes
vege
tabl
es, f
ruits
, nut
s an
d ot
her
edib
le p
arts
of p
lant
s, p
repa
red
or p
rese
rved
with
vin
egar
or
acet
ic a
cid,
with
or
with
out a
dded
sug
ar, s
alt,
spic
es, e
tc. T
hey
also
incl
ude
pick
les.
(Sou
rce:
ww
w.fa
osta
t.fao
.org
)
Page 122
Vegetable Statistics
107
Tabl
e 3.
36: I
ndia
’s tr
ade
in v
eget
able
s pr
eser
ved
nes
(Qua
ntity
in t;
val
ue in
‘000
US$
; uni
t val
ue in
US$
/t)
Year
Expo
rt%
sha
re in
Expo
rt%
sha
re in
Uni
tIm
port
% s
hare
inIm
port
% s
hare
inU
nit
Qua
ntity
wor
ld e
xpor
tVa
lue
wor
ld e
xpor
tVa
lue
Qua
ntity
wor
ld im
port
Valu
ew
orld
impo
rtVa
lue
1961
1966
0.60
1598
1.56
813
710.
0258
0.04
817
1962
2087
0.52
1009
0.86
483
360.
0126
0.02
722
1963
2234
0.49
1225
0.93
548
410.
0134
0.02
829
1964
2279
0.44
1433
0.97
629
330.
0047
0.02
1424
1965
2162
0.39
1062
0.71
491
850.
0141
0.02
482
1966
2067
0.30
846
0.40
409
30.
003
0.00
1000
1967
107
0.01
340.
0131
82
0.00
30.
0015
00
1968
193
0.02
550.
0228
58
0.00
40.
0050
0
1969
241
0.03
780.
0332
40
0.00
10.
000
1970
150
0.02
520.
0234
72
0.00
10.
0050
0
1971
102
0.01
970.
0395
15
0.00
30.
0060
0
1972
720.
0156
0.01
778
00.
000
0.00
0
1973
920.
0135
0.01
380
00.
000
0.00
0
1974
121
0.01
630.
0152
10
0.00
00.
000
1975
111
0.01
660.
0159
50
0.00
00.
000
1976
178
0.01
145
0.02
815
00.
000
0.00
0
1977
548
0.03
405
0.04
739
00.
001
0.00
0
1978
367
0.02
323
0.03
880
30.
0010
0.00
3333
1979
330
0.02
249
0.02
755
00.
001
0.00
0
1980
818
0.05
652
0.05
797
30.
004
0.00
1333
1981
1041
0.06
845
0.06
812
20.
003
0.00
1500
1982
432
0.02
538
0.05
1245
00.
004
0.00
0
1983
511
0.03
445
0.04
871
30.
0011
0.00
3667
1984
514
0.03
391
0.04
761
00.
000
0.00
0
Con
td...
Page 123
Indian Institute of Vegetable Research
108
Year
Expo
rt%
sha
re in
Expo
rt%
sha
re in
Uni
tIm
port
% s
hare
inIm
port
% s
hare
inU
nit
Qua
ntity
wor
ld e
xpor
tVa
lue
wor
ld e
xpor
tVa
lue
Qua
ntity
wor
ld im
port
Valu
ew
orld
impo
rtVa
lue
1985
570
0.03
482
0.05
846
00.
000
0.00
019
8620
30.
0116
70.
0182
32
0.00
60.
0030
00
1987
134
0.01
132
0.01
985
120.
0036
0.00
3000
1988
650.
0070
0.00
1077
80.
0017
0.00
2125
1989
890.
0092
0.01
1034
00.
000
0.00
0
1990
760.
0068
0.00
895
40.
0012
0.00
3000
1991
223
0.01
219
0.01
982
10.
004
0.00
4000
1992
253
0.01
290
0.01
1146
40.
0015
0.00
3750
1993
920.
0085
0.00
924
10.
0010
0.00
1000
0
1994
114
0.00
117
0.00
1026
120.
0016
0.00
1333
1995
955
0.04
424
0.02
444
00.
000
0.00
0
1996
140
0.01
187
0.01
1336
20.
002
0.00
1000
1997
172
0.01
133
0.01
773
20.
005
0.00
2500
1998
237
0.01
164
0.01
692
390.
0054
0.00
1385
1999
910.
0092
0.00
1011
270.
0060
0.00
2222
2000
258
0.01
205
0.01
795
370.
0085
0.00
2297
2001
551
0.02
552
0.02
1002
134
0.00
226
0.01
1687
2002
1073
0.03
1042
0.04
971
179
0.01
427
0.01
2385
2003
2345
0.07
2053
0.06
875
100
0.00
451
0.01
4510
2004
3289
0.10
2901
0.07
882
137
0.00
425
0.01
3102
2005
9182
0.26
8073
0.19
879
117
0.00
748
0.02
6393
2006
1582
70.
4014
484
0.30
915
433
0.01
1808
0.04
4176
2007
1394
50.
3614
850
0.27
1065
317
0.01
1016
0.02
3205
2008
1363
70.
3515
427
0.26
1131
320
0.01
1075
0.02
3359
2009
1786
20.
4918
194
0.33
1019
339
0.01
766
0.01
2260
2010
1466
50.
3718
971
0.33
1294
333
0.01
795
0.01
2387
Not
e: V
eget
able
s pr
epar
ed o
r pr
eser
ved
by v
ineg
ar w
hich
hav
e no
t bee
n fr
ozen
. (So
urce
: ww
w.fa
osta
t.fao
.org
)
Page 124
Vegetable Statistics
109
Section-IV
Crop-wise Vegetable StatisticsPotato
Table 4.1: Area, production and yield of potato
Years World IndiaArea Production Yield Area Production Yield
(Million ha) (Million t) (t/ha) (000’ha) (000’t) (t/ha)
1961 22.15 270.55 12.22 375.00 2719.00 7.251962 22.12 252.99 11.44 365.00 2447.00 6.701963 21.99 269.98 12.28 413.00 3365.00 8.151964 21.73 284.68 13.10 415.00 2593.00 6.251965 21.39 270.91 12.66 429.00 3605.00 8.401966 21.49 281.96 13.12 479.00 4076.00 8.511967 21.40 296.22 13.84 473.30 3521.50 7.441968 21.20 303.71 14.33 501.40 4232.30 8.441969 20.68 278.48 13.47 524.40 4725.50 9.011970 20.77 298.05 14.35 496.00 3912.60 7.891971 20.38 279.49 13.72 481.90 4807.20 9.981972 20.29 272.14 13.41 491.90 4825.50 9.811973 20.09 307.16 15.29 504.60 4451.00 8.821974 20.16 284.78 14.13 543.40 4861.10 8.951975 19.85 270.38 13.62 587.40 6225.40 10.601976 19.06 272.75 14.31 622.40 7306.00 11.741977 19.08 279.67 14.66 619.60 7170.70 11.571978 19.15 291.16 15.20 665.30 8135.40 12.231979 19.23 297.92 15.50 807.10 10133.00 12.551980 18.79 240.49 12.80 685.20 8326.60 12.151981 18.79 267.78 14.25 732.00 9670.00 13.211982 18.74 265.14 14.15 762.70 9911.80 13.001983 18.68 264.47 14.16 735.00 9956.00 13.551984 18.67 290.95 15.58 794.30 12151.80 15.301985 18.43 281.60 15.28 849.00 12570.60 14.811986 18.12 286.61 15.81 843.00 10422.80 12.361987 17.97 279.42 15.54 831.50 12740.30 15.321988 18.11 268.60 14.84 885.10 14046.00 15.871989 18.01 276.58 15.35 932.70 14857.00 15.931990 17.66 266.83 15.11 940.00 14770.80 15.711991 17.66 257.55 14.58 935.50 15205.60 16.25Contd...
Page 125
Indian Institute of Vegetable Research
110
Years World IndiaArea Production Yield Area Production Yield
(Million ha) (Million t) (t/ha) (000’ha) (000’t) (t/ha)
1992 18.48 279.66 15.14 1135.10 18195.00 16.031993 18.47 304.87 16.51 1240.00 18479.00 14.901994 18.06 271.23 15.02 1047.10 17392.40 16.611995 18.37 286.22 15.58 1069.40 17401.30 16.271996 18.72 312.08 16.67 1109.00 18843.30 16.991997 18.78 303.69 16.17 1248.80 24215.90 19.391998 18.84 301.12 15.99 1208.90 17652.30 14.601999 19.70 299.89 15.22 1280.20 22494.70 17.572000 20.09 327.60 16.31 1340.90 25000.10 18.642001 19.68 311.24 15.81 1211.30 22242.70 18.362002 19.16 316.44 16.51 1259.50 24456.10 19.422003 19.13 314.86 16.46 1337.20 23161.40 17.322004 19.22 336.20 17.49 1484.70 27925.80 18.812005 19.36 326.75 16.88 1523.90 28787.70 18.892006 18.42 307.34 16.69 1569.20 29174.60 18.592007 18.66 323.92 17.36 1742.80 28599.60 16.412008 18.17 329.91 18.15 1796.00 34658.00 19.302009 18.62 333.96 17.93 1828.30 34390.90 18.812010 18.77 334.26 17.81 1835.30 36577.30 19.932011 19.25 374.38 19.45 1863.20 42339.40 22.72ACGR for -0.26 1.21 1.47 4.57 6.07 1.43last ten years(2002-2011)
(Source: www.faostat.fao.org)
Table 4.2: Major potato producing countries in the world (2010-11)
Country Area % share to total area Production % share to total potato Productivity(000’ha) under potatoin the world (000’t) production in the world (t/ha)
China 5077.5 27.3 74799.1 22.7 14.7India 1863.0 10.0 42339.0 12.8 22.7Russia 2109.1 11.3 21140.5 6.4 10.0Ukraine 1408.0 7.6 18705.0 5.7 13.3USA 406.6 2.2 18016.2 5.5 44.3Germany 255.2 1.4 10201.9 3.1 40.0Poland 490.9 2.6 8766.0 2.7 17.9Bangladesh 435.0 2.3 7930.0 2.4 18.2Belarus 366.8 2.0 7831.1 2.4 21.4Netherlands 157.0 0.8 6843.5 2.1 43.6Others 6061.2 32.5 113474.8 34.4 18.7Total 18630.2 100 330047.1 100 17.7
(Source:NHB, National Horticulture Database 2011)
Page 126
Vegetable Statistics
111
Table 4.3: Percent share of potato for area and production of vegetables in India
Year Area % of total area Production % of total Productivity(000’ha) under vegetables (000’t) vegetable production (t/ha)
2001-02 1259.5 20.5 24456.1 26.1 19.42002-03 1337.2 22.0 23161.4 27.3 17.32003-04 1484.7 23.5 27925.8 30.0 18.82004-05 1523.9 22.6 28787.7 28.4 18.92005-06 1569.2 21.9 29174.6 26.4 18.62006-07 1743.0 23.0 28600.0 24.9 16.42007-08 1795.0 22.9 34658.0 27.0 19.32008-09 1828.0 22.9 34391.0 26.6 18.82009-10 1835.3 23.0 36577.3 27.3 19.92010-11 1863.0 21.9 42339.0 28.9 22.7
(Source:NHB, National Horticulture Database 2011)
Table 4.4: State-wise area, production and productivity of potato in India (2011-2012)
State Area(‘000 ha) Production(‘000 t) Yield(t/ha)
Andhra Pradesh 4.92 98.38 20.00Arunachal Pradesh 4.60 40.00 8.70Assam 89.38 783.40 8.76Bihar 315.17 6,101.69 19.36Chhattisgarh 41.20 579.18 14.06Delhi 0.71 16.75 23.59Gujarat 80.70 2,395.54 29.68Haryana 27.82 618.85 22.24Himachal Pradesh 16.00 206.22 12.89Jammu & Kashmir 6.91 127.24 18.41Jharkhand 45.75 652.79 14.27Karnataka 45.40 483.00 10.64Kerala 0.32 5.44 17.00Madhya Pradesh 87.98 1,816.68 20.65Maharastra 18.00 360.00 20.00Meghalaya 17.84 164.75 9.23Mizoram 0.20 2.52 12.60Nagaland 2.90 20.15 6.95Odisha 14.19 201.05 14.17Punjab 84.11 2,103.97 25.01Rajasthan 11.86 178.02 15.01Sikkim 9.77 47.09 4.82Tamil Nadu 4.91 104.89 21.36Tripura 6.90 122.96 17.82Uttar Pradesh 567.66 14,125.08 24.88Uttarakhand 25.03 433.82 17.33West Bengal 376.75 9,693.33 25.73India 1,906.98 41,482.79 21.75
(Source: www.nhrdf.com)
Page 127
Indian Institute of Vegetable Research
112
Table 4.5: District-wise area (A), production (P) and yield (Y) of potato[Area (A) in ha; Production (P) in t; Yield (Y) in t/ha]
Gujarat
District 2007-08 2008-09 2009-10A P Y A P Y A P Y
Ahmedabad 38 1026 27.00 31 841 27.13 33 924 28Banaskantha 33400 1002000 30.00 28000 784000 28.00 28500 826500 29Gandhinagar 4242 131502 31.00 4260 132060 31.00 4407 145431 33Jamnagar 2150 26875 12.50 900 12150 13.50 950 16435 17.3Kutch 275 6875 25.00 260 4680 18.00 266 5053 19Kheda 6586 19780 3.00 6489 97335 15.00 6813 136260 20Anand 6600 2178 0.33 5800 145000 25.00 6000 198000 33Mehsana 5300 116600 22.00 5065 101300 20.00 5290 107948 20.41Patan 242 5324 22.00 235 5289 22.51 560 12740 22.75Panchmahal 150 3300 22.00 158 2370 15.00 200 3000 15Sabarkantha 5300 159000 30.00 5000 150000 30.00 6300 189630 30.1Baroda 875 18375 21.00 685 12330 18.00 664 13280 20Total 65213 1493905 22.91 56960 1448825 25.44 60079 1657007 27.58
Haryana
District 2008-09 2009-10 2010-11A P Y A P Y A P Y
Panchkula 950 19120 21.24 900 22939 25.49 1060 26334 24.84Ambala 3130 33426 10.68 4010 62757 15.65 4085 82093 20.1Yamuna Nagar 3075 59286 19.28 3040 74961 24.66 3310 78194 23.62Kurukshetra 6573 175233 26.66 6062 163210 26.92 7515 171772 22.86Kaithal 550 8676 15.77 400 8036 20.09 500 10821 21.64Karnal 2383 49917 20.95 2416 39692 16.43 2880 61127 21.22Panipat 1300 33542 25.8 1300 23903 18.39 1510 28500 18.87Sonipat 1350 30647 22.7 1510 34135 22.61 1710 46358 27.11Rohtak 500 6146 12.29 645 6753 10.47 660 13730 20.8Jhajjar 200 4539 22.7 160 3440 21.5 150 2888 19.25Faridabad 740 16846 22.76 270 5997 22.21 550 10855 19.74Narnaul 15 317 21.13 22 473 21.5 50 1117 22.34Rewari 12 254 21.17 12 258 21.5 20 447 22.35Gurgaon 70 1481 21.16 70 1504 21.49 100 2234 22.34Bhiwani 130 1926 14.82 85 1826 21.48 75 1675 22.33Hisar 510 7723 15.14 480 8840 18.42 580 9541 16.45Fatehabad 605 17477 28.89 510 11935 23.4 600 17651 29.42Sirsa 472 8265 17.51 380 5669 14.92 423 7616 18Jind 630 14605 23.18 610 15200 24.92 810 20923 25.83
Contd...
Page 128
Vegetable Statistics
113
District 2008-09 2009-10 2010-11A P Y A P Y A P Y
Mewat 30 634 21.13 52 1117 21.48 55 1228 22.33Palwal 0 0 0 100 2148 21.48 137 3060 22.34Total 23175 490060 21.15 23034 494793 21.48 26780 598164 22.34
Punjab
District 2008-09 2009-10 2010-11A P Y A P Y A P Y
Hoshiarpur 16388 373876 22.81 16789 403876 24.06 16794 410781 24.46Jalandhar 19005 490595 25.82 19475 530596 27.24 19514 504242 25.84Ludhiana 5256 134659 25.62 5414 144657 26.72 5424 138008 25.44Ferozepur 945 20922 22.14 973 21544 22.14 984 22784 23.15Amritsar 4974 126539 25.44 5023 127805 25.44 5076 129215 25.46Gurdaspur 1074 24933 23.21 1106 25680 23.22 1114 26085 23.42Kapurthala 6990 177896 22.45 7200 187898 26.10 7240 184026 25.42Bathinda 5985 150433 25.13 6056 152456 25.14 6084 148583 24.42Sangrur 335 7556 22.55 345 7783 22.56 349 8325 23.85Patiala 4110 99725 24.26 4233 102718 24.27 4244 105005 24.74Ropar 858 19262 22.45 884 19848 22.45 894 20986 23.47Faridkot 345 7414 21.49 350 7522 21.49 354 7970 22.51Mansa 155 3211 20.71 160 3314 20.71 172 3924 22.82F.G. Sahib 3842 98793 25.72 3955 101707 25.72 3966 98412 24.81Moga 5500 138243 25.13 5605 148242 26.17 5742 145904 25.41Mukatsar 160 3397 21.23 165 3503 21.23 182 4066 22.34Nzwanshehar 2174 53230 24.48 2239 54824 24.49 2248 55119 24.52Mohali 1250 30351 24.28 1288 31277 24.28 1304 31700 24.31Taran Tarn 780 18310 23.47 803 18850 23.47 874 21077 24.12Barnala 956 21759 22.76 985 22419 22.76 1014 22146 21.84Total 81082 2001104 24.68 83117 2116520 25.46 83573 2088358 24.99
Uttar Pradesh
Division 2008-09 2009-10 2010-11A P Y A P Y A P Y
Saharanpur 2477 50892 20.546 2347 58187 24.792 3011 73453 24.395Meerut 17192 358453 20.850 17444 393118 22.536 16896 360949 21.363Agra 122194 2960937 24.231 123279 3333209 27.038 133672 3699484 27.676Aligarh 65918 1471564 22.324 69179 1938609 28.023 81481 2301473 28.246Bareilly 28915 431990 14.940 25745 590101 22.921 28316 581327 20.530Muradabad 17286 361018 20.885 13832 334223 24.163 15558 378651 24.338
Contd...
Page 129
Indian Institute of Vegetable Research
114
Division 2008-09 2009-10 2010-11A P Y A P Y A P Y
Kanpur 106148 2481171 23.375 107443 2716589 25.284 110152 2619191 23.778Allahabad 28340 458428 16.176 29763 566122 19.021 30130 617334 20.489Jhansi 1314 26997 20.546 1181 29279 24.792 1323 32275 24.395Chitrakoot Dham 643 13211 20.546 650 16115 24.792 779 19004 24.395Varanasi 21977 301898 13.737 22138 479133 21.643 23161 409116 17.664Mirzapur 3436 70596 20.546 3676 91135 24.792 3962 96653 24.395Azamgarh 13720 270133 19.689 14562 306428 21.043 15723 468011 29.766Gorakhpur 10320 120630 11.689 9946 246581 24.792 10706 191691 17.905Basti 6066 124632 20.546 6220 154206 24.792 6392 155933 24.395Shri Patan devi 7566 155451 20.546 7182 178056 24.792 7464 182084 24.395Lucknow 34510 595884 17.267 34286 836338 24.393 37562 728214 19.387Faziabad 29615 381471 12.881 29431 582469 19.791 30245 661730 21.879Total 517637 10635356 20.546 518304 12849898 24.792 556533 13576573 24.395
(Source: State Horticulture Mission, Government of Uttar Pradesh)
West Bengal
District 2007-08 2008-09 2009-10A P Y A P Y A P Y
Darjeeling 7174 109189 15.22 7318 123995 16.94 7600 149374 19.65Jalpaiguri 32507 905789 27.86 30087 506684 16.84 32326 904993 28.00Coochbehar 18639 478949 25.69 27505 340272 12.37 27877 845019 30.31Uttar Dinajpur 8705 247306 28.41 9054 166522 18.39 9693 282039 29.10Dakhin Dinajpur 3884 92451 23.80 4841 86286 17.82 5379 151092 28.09Malda 2877 75975 26.41 3565 52674 14.77 4416 151832 34.38Murshidasbad 14667 269918 18.40 12203 119996 9.83 11899 370671 31.15Nadia 5572 114188 20.49 5039 85192 16.91 5008 153624 30.67North 24-Parganas 10706 233062 21.77 6914 126976 18.36 7593 254965 33.58South-24-Parganas 2798 49465 17.68 2587 47973 18.54 3008 63657 21.16Howrah 8032 231271 28.79 6644 66045 9.94 6715 242614 36.13Hooghly 94824 2465212 26.00 94759 881590 9.30 91290 3434459 37.62Burdwan 54359 1332880 24.52 55655 495783 8.91 55166 2268242 41.12Birbhum 17798 393540 22.11 18702 140142 7.49 17671 613243 34.70Bankura 41900 941729 22.48 32649 233454 7.15 32814 1350135 41.14Purulia 1123 9322 8.30 767 16512 21.53 1187 24924 21.00Paschim Midnapur 70653 1874358 26.53 63622 557342 8.76 62679 2448136 39.06Purba Midnapur 4568 76242 16.69 4070 73751 18.12 4560 129110 28.31Total 400786 9900846 24.70 385981 4121189 10.68 386881 13838129 35.77
Page 130
Vegetable Statistics
115
Tabl
e 4.
6: I
ndia
’s tr
ade
in p
otat
o(Q
uant
ity in
t; V
alue
in ‘0
00 U
S$; U
nit v
alue
in U
S$/t)
Year
Expo
rtIm
port
Expo
rt%
sha
re in
Expo
rt%
sha
re in
Uni
tIm
port
% s
hare
inIm
port
% s
hare
inU
nit
Qua
ntity
wor
ld e
xpor
tVa
lue
wor
ld e
xpor
tVa
lue
Qua
ntity
wor
ld im
port
Valu
ew
orld
impo
rtVa
lue
1961
8786
0.32
870
0.61
99.0
213
250.
0519
60.
1214
7.92
1962
1140
00.
3412
610.
5411
0.61
1151
0.03
163
0.06
141.
6219
6317
558
0.60
1457
0.82
82.9
882
70.
0312
20.
0614
7.52
1964
427
0.01
530.
0312
4.12
2428
0.07
335
0.16
137.
97
1965
2036
0.05
232
0.10
113.
9515
980.
0419
20.
0712
0.15
1966
1467
0.04
129
0.05
87.9
379
90.
0262
0.02
77.6
0
1967
593
0.02
670.
0311
2.98
3018
0.09
309
0.12
102.
39
1968
1606
0.05
134
0.07
83.4
412
720.
0414
60.
0711
4.78
1969
2794
0.08
201
0.08
71.9
413
070.
0410
10.
0477
.28
1970
583
0.02
570.
0297
.77
2182
0.06
179
0.05
82.0
3
1971
2292
0.07
196
0.10
85.5
171
00.
0210
80.
0415
2.11
1972
3128
0.06
285
0.08
91.1
110
020.
0211
70.
0311
6.77
1973
3810
0.10
301
0.07
79.0
044
80.
0147
0.01
104.
9119
7437
660.
1040
10.
0910
6.48
383
0.01
790.
0220
6.27
1975
1218
70.
3112
080.
2199
.12
758
0.02
870.
0111
4.78
1976
5206
31.
1975
330.
6914
4.69
1085
0.03
118
0.01
108.
76
1977
1821
50.
3925
660.
2814
0.87
934
0.02
159
0.01
170.
24
1978
2077
0.05
283
0.04
136.
2539
00.
0176
0.01
194.
87
1979
2236
10.
4830
150.
3513
4.83
232
0.01
290.
0012
5.00
1980
1025
50.
2121
330.
2320
8.00
534
0.01
131
0.01
245.
32
1981
7218
0.15
1344
0.15
186.
2040
80.
0199
0.01
242.
65
1982
7025
0.14
1428
0.15
203.
2719
80.
0021
0.00
106.
06
1983
2499
0.05
527
0.07
210.
8837
0.00
330.
0089
1.89
1984
3942
0.08
674
0.07
170.
9840
90.
0111
90.
0129
0.95
1985
3968
0.08
628
0.10
158.
270.
000.
00C
ontd
...
Page 131
Indian Institute of Vegetable Research
116
Year
Expo
rtIm
port
Expo
rt%
sha
re in
Expo
rt%
sha
re in
Uni
tIm
port
% s
hare
inIm
port
% s
hare
inU
nit
Qua
ntity
wor
ld e
xpor
tVa
lue
wor
ld e
xpor
tVa
lue
Qua
ntity
wor
ld im
port
Valu
ew
orld
impo
rtVa
lue
1986
1891
0.03
418
0.05
221.
0536
90.
0151
0.01
138.
2119
8731
700.
0555
30.
0517
4.45
238
0.00
330.
0013
8.66
1988
2998
0.05
356
0.03
118.
750.
000.
00
1989
4355
0.06
713
0.06
163.
720.
000.
00
1990
2496
0.04
414
0.03
165.
870.
000.
00
1991
4692
0.06
355
0.02
75.6
622
0.00
20.
0090
.91
1992
5674
0.07
461
0.03
81.2
532
0.00
20.
0062
.50
1993
7449
0.10
753
0.06
101.
0944
0.00
20.
0045
.45
1994
2581
40.
3242
820.
2416
5.88
560.
004
0.00
71.4
3
1995
3560
90.
4861
060.
2617
1.47
313
0.00
130.
0041
.53
1996
2540
90.
3549
760.
3019
5.84
773
0.01
850.
0010
9.96
1997
2131
60.
3125
670.
2012
0.43
2926
0.04
506
0.03
172.
93
1998
8262
0.10
1348
0.08
163.
1661
0.00
40.
0065
.57
1999
3670
70.
4641
600.
2311
3.33
180.
001
0.00
55.5
6
2000
2536
10.
3329
260.
2311
5.37
1192
0.01
107
0.01
89.7
7
2001
1153
10.
1410
640.
0792
.27
183
0.00
110.
0060
.11
2002
3006
60.
3728
910.
1896
.16
00.
000
0.00
2003
7294
10.
8066
700.
3691
.44
2329
0.02
264
0.01
113.
35
2004
6715
90.
7473
220.
3310
9.02
4813
0.05
609
0.03
126.
53
2005
7837
80.
8897
470.
5212
4.36
2408
0.03
449
0.02
186.
4620
0692
184
0.95
1346
90.
5014
6.11
470.
0010
0.00
212.
77
2007
8162
70.
7811
021
0.32
135.
0212
00.
0030
0.00
250.
00
2008
1963
901.
9129
390
0.86
149.
650
0.00
00.
00
2009
9663
30.
9516
401
0.54
169.
720
0.00
00.
00
2010
1738
641.
5328
624
0.79
164.
630
0.00
00.
00
(Sou
rce:
ww
w.fa
osta
t.fao
.org
)
Page 132
Vegetable Statistics
117
Tomato
Table 4.7: Area, production and yield of tomatoes
Years World IndiaArea Production Yield Area Production Yield
(Million ha) (Million t) (t/ha) (000’ha) (000’t) (t/ha)
1961 1.68 27.62 16.4 50 464 91962 1.72 29.13 17.0 52 480 91963 1.68 28.16 16.7 53 495 91964 1.71 29.83 17.5 55 510 91965 1.68 30.46 18.1 57 525 91966 1.74 31.78 18.3 58 540 91967 1.78 33.46 18.8 60 560 91968 1.83 35.33 19.3 62 580 91969 1.83 34.56 18.9 63 600 101970 1.86 35.88 19.3 65 620 101971 1.90 37.72 19.9 67 640 101972 1.97 38.45 19.5 69 650 91973 2.04 41.63 20.4 70 660 91974 2.13 44.78 21.0 90 750 81975 2.21 47.05 21.3 100 830 81976 2.19 45.04 20.6 115 1050 91977 2.28 47.08 20.7 120 1020 91978 2.35 50.75 21.6 100 950 101979 2.45 54.84 22.4 150 1300 91980 2.44 52.65 21.5 160 1500 91981 2.48 54.31 21.9 190 1800 91982 2.52 57.58 22.9 180 1750 101983 2.57 59.55 23.2 200 2000 101984 2.65 64.08 24.2 230 2100 91985 2.72 65.35 24.1 260 2300 91986 2.68 65.22 24.3 250 2280 91987 2.77 66.09 23.8 294 2387 81988 2.82 67.38 23.9 236 3103 131989 3.04 74.61 24.6 344 4600 131990 2.90 76.31 26.3 290 4603 161991 2.86 76.09 26.6 289 4244 151992 2.94 74.99 25.5 309 4850 161993 3.02 77.91 25.8 310 5000 161994 3.15 83.13 26.4 350 4930 141995 3.27 87.44 26.7 350 5260 151996 3.42 93.54 27.4 351 6000 17
Contd...
Page 133
Indian Institute of Vegetable Research
118
Years World IndiaArea Production Yield Area Production Yield
(Million ha) (Million t) (t/ha) (000’ha) (000’t) (t/ha)
1997 3.40 89.83 26.4 400 7000 181998 3.68 95.98 26.1 410 6180 151999 3.98 109.12 27.4 470 8270 182000 4.03 110.03 27.3 460 7430 162001 3.99 107.94 27.1 460 7240 162002 4.14 116.14 28.0 458 7462 162003 4.18 119.04 28.5 479 7617 162004 4.46 127.56 28.6 503 8126 162005 4.56 127.92 28.0 505 8825 172006 4.63 131.19 28.1 546 9820 182007 4.26 137.69 32.8 596 10055 172008 4.23 141.07 33.3 566 10303 182009 4.54 154.39 33.9 599 11149 192010 4.53 152.06 33.6 634 12433 192011 4.73 159.02 33.6 865 16826 19ACGR for last ten 0.58 3.53 2.93 5.60 8.08 2.34years (2002-2011)
(Source: www.faostat.fao.org)
Table 4.8: Major tomato producing countries in the world (2010-11)
Country Area % share to total area Production % share to total tomato Productivity(000’ha) under tomato in the world (000’t) production in world (t/ha)
China 871.2 19.0 41879.7 27.8 48.1
India 865.0 18.9 16826.0 11.2 19.5
USA 159.2 3.5 12902.0 8.6 81.0
Turkey 304.0 6.6 10052.0 6.7 33.1
Egypt 216.4 4.7 8545.0 5.7 39.5
Italy 118.8 2.6 6024.8 4.0 50.7
Iran 147.0 3.2 5256.1 3.5 35.8
Spain 58.3 1.3 4310.7 2.9 74.0
Brazil 60.8 1.3 3691.3 2.5 60.7
Mexico 98.2 2.1 2997.7 2.0 30.5
Others 1683.6 36.7 38026.6 25.3 22.6
Total 4582.4 100.0 150513.8 100.0 32.8
(Source: NHB, National Horticulture Database 2011)
Page 134
Vegetable Statistics
119
Table 4.9: Percent share in area production and productivity of tomato in India
Year Area % of total Production % of total Productivity(000’ha) area under (000’t) vegetable (t/ha)
vegetables production
1987-88 237.3 5.8 3330.5 6.8 14
1991-92 289.1 5.2 4243.4 7.2 14.7
1992-93 305.6 6.1 4549.6 7.1 14.9
1993-94 345.9 7.1 4934 7.5 14.3
1994-95 351.8 7 5261.3 7.8 15
1995-96 355.7 6.7 5442 7.6 15.3
1996-97 391.2 7.1 5787.8 7.7 14.8
1997-98 413.7 7.4 6183.7 8.5 14.9
1998-99 466.3 7.8 8271.8 9.4 17.7
1999-00 456.5 7.6 7426.8 8.2 16.3
2000-01 460.1 7.4 7242.4 7.7 15.7
2001-02 458.1 7.4 7462.3 8.4 16.3
2002-03 478.8 7.9 7616.7 9 15.9
2003-04 502.8 8 8125.6 8.7 16.2
2004-05 505.4 7.5 8825.4 8.7 17.5
2005-06 546.1 7.6 9820.4 8.9 18
2006-07 596 7.9 10055 8.7 16.9
2007-08 566 7.2 10303 8 18.2
2008-09 599 7.5 11149 8.6 18.6
2009-10 634.4 7.9 12433.2 9.3 19.6
2010-11 865 10.2 16826 11.5 19.5
(Source:www.indiastat.com)
Page 135
Indian Institute of Vegetable Research
120
Tabl
e 4.
10:S
tate
-wis
e ar
ea, p
rodu
ctio
n an
d yi
eld
of to
mat
o in
Ind
ia f
rom
200
1-02
to 2
010-
11
[Are
a (A
): 00
0’ha
, Pro
duct
ion
(P):
000’
t; Yi
eld
(Y):
t/ha]
Stat
es/U
Ts20
01-0
220
02-0
320
03-0
420
04-0
520
05-0
6A
PY
AP
YA
PY
AP
YA
PY
And
hra
Prad
esh
74.4
744.
010
79.4
794.
010
77.1
925.
212
69.5
1251
.018
76.5
1453
.519
Ass
am13
.731
9.2
23.3
13.9
323.
923
.314
326.
223
.314
.233
0.9
23.3
-33
0.2
-Bi
har
4775
2.0
1647
.275
5.2
1645
.358
8.9
1346
736.
016
4672
7.2
15.8
Chh
attis
garh
18.3
292.
816
19.2
288.
015
20.2
303.
015
20.7
217.
410
.529
.221
7.6
12.5
Dad
ra &
Nag
ar-
--
--
--
--
0H
aval
iD
elhi
--
--
--
--
-33
.6G
ujar
at20
.926
9.6
12.9
18.8
321.
517
.118
.832
1.5
17.1
22.8
421.
818
.529
.342
1.9
22.2
Har
yana
--
--
-13
.822
0.8
1617
.121
9.7
15H
imac
hal P
rade
sh-
--
--
--
--
301
Jam
mu
& K
ashm
ir-
--
--
--
--
60.3
Jhar
khan
d-
--
--
--
--
NA
Kar
nata
ka40
.211
41.7
28.4
35.5
955.
026
.937
1024
.927
.743
.211
40.5
26.4
44.5
1106
.926
.7M
adhy
a Pr
ades
h-
--
--
--
2131
5.0
1520
.430
6.7
15M
ahar
asht
ra35
.611
81.9
33.2
31.2
836.
226
.832
.189
2.4
27.8
33.5
884.
426
.435
987
28.2
Man
ipur
--
--
--
--
--
--
-9.
7-
Miz
oram
--
--
--
--
--
--
-0.
5-
Nag
alan
d-
--
--
--
--
--
--
NA
-O
dish
a56
672.
012
100
1320
.013
.210
0.2
1332
.713
.310
0.3
1334
.013
.310
0.4
1330
.813
.3Pu
duch
erry
--
--
--
--
--
--
-2.
7-
Punj
ab-
--
--
--
--
--
--
187.
3-
Raja
stha
n-
--
--
--
--
--
--
54.5
-Si
kkim
--
--
--
--
--
--
-0
-Ta
mil
Nad
u-
--
--
--
--
25.3
321.
312
.722
321.
512
.6Tr
ipur
a-
--
--
--
--
--
NA
Utta
r Pr
ades
h-
--
--
--
--
--
194.
4U
ttara
khan
d-
--
--
--
--
--
95W
est B
enga
l43
.759
0.0
13.5
44.6
628.
914
.147
.674
7.3
15.7
46.1
696.
115
.150
679.
817
.2O
ther
s10
8.3
0.0
890.
012
4.5
1992
.016
63.3
1291
.320
.464
.1-
15To
tal I
ndia
458.
159
63.2
18.4
478.
862
22.5
18.0
516.
884
54.0
18.1
519.
791
60.4
17.8
534.
590
41.8
17.7
Tabl
e co
ntin
ues
Page 136
Vegetable Statistics
121
Stat
es/U
Ts20
06-0
720
07-0
820
08-0
920
09-1
020
10-1
1A
PY
AP
YA
PY
AP
YA
PY
And
hra
Prad
esh
81.1
1540
.919
74.1
1408
.119
74.1
1408
.119
8716
52.1
1929
6.3
5926
.21
20A
ssam
0-
--
0-
15.6
297.
1-
-37
9.5
--
387.
24-
Biha
r46
.291
0.14
19.7
46.2
921.
920
46.4
1037
.222
.446
.510
43.7
22.4
46.8
1056
.24
22.6
Chh
attis
garh
75.6
476.
286.
337
.740
4.1
10.7
39.2
420.
410
.741
.360
0.6
14.5
42.9
627.
8714
.6D
adra
& N
agar
--
-1.
8-
0.35
1.8
0.4
1.8
-1.
8H
aval
iD
elhi
--
-31
.4-
1.7
351.
735
-30
.95
Guj
arat
28.5
675.
4523
.730
.873
9.6
2430
.574
6.2
24.4
33.8
841.
324
.938
.897
8.44
25.2
Har
yana
22.5
0-
202.
3-
2231
6.3
22.7
379.
8-
392.
36H
imac
hal P
rade
sh-
--
317.
7-
9.6
336.
39.
638
3.8
-38
8.43
Jam
mu
& K
ashm
ir-
--
37-
3.5
79.3
8.1
122.
1-
136.
59Jh
arkh
and
15.4
308
2017
.535
0.2
2021
.843
6.1
2021
.843
6.2
2022
.340
1.56
18K
arna
taka
45.8
1309
.828
.650
.914
98.8
29.5
53.4
1573
.829
.548
.315
8032
.751
.217
56.7
34.3
Mad
hya
Prad
esh
2233
015
22.7
340.
515
3045
0.6
-35
.329
1.6
--
346.
91-
Mah
aras
htra
30.7
681.
5422
.232
.271
5.3
22.2
3373
2.3
22.2
5011
12.5
22.3
5273
814
.2M
anip
ur-
--
15.1
-1.
823
.11.
823
.1-
28.5
7M
izor
am-
--
0.3
-0.
65
0.6
6.7
-6.
18N
agal
and
--
-4
-0.
74
0.7
4-
4O
dish
a10
0.6
1337
.913
.310
0.7
1344
.213
.310
1.1
1360
.513
.510
2.9
1394
.713
.696
.613
67.1
714
.1Pu
duch
erry
--
-0.
4-
0.1
0.7
0.1
0.7
-0.
07Pu
njab
--
-20
2.3
-6.
114
8.9
6.2
151
-15
4.46
Raja
stha
n-
--
55.5
-12
.645
.517
37.5
-67
.47
Sikk
im-
--
4.4
-1.
17.
10
0-
8.05
Tam
il N
adu
23.8
0-
307
-26
.533
4.6
27.1
519.
119
.927
.258
0.59
21.4
Trip
ura
--
-28
.7-
1.3
24.9
1.3
29.6
-30
.15
Utta
r Pr
ades
h-
--
323.
2-
5.8
232.
16.
225
2.9
-24
8.63
Utta
rakh
and
--
-92
.2-
7.6
92.5
7.6
95.6
-97
.08
Wes
t Ben
gal
5187
2.1
17.1
51.1
956.
718
.752
.399
9.7
19.1
53.5
1050
19.6
54.1
1063
.65
19.6
Oth
ers
--
16.3
125.
119
6315
.714
7.2
2434
.716
.512
3.2
2203
17.9
136.
623
30.1
17.1
Tota
l Ind
ia54
3.2
8442
.318
.358
9.0
1226
5.7
18.9
745.
913
583.
819
.775
4.7
1462
7.9
20.6
864.
819
155.
520
.1
(Sou
rce:
ww
w.in
dias
tat.c
om)
Page 137
Indian Institute of Vegetable Research
122
Table 4.11: District-wise area production and yield of tomato
Andhra Pradesh (2006-07)
Districts Area (ha) Production (t) Yield (t/ha)
Srikakulam 348 6612 19Vijaya Nagaram 585 11115 19Vishakhapatnam 2408 45752 19East Godavari 962 18278 19West Godavari 458 8702 19Krishna 1707 32433 19Guntur 778 14782 19Prakasam 16000 304000 19Nellore 60 1140 19Coastal Area 23306 442814 19Chittoor 13529 257051 19Cuddapa 1264 24016 19Anatapuram 632 12008 19Karnool 11050 209950 19Rayalaseema Region 26475 503025 19Andhra Region 49781 945839 19Mehaboob Nagar 3500 66500 19Ranga Reddy 6877 130663 19Medak 3790 72010 19Nizamabad 2469 46911 19Adilabad 11231 213389 19Karim Nagar 1280 24320 19Warangal 432 8208 19Khamam 1400 26600 19Nalgonda 309 5871 19Telangana Region 31288 594472 19Andhra Pradesh 81069 1540311 19
(Source: www.indiastat.com)
Bihar (2005-06)
Patna 1812 29354 16Nalanda 1853 30389 16Bhojpur 1008 15523 15Buxar 723 10990 15Rohtas 804 11738 15Kaumur 588 8350 14Gaya 872 12731 15Jehanabad 749 10935 15
Contd...
Page 138
Vegetable Statistics
123
Districts Area (ha) Production (t) Yield (t/ha)
Arwal 397 5796 15Nawadah 792 11088 14Aurangabad 1541 21574 14Saran 1556 22406 14Siwan 1318 18452 14Gopatganj 1496 21842 15Mujaffarpur 3529 56464 16E.Champaran 1758 26661 15W.Champaran 1928 29884 16SitamatTii 1482 23119 16Sheohar 561 8303 15Vaishali 3766 64762 17Darbhanga 1459 28344 19Madhubani 1238 18570 15Samastipur 1683 27770 17Begusarai 1806 29799 17Munger 609 9744 16Sheikhpura 211 3165 15Lakhisarai 204 3162 16Jamui 396 5742 15Khagaria 1078 17248 16Bhagalpur 1598 25568 16Banka 603 9045 15Saharsa 112 18032 16Supaul 509 7001 14Madhepura 1206 18693 16Pumea 884 14144 16Kisanganj 805 12880 16Araria 709 10990 16Katihar 1374 26984 20Bihar 46032 727242 16
(Source: www.indiastat.com)
Haryana (2006-07)
Panchkula 650 11200 17Ambala 1505 11035 7Yamunanagar 1895 9456 5Kurukshetra 1570 21100 13Kaithal 330 5115 16Karnal 3390 57010 17Panipat 310 3500 11
Page 139
Indian Institute of Vegetable Research
124
Districts Area (ha) Production (t) Yield (t/ha)
Sonipat 1380 22430 16Rohtak 330 4350 13Jhajjar 530 6740 13Faridabad 830 17000 20Narnual 335 3125 9Rewari 305 6000 20Gurgaon 3598 8077 2Bhiwani 1000 15750 16Hissar 450 9500 21Fatehabad 425 3825 9Sirsa 220 7035 32Jind 830 11510 14Mewat 2650 25000 9Haryana 22533 258758 11
(Source: www.indiastat.com)
Himachal Pradesh (2005-06)
Bilaspur 765 26775 35Chamba 123 3090 25Hamirpur 100 1796 18Kangra 345 9873 29Kinnaur 25 625 25Kullu 695 28850 42Lahual & Spiti 6 85 14Mandi 1058 31019 29Shimla 690 22080 32Sirmour 1529 49535 32Solan 3800 125400 33Una 75 2055 27Himachal Pradesh 9211 301183 33
(Source: www.indiastat.com)
Odisha (2006-07)
Balasore 2803 37224 13Bhadrak 3704 49189 13Bolangir 4559 60544 13Sonepur 2064 27410 13Cuttack 3050 40504 13J.S. Pur 3389 44938 13Jaipur 737 9787 13
Contd...
Page 140
Vegetable Statistics
125
Districts Area (ha) Production (t) Yield (t/ha)
Kendrapara 4354 57821 13Dhenkanal 5551 73717 13Angul 4445 59207 13Ganjam 5459 72496 13Gajapati 2356 31217 13Keonjhar 15050 201519 13Kalahandi 6859 91293 13Khariar 2301 30511 13Koraput 1729 22996 13Malkangiri 1697 22536 13N.W. Pur 754 10013 13Rayagade 2327 30903 13Phulbani 3026 40185 13Boudh 2053 26997 13Mayurbhanj 6446 85603 13Puri 1262 16759 13Khurda 7331 97356 13Nayagarh 2119 28140 13Sambalpur 1221 16215 13Deogarh 184 2444 13Bargarh 295 3944 13Jharsuguda 272 3604 13Sundargarh 3193 42403 13Odisha 100590 1337475 13
(Source: www.indiastat.com)
Punjab (2005-06)
Districts Area (ha) Production (t) Yield (t/ha)
Hoshiarpur 174 4002 23Jalandhar 823 20830 25Ludhiana 308 7796 25Ferozepur 223 5515 25Amritsar 1538 38396 25Gurdaspur 312 7103 23Kapurthala 1820 43462 24Bathinda 121 2720 22Sangrur 223 5060 23Patiala 1166 28666 25Ropar 146 3410 23Faridkot 41 982 24Mansa 22 519 24
Contd...
Page 141
Indian Institute of Vegetable Research
126
Districts Area (ha) Production (t) Yield (t/ha)
Fatehgarh Sahib 432 9344 22Moga 14 303 22Mukatsar 13 312 24Nzwanshehar 644 15427 24Punjab 8020 193847 24
(Source: www.indiastat.com)
Tamil Nadu (2005-06)
Coimbatore 4846 50896 10.5Cuddalore 8 101 12.63Dharmapuri 2761 70476 25.53Dindigul 2489 26264 10.55Erode 542 4612 8.51Kancheepuram 33 417 12.64Kanyakumari 8 101 12.63Karur 110 1389 12.63Krishnagiri 3728 47073 12.63Madurai 501 7228 14.43Nagapattinam 1 13 13.00Namakkal 285 2839 9.96Perambalur 101 1275 12.62Pudukottai 5 63 12.6Ramanathapuram 9 114 12.67Salem 1737 14421 8.3Sivagangai 6 76 12.67Thanjavur 1 13 13.00The Nilgiris 1 13 13.00Theni 2394 20543 8.58Thiruchirapalli 332 8802 26.51Thirunelveli 819 10341 12.63Thiruvallur 6 76 12.67Thiruvannamalai 155 1044 6.74Thiruvarur 1 13 13.00Thoothukudi 302 3041 10.07Vellore 615 3971 6.46Villupuram 17 215 12.65Virudhunagar 182 2298 12.63Tamil Nadu 21995 277728 12.63
(Source: www.indiastat.com)
Page 142
Vegetable Statistics
127
Uttar Pradesh (2005-06 to 2010-11)[Area (A) in ha; Production (P) in t; Yield (Y) in t/ha]
District/division 2008-09 2009-10 2010-11A P Y A P Y A P Y
Saharanpur 41 1464 36 38 1372 36 41 1572 38Meerut 723 27882 39 488 17126 35 521 18303 35Agra 788 34904 44 943 41276 44 1018 35382 35Aligarh 840 33187 40 957 38262 40 1033 36692 36Bareilly 75 2965 40 72 2857 40 78 3555 46Muradabad 60 2256 38 59 2226 38 64 2447 38Kanpur 806 34260 43 759 32988 43 818 35805 44Allahabad 199 7056 35 196 8072 41 212 6734 32Jhansi 328 15117 46 349 15794 45 377 16364 43Chitrakoot Dham 186 7808 42 197 8249 42 213 9484 45Varanasi 196 6339 32 223 7290 33 241 7855 33Mirzapur 98 2918 30 197 5879 30 213 6225 29Azamgarh 65 1914 29 106 3137 30 114 3462 30Gorakhpur 125 3659 29 185 5633 30 200 4403 22Basti 42 1157 28 48 1453 30 52 1569 30Shri Patan devi 151 4283 28 157 4842 31 169 5350 32Lucknow 654 24355 37 746 28850 39 807 31159 39Faziabad 529 22473 42 480 20591 43 519 22272 43Total U.P. 5906 233997 40 6200 245897 40 6690 248633 37
(Source: State Horticulture Mission, Government of Uttar Pradesh)
West Bengal (2005-06)
Districts Area (ha) Production (t) Yield (t/ha)
Darjeeling 0.8 14.3 17.9Jalpaiguri 4.7 74.5 15.9Coochbehar 4.0 160.2 40.1North Dinajpur 2.0 24.0 12.0South Dinajpur 2.1 35.7 17.0Malda 2.4 35.6 14.8Murshidabad 4.2 55.2 13.1Nadia 4.8 69.5 14.5North 24-Parganas 2.9 68.7 23.7South 24-Parganas 4.2 76.5 18.2Howrah 0.6 8.7 14.5Hooghly 0.9 14.9 16.6Burdwan 2.6 35.9 13.8Birbhum 1.7 26.3 15.5Bankura 3.1 50.5 16.3Purulia 4.8 60.4 12.6Midnapur (West) 2.1 31.6 15.0Midnapur (East) 1.3 14.2 10.9West Bengal 49.9 857.1 17.2
(Source: www.indiastat.com)
Page 143
Indian Institute of Vegetable Research
128
Tabl
e 4.
12: M
onth
ly w
hole
sale
pri
ce in
dex
(WPI
) of
tom
ato
in I
ndia
. (Ba
se y
ear:
1981
-82;
199
3-94
; 200
4-05
=100
){A
pril
1990
to D
ecem
ber
1992
and
Sep
tem
ber
1993
to Ju
ly 2
012}
Year
Jan.
Feb.
Mar
.A
pr.
May
Jun.
Jul.
Aug
.Se
pt.
Oct
.N
ov.
Dec
.
1981
-82=
100
1990
N.A
.N
.A.
N.A
.N
.A.
260.
919
3.1
199.
527
9.2
278.
619
9123
9.6
198.
418
9.3
N.A
.N
.A.
N.A
.N
.A.
576.
537
8.0
272.
824
3.6
166.
019
9213
3.4
134.
118
7.1
N.A
.N
.A.
N.A
.N
.A.
362.
528
6.3
359.
941
5.9
369.
419
9331
6.8
252.
543
0.9
311.
1
1993
-94=
100
1994
177.
914
9.1
178.
8N
.A.
N.A
.N
.A.
N.A
.13
8.2
115.
012
6.2
133.
593
.919
9596
.479
.776
N.A
.N
.A.
N.A
.N
.A.
168.
014
2.3
153.
617
1.2
137.
319
9684
89.7
71.9
N.A
.N
.A.
N.A
.N
.A.
193.
617
7.3
136.
216
4.4
159.
019
9711
6.7
125.
891
.6N
.A.
N.A
.N
.A.
N.A
.12
9.7
158.
523
5.8
201.
014
2.7
1998
174.
611
6.1
122.
5N
.A.
N.A
.N
.A.
N.A
.19
1.2
184.
423
2.5
360.
927
8.4
1999
115.
966
54.8
N.A
.N
.A.
N.A
.N
.A.
201.
812
3.7
140.
518
4.5
119.
020
0077
.987
.410
2.6
N.A
.N
.A.
N.A
.N
.A.
124.
613
1.7
203.
719
7.6
146.
220
0111
2.2
102
84.1
N.A
.N
.A.
N.A
.N
.A.
237.
917
0.9
141.
818
3.5
209.
020
0214
3.1
113.
112
2.3
N.A
.N
.A.
N.A
.N
.A.
204.
816
4.1
165.
213
6.9
79.2
2003
72.2
84.9
79.4
N.A
.N
.A.
N.A
.N
.A.
153.
414
7.4
189.
818
0.9
138.
320
0412
8.2
105.
880
.9N
.A.
N.A
.N
.A.
N.A
.21
4.1
150.
717
0.3
165.
513
0.9
2006
153.
292
.386
.4N
.A.
N.A
.N
.A.
N.A
.16
9.4
163.
617
4.9
160.
118
6.7
2007
188.
914
1.1
126.
5N
.A.
N.A
.N
.A.
N.A
.24
9.6
228.
915
9.3
160.
413
4.3
2008
129.
813
7.7
173.
3N
.A.
N.A
.N
.A.
N.A
.21
7.5
222.
123
3.1
258.
016
3.3
2009
186.
316
3.7
159.
2N
.A.
N.A
.N
.A.
N.A
.25
5.1
216.
417
2.3
269.
223
1.2
2010
186.
511
4.6
97.2
N.A
.N
.A.
N.A
.N
.A.
251.
1
2004
-05=
100
2005
N.A
.N
.A.
N.A
.N
.A.
131.
416
1.1
131.
116
1.4
112.
020
0689
.886
.878
.8N
.A.
N.A
.N
.A.
N.A
.12
4.3
132.
313
2.8
122.
915
0.6
2007
140.
310
7.2
94.1
N.A
.N
.A.
N.A
.N
.A.
181.
014
4.2
126.
712
6.3
90.1
2008
84.6
102.
913
4.8
N.A
.N
.A.
N.A
.N
.A.
135.
516
7.8
232.
225
3.3
136.
620
0911
7.2
92.5
90.8
N.A
.N
.A.
N.A
.N
.A.
201.
115
4.4
149.
921
3.9
174.
720
1015
0.0
93.6
90.9
N.A
.N
.A.
N.A
.N
.A.
220.
823
9.6
193.
014
3.4
218.
520
1127
4.6
124.
510
8.7
N.A
.N
.A.
N.A
.N
.A.
172.
018
3.0
276.
627
6.9
125.
920
1210
6.2
134.
120
0.4
N.A
.N
.A.
N.A
.N
.A.
(Sou
rce:
ww
w.in
dias
tat.c
om)
Page 144
Vegetable Statistics
129
Tabl
e 4.
13: M
onth
ly a
vera
ge w
hole
sale
pri
ce (W
P) a
nd a
rriv
al (A
R) o
f to
mat
o du
ring
the
peri
od J
anua
ry to
Dec
embe
r, 20
11
(Ave
rage
who
lesa
le p
rice
in `
/q a
nd A
rriv
al in
t)
Mar
ket
Jan
Feb
Mar
chA
pril
May
June
July
Aug
Sept
Oct
Nov
Dec
Tota
lW
PA
RW
PA
RW
PA
RW
PA
RW
PA
RW
PA
RW
PA
RW
PA
RW
PA
RW
PA
RW
PA
RW
PA
RW
PA
R
Abo
har
1529
8915
2548
1325
130
1582
122
1120
179
1048
255
1712
253
1226
356
1338
270
1961
212
1800
151
1108
364
1440
2429
Agr
a16
4627
010
8125
714
2027
410
1134
279
444
210
1641
015
1347
610
9547
011
7258
521
5536
420
6673
870
060
1307
4708
Ahm
edab
ad15
7459
6657
439
1553
764
6159
455
1854
757
6776
853
0310
6050
4068
254
3183
359
6611
9137
8287
442
6441
845
3680
461
949
Am
rits
ar22
9537
895
969
310
0258
297
560
248
655
531
887
115
0447
811
6054
311
2964
518
1444
114
4849
475
876
011
5470
42Ba
ngal
ore
1831
3511
540
4637
555
4270
532
3134
873
3033
928
3483
500
4642
333
5013
528
4698
1047
2367
1613
2547
870
3282
846
4461
7Ba
raut
881
114
1719
8014
0695
1527
8921
8376
2031
8316
2553
7Bh
opal
1766
1964
796
2843
656
3361
379
3617
489
3615
947
3108
1398
2536
708
3195
956
2960
1415
3036
894
6145
374
4209
898
4057
9Bh
uban
esw
ar17
9085
583
213
3088
471
576
860
010
2073
511
2710
6012
2813
2510
7112
5413
8216
0520
8212
1017
2015
5597
325
3012
4014
774
Cha
ndig
arh
1558
713
1008
874
1110
965
1167
842
800
1236
694
1284
1292
1412
1229
969
1225
1022
1987
827
1570
903
841
1107
1207
1215
4C
henn
ai20
9356
4078
364
3056
264
2052
043
3085
651
6080
344
7260
352
7072
591
8511
7996
1015
8540
6520
7236
1010
4654
3910
6969
631
Deh
radu
n27
6940
086
334
893
546
111
6441
450
761
161
743
410
3477
792
012
1013
5472
617
7435
413
7334
674
163
911
7167
70D
elhi
1827
9074
842
7894
1042
1047
410
1390
2616
715
0754
710
369
1148
1135
592
510
511
1399
5418
4790
3697
812
347
469
1454
399
3116
173
Gan
gato
k18
8039
1363
3814
3238
1357
3413
3139
1411
2622
4225
2239
3018
7532
2313
3530
7938
1925
4318
7141
5G
uwah
ati
1071
641
684
631
695
632
668
415
952
455
1539
392
2867
288
2888
283
2638
373
2915
344
2809
354
1431
2063
1760
6871
Hyd
erab
ad13
8559
9060
637
0284
456
6784
519
433
1271
9212
1257
8717
353
3015
993
782
880
Jaip
ur10
8214
5892
013
0581
697
1710
4012
0825
2075
975
7687
962
9212
1932
3710
8927
0476
524
1810
4527
947
Jala
ndha
r20
6719
0613
5016
1511
2117
8511
9213
3511
6411
7564
918
0616
2114
0914
9014
0812
4316
1317
7814
0717
6729
214
0415
751
Jam
mu
2396
2006
1032
2207
1123
2575
1179
2054
692
1927
756
1464
1510
1308
1067
1283
1392
1633
2136
1530
1463
1651
898
1889
1304
2152
7K
anpu
r65
074
667
239
555
542
1094
764
1846
587
1382
1519
1138
2261
1970
303
1163
6289
Kar
nal
1383
462
1691
292
1396
336
1930
221
1993
5312
1819
012
2622
212
0733
315
5525
813
6013
811
8211
614
6726
21K
olka
ta21
7921
0712
0329
9414
0817
1885
213
1211
3222
3813
5815
6016
0636
8214
7537
8817
1638
8426
2223
2422
4928
9213
0412
4915
9230
748
Luck
now
1635
1212
526
329
1212
1137
1837
1275
1312
1740
1263
1755
2092
1139
1766
1516
1430
1010
3M
umba
i24
3369
5073
055
8774
757
8085
039
5156
749
6292
551
4710
3184
1962
575
3883
186
0615
8881
4913
4291
0385
294
4310
4383
635
Nag
pur
1821
1830
661
1830
672
2060
651
1520
958
1500
1109
1220
1068
1250
920
1950
899
2410
1467
1730
1173
2220
602
2280
1000
2153
0N
asik
2079
1850
651
2525
617
3070
663
2710
582
2915
700
2340
1059
1199
757
1770
740
4890
1014
3190
1326
2430
751
3810
912
3269
9Pa
tna
1135
550
630
595
672
815
536
1435
638
1000
1074
555
1643
295
1683
280
1395
545
2241
625
2346
565
1312
470
1267
7730
Pim
alga
on21
1122
1063
228
2561
321
8565
428
2559
623
2063
823
7510
5812
9567
029
0061
893
3010
2867
2013
3438
0289
248
0090
443
587
Pune
1953
1102
589
1331
623
1486
831
998
526
1382
720
1507
924
1347
541
1351
677
1005
1128
1152
1024
746
638
1350
848
1475
7Ra
ipur
1255
440
602
443
590
357
421
312
736
240
1067
237
1215
351
968
308
999
372
1324
275
1168
299
693
336
920
3970
Ranc
hi88
887
958
782
496
367
351
165
541
271
410
2257
413
8147
712
0251
711
6761
012
9147
512
8349
063
073
694
576
24Sh
imla
2342
129
1835
128
1459
149
1446
163
854
463
779
564
1650
290
1596
193
1711
176
2534
173
2217
171
1243
262
1639
2861
Srin
agar
2946
690
1625
1093
1363
1295
1650
950
1204
1735
1104
1605
1803
1328
651
1665
1472
675
1943
770
1760
1040
1135
1445
1538
1431
1Su
rat
2558
5508
843
5620
662
6018
668
5010
626
5690
850
5685
1262
5735
807
5823
824
6305
1435
4775
1188
5840
513
6975
1021
6878
4Tr
iven
drum
2355
212
1209
302
1037
404
1045
295
1239
346
1275
328
1162
459
1033
470
1409
3561
1666
257
2187
290
1435
559
1421
7483
(Sou
rce:
NH
B, N
atio
nal H
ortic
ultu
re D
atab
ase
2011
)
Page 145
Indian Institute of Vegetable Research
130
Tabl
e 4.
14: I
ndia
’s tr
ade
in f
resh
tom
atoe
s(Q
uant
ity in
t; V
alue
in ‘0
00 U
S$ a
nd U
nit v
alue
in U
S$/t)
Year
Expo
rtIm
port
Expo
rt%
sha
re in
Expo
rt%
sha
re in
Uni
tIm
port
% s
hare
inIm
port
% s
hare
inU
nit
Qua
ntity
wor
ld e
xpor
tVa
lue
wor
ld e
xpor
tVa
lue
Qua
ntity
wor
ld im
port
Valu
ew
orld
impo
rtVa
lue
1978
120.
005
0.00
417
00.
000
0.00
019
7919
0.00
40.
0021
10
0.00
00.
000
1980
00.
000
0.00
00
0.00
00.
000
1981
00.
000
0.00
00
0.00
00.
000
1982
10.
001
0.00
1000
00.
000
0.00
019
837
0.00
20.
0028
60
0.00
00.
000
1984
250.
007
0.00
280
00.
000
0.00
019
850
0.00
00.
000
00.
000
0.00
019
860
0.00
00.
000
00.
000
0.00
019
8714
40.
0113
0.00
900
0.00
00.
000
1988
342
0.01
128
0.01
374
00.
000
0.00
019
8980
0.00
310.
0038
80
0.00
00.
000
1990
117
0.00
400.
0034
20
0.00
00.
000
1991
880.
0054
0.00
614
00.
000
0.00
019
9233
10.
0169
0.00
208
00.
000
0.00
019
9318
70.
0120
0.00
107
00.
000
0.00
019
9410
720.
0320
10.
0118
80
0.00
00.
000
1995
646
0.02
112
0.00
173
00.
000
0.00
019
9669
00.
0211
80.
0017
10
0.00
00.
000
1997
863
0.02
112
0.00
130
00.
000
0.00
019
9864
30.
0211
40.
0017
70
0.00
00.
000
1999
1233
0.03
282
0.01
229
00.
000
0.00
020
0011
340.
0323
40.
0120
60
0.00
00.
000
2001
1413
0.03
304
0.01
215
00.
000
0.00
020
0212
886
0.30
2437
0.07
189
00.
000
0.00
020
0311
328
0.25
1472
0.03
130
320.
0020
0.00
625
2004
7427
0.15
1299
0.03
175
50.
007
0.00
1400
2005
1174
30.
2424
640.
0521
051
0.00
250.
0049
020
0633
593
0.59
7530
0.14
224
410.
0023
0.00
561
2007
1348
452.
1237
050
0.54
275
330.
0026
0.00
788
2008
1246
171.
9129
528
0.40
237
620.
0055
0.00
887
2009
1055
571.
5221
340
0.30
202
420.
0031
0.00
738
2010
6754
70.
9525
031
0.30
371
620.
0043
0.00
694
(Sou
rce:
ww
w.fa
osta
t.fao
.org
)
Page 146
Vegetable Statistics
131
Tabl
e 4.
15: I
ndia
’s tr
ade
in to
mat
o ju
ice
(Qua
ntity
in t;
Val
ue in
‘000
US$
; Uni
t val
ue in
US$
/t)
Year
Expo
rtIm
port
Expo
rt%
sha
re in
Expo
rt%
sha
re in
Uni
tIm
port
% s
hare
inIm
port
% s
hare
inU
nit
Qua
ntity
wor
ld e
xpor
tVa
lue
wor
ld e
xpor
tVa
lue
Qua
ntity
wor
ld im
port
Valu
ew
orld
impo
rtVa
lue
1984
220.
0220
0.07
909
660.
2168
0.53
1030
1985
00.
000
0.00
00
0.00
00.
000
1986
158
0.24
156
0.64
987
690.
2074
0.50
1072
1987
00.
000
0.00
07
0.02
100.
0614
2919
8821
0.03
120.
0457
10
0.00
00.
000
1989
00.
000
0.00
00
0.00
00.
000
1990
310.
0519
0.05
613
00.
000
0.00
019
910
0.00
00.
000
00.
000
0.00
019
9215
0.03
110.
0473
30
0.00
00.
000
1993
50.
017
0.03
1400
00.
000
0.00
019
9448
0.06
540.
1411
250
0.00
00.
000
1995
1361
1.20
1229
1.89
903
200.
0413
0.04
650
1996
50.
0012
0.02
2400
50.
0113
0.04
2600
1997
10.
001
0.00
1000
00.
000
0.00
019
982
0.00
10.
0050
012
20.
2072
0.22
590
1999
220.
0328
0.08
1273
181
0.29
129
0.39
713
2000
00.
000
0.00
033
80.
4928
00.
8282
820
0120
0.03
80.
0340
021
80.
3021
70.
6799
520
0213
0.02
90.
0369
226
40.
3127
90.
6910
5720
0373
0.13
530.
1972
656
0.09
460.
1282
120
0412
60.
2211
40.
3990
517
10.
2710
60.
2762
020
0546
0.08
410.
1389
151
0.07
610.
1611
9620
068
0.01
110.
0313
7558
0.07
550.
1194
820
072
0.00
20.
0010
0011
90.
1494
0.18
790
2008
600.
0873
0.13
1217
310.
0437
0.06
1194
2009
120.
0214
0.03
1167
470.
0430
0.04
638
2010
90.
0118
0.04
2000
350.
0368
0.09
1943
(Sou
rce:
ww
w.fa
osta
t.fao
.org
)
Page 147
Indian Institute of Vegetable Research
132
Tabl
e 4.
16: I
ndia
’s tr
ade
in to
mat
o pa
ste
(Qua
ntity
in t;
Val
ue in
‘000
US$
; Uni
t val
ue in
US$
/t)
Year
Expo
rtIm
port
Expo
rt%
sha
re in
Expo
rt%
sha
re in
Uni
tIm
port
% s
hare
inIm
port
% s
hare
inU
nit
Qua
ntity
wor
ld e
xpor
tVa
lue
wor
ld e
xpor
tVa
lue
Qua
ntity
wor
ld im
port
Valu
ew
orld
impo
rtVa
lue
1988
131
0.01
550.
0142
00
0.00
00.
000
1989
260.
0018
0.00
692
00.
000
0.00
0
1990
20.
003
0.00
1500
00.
000
0.00
0
1991
60.
006
0.00
1000
00.
000
0.00
0
1992
140.
0015
0.00
1071
00.
000
0.00
0
1993
40.
008
0.00
2000
00.
000
0.00
0
1994
00.
000
0.00
00
0.00
00.
000
1995
170.
0016
0.00
941
00.
000
0.00
0
1996
230.
0023
0.00
1000
00.
000
0.00
0
1997
350.
0027
0.00
771
10.
007
0.00
7000
1998
20.
003
0.00
1500
1885
0.15
1657
0.15
879
1999
340.
0012
30.
0136
182
0.00
50.
0025
00
2000
250.
0046
0.00
1840
20.
008
0.00
4000
2001
400.
0028
0.00
700
80.
0013
0.00
1625
2002
136
0.01
145
0.01
1066
878
0.05
654
0.06
745
2003
118
0.01
120
0.01
1017
3239
0.18
1933
0.16
597
2004
690.
0087
0.01
1261
2133
0.10
1242
0.08
582
2005
140
0.01
165
0.01
1179
3918
0.19
2275
0.15
581
2006
810.
0078
0.00
963
3947
0.18
2616
0.16
663
2007
650.
0084
0.00
1292
7058
0.30
4818
0.26
683
2008
139
0.01
179
0.01
1288
3227
0.14
3432
0.14
1064
2009
154
0.01
361
0.01
2344
4094
0.18
3435
0.13
839
2010
157
0.01
226
0.01
1439
6027
0.24
4822
0.18
800
(Sou
rce:
ww
w.fa
osta
t.fao
.org
)
Page 148
Vegetable Statistics
133
Tabl
e 4.
17: I
ndia
’s tr
ade
in p
eele
d to
mat
oes
(Qua
ntity
in t;
Val
ue in
‘000
US$
; Uni
t val
ue in
US$
/t)
Year
Expo
rtIm
port
Expo
rt%
sha
re in
Expo
rt%
sha
re in
Uni
tIm
port
% s
hare
inIm
port
% s
hare
inU
nit
Qua
ntity
wor
ld e
xpor
tVa
lue
wor
ld e
xpor
tVa
lue
Qua
ntity
wor
ld im
port
Valu
ew
orld
impo
rtVa
lue
1988
370.
0115
0.00
405
00.
000
0.00
0
1989
00.
000
0.00
00
0.00
00.
000
1990
00.
000
0.00
00
0.00
00.
000
1991
00.
000
0.00
00
0.00
00.
000
1992
00.
000
0.00
00
0.00
00.
000
1993
760.
0177
0.02
1013
00.
000
0.00
0
1994
00.
000
0.00
00
0.00
00.
000
1995
00.
000
0.00
00
0.00
00.
000
1996
170.
0015
0.00
882
00.
000
0.00
0
1997
108
0.01
630.
0158
30
0.00
00.
000
1998
40.
003
0.00
750
960.
0124
80.
0425
83
1999
00.
000
0.00
012
50.
0184
0.01
672
2000
152
0.02
113
0.02
743
10.
001
0.00
1000
2001
144
0.01
690.
0147
915
0.00
80.
0053
3
2002
272
0.02
169
0.03
621
50.
005
0.00
1000
2003
510.
0049
0.01
961
160.
0014
0.00
875
2004
132
0.01
750.
0156
847
70.
0526
40.
0455
3
2005
690.
0157
0.01
826
429
0.04
263
0.03
613
2006
135
0.01
870.
0164
441
80.
0427
10.
0464
8
2007
259
0.02
206
0.02
795
1141
0.09
797
0.09
699
2008
120
0.01
940.
0178
310
150.
0889
30.
0788
0
2009
244
0.02
147
0.01
602
181
0.02
156
0.01
862
2010
340
0.02
200
0.02
588
576
0.05
513
0.04
891
(Sou
rce:
ww
w.fa
osta
t.fao
.org
)
Page 149
Indian Institute of Vegetable Research
134
Table 4.19: Major destinations of tomato seed export from India
(Quantity: Kg; Value: `)
Country 2008-09 2009-10 2010-11Quantity Value Quantity Value Quantity Value
Netherland 7577 50175606 5823 67596887 10440 44243596
USA 4567 30206126 3047 52829820 4163 36878188
Pakistan 4327 15027588 38740 15871627 37481 25579293
Bangladesh 803 3172843 301 1708890 2327 15201119
Mali 0 0 2 12338 613 4288610
Italy 1394 1644778 3490 17896517 805 4170621
Sri lanka 387 1317886 60 1186485 370 2825988
Nepal 542 1206322 500 40430 141 1335573
Vietnam 196 1390765 308 2154922 162 985495
Thailand 52 550274 544 3030137 152 933858
Others 12987 31738229 5807 46986472 3657 6880483
Total 32832 136430417 58622 209314525 60311 143322824
(Source: www.agriexchange.apeda.gov.in)
Table 4.18: Major destinations of tomato export from India
(Quantity in tonnes; Value in Lakhs `)
Country 2008-09 2009-10 2010-11Quantity Value Quantity Value Quantity Value
UAE 11617.3 (9) 1425.2 (12) 10153.4 (10) 1145.6 (11) 33902.9 (50) 7468.6 (65)
Bangladesh 9166.4 (8) 848.6 (7) 17020.5 (16) 1674.8 (16) 19711.9 (29) 2048.2 (18)
Saudi Arabia 250.0 (0) 35.9 (0) 0.0 (0) 0.0 (0) 2261.5 (3) 539.4 (5)
Oman 205.8 (0) 36.8 (0) 283.2 (0) 35.3 (0) 2203.6 (3) 532.0 (5)
Pakistan 100764.7 (82) 10172.0 (80) 74716,1 (71) 7284.2 (71) 3708.9 (5) 340.6 (3)
Nepal 1434.3 (1) 111.4 (1) 2570.2 (2) 121.9 (1) 3266.6 (5) 227.3 (2)
Maldives 483.3 (0) 53.1 (0) 942.3 (1) 55.5 (1) 2447.7 (4) 169.8 (1)
Bahrain 112.5 (0) 15.0 (0) 1.0 (0) 0.2 (0) 442.3 (1) 102.2 (1)
Kuwait 155.8 (0) 23.1 (0) 0.0 (0) 0.0 (0) 125.9 (0) 29.9 (0)
Qatar 45.7 (0) 6.6 (0) 0.0 (0) 0.0 (0) 19.6 (0) 8.0 (0)
Others 381.5 (0) 38.5 (0) 174.9 (0) 7.3 (0) 92.8 (0) 14.6 (0)
Total 124617.2 (100) 12766.2 (100) 105861.6 (100) 10325.0 (100) 68183.7 (100) 11480.6 (100)
(Figures in parentheses indicate percentage to the total tomato exports)(Source: www.apeda.gov.in)
Page 150
Vegetable Statistics
135
Onion
Table 4.20: Area, production and yield of onion (dry)
Years World IndiaArea Production Yield Area Production Yield
(Million ha) (Million t) (t/ha) (000’ha) (000’t) (t/ha)
1961 1.2 14.3 11.7 120.0 1200.0 10.01962 1.2 14.4 11.7 120.0 1230.0 10.31963 1.2 14.6 11.8 120.0 1260.0 10.51964 1.2 14.7 11.9 120.0 1290.0 10.81965 1.3 15.0 11.9 125.0 1320.0 10.61966 1.2 15.4 12.3 125.0 1350.0 10.81967 1.3 16.3 12.4 150.0 1629.0 10.91968 1.3 16.5 12.6 150.0 1700.0 11.31969 1.3 17.2 12.8 160.0 1750.0 10.91970 1.3 16.7 12.5 165.0 1800.0 10.91971 1.4 17.6 12.8 177.0 1900.0 10.71972 1.4 17.2 12.5 177.0 1920.0 10.81973 1.4 18.2 12.9 182.0 1980.0 10.91974 1.4 19.2 13.2 183.4 2000.0 10.91975 1.4 18.7 12.9 194.0 2100.0 10.81976 1.5 19.5 13.4 164.1 1950.0 11.91977 1.5 21.4 13.9 187.9 2230.0 11.91978 1.6 22.3 14.1 213.8 2200.0 10.31979 1.6 23.0 14.2 244.3 2499.7 10.21980 1.6 22.4 13.9 251.4 2504.3 10.01981 1.6 23.4 14.2 250.7 2647.9 10.61982 1.7 25.0 15.1 234.9 2426.6 10.31983 1.7 24.8 14.6 270.4 2699.1 10.01984 1.7 26.1 15.1 278.2 3098.9 11.11985 1.8 27.2 15.4 280.6 2862.7 10.21986 1.8 28.0 15.8 262.2 2532.6 9.71987 1.8 28.9 15.9 274.0 2700.7 9.91988 1.9 29.4 15.7 315.2 3347.3 10.61989 1.9 29.4 15.7 301.2 3065.1 10.21990 1.9 30.6 16.2 301.9 3226.2 10.71991 1.9 31.4 16.2 323.3 3584.7 11.11992 2.1 33.6 16.3 323.5 3490.0 10.81993 2.1 34.6 16.3 367.5 4010.0 10.91994 2.2 36.2 16.2 378.6 4040.0 10.71995 2.4 39.6 16.6 384.6 4080.0 10.61996 2.4 40.5 16.8 404.0 4180.0 10.3Contd...
Page 151
Indian Institute of Vegetable Research
136
Years World IndiaArea Production Yield Area Production Yield
(Million ha) (Million t) (t/ha) (000’ha) (000’t) (t/ha)
1997 2.4 40.4 16.7 355.0 3200.0 9.0
1998 2.6 45.0 17.1 468.1 5331.9 11.4
1999 2.8 48.2 17.1 493.3 4899.5 9.9
2000 2.8 49.9 17.6 450.0 4721.1 10.5
2001 2.9 51.8 17.7 495.8 5252.1 10.62002 2.9 52.6 18.1 424.7 4209.5 9.9
2003 3.1 56.4 18.0 553.8 6267.6 11.3
2004 3.3 62.5 18.9 613.8 7760.6 12.6
2005 3.5 65.6 18.7 703.6 9432.5 13.4
2006 3.7 68.3 18.4 768.0 10847.0 14.1
2007 3.8 73.1 19.2 821.0 13900.0 16.9
2008 3.8 74.4 19.6 834.0 13565.0 16.3
2009 3.7 73.4 19.8 756.2 12158.8 16.1
2010 4.1 78.9 19.1 1064.0 15118.0 14.2
2011 4.3 85.4 19.9 1110.1 15929.6 14.3
ACGR for last ten years 3.8 4.9 1.1 9.4 14.1 4.3(2002-2011)
(Source: www.faostat.fao.org)
Table 4.21: Major onion producing countries in the world (2010-11)
Country Area % share to total world Production % share to total onion Productivity(000’ha) onion area (000’t) production in world (t/ha)
China 930.2 23.42 20507.8 26.99 22.0
India 1064.0 26.79 15118.0 19.90 14.2
Pakistan 124.7 3.14 1701.1 2.24 13.6
Bangladesh 117.6 2.96 872.1 1.15 7.4
Indonesia 109.5 2.76 1048.2 1.38 9.6Viet Nam 101.7 2.56 355.3 0.47 3.5
Russia 88.0 2.22 1536.3 2.02 17.5
Myanmar 78.9 1.99 1137.9 1.50 14.4
Brazil 67.3 1.69 1556.0 2.05 23.1
Turkey 62.7 1.58 1900.0 2.50 30.3
Others 1227.0 30.90 30244.5 39.81 24.6
Total 3971.5 100.00 75977.2 100.00 19.1
(Source: NHB, National Horticulture Database 2011)
Page 152
Vegetable Statistics
137
Table 4.22: Percent share of area and production of onion in India
Year Area % of total area Production % of total Productivity(000’ha) under vegetables (000’t) vegetable production (t/ha)
2001-02 495.8 8.1 5252.1 5.6 10.62002-03 424.7 7.0 4209.5 5.0 9.92003-04 553.8 8.8 6267.6 6.7 11.32004-05 613.8 9.1 7760.6 7.7 12.62005-06 703.6 9.8 9432.5 8.5 13.42006-07 768.0 10.1 10847.0 9.4 14.12007-08 821.0 10.5 13900.0 10.8 16.92008-09 834.0 10.4 13565.0 10.5 16.32009-10 756.2 9.5 12158.8 9.1 16.12010-11 1064.0 12.5 15118.0 10.3 14.2
(Source: NHB, National Horticulture Database 2011)
Table 4.23: State-wise area, production and productivity of onion in India (2011-2012)
State Area (‘000 ha) Production (‘000 t) Yield (t/ha)
Andhra Pradesh 48.52 824.77 17.00Assam 8.12 23.97 2.95Bihar 53.81 1,236.74 22.98Chhattisgarh 13.94 222.21 15.94Delhi 1.30 22.86 17.58Gujarat 61.30 1,562.20 25.48Haryana 27.45 589.83 21.49Himachal Pradesh 2.20 36.30 16.50Jammu & Kashmir 2.85 65.27 22.90Jharkhand 15.70 318.19 20.27Karnataka 177.20 2,451.20 13.83Madhya Pradesh 88.07 1,957.00 22.22Maharashtra 382.00 5,638.00 14.76Meghalaya 0.45 3.74 8.31Mizoram 0.48 4.38 9.13Nagaland 0.40 3.10 7.75Odisha 35.16 418.99 11.92Puduchery 0.01 0.05 5.00Punjab 8.24 182.69 22.17Rajasthan 73.46 664.22 9.04Sikkim 0.30 1.64 5.47Tamil Nadu 37.12 556.45 14.99Uttar Pradesh 23.69 383.47 16.19Uttarakhand 3.81 39.27 10.31West Bengal 21.68 304.56 14.05India 1,087.26 17,511.10 16.11
(Source: www.nhrdf.com)
Page 153
Indian Institute of Vegetable Research
138
Tabl
e 4.
24: S
tate
-wis
e ar
ea, p
rodu
ctio
n an
d yi
eld
of o
nion
in I
ndia
fro
m 2
001-
02 to
201
0-11
(Are
a: 0
00’h
a; P
rodu
ctio
n: 0
00’t;
Yie
ld: t
/ha)
Stat
es/U
Ts20
01-0
220
02-0
320
03-0
420
04-0
520
05-0
6A
PY
AP
YA
PY
AP
YA
PY
Biha
r13
.312
9.5
9.7
13.6
116.
88.
614
.513
89.
514
.110
6.5
7.6
15.9
128.
18.
1C
hhat
tisga
rh3.
833
.98.
94.
134
.88.
54.
532
.57.
24.
325
.76.
04.
524
.95.
5D
elhi
0.2
1.4
7.0
0.2
1.3
6.5
0.1
0.1
1.0
0.1
0.3
3.0
0.1
0.4
4.0
Har
yana
14.9
236.
915
.915
.922
6.1
14.2
19.9
294.
714
.819
.929
4.7
14.8
15.5
317.
720
.5H
imac
hal P
rade
sh1.
14.
94.
50.
84.
55.
61
7.3
7.3
17.
37.
30.
84
5.0
Jhar
khan
d0
00.
00
00.
00
00.
00
00.
00
00.
0M
adhy
a Pr
ades
h23
.132
4.6
14.1
24.7
345
14.0
3141
6.2
13.4
34.8
535.
615
.437
.857
215
.1M
ahar
asht
ra10
8.0
1307
.012
.10
121.
014
27.0
11.7
913
4.0
1645
.012
.28
134.
016
45.0
12.2
817
7.0
2469
.013
.95
Raja
stha
n28
.420
6.3
7.3
26.5
155.
75.
933
.624
9.1
7.4
42.9
347.
98.
144
.542
7.2
9.6
Utta
r Pr
ades
h25
.227
8.5
11.1
20.6
232.
811
.321
.224
5.8
11.6
17.6
210
11.9
25.5
328.
212
.9U
ttara
khan
d1.
724
14.1
1.9
6.6
3.5
1.8
18.4
10.2
1.8
18.4
10.2
225
12.5
Tabl
e co
ntin
ues
Stat
es/U
Ts20
06-0
720
07-0
820
08-0
920
09-1
020
10-1
1A
PY
AP
YA
PY
AP
YA
PY
Biha
r15
.112
0.5
8.0
14.6
1019
.669
.851
.694
6.6
18.3
5310
16.1
19.2
5410
8020
.0C
hhat
tisga
rh4.
320
.54.
84.
213
6.7
32.5
8.8
136.
715
.59.
216
0.3
17.4
10.1
179.
617
.8D
elhi
0.1
0.8
8.0
0.1
23.4
234.
00.
123
.523
5.0
1.2
23.5
19.6
1.4
2517
.9H
arya
na16
.431
4.9
19.2
17.7
346.
619
.618
.834
7.9
18.5
18.4
364
19.8
2246
8.8
21.3
Him
acha
l Pra
desh
0.9
7.6
8.4
0.8
25.9
32.4
1.9
32.1
16.9
1.7
33.9
19.9
00
0.0
Jhar
khan
d0
00.
03
242.
180
.715
.130
1.8
20.0
1222
718
.914
.730
5.5
20.8
Mad
hya
Prad
esh
37.8
762
9.65
16.6
38.5
864
8.6
16.8
5388
1.8
16.6
57.3
1081
.818
.958
.310
22.1
17.5
Mah
aras
htra
229.
8428
12.3
612
.24
204.
6727
13.2
813
.26
250.
039
32.5
15.7
320
0.0
3146
.015
.73
415.
049
05.0
11.8
2Ra
jast
han
38.6
370.
39.
636
391.
610
.941
369.
19.
045
438.
79.
748
.575
015
.5U
ttar
Prad
esh
2129
714
.122
295.
813
.422
.330
813
.824
.331
5.9
13.0
23.6
370.
915
.7U
ttara
khan
d3
144.
72
35.2
17.6
3.6
40.5
11.3
3.6
39.7
11.0
4.2
4510
.7
(Sou
rces
: DES
, MoA
, GO
I an
dww
w.in
dias
tat.c
om)
Page 154
Vegetable Statistics
139
Table 4.25:District-wise area, production and yield of Onion
Bihar[Area(A) in ha; Production (P) in t; Yield (Y) in t/ha]
District/division 2006-07 2007-08 2009-10A P Y A P Y A P Y
Patna 2396 41211 17.2 2438 49735 20.4 2473 49955 20.2Nalanda 5724 104749 18.3 5788 120706 20.9 5851 119360 20.4Bhojpur 1132 20602 18.2 1151 22905 19.9 1197 23478 19.6Buxar 846 14889 17.6 864 16934 19.6 915 17751 19.4Rohtas 1134 20815 18.4 1152 20966 18.2 1171 20844 17.8Kaimur 829 14425 17.4 847 15077 17.8 873 15714 18.0Gaya 1397 25984 18.6 1411 25962 18.4 1429 25436 17.8Jehanabad 449 8172 18.2 472 9251 19.6 531 9770 18.4Arwal 306 5477 17.9 388 7682 19.8 435 8129 18.7Nawada 968 16843 17.4 933 16887 18.1 951 17238 18.1Aurangabad 1056 18902 17.9 1066 18975 17.8 1093 20221 18.5Saran 899 16002 17.8 912 17510 19.2 943 17634 18.7Siwan 821 14614 17.8 842 15998 19.0 898 16882 18.8Gopalganj 813 14715 18.1 838 16257 19.4 884 16619 18.8E. champaran 2322 43654 18.8 2328 45629 19.6 2362 46295 19.6W. Champaran 2191 41410 18.9 2264 46186 20.4 2303 46521 20.2Muzaffarpur 2466 48334 19.6 2477 50035 20.2 2517 49385 19.6Sitamarhi 1269 22081 17.4 1282 25384 19.8 1318 25188 19.1Sheohar 672 11693 17.4 679 13173 19.4 712 13243 18.6Vaishali 1621 31123 19.2 1672 33945 20.3 1727 33749 19.5Bhagalpur 1518 30208 19.9 1558 31472 20.2 1623 31486 19.4Banka 723 14315 19.8 712 13243 18.6 737 13166 17.9Munger 906 18301 20.2 954 19462 20.4 1008 18749 18.6Sheikhpura 973 21989 22.6 1011 21029 20.8 1065 21087 19.8Lakhisarai 267 5393 20.2 287 5490 19.1 326 6064 18.6Jamui 722 14007 19.4 726 13648 18.8 744 13392 18.0Khagaria 736 14573 19.8 747 14492 19.4 768 14054 18.3Darbhanga 1084 21463 19.8 1066 21320 20.0 1097 20295 18.5Madhubani 1066 21107 19.8 1084 21897 20.2 1116 20981 18.8Samastipur 1146 23837 20.8 1172 24043 20.5 1241 24324 19.6Begusarai 1897 40596 21.4 1921 39957 20.8 1973 38474 19.5Purnea 1729 34926 20.2 1742 34666 19.9 1775 34080 19.2Araria 1448 28670 19.8 1468 29066 19.8 1494 27788 18.6Kishanganj 1366 27047 19.8 1389 26808 19.3 1376 25594 18.6Katihar 3748 74496 19.9 3774 76990 20.4 3811 75358 19.8Saharsa 577 11370 19.7 592 11958 20.2 639 12424 19.4Madhepura 919 18656 20.3 937 18365 19.6 973 18292 18.8Supaul 336 6686 19.9 344 6502 18.9 379 7049 18.6Total 50472 962705 19.1 51288 1019605 19.9 52728 1016069 19.3
(Source: State Horticulture Mission, Government of Bihar)
Page 155
Indian Institute of Vegetable Research
140
Gujarat[Area(A) in ha; Production (P) in t; Yield (Y) in t/ha]
Districts 2008-09 2009-10 2010-11A P Y A P Y A P Y
Ahmedabad 106 2312 21.8 110 2530 23.0 150 3452 23.01Amreli 4420 110500 25.0 3050 82350 27.0 6500 195000 30.00Banaskantha 260 5330 20.5 270 5940 22.0 285 7125 25.00Bharuch 350 6370 18.2 360 6966 19.4 432 8389 19.42Narmada 410 10250 25.0 440 11880 27.0 490 13720 28.00Bhavnagar 30100 782600 26.0 17100 444600 26.0 29800 655600 22.00Dang 115 2875 25.0 150 5250 35.0 200 7400 37.00Jamnagar 2913 50832 17.5 2730 57603 21.1 2840 66740 23.50Junagadh 3250 82875 25.5 3332 83552 25.1 3610 108300 30.00Porbandar 980 34400 35.1 1025 36900 36.0 935 37213 39.80Kutch 125 2500 20.0 137 2914 21.3 230 4892 21.27Kheda 150 3000 20.0 158 3160 20.0 162 3240 20.00Anand 900 12150 13.5 950 12825 13.5 1000 13520 13.52Mehsana 305 5795 19.0 405 7788 19.2 412 8009 19.44Patan 10 220 22.0 12 276 23.0 10 220 22.00Panchmahal 750 13500 18.0 790 14220 18.0 850 15300 18.00Dahod 810 12150 15.0 845 12675 15.0 900 14400 16.00Rajkot 9670 232080 24.0 8508 221208 26.0 9503 270836 28.50Sabarkantha 500 10000 20.0 512 10266 20.1 529 10633 20.10Surat 38 1132 29.8 40 1200 30.0 216 4385 20.30Surendranagar 490 11155 22.8 1465 34685 23.7 1685 37070 22.00Baroda 925 16650 18.0 930 17670 19.0 1023 21483 21.00Valsad 33 528 16.0 34 578 17.0 38 654 17.21Tapi 12 366 30.5 50 1550 31.0 210 6510 31.00Total 57622 1409570 24.5 43403 1078586 24.9 62010 1514091 24.42
(Source: State Horticulture Mission, Government of Gujarat)
Haryana (2006-07)
Districts Area (ha) Production (t) Yield (t/ha)
Panchkula 900 18200 20.2Ambala 1507 10960 7.3Yamunanagar 1110 3525 3.2Kurukshetra 480 2250 4.7Kaithal 638 8041 12.6Karnal 875 19165 21.9Panipat 1548 18480 11.9Sonipat 1090 15675 14.4
Contd...
Page 156
Vegetable Statistics
141
Districts Area (ha) Production (t) Yield (t/ha)
Rohtak 170 9800 57.6Jhajjar 1732 38490 22.2Faridabad 270 2980 11.0Narnual 40 200 5.0Rewari 360 6400 17.8Gurgaon 50 3944 78.9Bhiwani 1010 13270 13.1Hissar 500 7100 14.2Fatehabad 210 5240 25.0Sirsa 500 6950 13.9Jind 650 12400 19.1Mewat 2790 44150 15.8Total 16430 247220 15.0
(Source: www.indiastat.com)
Karnataka (2007-08)
Bidar 600 10700 17.8Bijapur 9983 - -Dharwad 27000 50750 21.62Gulbarga 1600 23720 14.96Gadag 25159 289964 10.46Raichur 2278 - -Chitradurga 17000 340030 20.11Davangere 3900 77020 19.7Chamarajanagara 4300 43900 10.20Ramanagara 160 - -Uttar Kannada 3000 45000 15Total 94980 881084 16.2
(Source: www. indiastat.com)
Odisha (2006-07)
Balasore 1000 8500 8.5Bhadrak 295 2683 9.1Bolangir 4120 37050 9.0Sonepur 732 6954 9.5Cuttack 900 7245 8.1J.S. Pur 705 5640 8.0Jaipur 870 7913 9.1Kendrapara 735 6685 9.1Dhenkanal 746 6785 9.1
Contd...
Page 157
Indian Institute of Vegetable Research
142
Districts Area (ha) Production (t) Yield (t/ha)
Angul 2690 26900 10.0Ganjam 885 7522 8.5Gajapati 275 2365 8.6Keonjhar 1026 9183 9.0Kalahandi 2000 18190 9.1Khariar 455 4138 9.1Koraput 1100 10004 9.1Malkangiri 130 1182 9.1N.W. Pur 500 4548 9.1Rayagade 658 5985 9.1Phulbani 644 5857 9.1Boudh 310 2883 9.3Mayurbhanj 900 8100 9.0Puri 202 1768 8.8Khurda 305 2774 9.1Nayagarh 387 3425 8.9Sambalpur 1737 16675 9.6Deogarh 525 4775 9.1Bargarh 2061 19579 9.5Jharsuguda 365 3320 9.1Sundargarh 1250 11369 9.1Total 28508 259997 9.1
(Source: www.indiastat.com)
Tamil Nadu (2005-06)(Area in ha; Production in t; yield in t/ha)
Coimbatore 2366 27499 11.62Cuddalore 67 537 8.01Dharmapuri 155 1242 8.01Dindigul 3365 33720 10.02Erode 1879 19302 10.27Karur 130 1042 8.02Krishnagiri 75 601 8.01Madurai 1045 6375 6.1Nagapattinam 8 64 8Namakkal 2709 31875 11.77Perambalur 7821 47540 6.08Ramanathapuram 90 721 8.01Salem 469 3759 8.01Sivagangai 26 208 8
Contd...
Page 158
Vegetable Statistics
143
Districts Area (ha) Production (t) Yield (t/ha)
Thanjavur 8 64 8Theni 478 3831 8.01Thiruchirapalli 4134 25379 6.14Thirunelveli 1653 14188 8.58Thiruvannamalai 27 216 8Thoothukudi 1170 7974 6.82Vellore 36 289 8.03Villupuram 305 2445 8.02Virudhunagar 1153 4925 4.27Total 29169 233796 8.02
(Source: www.indiastat.com)
Uttar Pradesh[Area(A) in ha; Production (P) in t; Yield (Y) in t/ha]
District/division 2008-09 2009-10 2010-11A P Y A P Y A P Y
Saharanpur 143 2019 14 166 2575 16 232 3382 15
Meerut 682 9007 13 691 10910 16 813 11164 14
Agra 1021 12797 13 1183 18018 15 1056 14052 13
Aligarh 401 5396 13 464 7187 15 557 7334 13
Bareilly 727 10015 14 763 11800 15 962 13484 14Muradabad 222 3187 14 198 2981 15 334 4703 14
Kanpur 3147 39945 13 3311 50425 15 3098 39158 13
Allahabad 2083 23203 11 1995 32265 16 2862 35653 12
Jhansi 414 5470 13 739 11407 15 478 5821 12
Chitrakoot Dham 509 5970 12 694 11605 17 378 4527 12
Varanasi 2079 23688 11 2117 38919 18 1934 22637 12
Mirzapur 840 10763 13 948 15681 17 837 10412 12
Azamgarh 1653 22031 13 1643 22668 14 1660 19456 12
Gorakhpur 759 11356 15 644 9478 15 674 10050 15
Basti 674 9550 14 695 10611 15 774 10935 14
Shri Patan devi 1602 24653 15 1670 25858 15 1601 24799 15
Lucknow 1940 24027 12 1970 25514 13 2249 28081 12Faziabad 1848 43572 24 1868 28229 15 1831 42616 23
Total 20744 286649 14 21759 336131 15 22330 308264 14
(Source: State Horticulture Mission, Government of Uttar Pradesh)
Page 159
Indian Institute of Vegetable Research
144
Tabl
e 4.
26:In
dia’
s tr
ade
in o
nion
(Qua
ntity
in t;
Val
ue in
‘000
US$
; Uni
t val
ue in
US$
/t)
Year
Expo
rtIm
port
Expo
rt%
sha
re in
Expo
rt%
sha
re in
Uni
tIm
port
% s
hare
inIm
port
% s
hare
inU
nit
Qua
ntity
wor
ld e
xpor
tVa
lue
wor
ld e
xpor
tVa
lue
Qua
ntity
wor
ld im
port
Valu
ew
orld
impo
rtVa
lue
1961
1068
8512
.67
5895
10.2
455
.15
-0.
00-
--
1962
1170
0812
.73
5571
7.91
47.6
1-
0.00
--
-19
6399
733
10.6
458
318.
4458
.47
-0.
00-
--
1964
1048
159.
7368
758.
7465
.59
-0.
00-
--
1965
9889
69.
8952
906.
8153
.49
-0.
00-
--
1966
8736
29.
3055
777.
8663
.84
-0.
00-
--
1967
1067
6010
.77
6331
6.93
59.3
029
0.00
20.
0068
.97
1968
9468
89.
5452
546.
7255
.49
50.
00-
--
1969
1262
7211
.26
7541
7.68
59.7
22
0.00
--
-19
7014
7476
12.6
793
197.
6363
.19
10.
00-
--
1971
8756
67.
7335
553.
5340
.60
-0.
00-
--
1972
3921
43.
6828
372.
6172
.35
-0.
00-
--
1973
5723
04.
9646
782.
4381
.74
-0.
00-
--
1974
6954
96.
3364
974.
0893
.42
10.
00-
--
1975
1074
009.
4011
910
6.15
110.
89-
0.00
--
-19
7616
2330
12.6
123
001
8.27
141.
69-
0.00
--
-19
7786
889
6.55
1400
55.
5216
1.18
120.
001
0.00
83.3
319
7853
527
3.79
1022
84.
5819
1.08
-0.
00-
--
1979
1077
797.
5017
659
6.35
163.
84-
0.00
--
-19
8013
2137
8.69
2662
17.
1320
1.47
50.
001
0.00
200
1981
1910
7210
.32
3236
17.
3816
9.37
-0.
00-
--
1982
1981
2811
.55
3800
211
.69
191.
8134
0.00
80.
0023
5.29
1983
1521
039.
0039
421
12.8
225
9.17
220.
009
0.00
409.
0919
8425
2196
13.1
944
400
10.7
117
6.05
-0.
00-
--
1985
2441
2912
.96
3596
012
.59
147.
30-
0.00
--
-19
8623
7006
12.2
741
213
12.5
217
3.89
250.
003
0.00
120
Con
td...
Page 160
Vegetable Statistics
145
Year
Expo
rtIm
port
Expo
rt%
sha
re in
Expo
rt%
sha
re in
Uni
tIm
port
% s
hare
inIm
port
% s
hare
inU
nit
Qua
ntity
wor
ld e
xpor
tVa
lue
wor
ld e
xpor
tVa
lue
Qua
ntity
wor
ld im
port
Valu
ew
orld
impo
rtVa
lue
1987
1303
926.
4531
271
6.87
239.
8218
70.
0136
0.01
192.
5119
8821
4336
10.0
544
324
8.75
206.
80-
0.00
--
-19
8931
7315
15.3
547
441
10.6
014
9.51
00.
00-
--
1990
2403
0110
.82
5091
08.
4121
1.86
-0.
00-
--
1991
3713
5314
.01
6139
98.
5916
5.34
-0.
00-
--
1992
2721
8010
.94
4544
36.
7716
6.96
-0.
00-
--
1993
3571
3213
.98
5845
88.
3216
3.69
-0.
00-
--
1994
4019
9611
.74
6561
96.
4716
3.23
-0.
00-
--
1995
3511
5510
.68
7156
56.
3120
3.80
00.
00-
--
1996
4280
0412
.42
7441
68.
2417
3.87
00.
00-
--
1997
3335
4910
.50
5469
06.
1516
3.96
1712
0.05
339
0.03
198.
0119
9821
5766
6.04
4226
93.
9519
5.90
3799
0.11
1451
0.12
381.
9419
9926
0719
7.27
4714
15.
3718
0.81
-0.
00-
--
2000
3432
6410
.10
6151
27.
8717
9.20
-0.
00-
--
2001
4418
6212
.26
7402
88.
5116
7.54
-0.
00-
--
2002
5888
6313
.83
7442
77.
7012
6.39
00.
00-
--
2003
8603
3417
.03
1538
2911
.92
178.
800
0.00
--
-20
0483
3230
16.4
213
7095
10.0
716
4.53
00.
00-
-20
0596
1806
18.5
116
0851
11.3
316
7.24
6570
0.14
1865
0.13
283.
8720
0613
8151
523
.58
2573
4915
.35
186.
280
0.00
--
-20
0710
0932
317
.66
2511
9712
.07
248.
8810
40.
0058
0.00
557.
6920
0816
7072
226
.61
4228
3219
.17
253.
0889
0.00
150.
0016
8.54
2009
1677
166
26.5
847
9650
21.2
928
5.99
630
0.01
280
0.01
444.
4420
1013
6433
719
.11
4653
1215
.62
341.
0554
080.
0825
980.
0948
0.40
(Sou
rce:
ww
w.fa
osta
t.fao
.org
)
Page 161
Indian Institute of Vegetable Research
146
Brinjal
Table 4.27: Area, production and yield ofbrinjal(Egg plant or Aubergine)
Years World IndiaArea Production Yield Area Production Yield
(Million ha) (Million t) (t/ha) (000’ha) (000’t) (t/ha)
1961 0.79 7.03 8.9 150 990 71962 0.66 6.20 9.4 156 1050 71963 0.62 6.06 9.8 162 1100 71964 0.60 5.90 9.8 170 1150 71965 0.61 6.16 10.1 175 1200 71966 0.60 6.26 10.4 180 1230 71967 0.62 6.55 10.6 190 1300 71968 0.61 6.71 11.0 195 1365 71969 0.63 6.93 11.1 200 1400 71970 0.55 6.22 11.3 205 1480 71971 0.59 6.76 11.5 208 1540 71972 0.60 6.57 11.0 210 1585 81973 0.62 7.19 11.6 215 1635 81974 0.61 7.25 11.8 220 1660 81975 0.63 7.45 11.7 225 1700 81976 0.63 7.19 11.3 230 1760 81977 0.65 7.47 11.5 232 1810 81978 0.68 7.79 11.4 240 1880 81979 0.68 7.98 11.7 245 1940 81980 0.71 8.07 11.4 249 2000 81981 0.73 8.78 12.0 253 2180 91982 0.78 9.11 11.7 258 2300 91983 0.78 9.36 12.0 262 2360 91984 0.81 9.60 11.9 270 2480 91985 0.83 9.91 12.0 275 2550 91986 0.83 10.23 12.3 280 2660 101987 0.84 10.35 12.3 283 2775 101988 0.84 10.58 12.6 287 2870 101989 0.88 10.82 12.2 290 2960 101990 0.84 11.35 13.6 295 3000 101991 0.85 11.88 14.1 300 3124 101992 0.72 11.59 16.1 194 2753 141993 0.85 15.14 17.8 252 5011 201994 0.95 15.78 16.6 280 4420 161995 1.12 18.25 16.4 420 6230 151996 1.20 19.72 16.5 422 6000 141997 1.27 20.65 16.3 430 6100 141998 1.35 23.12 17.1 480 7740 161999 1.43 26.64 18.7 490 7880 162000 1.53 27.40 17.9 500 8120 162001 1.56 27.20 17.5 470 7700 162002 1.64 29.53 18.0 500 8350 172003 1.68 29.71 17.7 500 7830 162004 1.75 31.01 17.7 516 8477 162005 1.83 32.08 17.6 527 8601 162006 1.88 33.04 17.5 560 9364 172007 1.66 37.62 22.7 568 9453 172008 1.60 39.81 24.8 561 9678 17
Contd...
Page 162
Vegetable Statistics
147
Years World IndiaArea Production Yield Area Production Yield
(Million ha) (Million t) (t/ha) (000’ha) (000’t) (t/ha)
2009 1.68 43.13 25.7 600 10378 172010 1.72 44.23 25.7 612 10563 172011 1.81 46.69 25.7 680 11896 17ACGR for last ten years 0.21 5.82 5.60 3.17 4.12 0.92(2002-2011)
(Source: www.faostat.fao.org.in)
Table 4.28: Major eggplant producing countries in the world (2010-11)
Country Area % share to total world Production % share to total world Productivity(000’ha) area under brinjal (000’t) brinjal production (t/ha)
China 731.5 42.3 24501.9 56.8 33.5India 680.0 39.3 11896.0 27.6 17.5Egypt 25.0 1.4 1229.8 2.8 49.2Iran 29.3 1.7 888.5 2.1 30.3Turkey 28.0 1.6 847.0 2.0 30.2Indonesia 52.0 3.0 482.3 1.1 9.3Iraq 16.8 1.0 387.4 0.9 23.0Japan 10.3 0.6 330.1 0.8 32.0Italy 10.7 0.6 302.6 0.7 28.2Philippines 21.4 1.2 208.3 0.5 9.7Others 123.1 7.1 2100.1 4.9 17.1Total 1728.3 100.0 43174.0 100.0 25.0
(Source: NHB, National Horticulture Database 2011)
Table 4.29: Percent share of area and production of brinjal in India
Year Area % of total area Production % of total Productivity(000’ha) under vegetables (000’t) vegetable production (t/ha)
1987-88 202.6 4.9 2555.3 5.2 12.61993-94 300.7 6.2 4612.2 7 15.31994-95 420.1 8.4 6232.2 9.3 14.81995-96 434.2 8.1 6443.1 9 14.81996-97 464 8.4 6585.6 8.7 14.21997-98 486.8 8.7 7735.4 10.6 15.91998-99 496.2 8.4 7881.5 9 15.91999-00 500.3 8.4 8117.2 8.9 16.22000-01 472.7 7.6 7651.6 8.2 16.22001-02 502.4 8.2 8347.7 9.4 16.62002-03 507.3 8.3 8001.2 9.4 15.82003-04 516.4 8.2 8477.3 9.1 16.42004-05 526.5 7.8 8600.8 8.5 16.32005-06 559.7 8.3 9364.6 9.2 16.72006-07 568 7.5 9453 8.2 16.62007-08 561 7.1 9678 7.5 17.32008-09 600 7.5 10378 8 17.32009-10 612 7.7 10563 7.9 17.32010-11 680 8 11896 8.1 17.5
(Source: www.indiastat.com)
Page 163
Indian Institute of Vegetable Research
148
Tabl
e 4.
30: S
tate
-wis
e ar
ea, p
rodu
ctio
n an
d yi
eldo
f br
inja
l in
Indi
a fr
om 2
001-
02 to
201
0-11
[Are
a (P
): 00
0’ha
, Pro
duct
ion
(P):
000’
t; Yi
eld
(Y):
t/ha]
Stat
es/U
Ts20
01-0
220
02-0
320
03-0
420
04-0
520
05-0
6A
PY
AP
YA
PY
AP
YA
PY
Wes
t Ben
gal
141.
224
49.6
17.3
149.
724
84.6
16.6
145.
726
61.6
18.3
148.
327
01.7
18.2
152.
927
57.4
18O
dish
a11
2.3
1420
.112
.612
7.4
1834
.514
.412
7.6
1850
14.5
127.
718
52.2
14.5
127.
918
53.9
14.5
And
hra
Prad
esh
20.5
410
2019
.839
6.7
2019
.338
6.9
2024
.749
3.2
2029
.354
9.4
21G
ujar
at40
.955
513
.636
.553
1.3
14.6
36.5
531.
314
.649
.274
5.6
15.2
62.7
982.
615
.7Bi
har
55.6
1111
.720
55.9
1005
.418
54.1
1081
.920
53.7
1073
2053
.710
3119
.2M
ahar
asht
ra31
.149
6.9
1631
.249
9.4
1630
.949
8.3
16.1
31.5
473.
715
3252
1.6
15C
hhat
tisga
rh12
.915
1513
.620
3.6
1511
.212
5.1
11.2
19.4
266.
413
.7K
arna
taka
17.1
382.
822
.416
.438
3.8
23.4
14.1
328.
223
.314
.331
3.5
21.9
14.7
326
22.1
Mad
hya
Prad
esh
13.1
195.
915
14.2
213.
215
15.9
238.
715
14.6
221.
915
Har
yana
--
--
--
-10
.717
4.6
--
148.
7-
Jhar
khan
d-
--
--
--
--
--
-16
.9-
-A
ssam
12.7
616.
7-
12.7
9816
7.6
-12
.817
0.2
-13
171.
5-
1317
1.5
-O
ther
s58
708.
9-
44.7
503.
8-
44.7
552.
1-
26.2
237.
8-
34.6
305.
8-
Tota
l Ind
ia50
2.5
8347
.613
6.9
507.
298
7822
.113
851
3.5
8477
.315
6.8
526.
486
00.6
151
571.
791
36.2
154.
2Ta
ble
cont
inue
s
Stat
es/U
Ts20
06-0
720
07-0
820
08-0
920
09-1
020
10-1
1A
PY
AP
YA
PY
AP
YA
PY
Wes
t Ben
gal
152.
526
98.6
17.7
153.
927
34.9
17.8
155.
327
58.6
17.8
156.
827
97.3
17.8
158.
428
70.6
18.1
Odi
sha
129
1913
.814
.812
919
32.5
1513
019
65.2
15.1
132.
421
35.2
16.1
133.
222
04.8
16.6
And
hra
Prad
esh
28.5
428.
215
26.6
531.
320
26.6
531.
320
24.3
485
2075
.115
02.4
20G
ujar
at57
.893
3.8
16.2
55.8
987.
717
.762
.610
46.3
16.7
65.8
1143
.617
.472
1236
.317
.2Bi
har
54.1
1120
.620
.754
.611
58.2
21.2
55.1
1186
.121
.555
.311
98.6
21.7
55.7
1215
.621
.8M
ahar
asht
ra28
456.
416
.329
.447
9.2
16.3
28.9
471.
116
.330
485
16.5
3549
014
Chh
attis
garh
23.9
326.
913
.722
.332
7.5
14.7
24.2
355.
514
.725
.237
4.5
14.9
26.7
439.
516
.5K
arna
taka
19.2
335.
824
.314
.936
224
.315
.337
2.9
24.3
15.7
372.
723
.714
.235
4.5
25M
adhy
a Pr
ades
h14
.521
715
14.9
223.
315
21.4
321.
315
20.5
246
1223
.428
112
Har
yana
-18
4.1
--
--
13.3
-13
.9-
14.6
255.
217
.4Jh
arkh
and
17-
2019
-20
22.7
-20
22.7
-17
.5A
ssam
-0
-15
.527
5.9
17.8
15.9
253
16O
ther
s43
.882
-41
561.
313
.772
.263
9.7
1582
.966
3.7
13.9
71.7
1046
14.6
Tota
l Ind
ia56
8.3
8697
.217
3.7
561.
492
97.9
195.
764
3.1
9923
.921
4.2
661.
410
154.
620
7.5
680
1189
5.9
193.
2
(Sou
rce:
ww
w.in
dias
tat.c
om)
Page 164
Vegetable Statistics
149
Table 4.31: District-wise area, production and yield of brinjal
Andhra Pradesh (2006-07)
Districts Area (ha) Production (t) Yield (t/ha)
Srikakulam 298 4470 15Vizianagaram 1161 17415 15Visakhapatnam 4300 64500 15East Godavari 3287 49305 15West Godavari 1152 17280 15Krishna 848 12720 15Guntur 1790 26850 15Prakasam 720 10800 15Nellore 245 3675 15Coastal Andhra 13801 207015 15Chittoor 1890 28350 15Cuddapah 332 4980 15Anantapur 950 14250 15Kurnool 4325 64875 15Rayalaseema 7497 112455 15Andhra region 21298 319470 15Mahbubnagar 500 7500 15Ranga Reddy 1313 19695 15Medak 1000 15000 15Nizamabad 415 6225 15Adilabad 2086 31290 15Karimnagar 1000 15000 15Warangal 178 2670 15Khammam 600 9000 15Nalgonda 158 2370 15Telangana region 7250 108750 15Total 28548 428220 15
(Source: www.indiastat.com)
Bihar (2005-06)
Patna 1798 35061 20Nalanda 6429 128580 20Bhojpur 1012 19228 19Buxar 627 11913 19Rohtas 946 17896 19Kaumur 662 12181 18Gaya 1604 30156 19Jehanabad 589 11132 19Arwal 353 6636 19
Contd...
Page 165
Indian Institute of Vegetable Research
150
Districts Area (ha) Production (t) Yield (t/ha)
Nawadah 1178 21204 18Aurangabad 1082 19476 18Saran 1753 32956 19Siwan 1529 28439 19Gopatganj 1348 25073 19Mujaffarpur 2767 53680 19E.Champaran 1664 31616 19W.Champaran 1893 35967 19SitamatTii 1189 22353 19Sheohar 616 11458 19Vaishali 2972 58846 20Darbhanga 2384 46488 20Madhubani 1932 34776 18Samastipur 2137 43809 21Begusarai 2641 49666 19Munger 664 13280 20Sheikhpura 272 5168 19Lakhisarai 158 2923 19Jamui 541 9738 18Khagaria 1378 26182 19Bhagalpur 1553 29507 19Banka 786 14148 18Saharsa 1278 25049 20Supaul 581 11457 20Madhepura 1521 29812 20Pumea 1058 20314 19Kisanganj 527 10013 19Araria 598 11362 19Katihar 1704 33739 20Total 53724 1031282 19
(Source: www.indiastat.com)
Haryana (2006-07)
Panchkula 100 1400 14Ambala 1485 24760 17Yamunanagar 757 5765 8Kurukshetra 790 6700 8Kaithal 222 1379 6Karnal 646 8060 12Panipat 1285 7860 6Sonipat 945 17840 19
Contd...
Page 166
Vegetable Statistics
151
Districts Area (ha) Production (t) Yield (t/ha)
Rohtak 490 5700 12Jhajjar 410 4700 11Faridabad 495 6100 12Narnual 390 5595 14Rewari 207 4342 21Gurgaon 4263 29814 7Bhiwani 260 2550 10Hissar 1380 9150 7Fatehabad 550 3375 6Sirsa 485 3360 7Jind 650 6530 10Mewat 945 28298 30Total 16755 183278 11
(Source: www.indiastat.com)
Himachal Pradesh (2005-06)
Bilaspur 40 920 23Chamba 37 670 18Hamirpur 70 910 13Kangra 283 5769 20Kinnaur 5 75 15Kullu 40 900 23Lahaul&Spiti - - -Mandi 90 1800 20Shimla 20 360 18Sirmour 41 720 18Solan 94 1128 12Una 52 1015 20Total 772 14267 18
(Source: www.indiastat.com)
Odisha (2006-07)
Balasore 5527 80142 15Bhadrak 7899 114536 15Bolangir 4400 63800 15Sonepur 2288 33176 15Cuttack 5920 88800 15J.S. Pur 3583 51954 15Jaipur 4287 62162 15Kendrapara 6108 88566 15Dhenkanal 4777 71655 15Angul 4322 64830 15
Contd...
Page 167
Indian Institute of Vegetable Research
152
Districts Area (ha) Production (t) Yield (t/ha)
Ganjam 5868 85086 15Gajapati 3170 45965 15Keonjhar 11675 186800 16Kalahandi 7695 111578 15Khariar 1660 24070 15Koraput 4029 58421 15Malkangiri 3685 53433 15N.W. Pur 3575 51838 15Rayagade 4003 58044 15Phulbani 4275 61988 15Boudh 4030 58435 15Mayurbhanj 7795 124720 16Puri 2300 33350 15Khurda 3700 58460 16Nayagarh 3265 47343 15Sambalpur 1840 26680 15Deogarh 1250 18125 15Bargarh 1390 22240 16Jharsuguda 1542 22359 15Sundargarh 3122 45269 15Total 128980 1913820 15
(Source: www.indiastat.com)
Punjab (2005-06)
Hoshiarpur 96 1394 15Jalandhar 363 5705 16Ludhiana 157 1764 11Ferozepur 111 1735 16Amritsar 437 6404 15Gurdaspur 105 1543 15Kapurthala 664 8665 13Bathinda 29 430 15Sangrur 94 1323 14Patiala 245 3853 16Ropar 38 562 15Faridkot 46 495 11Mansa 15 236 16Fatehgarh Sahib 71 851 12Moga 24 379 16Mukatsar 6 88 15Nzwanshehar 174 2536 15Total 2675 37963 14
(Source: www.indiastat.com)
Page 168
Vegetable Statistics
153
Tamil Nadu (2005-06)
Districts Area (ha) Production (t) Yield (t/ha)
Coimbatore 722 8502 11.78Cuddalore 372 3418 9.19Dharmapuri 153 1636 10.69Dindigul 651 6959 10.69Erode 272 2908 10.69Kancheepuram 428 6994 16.34Kanyakumari 42 449 10.69Karur 73 780 10.68Krishnagiri 323 4393 13.6Madurai 215 3228 15.01Nagapattinam 20 214 10.7Namakkal 227 2281 10.05Perambalur 135 1443 10.69Pudukottai 83 887 10.69Ramanathapuram 11 118 10.73Salem 637 5530 8.68Sivagangai 58 620 10.69Thanjavur 236 2523 10.69The Nilgiris 2 21 10.5Theni 372 3324 8.94Thiruchirapalli 142 1518 10.69Thirunelveli 324 3997 12.34Thiruvallur 261 2790 10.69Thiruvannamalai 156 1685 10.8Thiruvarur 18 192 10.67Thoothukudi 163 1742 10.69Vellore 556 3951 7.11Villupuram 278 1976 7.11Virudhunagar 177 1892 10.69Total 7107 75971 10.69
(Source: www.indiastat.com)
Uttar Pradesh[Area (A) in ha; Production (P) in t; Yield(Y) in t/ha]
Districts/divisions 2008-09 2009-10 2010-11A P Y A P Y A P Y
Saharanpur 25 31 1 36 1104 31 40 1227 31Meerut 304 9294 31 319 9781 31 352 10798 31Agra 463 14205 31 474 14572 31 522 16079 31
Contd...
Page 169
Indian Institute of Vegetable Research
154
District/division 2008-09 2009-10 2010-11A P Y A P Y A P Y
Aligarh 173 5280 31 199 6077 31 219 6737 31Bareilly 134 4095 31 128 3933 31 141 4335 31Muradabad 27 827 31 32 1009 32 35 1075 31Kanpur 270 8265 31 247 7567 31 272 8342 31Allahabad 98 3004 31 94 2883 31 103 3159 31Jhansi 37 1134 31 36 1109 31 40 1233 31Chitrakoot Dham 153 4681 31 184 5641 31 203 6243 31Varanasi 98 2995 31 108 3312 31 119 3652 31Mirzapur 38 1163 31 37 1134 31 41 1260 31Azamgarh 102 3114 31 73 2237 31 80 2455 31Gorakhpur 188 5758 31 177 5430 31 196 6018 31Basti 23 707 31 24 738 31 26 800 31Shri Patan devi 88 2687 31 112 3424 31 123 3765 31Lucknow 305 9325 31 303 9291 31 334 10244 31Faziabad 167 5118 31 138 4245 31 152 4677 31Total U.P. 2693 81683 30 2721 83487 31 2998 92099 31
(Source: State Horticulture Mission, Government of Uttar Pradesh)
West Bengal (2005-06)
Districts Rainy Summer WinterArea Production Area Production Area Production
(000’ha) (000’t) (000’ha) (000’t) (000’ha) (000’t)
Darjeeling 0.173 6.759 0.169 9.41 0.762 26.134Jalpaiguri 2.01 29.413 3.506 73.1 4.412 112.66Coochbehar 1.132 31.661 1.274 28.19 5.341 149.729North Diriajpur 2.165 21.185 2.092 34.73 4.532 76.065South Dinajpur 1.1 19.873 1.259 19.69 4.57 83.124Malda 1.603 28.674 1.432 24.3 7.924 139.924Murshidabad 2.3 39.607 2.05 36.7 11.05 175.06Nadia 2.173 37.133 2.134 36.94 6.59 122.19North 24-Parganas 3.039 50.6 3.293 48.21 2.17 28.711South 24-Parganas 1.2 21.6 1.3 21.6 5.62 101.16Howrah 0.694 7.694 0.385 8.75 0.75 12.97Hooghly 1.548 27.1 1.189 20.42 4.938 76.648Burdwan 1.38 23.46 2.12 29.68 4.65 88.35Birbhum 1.33 21.619 1.81 27.33 7.13 145.93Bankura 1.49 27.593 1.47 27.24 6.9 136.493Purulia 1.165 24.119 1.167 25.16 5.517 112.873Midnapur (West) 1.309 25.61 1.466 31.89 6.797 117.97Midnapur (East) 1.82 28.11 2 21.3 5.5 55Total 27.631 471.81 30.116 524.64 95.153 1760.991
(Source: www.indiastat.com)
Page 170
Vegetable Statistics
155
Tabl
e 4.
32: M
onth
ly w
hole
sale
pri
ce in
dex
(WPI
) of b
rinj
al in
Ind
ia {(
Base
yea
r: 19
93-9
4; 2
004-
05=1
00) (
Apr
il 19
94 to
July
201
2)}
Year
Jan.
Feb.
Mar
.A
pr.
May
Jun.
Jul.
Aug
.Se
pt.
Oct
.N
ov.
Dec
.
1993
-94=
100
1994
94.3
78.3
163.
519
3.2
201.
623
7.2
145.
712
1.3
163.
419
9515
7.3
148.
213
9.3
132.
210
5.7
154.
315
0.0
162.
821
5.4
186.
117
4.0
107.
019
9694
.110
0.6
122.
013
8.2
125.
314
3.4
136.
719
2.8
191.
615
8.8
135.
014
5.3
1997
140.
717
6.2
184.
717
0.6
118.
616
2.2
193.
921
8.4
244.
820
6.5
154.
621
5.7
1998
266.
321
2.8
213.
917
2.6
196.
725
3.5
204.
025
6.5
298.
529
6.3
223.
517
7.7
1999
139.
614
1.0
210.
424
3.9
202.
321
1.8
211.
821
1.8
204.
923
0.0
230.
024
0.4
2000
243.
924
3.9
243.
921
5.8
160.
219
3.3
196.
830
8.9
276.
518
5.1
171.
315
7.0
2001
126.
215
2.3
170.
714
4.3
154.
622
6.3
267.
424
7.9
191.
118
8.1
180.
214
0.7
2002
147.
116
2.2
156.
517
1.4
137.
520
2.1
245.
128
3.8
236.
616
5.3
161.
513
2.3
2003
155.
717
1.0
179.
317
3.8
176.
521
3.1
260.
326
5.9
290.
227
8.3
194.
315
6.8
2004
199.
516
5.9
164.
619
5.8
186.
821
7.5
215.
026
1.8
245.
628
0.7
273.
015
5.2
2005
193.
317
8.2
171.
020
9.7
201.
222
1.4
365.
633
3.6
277.
338
0.6
233.
119
3.7
2006
187.
418
0.9
241.
819
2.6
201.
729
7.1
271.
830
5.9
316.
032
0.2
252.
924
4.5
2007
283.
223
7.3
273.
323
6.9
262.
926
5.4
342.
928
0.1
278.
527
0.2
198.
023
4.8
2008
236.
732
2.5
374.
630
9.6
308.
035
6.9
383.
435
0.0
320.
742
3.9
348.
925
9.6
2009
279.
324
9.6
235.
428
2.8
255.
228
4.6
328.
231
8.7
294.
332
5.9
340.
429
8.4
2010
311.
328
9.3
337.
928
6.3
327.
840
6.8
355.
433
7.6
2004
-05=
100
2005
102.
698
.210
5.4
147.
213
1.3
115.
716
1.7
132.
486
.020
0695
.098
.298
.087
.898
.212
2.6
117.
812
9.4
127.
512
8.0
122.
411
7.5
2007
119.
410
7.8
118.
810
7.5
127.
013
2.1
160.
313
6.3
136.
712
9.4
108.
511
6.4
2008
117.
113
8.7
156.
413
5.2
141.
814
9.0
154.
615
6.3
143.
417
6.8
155.
513
7.8
2009
148.
011
3.3
101.
311
2.9
109.
112
6.6
152.
415
3.6
136.
014
9.2
157.
514
3.9
2010
141.
513
4.4
152.
414
4.6
157.
418
8.4
159.
515
2.4
171.
214
7.8
141.
323
3.5
2011
209.
712
7.9
142.
212
2.3
130.
415
5.9
184.
719
0.3
211.
118
1.6
166.
714
3.8
2012
168.
819
1.5
204.
620
6.7
182.
322
7.6
186.
9
(Sou
rce:
ww
w.in
dias
tat.c
om)
Page 171
Indian Institute of Vegetable Research
156
Tabl
e 4.
33: M
onth
ly a
vera
ge w
hole
sale
pri
ce (W
P) a
nd a
rriv
al (A
R) o
f br
inja
l (ro
und)
dur
ing
the
peri
od J
anua
ry to
Dec
embe
r, 20
11[A
vera
ge w
hole
sale
pri
ce (W
P) in
`/q
& A
rriv
al (A
R) in
Ton
nes]
Mar
ket
Jan
Feb
Mar
chA
pril
May
June
July
Aug
Sept
Oct
Nov
Dec
Tota
lW
PA
RW
PA
RW
PA
RW
PA
RW
PA
RW
PA
RW
PA
RW
PA
RW
PA
RW
PA
RW
PA
RW
PA
RW
PA
R
Abo
har
1008
4480
851
1008
101
800
175
700
262
639
407
700
485
748
430
717
444
861
405
875
294
925
161
816
3259
Agr
a87
185
900
7082
198
429
8876
496
650
107
601
113
524
107
498
133
465
140
500
206
553
311
631
1554
Ahm
edab
ad14
5895
349
085
479
672
598
951
311
1946
515
2446
912
9863
815
0864
716
6160
613
4156
512
1273
197
389
011
9780
58A
mri
tsar
855
292
735
329
833
353
689
351
457
193
660
320
944
312
696
348
823
351
712
309
559
281
527
367
708
3806
Bang
alor
e59
628
442
033
750
029
842
325
062
828
867
130
578
035
668
134
357
242
056
623
460
025
661
728
358
836
54Bh
opal
1496
161
709
453
650
685
411
568
604
312
902
177
1158
175
928
186
1325
321
703
494
462
1221
367
777
810
5530
Bhub
anes
hwar
1830
221
987
380
1377
295
1200
360
975
430
1462
183
2000
9817
1014
318
1415
218
9212
518
7931
412
7739
315
3430
94C
hand
igar
h97
645
011
5338
194
847
586
259
411
0360
910
4071
010
1991
794
969
010
6756
210
0560
487
091
090
477
899
176
80C
henn
ai14
7710
5611
9112
5912
2414
3779
811
5111
1013
2211
1812
0711
9613
4610
7917
6511
1514
1211
5377
613
5078
013
3359
511
7914
106
Deh
radu
n96
416
010
8578
1212
5398
117
755
923
080
615
193
820
880
430
011
5022
310
8216
087
314
365
714
092
620
23D
elhi
1168
279
1186
-10
65-
896
160
902
1423
897
2016
1122
2950
892
2763
1207
2734
754
2571
583
1868
688
1744
947
1850
8G
uwah
ati
1015
248
773
239
735
288
849
175
804
235
938
202
1590
228
1738
175
1665
183
1867
220
1185
301
740
376
1158
2870
Hyd
erab
ad10
7711
4149
080
537
613
1528
485
940
074
743
197
682
716
6184
696
165
034
0-
--
-30
029
568
8834
Jaip
ur60
948
762
444
454
547
747
849
048
753
558
345
672
438
492
942
776
910
2163
741
645
848
946
648
560
961
11Ja
land
har
--
--
--
632
132
613
439
735
500
957
381
686
313
1338
305
1359
433
873
143
--
899
2646
Jam
mu
1222
5170
916
561
416
746
518
646
037
156
018
788
513
680
613
984
413
468
015
756
018
667
910
570
719
84K
anpu
r97
640
171
934
870
320
846
026
666
710
860
611
6276
632
469
222
079
841
871
517
6-
--
-71
236
31K
arna
l12
9327
498
718
613
8513
180
719
896
819
589
528
110
6821
996
723
813
2121
588
430
884
829
165
031
910
0828
55K
olka
ta16
5827
5-
-91
968
296
288
475
954
513
5836
219
2131
126
5931
428
2127
225
0822
913
4258
679
150
616
0949
66Lu
ckno
w10
8227
193
730
389
032
980
827
512
5623
375
235
994
232
587
932
711
1730
694
131
457
335
461
745
290
038
48M
umba
i13
4410
4260
276
882
690
561
173
151
082
087
189
611
8813
1413
2915
2412
7316
1810
6519
4712
7516
1277
210
1497
214
191
Nag
pur
1057
2950
292
3120
475
3260
340
2710
516
3239
474
3220
788
2720
1001
2790
974
2470
799
2980
498
2640
436
2370
638
3452
0N
asik
2173
1187
848
1920
1192
1620
903
1320
705
1885
1487
1529
2133
576
2028
460
2384
400
1388
570
2504
450
2206
760
1663
1267
7Pa
tna
936
630
843
560
1001
475
653
760
715
495
593
450
1296
373
1441
180
1592
485
1923
505
1321
580
961
430
1106
5923
Pune
2013
761
650
655
1250
719
1069
461
1123
523
1280
657
1343
749
1255
758
1313
932
1072
671
1753
755
1615
839
1311
8480
Raip
ur14
34-
766
-70
8-
637
-81
6-
810
-88
3-
1038
-12
50-
1487
-12
75-
826
-99
4-
Ranc
hi88
066
184
865
483
061
575
949
383
749
398
851
612
4950
114
1945
512
6853
213
7751
213
7649
785
861
110
5765
40Sh
imla
1050
34-
--
--
-10
2912
512
2511
912
4514
813
9812
414
0411
314
2175
1338
8812
7499
1265
925
Srin
agar
1267
2612
0719
410
3028
911
0522
510
7032
111
2573
1243
264
740
4510
0020
--
--
--
1087
1457
Sura
t21
1115
5372
424
5599
613
7061
617
7514
4613
0432
8592
931
7314
8329
1713
5232
5011
9624
0411
5530
3812
0519
4816
6821
5917
445
Triv
endr
um18
7517
486
824
810
4128
689
322
799
627
095
627
810
1234
810
4148
5410
9130
910
1922
211
8920
711
1329
310
9177
16
(Sou
rce:
NH
B, N
atio
nal H
ortic
ultu
re D
atab
ase
2011
)
Page 172
Vegetable Statistics
157
Tabl
e4.3
4: I
ndia
’s tr
ade
in e
ggpl
ant/b
rinj
al(Q
uant
ity in
t; V
alue
in 0
00’U
S$; U
nit v
alue
in U
S$/t)
Year
Expo
rtIm
port
Expo
rt%
sha
re in
Expo
rt%
sha
re in
Uni
tIm
port
% s
hare
inIm
port
% s
hare
inU
nit
Qua
ntity
wor
ld e
xpor
tVa
lue
wor
ld e
xpor
tVa
lue
Qua
ntity
wor
ld im
port
Valu
ew
orld
impo
rtVa
lue
2000
80.
002
0.00
250
00.
000
0.00
0
2001
250.
015
0.00
200
00.
000
0.00
0
2002
00.
000
0.00
00
0.00
00.
000
2003
630
0.22
488
0.22
775
00.
000
0.00
0
2004
670
0.20
695
0.25
1037
00.
000
0.00
0
2005
155
0.05
229
0.08
1477
00.
001
0.00
0
2006
1902
0.54
2140
0.78
1125
00.
000
0.00
0
2007
338
0.09
465
0.13
1376
00.
000
0.00
0
2008
290.
0128
0.01
966
10.
001
0.00
1000
2009
174
0.04
470.
0127
00
0.00
10.
000
2010
149
0.03
360.
0124
20
0.00
00.
000
(Sou
rce:
ww
w.fa
osta
t.fao
.org
)
Page 173
Indian Institute of Vegetable Research
158
Table 4.35: Major destinations of brinjal exports from India(Quantity in Kg; Value in `)
Country 2008-09 2009-10 2010-11Quantity Value Quantity Value Quantity Value
Sri lanka 0 (0)* 0.0 (0) 140000.0 (81) 1414600.0 (63) 28000.0 (86) 234196.0 (58)Maldives 0 (0) 0.0 (0) 7016.0 (4) 213131.0 (9) 4040.0 (12) 137884.0 (34)Singapore 0 (0) 0.0 (0) 0.0 (0) 0.0 (0) 490.0 (2) 28946.0 (8)Sudan 0 (0) 0.0 (0) 0.0 (0) 0.0 (0) 23.0 (0) 1847.0 (0)Mali 0 (0) 0.0 (0) 0.0 (0) 0.0 (0) 11.0 (0) 280.0 (0)Mexico 0 (0) 0.0 (0) 16.0 (0) 477.0 (0) 0.0 (0) 0.0 (0)Netherland 585.0 (2) 68408.0 (6) 0.0 (0) 0.0 (0) 0.0 (0) 0.0 (0)Canada 23574.0 (80) 1096955.0 (90) 0.0 (0) 0.0 (0) 0.0 (0) 0.0 (0)Nepal 0 (0) 0.0 (0) 18576.0 (11) 202816.0 (9) 0.0 (0) 0.0 (0)Italy 25.0 (0) 1199.0 (0) 70.0 (0) 1553.0 (0) 0.0 (0) 0.0 (0)UK 25.0 (0) 1346.0 (0) 3700.0 (2) 351567.0 (16) 0.0 (0) 0.0 (0)Bosnia 1621.0 (6) 16084.0 (1) 0.0 (0) 0.0 (0) 0.0 (0) 0.0 ()Bahrain 3241.0 (11) 31475.0 (3) 0.0 (0) 0.0 (0) 0.0 (0) 0.0 (0)UAE 0.0 (0) 0.0 (0) 4300.0 (2) 69740.0 (3) 0.0 (0) 0.0 (0)Bangladesh 270.0 (1) 3953.0 (0) 0.0 (0) 0.0 (0) 0.0 (0) 0.0 (0)Total 29341.0 (100) 1219420.0 (100) 173678.0 (100) 2253884.0 (100) 32564.0 (100) 403153.0 (100)
*Figures in parentheses indicate percentage to the total(Source:www.apeda.gov.in)
Cabbage
Table 4.36: Area, production and yield of cabbage and other brassicas
Years World IndiaArea Production Yield Area Production Yield
(Million ha) (Million t) (t/ha) (000’ha) (000’t) (t/ha)
1961 1.35 23.40 17.3 21 288 141962 1.37 23.05 16.9 22 295 131963 1.33 23.69 17.8 23 305 131964 1.29 24.34 18.9 24 315 131965 1.27 24.36 19.2 25 325 131966 1.28 25.43 19.9 27 350 131967 1.28 26.21 20.5 30 400 131968 1.31 26.55 20.2 38 500 131969 1.34 26.75 20.0 45 600 131970 1.34 27.84 20.7 52 700 131971 1.37 28.18 20.6 59 800 14
Contd...
Page 174
Vegetable Statistics
159
Years World IndiaArea Production Yield Area Production Yield
(Million ha) (Million t) (t/ha) (000’ha) (000’t) (t/ha)
1972 1.35 27.39 20.3 66 900 141973 1.39 30.16 21.7 73 1000 141974 1.40 30.39 21.7 80 1100 141975 1.40 31.43 22.4 87 1200 141976 1.40 33.51 23.9 94 1300 141977 1.41 33.00 23.3 101 1400 141978 1.52 37.81 24.8 108 1500 141979 1.51 35.00 23.2 115 1600 141980 1.56 35.81 23.0 121 1700 141981 1.58 36.74 23.2 128 1800 141982 1.59 39.38 24.8 134 1900 141983 1.58 37.82 23.9 141 2000 141984 1.64 41.49 25.3 148 2100 141985 1.61 38.86 24.2 148 2100 141986 1.70 39.99 23.5 155 2200 141987 1.79 38.47 21.5 155 2200 141988 1.69 38.78 22.9 160 2312 141989 1.72 39.09 22.8 165 2342 141990 1.65 39.35 23.8 168 2374 141991 1.70 40.11 23.6 178 2796 161992 1.73 39.43 22.7 216 4357 201993 1.86 42.35 22.8 230 3590 161994 1.92 42.56 22.1 220 3910 181995 2.06 45.01 21.8 290 4000 141996 2.20 47.86 21.7 291 4055 141997 2.19 48.25 22.0 230 4200 181998 2.30 50.16 21.8 230 5320 231999 2.50 53.51 21.4 240 5620 232000 2.78 75.84 27.3 258 5909 232001 2.63 72.30 27.4 245 5507 222002 2.52 69.46 27.5 258 5678 222003 2.48 69.22 27.9 234 5392 232004 2.38 67.76 28.5 255 5595 222005 2.39 66.57 27.8 288 6114 212006 2.22 65.66 29.5 254 5637 222007 2.20 62.24 28.3 249 5584 222008 2.24 64.88 29.0 266 5910 222009 2.26 64.23 28.5 310 6870 222010 2.26 64.45 28.4 301 7281 242011 2.37 68.84 29 369 7949 22ACGR for last ten years -0.97 -0.58 0.39 3.51 3.73 0.21(2002-2011)
(Source: www.faostat.com)
Page 175
Indian Institute of Vegetable Research
160
Table 4.37: Major cabbage producing countries in the world (2010-11)
Country Area % share to total global Production % share to total world Productivity(000’ha) area under cabbage (000’t) cabbage production (t/ha)
China 739.2 34.3 25156.6 42.2 34.0India 369.0 17.1 7949.0 13.3 21.5Russia 115.6 5.4 2732.5 4.6 23.6Japan 34.0 1.6 2247.7 3.8 66.1Korea 32.8 1.5 2035.7 3.4 62.1Ukraine 70.7 3.3 1497.4 2.5 21.2Indonesia 67.4 3.1 1384.7 2.3 20.6Poland 33.1 1.5 1141.2 1.9 34.5USA 26.9 1.2 1034.1 1.7 38.5Romania 47.2 2.2 983.6 1.7 20.8Others 616.6 28.6 13392.5 22.5 21.7Total 2152.5 100.0 59554.9 100.0 27.7
(Source: NHB, National Horticulture Database 2011)
Table 4.38: Percent share of area and production of cabbage in India
Year Area % of total area Production % of total Productivity(000’ha) under vegetables (000’t) vegetable production (t/ha)
1987-88 42.6 1 602 1.2 14.11991-92 177.3 3.2 2771.2 4.7 15.61992-93 188.9 3.7 3236.8 5.1 17.11993-94 231.7 4.8 3592.9 5.5 15.51994-95 216.8 4.3 3906.3 5.8 181995-96 218.4 4.1 3861.7 5.4 17.71996-97 210.2 3.8 3613.4 4.8 17.21997-98 228.2 4.1 5323.8 7.3 23.31998-99 239.9 4.1 5624 6.4 23.41999-00 258.3 4.3 5909.4 6.5 22.92000-01 245.4 3.9 5506.5 5.9 22.42001-02 258.1 4.2 5678.2 6.4 222002-03 233.8 3.8 5392 6.4 23.12003-04 255.1 4 5594.6 6 21.92004-05 287.8 4.3 6113.5 6 21.22005-06 253.5 3.5 5637.3 5.1 22.22006-07 249 3.3 5584 4.9 22.42007-08 266 3.4 5910 4.6 22.22008-09 310 3.9 6870 5.3 22.22009-10 331 4.1 7281.4 5.4 222010-11 369 4.3 7949 5.4 21.5
(Source: www.indiastat.com)
Page 176
Vegetable Statistics
161
Tabl
e 4.
39: S
tate
-wis
e ar
ea, p
rodu
ctio
n an
d yi
eld
of c
abba
ge in
Ind
ia f
rom
200
1-02
to 2
010-
11[A
rea
(A):
000’
ha; P
rodu
ctio
n (P
): 00
0’t;Y
ield
(Y):
t/ha]
Stat
es/U
Ts20
01-0
220
02-0
320
03-0
420
04-0
520
05-0
6A
PY
AP
YA
PY
AP
YA
PY
And
hra
Prad
esh
--
--
--
--
--
--
--
-
Ass
am24
.147
419
.724
.164
476.
113
19.7
24.2
747
9.3
19.7
24.5
748
5.2
19.7
24.3
480.
319
.8
Biha
r35
.156
1.4
1635
.456
616
36.5
584.
116
59.7
955.
216
33.7
931.
627
.6C
hhat
tisga
rh-
--
2.9
116.
440
3.1
122.
339
.54.
651
.411
.16.
811
416
.8
Guj
arat
11.8
189.
716
.110
.417
9.7
17.3
10.4
179.
717
.314
.425
5.2
17.7
1932
9.2
17.3
Har
yana
7.3
107.
214
.76.
795
.714
.49.
111
820
.110
.416
5.3
3012
.317
2.2
30
Him
acha
l Pra
desh
--
--
--
--
--
Jam
mu
&K
ashm
ir-
--
--
--
--
-
Jhar
khan
d6.
513
0.7
208
112.
520
--
--
--
Kar
nata
ka-
--
--
--
-6.
312
9.1
206.
413
4.2
20
Mad
hya
Prad
esh
--
--
--
7.3
146.
98.
216
4.6
15.9
3.8
7514
Mah
aras
htra
13.4
334.
725
13.5
336.
425
13.7
343.
725
.114
.134
8.9
24.8
1538
125
.4
Man
ipur
--
--
--
--
--
Miz
oram
--
--
--
--
--
Nag
alan
d-
--
--
--
--
-O
dish
a44
.912
38.9
27.6
33.4
913.
827
.433
.592
5.1
27.6
33.7
931
27.6
33.6
578.
315
.8
Punj
ab-
--
--
--
--
-
Tam
il N
adu
--
2.2
112.
514
--
--
--
Trip
ura
--
--
--
--
--
Utta
r Pr
ades
h7
209.
430
720
9.7
307
209.
830
720
9.9
307
209.
930
Utta
rakh
and
--
--
--
--
--
Wes
t Ben
gal
65.9
1843
.728
68.6
1938
.728
.370
.718
30.5
25.9
71.3
1863
.926
.174
.719
82.7
26.5
Oth
ers
42.3
588.
521
.832
0.7
39.6
655.
316
.633
.555
3.8
16.5
27.7
553.
119
.2
Tota
l Ind
ia25
8.3
5678
.221
.923
4.06
5378
.222
.925
5.2
5594
.723
.828
7.8
6113
.521
.326
4.3
5941
.521
.9
Tabl
e co
ntin
ues
Page 177
Indian Institute of Vegetable Research
162
Stat
es/U
Ts20
06-0
720
07-0
820
08-0
920
09-1
020
10-1
1A
PY
AP
YA
PY
AP
YA
PY
And
hra
Prad
esh
--
--
134.
3-
913
4.3
-9
136.
1-
28.5
427.
515
Ass
am0
0-
--
-29
.258
5.2
2029
.861
4.2
20.6
30.7
629.
720
.5
Biha
r37
623.
516
.837
.463
8.1
17.1
38.3
677
17.7
38.7
689.
917
.839
.271
1.1
18.2
Chh
attis
garh
812
8.7
1611
.317
7.4
15.7
13.6
213.
715
.713
.722
7.8
16.7
14.7
257.
717
.5
Guj
arat
19.7
340
17.3
2339
6.2
17.2
2340
4.6
17.6
25.6
473.
818
.528
.255
3.6
19.6
Har
yana
10.8
172.
916
11.3
152.
613
.511
.221
4.2
192
12.2
218.
317
.813
.826
2.4
19
Him
acha
l Pra
desh
--
-11
9.8
4.5
140.
84.
514
4.7
-14
4.7
-
Jam
mu
&K
ashm
ir-
--
24.2
3.6
63.5
2.9
66.7
-66
.7-
Jhar
khan
d10
.516
8.2
1611
.418
316
.115
.424
616
26.8
429.
316
2745
1.7
16.7
Kar
nata
ka6.
613
8.2
20.7
8.2
170.
220
.88.
617
8.7
20.8
8.9
176.
219
.8-
--
Mad
hya
Prad
esh
6.3
125
--
129.
2-
7.1
142.
5-
7.9
157.
3-
-15
7.3
-
Mah
aras
htra
14.4
364.
725
.415
.138
325
.415
381
25.4
1744
226
1836
020
Man
ipur
--
-27
.44
43.8
443
.8-
74.7
-
Miz
oram
--
-5
323
.92.
444
.4-
45.8
-
Nag
alan
d-
--
30.
33
0.3
3-
3-
Odi
sha
33.8
933.
327
.633
.893
5.6
27.7
34.8
966.
227
.835
.899
9.9
27.9
41.2
1152
.128
Punj
ab-
--
88.2
4.1
91.9
4.3
97.1
-97
.5-
Tam
il N
adu
1.7
93.4
53.4
2.5
141.
256
.22.
715
3.9
2.6
72.8
-78
.6-
Trip
ura
--
-41
.31.
941
.41.
942
.6-
42.6
-
Utta
r Pr
ades
h7
209.
9-
68.7
1.8
56.1
238
.7-
40.2
-
Utta
rakh
and
--
-61
.75.
165
.35.
168
.1-
70.1
-
Wes
t Ben
gal
72.8
1968
.127
73.2
2016
.127
.574
.120
42.7
27.6
74.3
2059
27.7
75.3
2087
.827
.7
Oth
ers
--
19.3
41.6
858.
220
.747
.296
0.3
20.4
48.2
951
19.7
52.3
1055
.120
.2
Tota
l Ind
ia22
8.6
5265
.923
.226
8.8
6754
.423
.435
7.5
7830
.020
.737
7.9
8196
.720
.836
8.9
8769
.920
.2
(Sou
rce:
ww
w.in
dias
tat.c
om)
Page 178
Vegetable Statistics
163
Table 4.40: District-wise area production and yield of cabbage
Andhra Pradesh (Cabbage + Knol-Khol )(2006-07)
Districts Area (ha) Production (t) Yield (t/ha)
Srikakulam 301 4515 15VijayaNagaram 374 5610 15Vishakhapatnam 1700 25500 15East Godawari 221 3315 15West Godawari 81 1215 15Krishna 230 3450 15Guntur 250 3750 15Prakasam 20 300 15Nellore 200 3000 15Coastal Area 3377 50655 15Chittoor 115 1725 15Anatapuram 260 3900 15Karnool 60 900 15Rayalaseema Region 435 6525 15Andhra Region 3812 57180 15Mehaboob Nagar 110 1650 15Ranga Reddy 519 7785 15Medak 200 3000 15Nizamabad 60 900 15Adilabad 1575 23625 15Karim Nagar 37 555 15Warangal 200 3000 15Khamam 60 900 15Nalgonda 80 1200 15Telangana Region 2841 42615 15Total 6653 99795 15
(Source: www.indiastat.com)
Bihar (2005-06)
Patna 2043 33097 16Nalanda 1648 26698 16Bhojpur 673 10768 16Buxar 442 6984 16Rohtas 578 8670 15Kaumur 391 5865 15Gaya 852 12950 15Jehanabad 297 4574 15
Contd...
Page 179
Indian Institute of Vegetable Research
164
Districts Area (ha) Production (t) Yield (t/ha)
Arwal 272 4134 15Nawadah 703 10545 15Aurangabad 677 10155 15Saran 939 14273 15Siwan 814 12291 15Gopatganj 1009 15438 15Mujaffarpur 2696 43136 16E.Champaran 1533 23762 16W.Champaran 1542 24364 16Sitamati 887 13482 15Sheohar 621 9501 15Vaishali 2333 38261 16Darbhanga 1606 25696 16Madhubani 1398 21669 16Samastipur 1702 27232 16Begusarai 997 15952 16Munger 457 7312 16Sheikhpura 168 2604 16Lakhisarai 143 2288 16Jamui 369 5535 15Khagaria 638 10080 16Bhagalpur 1141 18256 16Banka 398 5970 15Saharsa 898 14548 16Supaul 421 6887 16Madhepura 1458 23865 16Pumea 1052 16832 16Kisanganj 528 8448 16Araria 516 7998 16Katihar 1762 28192 16Total 36602 578312 16
(Source: www.indiastat.com)
Haryana (2006-07)
Panchkula 70 500 7Ambala 210 4250 20Yamunanagar 1210 28935 24Kurukshetra 455 4410 10Kaithal 455 6635 15Karnal 579 8458 15
Contd...
Page 180
Vegetable Statistics
165
Districts Area (ha) Production (t) Yield (t/ha)
Panipat 170 1312 8Sonipat 2365 37790 16Rohtak 260 2100 8Jhajjar 200 1590 8Faridabad 640 20440 32Narnual 410 10390 25Rewari 200 3000 15Gurgaon 993 8145 8Bhiwani 510 6050 12Hissar 330 2600 8Fatehabad 715 10900 15Sirsa 410 8070 20Jind 560 5850 10Mewat 85 1460 17Total 10827 172885 16
(Source: www.indiastat.com)
Himachal Pradesh (2005-06)
Bilaspur 30 840 28Chamba 64 1400 22Hamirpur 70 1750 25Kangra 270 7487 28Kinnaur 80 1400 18Kullu 820 24600 30Lahaul&Spiti 29 235 8Mandi 370 10778 29Shimla 1700 59500 35Sirmour 125 5175 41Solan 71 1775 25Una 48 980 20Total 3677 115920 32
(Source: www.indiastat.com)
Odisha (2006-07)
Balasore 521 14387 28Bhadrak 786 21705 28Bolangir 2443 67463 28Sonepur 457 12620 28Cuttack 1899 52488 28
Contd...
Page 181
Indian Institute of Vegetable Research
166
Districts Area (ha) Production (t) Yield (t/ha)
J.S. Pur 3265 90185 28Jaipur 117 3232 28Kendrapara 1704 47056 28Dhenkanal 1427 39408 28Angul 1303 36484 28Ganjam 1534 42362 28Gajapati 344 9500 28Keonjhar 2725 75253 28Kalahandi 365 10081 28Khariar 282 7787 28Koraput 782 21595 28Malkangiri 909 25102 28N.W. Pur 303 8367 28Rayagade 282 7789 28Phulbani 2505 69177 28Boudh 1315 36314 28Mayurbhanj 1681 46421 28Puri 239 6600 28Khurda 2440 67381 28Nayagarh 1092 30156 28Sambalpur 453 12510 28Deogarh 89 2458 28Bargarh 120 3317 28Jharsuguda 95 2623 28Sundargarh 2300 63515 28Total 33777 933336 28
(Source: www.indiastat.com)
Punjab (2005-06)
Hoshiarpur 190 3908 21Jalandhar 500 11393 23Ludhiana 156 3663 23Ferozepur 54 1184 22Amritsar 328 6606 20Gurdaspur 80 1832 23Kapurthala 615 14293 23Bathinda 38 929 24Sangrur 154 3564 23Patiala 214 5358 25Ropar 49 1000 20
Contd...
Page 182
Vegetable Statistics
167
Districts Area (ha) Production (t) Yield (t/ha)
Faridkot 10 204 20
Mansa 22 453 21Fatehgarh Sahib 563 11558 21
Moga 62 1348 22
Mukatsar 6 130 22
Nawashehar 219 4041 18
Total 3260 71464 22
(Source: www.indiastat.com)
Rajasthan (2006-07)
Alwar 11 25 2
Bharatpur 17 82 5
Bundi 85 462 5
Chittorgarh 2 6 3Hanumangarh 71 1138 16
Jalore 44 97 2
Jhalawar 46 46 1
Jodhpur 36 22 1
Kota 114 3556 31
Nagaur 12 23 2
Udaipur 27 5 0
Total 465 5462 12
(Source: www.indiastat.com)
Tamil Nadu (2005-06)
Coimbatore 4 214 53.5
Cuddalore 23 1229 53.43
Dharmapuri 1 53 53
Dindigul 19 1015 53.42
Erode 32 1710 53.44
Krishnagiri 400 14849 37.12
Namakkal 3 160 53.33
The Nilgiris 963 57971 60.2
Theni 172 9189 53.42
Vellore 2 107 53.5
Total 1619 86497 53.43
(Source: www.indiastat.com)
Page 183
Indian Institute of Vegetable Research
168
Uttar Pradesh[Area (A) in ha; Production (P) in t; Yield (Y) in t/ha]
District/division 2008-09 2009-10 2010-11A P Y A P Y A P Y
Meerut 139 4350 31 247 7751 31 272 8604 32Agra 231 7192 31 280 8742 31 309 9683 31Aligarh 116 3615 31 138 4305 31 152 4748 31Bareilly 23 725 32 0 0 0 0 0 0Kanpur 91 2848 31 64 2013 31 71 2288 32Allahabad 19 600 32 70 2215 32 78 2476 32Jhansi 5 157 31 4 126 32 4 126 32Chitrakoot Dham 15 470 31 20 632 32 22 699 32Varanasi 20 630 32 23 720 31 26 825 32Mirzapur 0 0 0 4 126 32 4 127 32Azamgarh 9 284 32 29 919 32 31 985 32Gorakhpur 85 2178 26 107 2749 26 118 3034 26Basti 30 780 26 30 788 26 33 867 26Shri Patan devi 85 2678 32 60 1894 32 66 2088 32Lucknow 155 4883 32 272 8615 32 300 9507 32Faziabad 119 3767 32 92 2922 32 101 3402 34Total 1142 35157 31 1440 44517 31 1587 49459 31
(Source: State Horticulture Mission, Government of Uttar Pradesh)
West Bengal (2005-06)
Districts Area (ha) Production (t) Yield (t/ha)
Darjeeling 0.97 33.00 34.02Jalpaiguri 4.76 118.52 24.86Coochbehar 6.90 186.15 26.96North Dinajpur 3.50 65.60 18.74South Dinajpur 4.03 125.67 31.11Malda 3.94 112.56 28.57Murshidabad 12.13 331.50 27.33Nadia 6.97 217.30 31.17North 24-Parganas 4.67 130.10 27.85South 24-Parganas 5.40 165.40 30.63Howrah 1.18 34.53 29.11Hooghly 2.85 44.27 15.52Burdwan 3.25 92.30 28.40Birbhum 2.37 54.55 22.98Bankura 4.75 144.59 30.39Purulia 1.80 51.59 28.66Midnapur (West) 3.44 34.93 10.13Midnapur (East) 1.75 40.11 22.92West Bengal 74.71 1982.67 26.54
(Source: www.indiastat.com)
Page 184
Vegetable Statistics
169
Tabl
e 4.
41: M
onth
lyw
hole
sale
pri
ce in
dex
(WPI
) of
cabb
age
in I
ndia
{(Ba
se y
ear:
1993
-94;
200
4-05
=100
) (A
pril
1994
to J
uly
2012
)}
Year
Jan.
Feb.
Mar
.A
pr.
May
Jun.
Jul.
Aug
.Se
pt.
Oct
.N
ov.
Dec
.
1993
-94=
100
1994
74.2
92.6
147.
211
8.2
161.
215
3.6
137.
910
1.5
64.8
1995
54.5
51.4
54.9
62.1
95.3
153.
117
9.5
160.
614
4.0
216.
320
1.3
147.
519
9685
.467
.871
.410
5.6
162.
315
7.6
167.
014
7.8
124.
914
9.5
118.
198
.119
9780
.076
.262
.374
.297
.010
1.2
124.
716
1.6
234.
627
8.9
152.
311
4.7
1998
113.
488
.413
7.1
149.
716
7.6
273.
631
4.4
183.
415
0.6
219.
532
1.6
232.
819
9988
.348
.845
.146
.482
.990
.990
.990
.917
0.3
183.
918
3.9
183.
920
0018
3.9
183.
918
3.9
148.
015
9.7
128.
717
1.3
180.
018
6.2
238.
724
0.6
164.
520
0196
.171
.371
.375
.991
.515
7.3
296.
725
7.1
243.
730
7.7
226.
214
7.3
2002
102.
810
1.4
97.6
108.
010
9.1
141.
322
7.3
204.
817
2.3
178.
515
7.1
114.
720
0392
.579
.685
.310
0.9
113.
622
1.0
256.
321
3.9
183.
317
9.4
202.
816
8.9
2004
119.
589
.685
.087
.810
4.5
135.
513
6.6
168.
918
6.6
199.
124
4.1
162.
120
0586
.688
.988
.910
3.4
164.
121
4.6
243.
620
4.5
195.
420
8.6
199.
517
8.2
2006
162.
411
0.0
79.6
74.8
77.9
126.
614
8.1
230.
823
6.6
261.
124
4.3
170.
120
0712
5.3
132.
218
9.2
209.
523
5.2
249.
230
4.9
331.
624
5.8
248.
921
8.1
171.
320
0816
6.8
129.
912
0.8
103.
314
6.7
201.
322
5.7
218.
224
9.0
279.
042
0.8
337.
520
0926
0.6
161.
114
9.9
158.
818
4.1
219.
828
4.1
303.
724
9.1
259.
121
4.5
195.
520
1015
1.6
138.
114
4.4
145.
520
1.5
279.
032
9.4
283.
1
2004
-05=
100
2005
77.7
121.
515
8.0
179.
615
1.2
137.
914
9.5
150.
312
3.2
2006
132.
885
.061
.154
.256
.386
.010
3.0
159.
316
2.3
177.
116
5.5
121.
620
0797
.910
7.9
143.
015
7.7
170.
318
1.1
216.
623
2.3
174.
117
4.8
158.
912
6.1
2008
100.
798
.893
.983
.310
7.4
137.
915
3.3
157.
117
2.1
194.
430
3.1
255.
420
0921
9.9
125.
811
2.4
109.
712
3.5
148.
519
0.8
213.
317
8.7
184.
815
7.7
147.
620
1012
6.3
113.
011
3.9
115.
315
4.2
222.
626
0.1
236.
122
6.0
212.
424
6.6
302.
020
1128
2.0
167.
115
0.5
130.
214
0.7
157.
719
9.6
231.
628
7.5
306.
025
3.1
198.
820
1216
2.4
201.
626
9.9
416.
143
7.6
447.
138
4.4
(Sou
rce:
ww
w.in
dias
tat.c
om)
Page 185
Indian Institute of Vegetable Research
170
Tabl
e 4.
42: M
onth
ly a
vera
ge w
hole
sale
pri
ce (W
P) a
nd a
rriv
al (A
R) o
f ca
bbag
e du
ring
the
peri
od J
anua
ry to
Dec
embe
r, 20
11
[Ave
rage
who
lesa
le p
rice
(WP)
in `
/q a
nd A
rriv
al (A
R) in
tone
s]
Mar
ket
Jan
Feb
Mar
chA
pril
May
June
July
Aug
Sept
Oct
Nov
Dec
Tota
lW
PA
RW
PA
RW
PA
RW
PA
RW
PA
RW
PA
RW
PA
RW
PA
RW
PA
RW
PA
RW
PA
RW
PA
RW
PA
R
Abo
har
--
--
--
--
1211
724
1349
626
1296
025
1243
523
1041
729
6761
6077
1447
8417
5610
540
290
Agr
a43
6717
244
0012
644
9698
5438
7057
7573
5972
7263
0428
667
1935
565
2549
469
1754
761
9375
154
0438
957
0934
33
Ahm
edab
ad63
8470
4087
8370
387
0039
694
7715
811
960
137
1212
025
012
681
337
1235
016
--
--
--
--
1030
790
37
Am
rits
ar-
-35
005
--
--
--
--
--
--
--
3920
600
3393
397
3632
679
3611
1681
Bang
alor
e51
3517
9561
1313
1568
4610
0081
0599
088
4694
086
6145
499
4810
6510
727
580
6000
150
7962
4360
7396
8430
9222
3150
7913
2422
9
Bara
ut56
5057
6689
3276
3526
8691
2210
594
2712
228
2713
269
2610
158
4872
3834
4950
7949
8678
5735
4981
5250
5
Bhop
al-
--
-70
5756
982
6614
590
3611
611
440
2911
350
1168
0040
--
--
--
--
8992
910
Bhub
anes
hwar
5179
287
6190
237
6665
293
7764
221
8013
157
7771
5780
8152
--
6436
9367
4461
560
0168
760
8388
068
1235
81
Cha
ndig
arh
3906
942
2823
148
7733
586
6737
1031
618
5-
-23
7530
--
4375
45-
-42
2512
6044
3480
352
6729
35
Che
nnai
7910
456
8329
452
1150
050
--
--
--
--
--
--
--
--
--
9216
958
Deh
radu
n40
8810
255
9851
--
--
--
--
--
--
--
--
5324
193
4842
251
4963
597
Del
hi41
8727
797
4549
1352
354
0263
6253
6236
6864
0713
6051
5623
2-
--
-50
5683
726
5345
1088
7950
5711
8518
5362
9577
751
8845
9842
Gan
gato
k42
508
--
--
--
--
--
--
--
--
--
--
--
4250
8
Guw
ahat
i-
--
--
--
--
--
--
--
--
-73
7515
258
9839
353
7950
462
1710
49
Hyd
erab
ad50
4054
2438
3348
0546
3734
661
3444
4957
1242
9345
6955
3153
6064
8176
5637
6961
6720
3-
--
--
-54
5645
301
Jaip
ur55
4415
557
8178
--
--
--
--
--
6155
120
--
--
4528
193
4081
1167
5218
1713
Jala
ndha
r44
4094
148
2436
7-
--
--
--
--
--
--
-31
3540
526
6724
9-
-37
6719
62
Jam
mu
4038
366
4005
52-
--
--
--
--
-51
7132
346
3112
816
4764
3250
648
1715
620
4140
2351
4509
6403
4
Kan
pur
4105
331
4895
179
4563
146
5730
154
6650
16-
--
-58
5025
046
5628
9244
3219
92-
--
-51
1059
60
Kol
kata
5565
4632
6052
1819
6293
499
6787
943
6922
54-
--
--
-48
6011
6856
5777
4449
8610
768
4321
1043
057
1638
057
Luck
now
3925
685
4553
274
4841
157
5746
143
6324
101
--
825
4041
0029
4510
611
4661
1864
4324
1464
4587
1013
4400
6381
Mum
bai
--
--
--
--
--
--
--
3579
4062
8134
8573
5693
4053
5872
6057
6067
2056
6726
845
Nag
pur
3136
920
3487
885
4673
335
8260
152
9802
197
8731
283
8610
3410
6333
1205
5638
1940
5506
1838
6096
940
5333
894
6300
1299
9
Patn
a38
3834
5-
--
--
--
--
--
--
--
-47
7818
9037
5930
6036
6915
6040
1168
55
Pune
6384
672
7422
234
1800
70-
--
--
-23
0055
--
--
7482
407
7050
610
6021
929
5494
2977
Rai
pur
5424
226
5735
5556
5443
6386
2469
502
--
--
--
--
8700
2486
0056
--
6778
430
Ran
chi
1876
759
1953
670
1887
799
3244
520
3433
488
3470
207
--
2743
135
3738
535
3346
472
2050
533
3720
553
2951
5671
Srin
agar
3188
640
3350
265
--
--
--
--
2300
838
7537
4288
1193
4950
2740
4352
1505
3525
1415
3729
7803
Sura
t34
4028
540
2319
048
6528
751
8041
4-
--
--
--
--
-36
0021
832
5032
932
5431
839
4520
41
Triv
endr
um-
--
--
--
--
--
--
--
--
--
--
-69
8516
069
8516
0
(Sou
rce:
NH
B, N
atio
nal H
ortic
ultu
re D
atab
ase
2011
)
Page 186
Vegetable Statistics
171
Tabl
e 4.
43: I
ndia
’s tr
ade
in c
abba
ge a
nd o
ther
bra
ssic
as(Q
uant
ity in
t; V
alue
in ‘0
00 U
S$; U
nit v
alue
in U
S$/t)
Year
Expo
rtIm
port
Expo
rt%
sha
re in
Expo
rt%
sha
re in
Uni
tIm
port
% s
hare
inIm
port
% s
hare
inU
nit
Qua
ntity
wor
ld e
xpor
tVa
lue
wor
ld e
xpor
tVa
lue
Qua
ntity
wor
ld im
port
Valu
ew
orld
impo
rtVa
lue
1961
770.
0612
0.12
156
00.
000
0.00
019
629
0.01
20.
0122
20
0.00
00.
000
1963
570.
048
0.04
140
00.
000
0.00
019
640
0.00
00.
000
00.
000
0.00
0
1965
00.
000
0.00
00
0.00
00.
000
1966
10.
000
0.00
00
0.00
00.
000
1967
40.
000
0.00
00
0.00
00.
000
1968
00.
000
0.00
00
0.00
00.
000
1969
190.
013
0.01
158
00.
000
0.00
019
7010
20.
0518
0.07
176
00.
000
0.00
0
1971
40.
001
0.00
250
00.
000
0.00
019
7226
0.01
30.
0111
50
0.00
00.
000
1973
10.
000
0.00
00
0.00
00.
000
1974
391
0.16
290.
0674
00.
000
0.00
0
1975
500
0.19
880.
1717
60
0.00
00.
000
1976
113
0.04
180.
0215
90
0.00
00.
000
1977
10.
000
0.00
00
0.00
00.
000
1978
00.
000
0.00
04
0.00
10.
0025
019
790
0.00
00.
000
00.
000
0.00
019
800
0.00
00.
000
00.
000
0.00
019
8110
0.00
50.
0050
00
0.00
00.
000
1982
70.
0020
0.02
2857
00.
000
0.00
019
8329
0.01
150.
0251
70
0.00
00.
000
1984
140.
007
0.01
500
00.
000
0.00
0
1985
200.
0012
0.01
600
00.
000
0.00
0
Con
td...
Page 187
Indian Institute of Vegetable Research
172
Year
Expo
rtIm
port
Expo
rt%
sha
re in
Expo
rt%
sha
re in
Uni
tIm
port
% s
hare
inIm
port
% s
hare
inU
nit
Qua
ntity
wor
ld e
xpor
tVa
lue
wor
ld e
xpor
tVa
lue
Qua
ntity
wor
ld im
port
Valu
ew
orld
impo
rtVa
lue
1986
132
0.03
470.
0435
60
0.00
00.
000
1987
670.
0227
0.02
403
00.
000
0.00
019
8896
0.02
210.
0121
90
0.00
00.
000
1989
440.
0113
0.01
295
00.
000
0.00
0
1990
20.
002
0.00
1000
00.
000
0.00
019
910
0.00
00.
000
00.
000
0.00
019
9220
0.00
50.
0025
00
0.00
00.
000
1993
00.
000
0.00
00
0.00
00.
000
1994
135
0.01
120.
0089
00.
000
0.00
019
9534
0.00
40.
0011
80
0.00
00.
000
1996
540.
016
0.00
111
431
0.04
260.
0060
1997
260.
0016
0.00
615
418
0.04
200.
0048
1998
90.
009
0.00
1000
1091
0.09
410.
0138
1999
180.
007
0.00
389
2046
0.16
148
0.02
72
2000
260.
0014
0.00
538
2158
0.16
140
0.02
6520
0139
0.00
310.
0179
525
190.
1921
50.
0485
2002
380.
0014
0.00
368
2969
0.22
250
0.04
8420
0347
40.
0410
80.
0222
885
10.
0657
0.01
67
2004
696
0.06
210
0.04
302
2209
0.15
155
0.02
7020
0574
40.
0625
70.
0434
519
880.
1216
20.
0281
2006
378
0.03
132
0.02
349
3692
0.22
238
0.03
64
2007
1122
0.07
285
0.03
254
4604
0.26
385
0.04
8420
0879
60.
0532
20.
0340
550
910.
2747
20.
0493
2009
2990
0.20
535
0.06
179
2205
0.12
189
0.02
8620
1049
090.
2710
680.
1021
822
400.
1115
40.
0169
(Sou
rce:
ww
w.fa
osta
t.fao
.org
)
Page 188
Vegetable Statistics
173
Table 4.44: Major destinations of cabbage from India(Quantity in t; Value in Lakhs `)
Country 2008-09 2009-10 2010-11Quantity Value Quantity Value Quantity Value
UAE 1420.9 (79)* 86.4 (65) 724.7 (85) 63.9 (85) 168.1 (42) 25.2 (55)
Maldives 201.2 (11) 11.6 (9) 77.0 (9) 7.8 (10) 214.9 (52) 19.2 (42)
Nepal 22.5 (1) 1.3 (1) 21.3 (3) 1.1 (2) 20.7 (5) 0.9 (2)
Singapore 0.0 (0) 0.0 (0) 0.0 (0) 0.0 (0) 1.2 (1) 0.3 (1)
Bangladesh 0.0 (0) 0.0 (0) 13.0 (2) 0.6 (1) 0.0 (0) 0.0 (0)
Mauritius 144.5 (9) 34.6 (25) 0.0 (0) 0.0 (0) 0.0 (0) 0.0 (0)
Oman 0.0 (0) 0.0 (0) 8.8 (1) 0.9 (1) 0.0 (0) 0.0 (0)
Qatar 0.2 (0) 0.0 (0) 0.0 (0) 0.0 (0) 0.0 (0) 0.0 (0)
Saudi Arabia 0.0 (0) 0.0 (0) 3.0 (0) 0.5 (1) 0.0 (0) 0.0 (0)
Total 1789.2 (100) 133.9 (100) 847.9 (100) 74.8 (100) 404.9 (100) 45.6 (100)
* Figures in parenthesis give percentage to the total exports.(Source:www.apeda.gov.in)
Table 4.45: Major destinations of cabbage seeds export from India
(Quantity: Kg, Value: `)
Country 2008-09 2009-10 2010-11Quantity Value Quantity Value Quantity Value
Bangladesh 330 2776875 606 1910606 35717 329211
Pakistan 8220 623926 11308 1817679 25906 3472805
Sri lanka 15 149804 0 0 62 397574
China 0 0 14060 1742182 50 287398
Mauritius 0 0 10 77463 132 254843
Philippines 0 0 0 0 20 144800
Nepal 68 66966 97 669920 40 144615
Oman 30 289585 2260 339195 900 43992
USA 395 163571 286 142691 354 39481
UAE 20 17260 0 0 4 34123
Others 3272 5789755 546 376913 0 0
Total 12350 9877742 29173 7076649 63185 8748842
(Source: www.agriexchange.apeda.gov.in)
Page 189
Indian Institute of Vegetable Research
174
Cauliflower
Table 4.46: Area, production and yield of cauliflowers and broccoli
Years World IndiaArea Production Yield Area Production Yield
(Million ha) (Million t) (t/ha) (000’ha) (000’t) (t/ha)
1961 0.24 3.39 14.4 41 413 101962 0.23 3.09 13.2 40 400 101963 0.24 3.36 13.9 40 410 101964 0.26 3.60 13.9 50 500 101965 0.25 3.60 14.3 50 520 101966 0.27 3.79 14.2 60 600 101967 0.28 4.02 14.4 60 650 111968 0.29 4.09 14.0 70 750 111969 0.31 4.31 14.0 80 900 111970 0.31 4.32 13.8 90 950 111971 0.31 4.34 13.9 90 1000 111972 0.32 4.47 14.2 100 1100 111973 0.32 4.49 13.8 100 1100 111974 0.34 4.79 14.2 110 1300 121975 0.34 4.76 13.9 110 1300 121976 0.35 4.89 13.9 120 1400 121977 0.37 5.10 13.9 130 1500 121978 0.39 5.45 14.1 140 1600 111979 0.40 5.54 13.8 150 1800 121980 0.42 5.94 14.2 160 1900 121981 0.44 6.29 14.4 170 2000 121982 0.45 6.56 14.5 180 2200 121983 0.47 6.75 14.4 190 2300 121984 0.48 6.95 14.5 190 2400 131985 0.51 7.44 14.7 200 2600 131986 0.52 7.66 14.9 200 2700 141987 0.54 8.14 15.0 210 2900 141988 0.55 8.66 15.6 220 3000 141989 0.57 8.87 15.4 230 3200 141990 0.59 9.13 15.4 239 3395 141991 0.56 9.05 16.0 203 2998 151992 0.58 10.32 17.8 222 4220 191993 0.59 10.02 17.1 190 2870 151994 0.65 11.42 17.6 230 3780 161995 0.66 11.90 18.0 235 4000 17
Contd...
Page 190
Vegetable Statistics
175
Years World IndiaArea Production Yield Area Production Yield
(Million ha) (Million t) (t/ha) (000’ha) (000’t) (t/ha)
1996 0.74 13.26 17.8 280 4500 161997 0.76 13.81 18.1 290 5000 171998 0.74 13.63 18.4 250 4470 181999 0.76 14.10 18.5 250 4690 192000 0.79 14.99 19.1 250 4720 192001 0.80 15.11 18.9 260 4690 182002 0.84 15.71 18.6 270 4890 182003 0.89 16.46 18.5 280 4800 172004 0.97 17.06 17.7 268 4940 182005 0.95 16.61 17.5 239 4515 192006 1.04 17.79 17.2 289 5323 182007 1.08 18.33 16.9 302 5538 182008 1.06 18.79 17.8 312 5777 192009 1.14 19.85 17.3 349 6532 192010 1.16 20.03 17.4 348 6569 192011 1.21 20.88 17.3 369 6745 18ACGR for last ten years 3.86 3.13 -0.7 4.02 4.50 0.46(2002-2011)
(Source:www.faostat.fao.org)
Table 4.47: Major cauliflower producing countries in the world (2010-11)
Country Area % share to total Production % share to total Productivity(000’ha) cauliflower area (000’t) cauliflower (t/ha)
production
China 391.0 35.0 7555.2 39.9 19.3India 369.0 33.0 6745.0 35.6 18.3Spain 29.0 2.6 511.1 2.7 17.6Italy 17.9 1.6 427.4 2.3 23.9France 26.1 2.3 371.0 2.0 14.2Pakistan 12.6 1.1 313.4 1.7 24.8USA 14.7 1.3 284.9 1.5 19.4Poland 15.7 1.4 252.3 1.3 16.1UK 16.5 1.5 188.3 1.0 11.4Bangladesh 16.7 1.5 160.0 0.8 9.6Others 209.5 18.7 2122.8 11.2 10.1Total 1118.6 100.0 18931.5 100.0 16.9
(Source: NHB, National Horticulture Database 2011)
Page 191
Indian Institute of Vegetable Research
176
Table 4.48: Percent share of area and production of cauliflower in India
Year Area % of total area Production % of total Productivity(000’ha) under vegetables (000’t) vegetable (t/ha)
production
1987-88 75.1 1.8 558.6 1.1 7.4
1991-92 202.8 3.6 2998.1 5.1 14.8
1992-93 230.7 4.6 3612.2 5.7 15.7
1993-94 188.5 3.9 2872.9 4.4 15.2
1994-95 216.1 4.3 3244.1 4.8 15
1995-96 220 4.1 2474 3.5 11.2
1996-97 233.9 4.2 3419 4.6 14.6
1997-98 248.2 4.4 4471 6.2 18
1998-99 255.4 4.4 4690.6 5.3 18.4
1999-00 248.3 4.1 4717.8 5.2 19
2000-01 256.3 4.1 4695.8 5 18.3
2001-02 269.9 4.4 4890.5 5.2 18.1
2002-03 254.6 4.2 4444.1 5.2 17.5
2003-04 267.9 4.2 4940.2 5.3 18.4
2004-05 238.5 3.5 4514.8 4.5 18.9
2005-06 288.6 4 5323.1 4.8 18.4
2006-07 302 4 5538 4.8 18.3
2007-08 312 4 5777 4.5 18.5
2008-09 349 4.4 6532 5.1 18.7
2009-10 347.9 4.4 6569 4.9 18.9
2010-11 369 4.3 6745 4.6 18.3
(Source: www.indiastat.com)
Page 192
Vegetable Statistics
177
Tabl
e 4.
49: S
tate
-wis
e ar
ea p
rodu
ctio
n an
d yi
eld
of c
aulif
low
er in
Ind
ia f
rom
200
1-02
to 2
010-
11[A
rea
(A):
000’
ha; P
rodu
ctio
n (P
): 00
0’t;Y
ield
(Y):
t/ha]
Stat
es/U
Ts20
01-0
220
02-0
320
03-0
420
04-0
520
05-0
6A
PY
AP
YA
PY
AP
YA
PY
Ass
am16
.323
9.7
14.7
16.5
0824
2.7
14.7
16.6
224
6.9
14.8
16.9
525
1.7
14.8
16.7
247.
814
.8
Biha
r59
.294
7.3
1659
.595
1.4
1659
.795
5.6
1636
.559
8.8
16.4
59.8
938.
515
.7
Chh
attis
garh
--
--
--
3.9
61.9
15.9
5.8
61.8
10.6
9.6
123.
512
.9
Del
hi-
--
--
--
-17
.5-
-
Guj
arat
9.7
156.
816
.29.
517
0.5
189.
517
0.5
17.9
12.5
217.
915
.816
.127
7.8
17.2
Har
yana
12.4
189.
915
.314
.823
9.7
16.3
17.8
281.
315
.817
268.
814
.821
302.
814
4
Him
acha
l Pra
desh
--
--
--
--
--
Jam
mu
and
Kas
hmir
--
--
--
--
--
Jhar
khan
d10
199.
120
1019
9.1
2013
.518
9.3
14-
--
-
Kar
nata
ka-
--
--
--
--
-M
adhy
a Pr
ades
h6
95.4
16-
-3.
150
16.1
3.5
5616
8.6
137.
416
Mah
aras
htra
11.8
294.
525
11.8
296
2512
302.
125
.212
.328
423
1332
8.9
25.3
Man
ipur
--
--
--
--
--
Miz
oram
--
--
--
--
--
Nag
alan
d-
--
--
--
--
-
Odi
sha
51.5
635.
712
.444
.923
9.7
5.3
44.9
636.
714
.245
637.
914
.245
.163
8.9
14.2
Punj
ab-
--
-5.
212
1.9
23.4
5.5
128.
123
.55.
613
1.4
23.5
Tam
il N
adu
1019
9.1
2013
.518
9.3
14-
--
--
-
Trip
ura
--
--
--
--
--
Utta
r Pr
ades
h-
--
-5.
811
5.9
206.
412
8.2
206.
713
4.4
20
Utta
rakh
and
--
--
--
--
--
Wes
t Ben
gal
5816
8829
.126
1735
.727
.163
.716
49.4
25.9
64.6
1685
.226
.165
.616
66.2
25.4
Oth
ers
35.2
415
20.2
379.
125
.734
813
.512
.419
6.4
15.8
2433
2.7
13.9
Tota
l Ind
ia28
0.1
5060
.518
.522
6.7
4643
.217
.428
1.4
5129
.517
.923
9.5
4514
.817
.629
1.8
5260
.317
.8
Tabl
e 5.
44 c
ontin
ues
Page 193
Indian Institute of Vegetable Research
178
Stat
es/U
Ts20
06-0
720
07-0
820
08-0
920
09-1
020
10-1
1A
PY
AP
YA
PY
AP
YA
PY
Ass
am0
0-
-0
-19
.828
2.9
14.3
20.5
351.
317
.220
.932
8.8
15.7
Biha
r60
.110
0916
.860
.710
23.9
16.9
6110
43.8
17.1
62.2
1080
.117
.462
.611
18.7
17.9
Chh
attis
garh
10.4
137.
513
.216
.625
1.9
15.2
61.1
241.
415
16.1
268.
916
.718
.430
616
.6
Del
hi-
--
107.
96.
212
8.4
6.2
128.
4-
128.
4
Guj
arat
16.1
272.
316
.917
.431
4.2
18.1
18.5
321.
117
.419
.835
6.7
1821
.138
7.4
18.4
Har
yana
30.3
417.
213
.824
.234
9.9
14.5
25.9
500.
319
.325
.748
7.7
1930
.353
1.9
17.6
Him
acha
l Pra
desh
--
-52
.72.
854
.52.
856
.6-
56.6
Jam
mu
& K
ashm
ir-
--
34.6
3.8
72.6
3.8
111.
9-
111.
9
Jhar
khan
d18
.629
7.8
1620
.733
1.9
1627
.343
6.9
1620
.632
9.8
1622
.235
5.4
16
Kar
nata
ka-
--
74.2
4.3
77.9
589
.5-
94
Mad
hya
Prad
esh
10.5
167
1610
.817
2.5
1611
.919
0.2
12.7
171.
516
171.
5
Mah
aras
htra
12.5
315
25.3
13.1
330.
725
.213
328.
925
.310
.10
15.7
##
Man
ipur
--
-14
.21.
919
.21.
919
.2-
23.8
Miz
oram
--
-0.
40.
33.
30.
40
-0
Nag
alan
d-
--
0.2
0.1
0.2
0.1
0.2
-0.
2
Odi
sha
45.1
641.
614
.245
.264
4.2
14.3
46.1
663.
514
.446
.567
5.4
14.5
45.1
677.
315
Punj
ab6
138.
3-
148.
17.
918
1.7
8.2
191.
2-
205.
2Ta
mil
Nad
u0.
713
.6-
13.9
0.8
15.1
0.7
12.3
-13
.3
Trip
ura
--
-24
.71.
722
.41.
727
.6-
27.6
Utta
r Pr
ades
h6.
910
7.4
20.2
7.7
158.
420
.48.
316
7.2
918
0.9
20.3
194.
5
Utta
rakh
and
--
-37
.72.
536
.42.
534
.6-
37.7
Wes
t Ben
gal
66.1
1658
.225
.166
.916
82.1
25.1
68.8
1743
.825
.469
.217
54.1
25.4
7017
77.2
25.4
Oth
ers
--
15.4
47.6
848.
317
.852
.596
9.1
18.5
57.2
1106
.519
.356
.687
7.8
15.5
Tota
l Ind
ia28
3.3
5174
.917
.533
0.9
6616
.618
.144
6.5
7500
.818
.340
2.9
7434
.417
.938
3.5
7425
.217
.6
(Sou
rce:
ww
w.in
dias
tat.c
om)
Page 194
Vegetable Statistics
179
Table 4.50: District-wise area production and yield of cauliflower
Bihar (2005-06)
Districts Area (ha) Production (t) Yield (t/ha)
Patna 3388 54508 16Nalanda 2792 44672 16Bhojpur 927 14461 16Buxar 502 7781 16Rohtas 1176 17640 15Kaumur 709 10635 15Gaya 1752 27156 16Jehanabad 464 7238 16Arwal 345 5348 16Nawadah 1282 19230 15Aurangabad 1303 19545 15Saran 1927 29676 15Siwan 1528 22920 15Gopatganj 1812 27905 15Mujaffarpur 3594 57504 16E.Champaran 1848 28829 16W.Champaran 2687 42992 16SitamatTii 1268 19274 15Sheohar 809 12378 15Vaishali 4594 74423 16Darbhanga 3988 62612 16Madhubani 2502 38281 15Samastipur 2821 45136 16Begusarai 1678 26009 16Munger 468 7488 16Sheikhpura 202 3030 15Lakhisarai 169 2535 15Jamui 473 7095 15Khagaria 739 11233 15Bhagalpur 1423 22768 16Banka 682 10230 15Saharsa 1582 25312 16Supaul 597 9433 16Madhepura 1598 25568 16Pumea 1883 29375 16Kisanganj 809 12944 16Araria 789 12429 16Katihar 2668 43222 16Total 59778 938815 16
(Source: www.indiastat.com)
Page 195
Indian Institute of Vegetable Research
180
Haryana (2006-07)
Districts Area (ha) Production (t) Yield (t/ha)
Panchkula 750 10000 13Ambala 1735 31385 18Yamunanagar 2046 107880 53Kurukshetra 1070 14555 14Kaithal 807 12370 15Karnal 1606 18580 12Panipat 2450 22195 9Sonipat 3320 53120 16Rohtak 650 7850 12Jhajjar 500 4830 10Faridabad 900 22500 25Narnual 660 13345 20Rewari 204 2835 14Gurgaon 8951 35607 4Bhiwani 1020 13000 13Hissar 1070 11950 11Fatehabad 880 13095 15Sirsa 575 10000 17Jind 1020 12200 12Mewat 110 1500 14Total 30324 418797 14
(Source: www.indiastat.com)
Himachal Pradesh (2005-06)
Bilaspur 90 2380 26Chamba 17 255 15Hamirpur 120 1960 16Kangra 368 5612 15Kinnaur 20 400 20Kullu 570 17100 30Lahaul&Spiti 33 495 15Mandi 310 9920 32Shimla 420 9240 22Sirmour 116 2378 21Solan 106 1908 18Una 93 1455 16Total 2263 53103 23
(Source: www.indiastat.com)
Page 196
Vegetable Statistics
181
Odisha(2006-07)
Districts Area (ha) Production (t) Yield (t/ha)
Balasore 1146 16273 14Bhadrak 1242 17636 14Bolangir 1320 18744 14Sonepur 831 11800 14Cuttack 1952 27894 14J.S. Pur 1290 18421 14Jaipur 1400 19880 14Kendrapara 1646 23373 14Dhenkanal 1304 18517 14Angul 1843 26226 14Ganjam 3271 46448 14Gajapati 739 10494 14Keonjhar 4770 67973 14Kalahandi 413 5865 14Khariar 703 9983 14Koraput 768 10906 14Malkangiri 457 6489 14N.W. Pur 633 8989 14Rayagade 824 11701 14Phulbani 3416 48746 14Boudh 999 14186 14Mayurbhanj 3213 45625 14Puri 2325 33015 14Khurda 1484 21073 14Nayagarh 1168 16586 14Sambalpur 1532 21908 14Deogarh 172 2442 14Bargarh 139 1988 14Jharsuguda 457 6489 14Sundargarh 3660 51972 14Total 45117 641642 14
(Source: www.indiastat.com)
Punjab (2005-06)
Hoshiarpur 719 17204 24Jalandhar 422 10458 25Ludhiana 185 4529 24Ferozepur 128 2935 23Amritsar 583 11782 20
Contd...
Page 197
Indian Institute of Vegetable Research
182
Districts Area (ha) Production (t) Yield (t/ha)
Gurdaspur 560 13896 25Kapurthala 518 13074 25Bathinda 61 1491 24Sangrur 337 7947 24Patiala 613 15346 25Ropar 220 5419 25Faridkot 143 3356 23Mansa 30 522 17Fatehgarh Sahib 498 9725 20Moga 215 5323 25Mukatsar 5 117 23Nzwanshehar 353 8276 23Total 5590 131400 24
(Source: www.indiastat.com)
Tamil Nadu (2005-06)
Coimbatore 85 1700 20Cuddalore 3 60 20Dindigul 446 8920 20Erode 5 100 20Krishnagiri 14 280 20Madurai 2 40 20Namakkal 1 20 20The Nilgiris 26 520 20Theni 47 940 20Thiruchirapalli 2 40 20Total 631 12620 20
(Source: www.indiastat.com)
Uttar Pradesh[Area (A) in ha; Production (P) in t; Yield (Y) in t/ha]
District/division 2008-09 2009-10 2010-11A P Y A P Y A P Y
Saharanpur 784 15867 20 849 17254 20 934 18994 20Meerut 819 16540 20 946 19138 20 1042 21168 20Agra 919 18587 20 968 19610 20 1065 21668 20Aligarh 489 9883 20 469 9504 20 516 10502 20Bareilly 412 8320 20 490 9924 20 539 10974 20Muradabad 465 9411 20 631 12778 20 694 14118 20
Contd...
Page 198
Vegetable Statistics
183
District/division 2008-09 2009-10 2010-11A P Y A P Y A P Y
Kanpur 447 9027 20 430 8703 20 473 9589 20Allahabad 174 3520 20 234 4742 20 258 5233 20Jhansi 32 646 20 42 848 20 46 931 20Chitrakoot Dham 52 1049 20 53 1075 20 57 1179 21Varanasi 327 6591 20 324 6542 20 356 7223 20Mirzapur 30 602 20 33 664 20 37 747 20Azamgarh 203 4092 20 204 4126 20 224 4536 20Gorakhpur 841 16960 20 1014 20486 20 925 18506 20Basti 182 3681 20 144 2919 20 200 4106 21Shri Patan devi 270 5494 20 301 6135 20 292 5973 20Lucknow 1023 20635 20 1032 20899 20 1126 23037 20Faziabad 443 8951 20 411 8426 21 487 9996 21Total U.P. 7912 159856 20 8575 173773 20 9271 188480 20
(Source: State Horticulture Mission, Government of Uttar Pradesh)
West Bengal (2005-06)
Districts Area (ha) Production (t) Yield (t/ha)
Darjeeling 0.759 26.11 34
Jalpaiguri 4.794 89.54 19
Coochbehar 4.792 150.16 31
North Dinajpur 2.63 42.46 16
South Dinajpur 2.126 58.5 28
Malda 3.254 96.13 30
Murshidabad 9.5 275.02 29
Nadia 7.13 214.7 30North 24-Parganas 4.925 123.52 25
South 24-Parganas 4.65 95 20
Howrah 0.913 24.16 26
Hooghly 3.59 60.4 17
Burdwan 3.16 90 28
Birbhum 2 30.94 15
Bankura 5.25 139.66 27
Purulia 1.122 30.9 28
Midnapur (West) 3.448 89.9 26
Midnapur (East) 1.6 29.05 18
West Bengal 65.643 1666.15 25
(Source: www.indiastat.com)
Page 199
Indian Institute of Vegetable Research
184
Tabl
e 4.
51:M
onth
ly w
hole
sale
pri
ce i
ndex
(W
PI)
of c
aulif
low
er i
n In
dia
{(Bas
e ye
ar: 1
981-
82; 1
993-
94; 2
004-
05=1
00)
(Apr
il 19
90 t
oD
ecem
ber
1992
and
Sep
tem
ber
1993
to J
uly
2012
)}
Year
Jan.
Feb.
Mar
.A
pr.
May
Jun.
Jul.
Aug
.Se
pt.
Oct
.N
ov.
Dec
.
1981
-82=
100
1990
N.A
.N
.A.
N.A
.N
.A.
N.A
.N
.A.
322.
518
1.4
116.
719
9191
.882
.310
2.5
N.A
.N
.A.
N.A
.N
.A.
N.A
.N
.A.
243.
014
9.7
113.
219
9210
3.5
127.
518
9.7
N.A
.N
.A.
N.A
.N
.A.
N.A
.N
.A.
353.
925
2.7
214.
919
93N
.A.
517.
026
2.5
152.
3
1993
-94=
100
1994
174.
017
1.0
203.
9N
.A.
N.A
.N
.A.
N.A
.N
.A.
N.A
.16
4.3
77.4
39.1
1995
56.3
78.8
114.
9N
.A.
N.A
.N
.A.
N.A
.N
.A.
N.A
.20
2.2
105.
170
.819
9657
.950
.962
.2N
.A.
N.A
.N
.A.
N.A
.N
.A.
N.A
.24
2.7
151.
612
5.3
1997
95.6
94.9
115.
2N
.A.
N.A
.N
.A.
N.A
.N
.A.
N.A
.21
9.3
73.6
98.7
1998
159.
111
3.8
104.
3N
.A.
N.A
.N
.A.
N.A
.N
.A.
N.A
.61
8.3
246.
612
919
9911
1.9
76.6
67.2
N.A
.N
.A.
N.A
.N
.A.
N.A
.N
.A.
275.
013
5.4
70.1
2000
71.6
82.5
172
N.A
.N
.A.
N.A
.N
.A.
N.A
.N
.A.
274.
215
5.2
137.
520
0114
4.3
110.
311
4.3
N.A
.N
.A.
N.A
.N
.A.
N.A
.N
.A.
333.
718
5.3
88.4
2002
73.0
106.
410
7.9
N.A
.N
.A.
N.A
.N
.A.
N.A
.N
.A.
225.
519
4.8
104.
620
0316
3.9
134.
816
7N
.A.
N.A
.N
.A.
N.A
.N
.A.
N.A
.35
1.1
191.
820
120
0419
8.3
100.
811
9.7
N.A
.N
.A.
N.A
.N
.A.
N.A
.N
.A.
281.
613
9.9
103.
820
0610
1.0
94.5
95.3
N.A
.N
.A.
N.A
.N
.A.
N.A
.N
.A.
166.
313
1.5
94.5
2007
84.5
89.9
119.
4N
.A.
N.A
.N
.A.
N.A
.N
.A.
N.A
.19
3.6
184.
613
0.1
2008
122.
410
2.6
101.
3N
.A.
N.A
.N
.A.
N.A
.N
.A.
N.A
.19
3.6
224.
115
3.0
2009
105.
488
.387
.1N
.A.
N.A
.N
.A.
N.A
.N
.A.
N.A
.19
7.4
123.
211
1.7
2010
110.
312
3.6
148.
9N
.A.
N.A
.N
.A.
N.A
.N
.A.
2004
-05=
100
2005
N.A
.N
.A.
N.A
.N
.A.
N.A
.N
.A.
147.
114
3.4
90.9
2006
84.8
72.8
68.9
N.A
.N
.A.
N.A
.N
.A.
N.A
.N
.A.
135.
810
6.8
94.3
2007
83.1
80.9
83.8
N.A
.N
.A.
N.A
.N
.A.
N.A
.N
.A.
123.
712
2.0
85.8
2008
91.9
88.6
96.7
N.A
.N
.A.
N.A
.N
.A.
N.A
.N
.A.
157.
616
2.1
121.
320
0912
0.7
95.4
96.0
N.A
.N
.A.
N.A
.N
.A.
N.A
.N
.A.
147.
113
7.1
134.
420
1010
3.9
103.
712
0.1
N.A
.N
.A.
N.A
.N
.A.
N.A
.N
.A.
204.
117
5.9
199.
020
1121
0.5
119.
111
0.6
N.A
.N
.A.
N.A
.N
.A.
N.A
.N
.A.
163.
316
2.3
139.
120
1212
1.7
142.
914
6.3
N.A
.N
.A.
N.A
.N
.A.
(Sou
rce:
ww
w.in
dias
tat.c
om)
Page 200
Vegetable Statistics
185
Tabl
e 4.
52: M
onth
ly a
vera
ge w
hole
sale
pri
ce (W
P) a
nd a
rriv
al (A
R) o
f ca
ulif
low
er d
urin
g th
e pe
riod
Jan
uary
to D
ecem
ber,
2011
(Ave
rage
who
lesa
le p
rice
in `
/q &
arr
ival
in to
nnes
)
Mar
ket
Jan
Feb
Mar
chA
pril
May
June
July
Aug
Sept
Oct
Nov
Dec
Tota
lW
PA
RW
PA
RW
PA
RW
PA
RW
PA
RW
PA
RW
PA
RW
PA
RW
PA
RW
PA
RW
PA
RW
PA
RW
PA
R
Abo
har
1042
252
646
196
696
401
843
219
784
132
--
--
1287
162
1279
173
1878
243
1140
361
646
704
1024
2843
Agr
a34
016
727
617
636
914
759
498
--
--
--
2948
8518
9415
612
8415
893
021
570
840
710
3816
09A
hmed
abad
503
3133
230
3083
557
2420
471
1418
934
1414
1115
1652
1035
1736
1043
1618
1356
1598
1486
1270
1168
2025
872
1915
898
2328
2A
mri
tsar
675
936
377
1295
434
1207
418
1158
--
--
--
--
--
1919
583
519
999
600
1253
706
7431
Bang
alor
e14
6388
664
011
1763
813
3586
413
2789
814
4814
2290
410
7713
3459
412
6892
610
7612
1162
014
4681
210
6898
010
2113
107
Bara
ut95
819
258
018
711
9417
588
611
928
1450
--
--
--
--
1634
7760
415
860
014
811
5911
06Bh
opal
1143
816
416
844
1070
704
793
573
1500
443
--
--
1718
533
2225
416
2117
357
892
1422
648
855
1252
6963
Bhub
anes
hwar
941
1290
532
1190
1118
336
1318
159
1955
9219
2086
2206
140
2188
178
2343
184
2197
179
1788
668
539
1285
1587
5787
Cha
ndig
arh
683
1197
362
1347
717
1248
768
763
--
--
--
--
--
1955
575
838
1232
714
1520
862
7882
Che
nnai
1664
3610
1257
3858
1051
6082
970
3680
1138
2800
1483
1600
1604
1339
1676
2099
1635
2600
1596
1519
1900
1094
1644
1824
1468
3210
5D
ehra
dun
670
539
409
487
625
594
786
354
1523
214
2034
6423
6715
637
8594
3522
6722
9621
371
351
756
567
016
0839
69D
elhi
699
5506
232
6439
510
5693
659
2262
913
3616
1579
3481
1779
4146
2648
3112
2556
5064
2174
5194
552
4582
812
3844
1259
5293
9G
anga
tok
979
5375
449
1313
5014
6428
1754
3128
5022
4316
2352
8711
--
5170
2223
9234
1358
3125
1235
2G
uwah
ati
773
778
496
732
791
529
753
188
--
--
3100
18-
--
-26
8819
614
3352
870
071
913
4236
88H
yder
abad
904
951
712
887
488
1217
447
418
768
367
888
288
875
967
838
1688
764
783
948
220
1045
667
630
2046
776
1049
9Ja
ipur
826
1310
556
1080
568
814
656
432
650
116
--
--
--
--
1352
189
630
738
769
921
751
5600
Jala
ndha
r73
829
2960
221
7952
415
4445
341
512
6514
023
5311
521
3611
827
378
--
2074
208
1099
130
--
1398
7786
Jam
mu
700
1164
409
1341
481
1346
767
779
1170
341
828
1100
1154
356
1802
100
2204
309
2041
822
638
1688
744
1166
1078
1051
2K
anpu
r26
532
4012
129
7323
948
320
320
7-
--
--
-19
6732
315
0057
522
4515
9-
--
-93
479
60K
arna
l70
935
629
334
454
734
781
724
912
2027
--
--
1752
6517
2117
216
4724
045
490
660
075
997
634
65K
olka
ta73
652
2440
139
9688
714
0997
969
813
8223
217
3627
222
0425
923
0127
923
5024
725
5233
216
7816
6561
527
3114
8517
344
Luck
now
499
2735
274
2790
456
1038
412
460
--
--
--
--
--
--
972
2252
344
6253
493
1552
8M
umba
i46
061
6631
336
3641
730
0642
722
9659
023
4287
930
8497
732
8692
928
0411
1929
9110
7924
9186
324
9049
629
0671
237
498
Nag
pur
521
1420
179
2950
460
1260
326
1130
593
1640
866
920
1339
830
1429
960
1071
932
1302
900
853
890
544
1080
790
1491
2N
asik
1202
2150
258
3700
377
2930
286
1885
749
1975
1125
1735
1312
941
1385
377
1341
377
1078
650
850
1045
692
1080
888
1884
5Pa
tna
873
1065
460
1240
877
710
809
335
--
--
--
1750
1117
1421
516
2483
098
710
0563
388
510
8162
96Pu
ne71
311
2546
111
0959
511
2856
364
754
887
187
411
2085
211
5592
370
397
273
093
065
291
384
556
112
5274
211
337
Raip
ur11
7028
249
845
075
316
783
610
010
6789
1544
4217
3147
2088
4521
0485
2036
8817
6814
296
222
813
8017
65R
anch
i10
4987
253
180
781
770
963
567
593
553
312
5527
415
2244
523
4745
716
3565
423
9160
614
8085
868
310
5812
7379
48Sh
imla
1128
236
685
300
730
274
941
246
1197
165
2035
109
1714
177
2443
9418
6011
6-
-14
3521
111
2330
213
9022
30Sr
inag
ar11
8365
895
562
610
3349
411
6948
113
4855
710
2062
313
7545
118
5516
120
5021
417
0850
576
787
377
574
612
7063
89Su
rat
1188
1560
678
1470
876
1350
683
1520
1430
1028
1998
734
2187
1265
2244
1328
1985
1342
2002
1360
2398
1270
1892
1600
1630
1582
7Th
iruv
anan
-20
7867
2016
7316
5494
1914
5825
5960
2606
6123
4477
2316
6423
8960
2394
3027
4129
2773
2723
1570
0th
apur
am
(Sou
rce:
NH
B, N
atio
nal H
ortic
ultu
re D
atab
ase
2011
)
Page 201
Indian Institute of Vegetable Research
186
Tabl
e 4.
53: I
ndia
’s tr
ade
in c
aulif
low
er a
nd b
rocc
oli
(Qua
ntity
in t;
Val
ue in
‘000
US$
; Uni
t val
ue in
US$
/t)
Year
Expo
rtIm
port
Expo
rt%
sha
re in
Expo
rt%
sha
re in
Uni
tIm
port
% s
hare
inIm
port
% s
hare
inU
nit
Qua
ntity
wor
ld e
xpor
tVa
lue
wor
ld e
xpor
tVa
lue
Qua
ntity
wor
ld im
port
Valu
ew
orld
impo
rtVa
lue
1961
420.
0215
0.09
357
00.
000
0.00
019
6214
0.01
50.
0235
70
0.00
00.
000
1963
20.
000
0.00
00
0.00
00.
000
1964
00.
000
0.00
00
0.00
00.
000
1965
30.
001
0.00
333
00.
000
0.00
019
660
0.00
00.
000
00.
000
0.00
019
672
0.00
00.
000
00.
000
0.00
019
681
0.00
00.
000
00.
000
0.00
019
690
0.00
00.
000
00.
000
0.00
019
700
0.00
00.
000
00.
000
0.00
019
714
0.00
10.
0025
00
0.00
00.
000
1972
00.
000
0.00
00
0.00
00.
000
1973
10.
000
0.00
00
0.00
00.
000
1974
00.
000
0.00
00
0.00
00.
000
1975
00.
000
0.00
00
0.00
00.
000
1976
00.
000
0.00
00
0.00
00.
000
1977
20.
000
0.00
00
0.00
00.
000
1978
30.
002
0.00
667
00.
000
0.00
019
790
0.00
00.
000
00.
000
0.00
019
800
0.00
00.
000
00.
000
0.00
019
810
0.00
00.
000
00.
000
0.00
019
821
0.00
00.
000
00.
000
0.00
019
830
0.00
00.
000
00.
000
0.00
019
840
0.00
00.
000
00.
000
0.00
019
850
0.00
00.
000
00.
000
0.00
0C
ontd
...
Page 202
Vegetable Statistics
187
Year
Expo
rtIm
port
Expo
rt%
sha
re in
Expo
rt%
sha
re in
Uni
tIm
port
% s
hare
inIm
port
% s
hare
inU
nit
Qua
ntity
wor
ld e
xpor
tVa
lue
wor
ld e
xpor
tVa
lue
Qua
ntity
wor
ld im
port
Valu
ew
orld
impo
rtVa
lue
1986
00.
000
0.00
00
0.00
00.
000
1987
210.
017
0.00
333
00.
000
0.00
019
889
0.00
30.
0033
30
0.00
00.
000
1989
00.
000
0.00
00
0.00
00.
000
1990
00.
000
0.00
00
0.00
00.
000
1991
00.
000
0.00
00
0.00
00.
000
1992
40.
001
0.00
250
00.
000
0.00
019
930
0.00
00.
000
00.
000
0.00
019
9425
0.00
50.
0020
00
0.00
00.
000
1995
00.
000
0.00
00
0.00
00.
000
1996
120.
005
0.00
417
00.
000
0.00
019
9749
0.01
180.
0036
715
60.
036
0.00
3819
9820
0.00
90.
0045
052
0.01
10.
0019
1999
210.
007
0.00
333
240.
002
0.00
8320
002
0.00
10.
0050
061
0.01
50.
0081
2001
00.
000
0.00
00
0.00
00.
000
2002
00.
000
0.00
00
0.00
00.
000
2003
540.
0120
0.00
370
00.
000
0.00
020
0494
0.01
370.
0139
40
0.00
00.
000
2005
105
0.01
130.
0012
40
0.00
00.
000
2006
450.
008
0.00
178
00.
000
0.00
020
0771
0.01
50.
0070
00.
000
0.00
020
0828
50.
0337
0.00
130
00.
000
0.00
020
0916
630.
1718
80.
0211
30
0.00
00.
000
2010
961
0.09
940.
0098
00.
000
0.00
0
(Sou
rce:
ww
w.fa
osta
t.fao
.org
)
Page 203
Indian Institute of Vegetable Research
188
Table 4.54: Major destinations of cauliflower exports from India
(Quantity in t; Value in Lakhs `)
Country 2008-09 2009-10 2010-11Quantity Value Quantity Value Quantity Value
UAE 24.2 (9)* 0.4 (3) 1197.5 (72) 72.7 (80) 519.7 (63) 20.0 (60)
Maldives 26.2 (9) 2.1 (13) 362.7 (22) 12.9 (15) 208.0 (25) 7.9 (24)
Saudi Arabia 103.9 (37) 4.7 (30) 33.0 (2) 2.1 (2) 78.1 (9) 3.5 (11)
Nepal 113.7 (40) 4.1 (26) 78.5 (4) 3.1 (3) 22.8 (3) 1.7 (5)
Oman 0.0 (0) 0.0 (0) 0.0 (0) 0.0 (0) 1.2 (0) 0.0 (0)
Mali 0.0 (0) 0.0 (0) 0.1 (0) 0.0 (0) 0.1 (0) 0.0 (0)
Mexico 0.0 (0) 0.0 (0) 0.0 (0) 0.0 (0) 0.0 (0) 0.0 (0)
Bahrain 0.0 (0) 0.0 (0) 0.1 (0) 0.0 (0) 0.0 (0) 0.0 (0)
Canada 16.0 (5) 4.3 (27) 0.0 (0) 0.0 (0) 0.0 (0) 0.0 (0)
Qatar 0.7 (0) 0.3 (1) 2.1 (0) 0.0 (0) 0.0 (0) 0.0 (0)
Total 284.6 (100) 15.9 (100) 1674.1 (100) 90.8 (100) 829.8 (100) 33.2 (100)
* Figures in parentheses give Percentage to the total exports.(Source:www.apeda.gov.in)
Table 4.55: Major destinations of cauliflower seeds export from India
(Quantity: Kg, Value: `)
Country 2008-09 2009-10 2010-11Quantity Value Quantity Value Quantity Value
Bangladesh 151 106851 685 4624401 464 4165016
USA 0 0 0 0 21875 3785972
Pakistan 1099 4971666 7694 1967582 22653 3734719
Jordan 0 0 199 517455 40 505277
Afghanistan 0 0 0 0 300 427800
Singapore 0 0 50 360793 20 275552
Nepal 5 165382 97 934460 1560 234490
Kenya 0 0 0 0 15 161545
Peru 0 0 0 0 2000 74662
Maldives 0 0 40 1604 600 30185
Others 1148 789686 3547 3088269 20 41179
Total 2403 6033585 12312 11494564 49547 13436397
(Source: www.agriexchange.apeda.gov.in)
Page 204
Vegetable Statistics
189
Okra
Table 4.56: Area, production and yield of okra
Years World IndiaArea Production Yield Area Production Yield
(Million ha) (Million t) (t/ha) (000’ha) (000’t) (t/ha)
1961 0.33 1.11 3.4 150 775 51962 0.33 1.13 3.4 158 790 51963 0.34 1.18 3.4 165 825 51964 0.35 1.21 3.5 170 845 51965 0.36 1.27 3.5 180 900 51966 0.37 1.33 3.6 185 940 51967 0.38 1.37 3.6 190 970 51968 0.38 1.41 3.7 198 1000 51969 0.40 1.48 3.7 210 1050 51970 0.42 1.60 3.9 218 1150 51971 0.42 1.65 3.9 225 1190 51972 0.45 1.82 4.1 234 1240 51973 0.45 1.91 4.2 244 1340 51974 0.48 2.05 4.3 250 1375 61975 0.47 2.03 4.3 260 1430 61976 0.48 2.04 4.3 265 1480 61977 0.49 2.11 4.3 275 1530 61978 0.53 2.23 4.2 280 1550 61979 0.55 2.35 4.3 290 1625 61980 0.56 2.51 4.5 295 1700 61981 0.55 2.50 4.5 300 1740 61982 0.57 2.60 4.6 305 1770 61983 0.58 2.71 4.7 315 1850 61984 0.61 2.87 4.7 320 1900 61985 0.64 2.93 4.6 330 1950 61986 0.68 3.08 4.6 340 2050 61987 0.69 3.17 4.6 346 2110 61988 0.68 3.18 4.7 353 2190 61989 0.71 3.62 5.1 360 2250 61990 0.78 3.59 4.6 365 2280 61991 0.80 3.64 4.6 370 2327 61992 0.86 3.82 4.4 375 2400 61993 0.86 3.86 4.5 376 2405 61994 0.85 4.58 5.4 300 3030 101995 1.07 5.52 5.2 420 3900 9Contd...
Page 205
Indian Institute of Vegetable Research
190
Years World IndiaArea Production Yield Area Production Yield
(Million ha) (Million t) (t/ha) (000’ha) (000’t) (t/ha)
1996 1.23 5.57 4.5 380 3800 101997 0.86 5.44 6.3 370 3700 101998 0.81 5.01 6.2 320 3210 101999 0.82 5.32 6.5 330 3380 102000 0.88 5.23 6.0 350 3420 102001 0.85 5.23 6.2 350 3340 102002 0.86 5.31 6.2 350 3320 92003 0.89 5.62 6.3 370 3530 102004 0.91 5.81 6.4 353 3631 102005 0.91 5.61 6.2 357 3512 102006 0.98 6.21 6.4 392 3975 102007 1.03 6.55 6.4 396 4070 102008 0.99 6.44 6.5 407 4179 102009 1.02 6.84 6.7 432 4528 102010 1.05 7.10 6.7 452 4803 112011 1.06 7.83 7.4 498 5784 12ACGR for last ten years 2.18 3.96 1.75 3.69 5.48 1.72(2002-2011)
(Source: www.faostat.fao.org)
Table 4.57: Major okra producing countries in the world (2010-11)
Country Area % share to total Production % share to total Productivity(000’ha) area under okra (000’t) okra production (t/ha)
India 498.0 43.4 5784.0 73.2 11.6Nigeria 455.1 39.6 955.6 12.1 2.1Sudan 21.5 1.9 256.0 3.2 11.9Iraq 19.5 1.7 151.2 1.9 7.7Ivoire 47.0 4.1 125.0 1.6 2.7Pakistan 14.6 1.3 113.2 1.4 7.8Egypt 6.9 0.6 86.2 1.1 12.5Ghana 21.1 1.8 82.5 1.0 3.9Saudi Arabia 4.2 0.4 55.8 0.7 13.3Cameroon 15.5 1.4 43.0 0.5 2.8Others 44.5 3.9 243.7 3.1 5.5Total 1148.0 100.0 7896.3 100.0 6.9
(Source: NHB, National Horticulture Database 2011)
Page 206
Vegetable Statistics
191
Table 4.58: Percent share of area production and productivity of okra in India
Year Area % of total area Production % of total Productivity(000’ha) under vegetables (000’t) vegetable (t/ha)
production
1987-88 114.1 5.5 530.5 2.5 4.6
1991-92 222 4.0 1886.5 3.2 8.5
1992-93 298.4 5.9 2737.8 4.3 9.2
1993-94 295.2 6.1 3029.4 4.6 10.3
1994-95 415.9 8.3 3988.8 5.9 9.6
1995-96 430.5 8.1 4031.8 5.6 9.4
1996-97 323.2 5.9 3040.1 4.0 9.4
1997-98 318.2 5.7 3210.9 4.4 10.1
1998-99 325.5 5.5 3380.3 3.8 10.1
1999-00 348.8 5.8 3419.1 3.8 9.8
2000-01 350.4 5.6 3351.8 3.6 9.6
2001-02 347.2 5.6 3324.7 3.8 9.6
2002-03 329.2 5.4 3244.5 3.8 9.9
2003-04 353.1 5.6 3631.4 3.9 10.3
2004-05 357.3 5.3 3512.4 3.5 9.8
2005-06 391.8 5.5 3974.6 3.6 10.1
2006-07 396 5.2 4070 3.5 10.3
2007-08 407 5.2 4179 3.3 10.3
2008-09 432 5.4 4528 3.5 10.5
2009-10 452.5 5.7 4803.3 3.6 10.6
2010-11 498 5.9 5784 3.9 11.6
(Source: www.indiastat.com)
Page 207
Indian Institute of Vegetable Research
192
Table 4.59: State-wise area and production of okra in India from 2001-02 to 2010-11
[Area (A): 000’ha; Production (P): 000’t]
States/UTs 2001-02 2002-03 2003-04 2004-05 2005-06A P A P A P A P A P
Andhra Pradesh 17.0 158.0 17.9 143.2 28.5 228.1 24.1 301.2 25.6 322.7Assam - 116.6 - 118.1 - 119.2 - 120.0 - 119.7Bihar 57.4 801.2 57.8 866.5 58.0 928.7 56.2 730.2 56.2 714.1Chhattisgarh 9.2 - 11.2 - 12.8 12.7 102.4 14.0 184.7Gujarat - 183.6 - 183.3 183.3 10.3 299.1 18.1 350.3Haryana 10.6 - 8.8 70.3 7.1 85.6 7.5 100.0 7.7 93.7Jharkhand 26.8 156.4 26.9 161.9 27.5 161.9 27.6 29.0Karnataka - 101.7 - 74.8 - 59.8 - 60.8 - 63.2Madhya Pradesh - 44.2 - - - - - - - -Maharashtra - 157.5 - 161.5 6.4 169.2 8.3 160.5 8.8 182.7Odisha 73.7 674.7 71.2 587.9 71.4 619.4 71.4 619.7 71.4 618.8Uttar Pradesh - - - - - 89.4 - 100 - 110.2West Bengal 59.0 662.2 60.9 639.3 62.5 652.8 63.7 677.3 65.8 718.9Others 23.7 288.5 25.1 237.9 43.0 495.9 30.0 241.2 28.9 194.9Total India 277.4 3344.6 279.8 3244.7 317.2 3793.3 311.8 3512.4 325.5 3673.9
Table continues
States/UTs 2006-07 2007-08 2008-09 2009-10 2010-11A P A P A P A P A P
Andhra Pradesh 28.3 424 29.3 439.7 29.3 439.7 33.5 502.1 78.9 1184.2Assam - 0.0 10.3 129.2 10.9 149.7 11.1 147.8Bihar 56.6 716.3 57.2 707.3 58.2 743.5 58.3 766.6 58.5 788.3Chhattisgarh 15.2 194.8 23.0 202.4 23.5 207.6 23.9 217.3 25.2 249.1Gujarat 21 366.1 41.5 365.9 44.9 407.1 32.0 466.2 54.5 592.5Haryana 7.9 107.4 - - 15.4 16.0 18.2 145.3Jharkhand 25 318.1 24.5 343.2 29.8 417.2 29.0 406.0 30.0 421.7Karnataka - 65.1 - - 8.1 - 8.6 - - -Madhya Pradesh - 53 - - 10.1 - 10.8 - - -Maharashtra 9.0 157.5 26.3 165.4 25.0 157.5 27.0 175.5 19.0 224.0Odisha 71.5 620.9 71.5 621.1 73.3 639.9 73.9 651.8 70.0 651.8Uttar Pradesh - 112.9 9.2 102.1 10.1 112.2 11.0 131.2West Bengal 68.0 762.4 71.5 815.3 72.6 830.9 73.1 839.3 74.0 862.1Others - - 52.9 416.7 54.7 443.1 61.9 497.5 58.8 517.3Total India 302.5 3898.5 406.9 4179.1 465.3 4527.9 469.9 4803.2 498.2 5784.1
(Source: www.indiastat.com)
Page 208
Vegetable Statistics
193
Table 4.60: District-wise area production and yield of okra
Gujarat (2006-07)
Districts Area (ha) Production (t) Yield (t/ha)
Ahmedabad 400 2500 6Amreli 680 4080 6Banas Kantha 2800 30800 11Bharuch 1890 15120 8Narmada 550 3850 7Bhavnagar 975 9263 10The Dangs 350 2450 7Gandhinagar 2270 17025 8Jamnagar 1535 8289 5Junagadh 3605 23973 7Porbandar 510 3650 7Kachchh 575 3735 6Kheda 2200 17600 8Anand 1128 8798 8Mahesana 1840 16560 9Patan 60 600 10Panch Mahals 475 2525 5Dohad 471 4239 9Rajkot 850 6375 8Sabar Kantha 1800 14400 8Surat 6800 69360 10Surendranagar 3481 26148 8Baroda 4891 48910 10Valsad 1375 12375 9Navsari 1500 13500 9Total 43011 366125 8
(Source: www.indiastat.com)
Himachal Pradesh (2005-06)
Bilaspur 170 2210 13Chamba 62 558 9Hamirpur 120 1800 15Kangra 869 9570 11Kinnaur 5 50 10Kullu 40 360 9Mandi 150 1500 10Shimla 20 210 11Sirmour 98 1078 11Solan 124 1488 12Una 70 835 12Total 1728 19659 11
(Source: www.indiastat.com)
Page 209
Indian Institute of Vegetable Research
194
Odisha (2006-07)
Districts Area (ha) Production (t) Yield (t/ha)
Balasore 4835 42570 9Bhadrak 2548 22187 9Bolangir 2338 19917 9Sonepur 1565 13687 9Cuttack 2565 22582 9J.S. Pur 2010 17524 9Jaipur 5222 44478 9Kendrapara 1935 16850 9Dhenkanal 2688 23155 9Angul 2819 24445 9Ganjam 5049 44448 9Gajapati 1804 15971 9Keonjhar 5216 45726 9Kalahandi 1586 12898 8Khariar 255 2204 9Koraput 2013 17587 9Malkangiri 1470 12688 9N.W. Pur 1345 11458 9Rayagade 1219 10728 9Phulbani 1579 13902 9Boudh 1943 16544 9Mayurbhanj 2928 25276 9Puri 3792 32300 9Khurda 2677 23567 9Nayagarh 2912 25361 9Sambalpur 1547 13472 9Deogarh 213 1824 9Bargarh 175 1838 11Jharsuguda 235 1987 8Sundargarh 5000 43685 9Total 71483 620859 9
(Source: www.indiastat.com)
Rajastan (2006-07)
Ajmer 265 335 1Alwar 529 1484 3Banswara 34 4 0Baran 166 756 5Barmer 35 36 1Bharatpur 132 485 4Bhilwara 162 276 2Bikaner 3 3 1Bundi 483 2142 4Chittor 323 732 2Churu 1 1 1Dausa 98 112 1
Contd...
Page 210
Vegetable Statistics
195
Districts Area (ha) Production (t) Yield (t/ha)
Dholpur 44 88 2Dungarpur 48 72 2Sriganganagar 146 2190 15Hanumangarh 92 926 10Jaipur 378 587 2Jaisalmer 2 3 2Jalore 90 136 2Jhalawar 93 254 3Jhunjhunu 43 167 4Jodhpur 54 35 1Karuali 74 149 2Kota 151 1082 7Nagaur 94 68 1Pali 118 110 1Rajsamand 61 178 3S. Modhpur 24 48 2Sikar 38 59 2Sirohi 183 205 1Tonk 116 482 4Udaipur 203 222 1Total 4283 13427 3
( Source: www.indiastat.com)
Uttar Pradesh[Area (A) in ha; Production(P) in t; Yield (Y) in t/ha]
Districts/divisions 2008-09 2009-10 2010-11A P Y A P Y A P Y
Saharanpur 226 2674 12 276 3282 12 286 3476 12Meerut 1096 13801 13 1281 16274 13 1331 17234 13Agra 1152 13193 11 1367 15861 12 1420 16797 12Aligarh 1151 13532 12 515 6061 12 535 6419 12Bareilly 344 3967 12 436 5108 12 452 5408 12Muradabad 157 1743 11 183 2039 11 190 2159 11Kanpur 891 10448 12 905 10494 12 940 11114 12Allahabad 461 5292 11 481 5841 12 500 6185 12Jhansi 115 1426 12 421 5894 14 437 6242 14Chitrakoot Dham 78 888 11 128 1419 11 133 1502 11Varanasi 510 5528 11 543 6036 11 564 6392 11Mirzapur 22 289 13 26 347 13 27 367 14Azamgarh 192 1878 10 92 935 10 96 991 10Gorakhpur 558 6042 11 668 7251 11 693 7679 11Basti 75 704 9 79 755 10 82 799 10Shri Patan devi 472 5201 11 555 6057 11 576 6414 11Lucknow 2167 22096 10 2135 22003 10 2219 23300 11Faziabad 614 6216 10 586 5998 10 609 6352 10Total U.P. 10281 114918 11 10677 121655 11 11090 128830 12
(Source: State Horticulture Mission, Government of Uttar Pradesh)
Page 211
Indian Institute of Vegetable Research
196
Tabl
e 4.
61: M
onth
ly w
hole
sale
pri
ce in
dex
(WPI
) of
okra
in I
ndia
{(Ba
se y
ear:
1993
-94;
200
4-05
=100
) (A
pril
1994
to J
uly
2012
)}
Year
Jan.
Feb.
Mar
.A
pr.
May
Jun.
Jul.
Aug
.Se
pt.
Oct
.N
ov.
Dec
.
1993
-94=
100
1994
134.
082
.810
9.3
114.
312
1.0
93.1
106.
014
0.5
176.
819
9521
2.3
221.
124
4.6
130.
212
3.7
133.
014
1.3
113.
210
2.5
130.
714
6.2
139.
419
9616
5.9
175.
316
8.4
126.
685
.410
6.2
137.
511
4.5
88.9
116.
813
0.1
260.
919
9724
0.5
249.
321
4.5
176.
088
.686
.514
4.8
154.
213
9.8
144.
315
0.9
209.
619
9825
6.1
251.
818
9.9
170.
713
3.4
158.
115
9.0
151.
714
0.3
193.
727
9.9
394.
419
9921
5.0
156.
923
7.5
214.
314
1.6
96.5
109.
511
0.1
131.
716
4.6
164.
617
5.2
2000
199.
224
1.6
288.
519
2.0
149.
817
0.2
144.
214
5.1
139.
517
9.2
201.
421
0.0
2001
206.
120
3.6
199.
417
0.8
152.
914
9.1
191.
114
8.3
151.
320
4.4
207.
420
8.6
2002
204.
221
5.0
209.
116
2.8
134.
413
2.5
148.
416
9.3
162.
318
9.9
183.
218
7.5
2003
188.
218
6.9
197.
021
4.5
152.
114
3.1
147.
015
7.0
149.
720
0.1
250.
925
3.1
2004
248.
224
2.3
178.
313
2.6
123.
714
2.0
164.
016
0.2
173.
422
2.3
266.
128
1.6
2005
245.
123
5.0
210.
819
5.9
168.
216
7.6
187.
318
5.9
158.
816
2.5
230.
826
5.7
2006
280.
527
3.2
208.
616
6.4
157.
020
2.5
209.
821
2.6
224.
826
3.4
286.
327
6.3
2007
275.
927
1.6
277.
423
8.5
189.
317
2.3
218.
527
2.4
221.
625
4.4
281.
632
3.2
2008
314.
521
0.5
258.
724
3.4
204.
120
3.3
237.
825
1.7
268.
433
7.5
356.
233
3.7
2009
334.
627
1.4
242.
827
2.8
260.
626
8.4
321.
724
5.4
221.
228
4.5
304.
836
7.2
2010
376.
335
4.5
356.
031
6.6
257.
826
2.9
250.
122
0.8
2004
-05=
100
2005
101.
584
.980
.891
.895
.183
.488
.011
5.6
123.
920
0613
5.8
131.
999
.491
.689
.710
4.6
106.
410
6.8
107.
211
7.6
129.
012
8.9
2007
128.
913
3.5
138.
713
1.2
104.
397
.011
1.5
135.
811
1.2
121.
213
3.5
144.
020
0814
8.0
110.
513
1.8
126.
011
3.1
109.
811
5.5
127.
613
6.5
152.
816
4.0
158.
120
0915
9.8
129.
211
3.7
132.
913
4.1
134.
815
1.9
117.
910
4.5
128.
814
5.2
173.
820
1018
1.0
172.
116
9.3
161.
913
2.7
135.
912
7.4
117.
811
8.1
149.
217
2.8
204.
320
1128
3.4
276.
421
7.7
183.
018
9.9
182.
917
6.2
208.
521
8.6
236.
626
3.3
253.
920
1228
2.7
293.
835
6.4
355.
321
8.3
209.
920
5.1
(Sou
rce:
ww
w.in
dias
tat.c
om)
Page 212
Vegetable Statistics
197
Tabl
e 4.
62: M
onth
ly a
vera
ge w
hole
sale
pri
ce (W
P) a
nd a
rriv
al (A
R) o
f ok
ra d
urin
g th
e pe
riod
Jan
uary
to D
ecem
ber,
2011
(Ave
rage
who
lesa
le p
rice
in `
/q &
Arr
ival
in to
nnes
)
Mar
ket
Jan
Feb
Mar
chA
pril
May
June
July
Aug
Sept
Oct
Nov
Dec
Tota
lW
PA
RW
PA
RW
PA
RW
PA
RW
PA
RW
PA
RW
PA
RW
PA
RW
PA
RW
PA
RW
PA
RW
PA
RW
PA
R
Abo
har
1421
208
1091
330
1792
286
1504
312
1568
324
1900
263
2667
9817
0418
21A
gra
1031
110
922
116
1170
115
1364
101
1484
104
1194
546
Ahm
edab
ad17
1978
614
0694
916
2099
124
6896
125
8498
423
7394
920
2792
212
4814
119
3066
83A
mri
tsar
2175
7411
8967
627
161
925
8611
0269
1256
7812
1253
5Ba
ngal
ore
2371
232
2227
255
1519
267
1293
253
1564
303
1657
497
1457
278
1562
324
1796
387
1766
150
1671
153
1804
216
1725
3315
Bara
ut18
505
1226
5784
692
1219
8012
6260
2035
2714
0632
1Bh
opal
2826
2528
2831
2440
121
1545
514
748
814
1706
246
2229
428
1772
497
2215
294
1871
573
2479
283
2956
136
2134
3962
Bhub
anes
war
2828
3726
6827
1859
7473
619
772
623
415
3660
1608
7618
6487
2752
4227
2132
2798
3116
5047
1978
944
Cha
ndig
arh
1105
1041
831
1158
1119
1578
1234
1140
1625
954
1617
403
1255
6274
Che
nnai
3392
458
2796
383
1046
1465
888
903
1236
793
1590
1140
1565
694
982
1317
1001
1361
1113
737
1100
731
1624
722
1527
1070
4D
ehra
dun
2527
3397
316
177
414
196
816
678
112
612
1213
312
4785
1905
2428
6515
1472
885
Del
hi30
3811
7325
8321
4025
6345
3921
8831
1813
1221
3978
127
0612
4626
6111
7120
6518
5116
7316
7619
3523
2858
526
0812
1819
4525
952
Gan
gato
k30
8514
1950
2193
428
929
2614
2823
2144
2328
4020
2913
2431
3111
2150
189
Guw
ahat
i21
8723
065
737
082
834
414
3315
2325
0418
825
3815
116
9128
06H
yder
abad
1542
1226
1179
1267
956
1460
679
781
1172
713
1515
1073
1300
1409
1053
1070
825
3828
863
1397
1070
1374
1520
3491
1139
1908
9Ja
ipur
1067
592
1171
616
1427
475
1268
502
1296
483
1357
381
1384
149
1281
3198
Jala
ndha
r21
7210
216
9149
010
1764
890
648
510
4325
918
5322
923
4016
715
7423
80Ja
mm
u36
7159
2911
6427
7777
2517
8510
7223
079
423
681
518
810
4217
011
6713
188
913
012
7371
2133
4617
5514
87K
anpu
r42
336
2168
115
1413
314
679
436
491
693
1635
135
1634
8115
4694
1667
4717
1819
21K
arna
l31
7431
2378
2322
2329
1780
6093
916
188
225
010
3022
288
819
714
2318
516
3613
413
1439
1606
1331
Kol
kata
3550
725
8536
414
3434
390
955
110
9232
923
4039
428
4622
927
5011
624
6019
226
0519
223
5034
2265
2751
Luck
now
1756
257
958
609
734
425
1143
273
1279
253
1476
204
1475
166
1625
5413
0522
41M
umba
i25
7115
6619
5223
0918
6641
4315
7320
5414
2419
7321
2919
2020
9618
9921
5416
7917
5430
1114
4830
5324
3322
3618
5625
9619
3828
439
Nag
pur
2706
124
2245
8416
7411
012
6191
1210
112
1582
149
2276
9616
8610
512
1312
215
9012
821
4411
615
5011
017
6113
47N
asik
2534
2729
9223
2494
3322
7524
1460
3520
0644
2370
2624
9324
2473
2617
3825
2131
2431
2535
2340
346
Patn
a22
2540
2181
195
1551
480
682
675
672
505
1061
380
1338
250
1263
550
1987
595
2242
550
2828
6016
3942
60Pi
mal
gaon
630
100
630
100
Pune
8066
373
2589
783
2536
801
1978
620
1318
831
2934
427
2540
656
2389
670
2173
625
1824
529
2553
600
2558
681
2371
7596
Rai
pur
2530
5628
2053
1938
7910
3065
1215
6014
4828
1581
3316
0859
1988
6321
6542
2445
2521
7230
1911
593
Ran
chi
1703
454
1164
524
683
804
1013
749
1312
539
1486
497
1337
832
1459
554
1791
332
1941
2113
8853
06Sh
imla
3100
316
1313
813
9010
714
0722
012
3414
114
4811
315
3310
214
5042
2600
617
5287
2Sr
inag
ar28
003
2800
3Su
rat
2750
735
2202
874
2084
1085
1557
1095
1256
1540
2624
745
2748
859
2596
1210
2454
1305
2052
1358
3152
1800
2383
1368
2321
1396
Triv
endr
um19
0812
620
1410
010
5921
510
5215
010
7223
511
0419
410
6231
794
739
413
2031
512
4118
016
3615
8412
2222
413
0340
54
(Sou
rce:
NH
B, N
atio
nal H
ortic
ultu
re D
atab
ase
2011
)
Page 213
Indian Institute of Vegetable Research
198
Green Peas
Table 4.63: Area, production and yield of peas (green)
Years World IndiaArea Production Yield Area Production Yield
(Million ha) (Million t) (t/ha) (000’ha) (000’t) (t/ha)
1961 0.65 3.79 5.8 60 550 91962 0.67 3.94 5.9 62 550 91963 0.70 4.01 5.7 64 570 91964 0.71 4.09 5.7 65 600 91965 0.73 4.26 5.9 67 625 91966 0.74 4.30 5.8 69 655 91967 0.77 4.78 6.2 70 700 101968 0.78 4.75 6.1 73 730 101969 0.77 4.78 6.2 75 750 101970 0.76 4.72 6.2 77 780 101971 0.76 4.90 6.4 80 810 101972 0.77 4.86 6.3 83 840 101973 0.81 5.22 6.5 86 880 101974 0.83 5.80 7.0 90 930 101975 0.85 5.54 6.5 93 960 101976 0.82 4.98 6.1 95 1000 111977 0.82 5.52 6.7 97 1000 101978 0.82 5.33 6.5 100 1050 111979 0.82 5.62 6.9 102 1070 101980 0.80 5.39 6.7 107 1125 111981 0.81 5.66 7.0 110 1200 111982 0.81 5.98 7.4 111 1240 111983 0.79 5.48 6.9 115 1250 111984 0.83 6.18 7.4 117 1250 111985 0.85 6.27 7.4 120 1380 121986 0.81 5.88 7.2 125 1430 111987 0.85 5.99 7.0 130 1625 131988 0.88 6.12 7.0 135 1690 131989 0.91 6.94 7.7 140 1790 131990 0.97 7.49 7.7 145 1900 131991 1.00 7.81 7.8 147 2106 141992 1.00 8.22 8.2 143 2100 151993 0.98 8.04 8.2 148 2150 151994 1.13 9.14 8.1 180 2400 131995 1.23 9.75 7.9 220 2500 111996 1.22 9.52 7.8 200 2000 10
Contd...
Page 214
Vegetable Statistics
199
Years World IndiaArea Production Yield Area Production Yield
(Million ha) (Million t) (t/ha) (000’ha) (000’t) (t/ha)
1997 1.32 10.33 7.8 220 2200 10
1998 1.43 11.07 7.7 270 2420 9
1999 1.51 11.76 7.8 280 2700 102000 1.57 12.52 8.0 270 2710 10
2001 1.63 12.67 7.8 320 3010 9
2002 1.67 11.99 7.2 300 2040 7
2003 1.76 12.55 7.1 305 2062 7
2004 1.74 12.75 7.3 285 1901 7
2005 1.86 13.26 7.1 276 1945 7
2006 1.89 14.23 7.5 286 2270 8
2007 2.00 14.79 7.4 297 2402 8
2008 2.05 15.02 7.3 313 2491 8
2009 2.14 15.77 7.4 348 2916 8
2010 2.19 15.97 7.3 365 3029 8
2011 2.24 16.97 7.6 370 3571 10ACGR for last ten years 3.43 3.89 0.44 2.79 6.68 3.78(2002-2011)
(Source: www.faostat.fao.org)
Table 4.64: Major green pea producing countries in the world (2010-11)
Country Area % share to total area Production % share to total Productivity(000’ha) under green pea (000’t) green pea production (t/ha)
China 1295.87 57.82 10274.32 60.53 7.9
India 370.00 16.51 3571.00 21.04 9.7
UK 37.28 1.66 424.72 2.50 11.4
USA 64.39 2.87 267.55 1.58 4.2
Egypt 22.65 1.01 225.69 1.33 10.0France 33.28 1.48 262.94 1.55 7.9
Algeria 36.50 1.63 145.00 0.85 4.0
Others 381.35 17.01 1803.76 10.63 7.9
Total 2241.32 100.00 16974.98 100.00 7.6
Page 215
Indian Institute of Vegetable Research
200
Table 4.65:Percent share of area production and productivity of peas in India
Year Area % of total area Production % of total Productivity(000’ha) under vegetables (000’t) vegetable (t/ha)
production
1987-88 119.5 2.9 851.6 1.7 7.1
1991-92 177.7 2.9 1296 2.2 7.3
1992-93 194.1 3.8 1491.9 2.2 7.3
1993-94 181.6 3.7 1528.4 2.3 8.4
1994-95 218.2 4.4 2306.3 3.4 10.6
1995-96 224 4.2 2341.3 3.3 10.5
1996-97 254.4 4.6 2339.2 3.1 9.2
1997-98 272.5 4.9 2422 3.3 8.9
1998-99 282.5 4.8 2706.4 3.1 9.6
1999-00 272.6 4.5 2712 3 9.9
2000-01 319.3 5.1 3007.6 3.2 9.4
2001-02 303.3 4.9 2038.2 2.3 6.7
2002-03 305.2 5 2061.8 2.4 6.8
2003-04 285.2 4.5 1901.2 2 6.7
2004-05 276.3 4.1 1944.8 1.9 7
2005-06 286.1 4 2270 2.1 7.9
2006-07 297 3.9 2402 2.1 8.1
2007-08 313 4 2491 1.9 8
2008-09 348 4.4 2916 2.3 8.4
2009-10 364.9 4.6 3029.4 2.3 8.3
2010-11 370 4.4 3517 2.4 9.5
(Source: www.indiastat.com)
Page 216
Vegetable Statistics
201
Tabl
e 4.
66: S
tate
-wis
e ar
ea p
rodu
ctio
n an
d yi
eld
of p
eas
in I
ndia
fro
m 2
001-
02 to
201
0-11
[Are
a (A
): 00
0’ha
; Pro
duct
ion
(P):
000’
t; Yi
eld
(Y):
t/ha]
Stat
es/U
Ts20
01-0
220
02-0
320
03-0
420
04-0
520
05-0
6A
PY
AP
YA
PY
AP
YA
PY
And
hra
Prad
esh
-39
.0-
--
-47
.1-
-52
.7-
-21
2.9
-
Ass
am-
--
98.5
--
154.
0-
-16
2.1
--
177.
0-
Biha
r-
86.3
--
86.9
-95
.6-
-10
0.5
-8.
110
3.3
6.2
Chh
attis
garh
-55
.8-
-55
.8-
0.3
11.7
7.6
37.3
10.0
7.2
60.9
7.1
Har
yana
6.5
57.3
8.8
5.9
50.3
8.6
7.2
69.8
9.7
8.7
80.9
9.3
11.1
84.9
7.6
Him
acha
l Pra
desh
-9.
5-
10.3
14.8
10.4
15.4
-10
.516
.350
.510
.9
Jam
mu
& K
ashm
ir-
5.6
-8.
84.
23.
513
.27.
376
.115
.47.
350
.815
.4
Jhar
khan
d37
.88.
023
.349
.26
23.3
55.3
--
112.
2-
23.3
112.
2-
Kar
nata
ka1.
448
.816
.140
.8-
-41
.4-
-41
.8-
-42
.0-
Mad
hya
Prad
esh
3.5
302.
411
.113
9.6
-4.
313
9.6
11.0
4.8
11.0
19.4
-11
.0
Mah
aras
htra
-22
.5-
--
--
--
--
-
Man
ipur
--
--
--
--
--
--
Odi
sha
5.7
-8.
64.
7-
8.6
4.8
-8.
64.
8-
8.7
4.8
-8.
7
Punj
ab14
.4-
6.0
14.5
-6.
016
-6.
016
.7-
6.0
17.2
-6.
0
Raja
stha
n-
--
--
--
--
--
--
--
Utta
r Pr
ades
h14
7.4
1179
.28.
015
9.7
1277
.88.
012
9.2
1033
.28.
012
9.2
1033
.28.
013
9.0
1146
.88.
3
Utta
rakh
and
11.5
-4.
912
.4-
4.5
--
6.2
-6.
09.
6-
6.3
Wes
t Ben
gal
19.4
-4.
819
.8-
5.2
24.6
-4.
725
.0-
4.9
21.7
-6.
0
Oth
ers
55.8
-49
.8-
79.8
-50
.6-
2.5
52.4
2.4
Tota
l Ind
ia30
3.4
1791
.38.
530
5.2
1798
.97.
330
8.5
1639
.59.
327
6.3
1696
.88.
433
7.4
2041
.38.
0
Tabl
e co
ntin
ues
Page 217
Indian Institute of Vegetable Research
202
Stat
es/U
Ts20
06-0
720
07-0
820
08-0
920
09-1
020
10-1
1A
PY
AP
YA
PY
AP
YA
PY
And
hra
Prad
esh
0.1
230
352.
14
35.7
0.1
4-
0.1
20.4
-2.
381
.235
Ass
am0
203.
4-
-0
-19
.411
.9-
-13
.2-
-13
.7-
Biha
r8.
710
96.
19
57.6
6.4
9.1
61.3
6.7
9.5
63.5
6.9
-66
.5-
Chh
attis
garh
9.7
65.5
5.7
9.9
44.8
4.5
10.3
46.2
-10
.696
.69.
210
.899
.79.
2
Har
yana
11.1
94.7
8.6
1070
.97.
110
.691
.28.
611
64.3
6.1
71.4
340.
24.
8
Him
acha
l Pra
desh
17.4
53.1
11.7
17.4
203.
411
.718
.920
2.5
10.7
21.7
237.
310
.922
.825
4.2
11.1
Jam
mu
& K
ashm
ir2.
555
.5-
2.3
25.2
-4.
473
.516
.77.
669
.99.
26.
821
2.5
31.3
Jhar
khan
d-
116.
9-
-0
-12
.124
1.4
-20
.528
7-
21.3
329.
115
.4
Kar
nata
ka1
42.1
--
15.9
-1.
5616
.7-
1.6
18.1
--
19-
Mad
hya
Prad
esh
20.9
-11
21.5
236.
411
23.7
260.
811
2022
011
22.8
251.
311
Mah
aras
htra
-14
.1-
27.7
626
.47
32.2
-32
.2
Man
ipur
--
-24
.43.
534
3.5
34-
46.5
Odi
sha
4.8
23.9
--
42.4
-5.
346
.5-
5.1
45.2
--
45.4
-
Punj
ab18
.1-
618
.511
16
18.5
112
6.1
19.1
115.
56.
119
.720
0.6
10.2
Raja
stha
n11
.5-
--
12.6
-13
20.6
-13
.524
.4-
-40
-
Utta
r Pr
ades
h15
0.6
1178
815
8.1
1398
.68.
815
9.4
1464
.89.
215
914
65.8
9.2
159.
215
32.4
9.6
Uttr
akha
nd10
-6.
511
.172
.56.
510
.671
.16.
710
.871
6.6
11.2
86.9
7.8
Wes
t Ben
gal
21.6
-5.
820
.912
3.8
5.9
21.1
124.
75.
921
.112
5.6
621
.412
9.4
6
Oth
ers
-8.
843
.74.
459
.83.
6-
3.9
--
Tota
l Ind
ia28
821
86.2
10.3
324.
524
71.2
9.8
407.
3629
09.6
8.5
341.
730
047.
736
9.7
3780
.813
.8
(Sou
rce:
ww
w.in
dias
tat.c
om)
Page 218
Vegetable Statistics
203
Table 4.67: District-wise area production and yield of peas
Assam (2005-06)
Districts Area (ha) Production (t) Yield (t/ha)
Barpeta 1891 1513 0.8Bongaigaon 245 182 0.74Cachar 544 324 0.6Darrang 625 444 0.71Dhemaji 283 179 0.63Dhubri 322 247 0.77Dibrugarh 194 66 0.34Goalpara 226 118 0.52Golaghat 1059 920 0.87Hailakandi 320 182 0.57Jorhat 1164 498 0.43Kamrup 1148 945 0.82Karbi-Anglong 522 323 0.62Karimganj 70 23 0.33Kokrajhar 389 209 0.54Lakhimpur 432 180 0.42Morigon 460 460 1N C Hills 129 62 0.48Nagaon 1698 550 0.32Nalbari 1029 803 0.78Sibsagar 225 129 0.57Sonitpur 1866 1022 0.55Tinsukia 548 224 0.41Total 15389 9603 0.60
(Source: www.indiastat.com)
Bihar (2004-05)
Arhasia 772 679 0.88Arval 1142 1005 0.88Aurangabad 1269 1117 0.88Baghalpur 1460 1285 0.88Banka 82 72 0.88Begusarai 948 834 0.88Bhabha 729 703 0.96Bhojpur 1397 1203 0.86Buxar 902 777 0.86Champaran (East) 142 125 0.88Champaran (West) 1437 1265 0.88Darbhanga 387 406 1.05Gaya 342 301 0.88Gopalganj 662 583 0.88
Contd...
Page 219
Indian Institute of Vegetable Research
204
Districts Area (ha) Production (t) Yield (t/ha)
Jahanabad 179 158 0.88Katihar 332 292 0.88Khagaria 1276 1123 0.88Kishanganj 15 13 0.87Lakhisaria 294 259 0.88Madhubani 56 59 1.05Madhupura 1053 927 0.88Monghyr 637 561 0.88Muzaffarpur 162 143 0.88Nalanda 191 164 0.86Nawadha 301 265 0.88Patna 2262 1948 0.86Purnia 491 432 0.88Rohtas 981 769 0.78Saharsa 613 539 0.88Samastipur 260 273 1.05Saran 354 312 0.88Sitamarhi 218 192 0.88Siwan 968 852 0.88Supaul 383 337 0.88Vaishali 70 62 0.89Zamui 57 50 0.88Total 22824 20085 0.89
(Source: www.indiastat.com)
Chhattisgarh (2004-05)
Districts Area (ha) Production (t) Yield (t/ha)
Bastar 404 123 0.3Bilaspur 947 285 0.3Dhamtari 1991 648 0.33Durg 1036 241 0.23Janjgir-Champa 333 110 0.33Jashpur 1044 359 0.34Kanker 1888 532 0.28Kawardha (Kabirdham) 256 62 0.24Korba 174 44 0.25Koriya 342 116 0.34Mahasmund 221 69 0.31Raigarh 1580 514 0.33Raipur 2643 774 0.29Raj Nandgaon 210 60 0.29Sarguja 3289 1379 0.42Total 16358 5316 0.31
(Source: www.indiastat.com)
Page 220
Vegetable Statistics
205
Haryana (2006-07)
Districts Area (ha) Production (t) Yield (t/ha)
Panchkula 55 750 14Ambala 1155 11010 10Yamunanagar 844 7210 9Kurukshetra 1130 10680 9Kaithal 363 3275 9Karnal 1075 10105 9Panipat 645 180 0Sonipat 1810 10570 6Rohtak 250 1450 6Jhajjar 500 6870 14Faridabad 1365 23650 17Narnual 565 5380 10Rewari 100 400 4Gurgaon 485 4678 10Bhiwani 185 1000 5Hissar 150 250 2Fatehabad 295 2540 9Sirsa 250 2400 10Jind 670 9120 14Mewat 200 600 3Total 12092 112118 9
(Source: www.indiastat.com)
Jharkhand (2006-07)
Ranchi 2.514 2388 0.95Gumla 0.78 1139 1.50Simdega 0.49 329 0.67Lohardaga 1.185 1475 1.24East Singhbhum 0.646 775 1.20West Singhbum 0.43 230 0.53Saraikela 0.431 373 0.86Palamau 1.527 783 0.51Garhwa 1.717 1374 0.80Latehar 0.499 357 0.71Hazaribagh 1.828 2195 1.20Chatra 1.286 1573 1.22Koderma 0.88 976 1.10Giridih 0.755 871 1.15Dhanbad 0.565 600 1.08Bokaro 0.325 388 1.19Dumka 0.344 345 1.00Jamtara 0.9 879 0.97Deoghar 0.475 341 0.71Godda 1.025 1045 0.89Sahebganj 0.948 750 0.79Pakur 0.5 600 1.20Total 20.05 19786 0.98
(Source: www.indiastat.com)
Page 221
Indian Institute of Vegetable Research
206
Punjab (2005-06)
Districts Area (ha) Production (t) Yield (t/ha)
Hoshiarpur 4980 30189 6Jalandhar 1214 7432 6Ludhiana 269 1621 6Ferozepur 132 782 6Amritsar 5654 34145 6Gurdaspur 270 1589 6Kapurthala 398 2418 6Bathinda 59 333 6Sangrur 278 1658 6Patiala 1664 9952 6Ropar 58 344 6Faridkot 9 54 6Mansa 33 197 6Fatehgarh Sahib 192 1013 5Moga 28 148 5Mukatsar 82 455 6Nawashehar 1890 11000 6Total 17210 103330 6
(Source: www.indiastat.com)
Uttar Pradesh(Area in ha; Production in t; yield in t/ha)
Districts/divisions 2008-09 2009-10 2010-11A P Y A P Y A P Y
Saharanpur 119 987 8 134 1124 8 136 1157 9Meerut 1458 12512 9 1456 13700 9 1483 15233 10Agra 1414 19167 14 1724 23368 14 1758 24318 14Aligarh 4618 63704 14 5293 73994 14 5393 77176 14Bareilly 1483 13321 9 2166 19315 9 2207 20146 9Muradabad 669 5711 9 578 5040 9 589 5257 9Kanpur 4734 55888 12 4717 55797 12 4807 58196 12Allahabad 6700 50230 7 6909 54090 8 7040 56417 8Jhansi 68042 714149 10 67940 744857 11 69232 776886 11Chitrakoot Dham 17861 121277 7 15443 110792 7 15533 115555 7Varanasi 5491 42464 8 5088 40740 8 5184 42491 8Mirzapur 5014 40293 8 4981 40534 8 5076 42277 8Azamgarh 4983 36735 7 6932 54304 8 7063 56639 8Gorakhpur 3681 32011 9 3409 30173 9 3474 31470 9Basti 7293 39783 5 7341 41294 6 7480 43070 6Shri Patan devi 4233 37067 9 3643 32288 9 3712 33677 9Lucknow 6086 42915 7 6310 45248 7 6429 47194 7Faziabad 12118 77879 6 12366 81717 7 12601 85231 7Total U.P. 155997 1406093 9 156430 1468375 9 159197 1532390 10
(Source: State Horticulture Mission, Government of Uttar Pradesh)
Page 222
Vegetable Statistics
207
Uttarakhand (2005-06)
Districts Area (ha) Production (t) Yield (t/ha)
Chamoli 36 22 0.60Dehradun 377 301 0.80Dehradun (Plain) 486 389 0.80Dehradun (Total) 863 690 0.80Haridwar 70 48 0.67Pauri Garhwal 103 57 0.55Rudraprayag 2 1 0.70Tehri Garhwal 458 274 0.60Uttar Kashi 581 263 0.45Almora 64 42 0.65Bageshwar 57 39 0.70Champawat 60 40 0.65Nainital (Hill) 70 46 0.65Nainital (Plain) 70 54 0.78Nainital (Total) 140 100 0.71Pithoragarh 68 37 0.55U.S Nagar 2259 1637 0.72Uttaranchal (Hill) 1876 1122 0.59Uttaranchal (Plain) 2885 2128 0.73Uttarakhand 4761 3250 0.68
(Source: www.indiastat.com)
West Bengal (2005-06)
Darjeeling 820 668 0.81Jalpaiguri 213 173 0.81Coochbehar 6 5 0.81Uttar Dinajpur 1 1 1.00Dakshin Dinajpur 1 1 1.00Malda 480 391 0.81Murshidabad 3846 3175 0.82Nadia 4339 3603 0.83North 24 Parganas 1109 882 0.79South 24 Parganas 625 497 0.79Howrah 38 30 0.79Hooghly 1284 1626 1.26Burdwan 15 3 0.22Birbhum 269 341 1.26Bankura 56 71 1.26Purulia 3 4 1.26Paschim Medinipur 26 33 1.26West Bengal 13131 11504 0.87
(Source: www.indiastat.com)
Page 223
Indian Institute of Vegetable Research
208
Tabl
e 4.
68: M
onth
ly w
hole
sal
e pr
ice
inde
x (W
PI) o
f pe
as (g
reen
) in
Indi
a {(B
ase
year
: 198
1-82
; 199
3-94
; 200
4-05
=100
)
(Apr
il 19
90 to
Dec
embe
r 19
92 a
nd S
epte
mbe
r 19
93 to
July
201
2)}
Year
Jan.
Feb.
Mar
.A
pr.
May
Jun.
Jul.
Aug
.Se
pt.
Oct
.N
ov.
Dec
.
1981
-82=
100
1990
N.A
.N
.A.
N.A
.N
.A.
N.A
.N
.A.
256.
924
1.3
184.
319
9114
6.7
127.
914
9.9
N.A
.N
.A.
N.A
.N
.A.
N.A
.N
.A.
309.
629
9.4
186.
619
9215
0.2
145.
217
1.9
N.A
.N
.A.
N.A
.N
.A.
N.A
.N
.A.
306.
532
9.3
221.
319
93N
.A.
323.
633
3.0
268.
4
1993
-94=
100
1994
228.
819
9.5
199.
1N
.A.
N.A
.N
.A.
N.A
.N
.A.
N.A
.17
0.3
150.
279
.419
9571
.564
.373
.2N
.A.
N.A
.N
.A.
N.A
.N
.A.
N.A
.14
6.7
152.
599
.019
9672
.159
.486
.6N
.A.
N.A
.N
.A.
N.A
.N
.A.
N.A
.23
5.9
224.
020
5.2
1997
201.
918
5.3
176.
5N
.A.
N.A
.N
.A.
N.A
.N
.A.
N.A
.22
6.6
205.
518
1.8
1998
135.
912
2.6
107.
8N
.A.
N.A
.N
.A.
N.A
.N
.A.
N.A
.22
7.8
184.
115
1.5
1999
130.
311
1.3
117.
3N
.A.
N.A
.N
.A.
N.A
.N
.A.
N.A
.18
7.8
149.
310
7.4
2000
100.
082
.888
.8N
.A.
N.A
.N
.A.
N.A
.N
.A.
N.A
.18
4.7
156.
412
2.4
2001
100.
092
.593
.5N
.A.
N.A
.N
.A.
N.A
.N
.A.
N.A
.19
3.0
231.
414
4.2
2002
92.7
68.1
100.
2N
.A.
N.A
.N
.A.
N.A
.N
.A.
N.A
.20
2.7
200.
713
4.8
2003
98.5
94.9
97.4
N.A
.N
.A.
N.A
.N
.A.
N.A
.N
.A.
230.
722
8.8
123.
720
0490
.294
.310
3.8
N.A
.N
.A.
N.A
.N
.A.
N.A
.N
.A.
272.
923
5.9
111.
920
0614
6.4
144.
513
2.7
N.A
.N
.A.
N.A
.N
.A.
N.A
.N
.A.
190.
721
2.6
140.
320
0787
.712
2.7
147.
5N
.A.
N.A
.N
.A.
N.A
.N
.A.
N.A
.N
.A.
212.
318
5.9
2008
163.
516
0.6
160.
7N
.A.
N.A
.N
.A.
N.A
.N
.A.
N.A
.21
2.1
204.
717
9.8
2009
160.
414
0.8
139.
2N
.A.
N.A
.N
.A.
N.A
.N
.A.
N.A
.19
6.6
299.
523
4.2
2010
176.
416
0.7
147.
4N
.A.
N.A
.N
.A.
N.A
.N
.A.
2004
-05=
100
2005
N.A
.N
.A.
N.A
.N
.A.
N.A
.N
.A.
145.
814
2.0
97.1
2006
87.4
85.8
92.8
N.A
.N
.A.
N.A
.N
.A.
N.A
.N
.A.
130.
613
7.4
94.0
2007
68.2
73.5
92.9
N.A
.N
.A.
N.A
.N
.A.
N.A
.N
.A.
172.
216
2.5
130.
720
0894
.793
.910
0.3
N.A
.N
.A.
N.A
.N
.A.
N.A
.N
.A.
179.
214
5.5
121.
220
0910
9.2
104.
411
0.2
N.A
.N
.A.
N.A
.N
.A.
N.A
.N
.A.
150.
417
7.3
160.
620
1010
7.0
84.8
85.9
N.A
.N
.A.
N.A
.N
.A.
N.A
.N
.A.
246.
318
3.7
136.
220
1111
4.0
89.6
99.4
N.A
.N
.A.
N.A
.N
.A.
N.A
.N
.A.
312.
724
5.4
141.
020
1210
6.9
113.
312
8.9
N.A
.N
.A.
N.A
.N
.A.
(Sou
rce:
ww
w.in
dias
tat.c
om)
Page 224
Vegetable Statistics
209
Tabl
e 4.
69: M
onth
ly a
vera
ge w
hole
sale
pri
ce (W
P) a
nd a
rriv
al (A
R) o
f pe
as d
urin
g th
e pe
riod
Jan
uary
to D
ecem
ber,
2011
(Ave
rage
who
lesa
le p
rice
in `
/q a
nd A
rriv
al in
t)
Mar
ket
Jan
Feb
Mar
chA
pril
May
June
July
Aug
Sept
Oct
Nov
Dec
Tota
lW
PA
RW
PA
RW
PA
RW
PA
RW
PA
RW
PA
RW
PA
RW
PA
RW
PA
RW
PA
RW
PA
RW
PA
RW
PA
R
Abo
har
1463
9112
4656
1268
221
1750
7519
4041
1171
424
1473
906
Ahm
edab
ad13
3115
6898
326
6810
4111
4420
1499
2225
112
1316
899
1485
6490
Am
rits
ar14
6584
484
894
482
784
115
3254
613
5423
239
2110
428
4034
384
012
6517
0351
19
Bang
alor
e22
9211
6317
9415
4824
1510
0342
3036
458
9355
670
6047
347
7211
527
5019
334
0414
555
0065
6898
9633
9322
841
8359
69
Bara
ut17
9081
1376
8210
7212
911
7012
2158
6015
1336
4
Bhop
al12
9684
696
172
012
6267
223
8222
3908
613
0888
818
5231
54
Bhub
anes
war
1843
378
1016
675
1448
510
2743
3656
8632
2750
354
2581
1985
Cha
ndig
arh
1025
1180
918
1560
892
1591
1443
504
1976
514
1988
373
2592
495
1165
1470
1499
7687
Deh
radu
n84
240
884
124
183
131
715
7337
616
9410
821
5441
4210
2152
1526
5468
1727
9750
1211
383
2439
1988
Del
hi14
8176
9211
2966
8910
3851
4220
5322
6223
1535
0739
0416
2950
5416
6952
2617
4778
0461
475
1163
939
8026
3713
5485
7435
7042
801
Gan
gato
k31
6031
2146
2916
9130
2990
1733
7822
3740
1944
2414
5365
2133
6118
1
Guw
ahat
i19
0855
393
361
496
543
422
5011
115
1417
12
Hyd
erab
ad12
1110
6212
1110
62
Jaip
ur11
8931
5567
317
0755
314
9110
1415
830
6438
312
0817
5012
8386
44
Jala
ndha
r16
9220
4413
5712
5896
312
7118
8034
126
0922
628
4515
918
8952
99
Jam
mu
1513
693
900
858
735
609
1648
197
900
327
1754
276
3185
181
3127
9326
8654
4620
3241
1323
610
1785
221
8344
08
Kan
pur
967
3432
611
2876
852
189
810
6497
Kol
kata
1661
3103
923
3178
1478
1013
2398
300
3530
4064
4136
128
2517
7327
5097
68
Luck
now
1351
2298
723
3083
1256
779
1910
111
1364
4247
1320
1051
8
Mum
bai
1658
9303
1117
1191
514
0090
9029
8625
2230
4829
2940
7520
1139
0830
0633
7132
7354
7715
8084
5810
5547
2530
2817
4410
838
3497
6055
0
Nag
pur
1726
134
1074
151
1263
6813
5435
3
Patn
a14
3511
3585
394
511
3247
510
1340
1569
135
1200
2730
Pune
2303
1680
1969
938
2443
516
2900
1512
0011
6595
076
019
5013
519
6252
09
Rai
pur
1509
425
1308
526
1319
328
2732
3438
8056
1716
277
2077
1646
Ran
chi
1086
829
530
856
738
705
2580
8415
5733
4812
9858
22
Shim
la16
9714
715
4222
510
4814
814
0725
819
1049
621
4234
524
6527
033
9611
340
0293
7369
9653
3815
521
8333
528
7426
81
Srin
agar
2146
1007
1464
1230
1465
940
2048
620
1382
1333
1241
885
2740
5524
3819
513
6915
9018
1078
55
Sura
t17
3457
2511
3912
3514
5273
928
4711
216
6510
4717
7288
58
(Sou
rce:
NH
B, N
atio
nal H
ortic
ultu
re D
atab
ase
2011
)
Page 225
Indian Institute of Vegetable Research
210
Tabl
e 4.
70: I
ndia
’s tr
ade
in p
eas
(gre
en)
(Qua
ntity
in t;
val
ue in
‘000
US$
; uni
t val
ue in
US$
/t)
Year
Expo
rtIm
port
Expo
rt%
sha
re in
Expo
rt%
sha
re in
Uni
tIm
port
% s
hare
inIm
port
% s
hare
inU
nit
Qua
ntity
wor
ld e
xpor
tVa
lue
wor
ld e
xpor
tVa
lue
Qua
ntity
wor
ld im
port
Valu
ew
orld
impo
rtVa
lue
1987
128
0.29
760.
3559
417
814
29.6
056
2912
.30
316
1988
131
0.19
860.
2865
618
703
23.3
363
628.
8434
019
8928
0.03
230.
0682
125
813.
6610
911.
5442
319
900
0.00
00.
000
9600
12.1
931
203.
5932
519
910
0.00
00.
000
983
1.08
334
0.33
340
1992
120.
023
0.01
250
2457
2.86
937
1.00
381
1993
70.
012
0.00
286
1167
29.
8236
433.
6631
219
9431
70.
3421
80.
3468
829
70.
3193
0.09
313
1995
556
0.45
382
0.46
687
620.
0529
0.02
468
1996
136
0.13
980.
1372
10
0.00
00.
000
1997
135
0.12
530.
0639
394
20.
7338
00.
2840
319
9873
0.06
390.
0453
417
20.
1040
0.02
233
1999
1128
0.94
478
0.58
424
4498
2.30
921
0.54
205
2000
723
0.65
338
0.44
467
6316
2.97
1462
0.87
231
2001
533
0.43
346
0.44
649
3565
614
.18
7612
4.84
213
2002
2564
1.63
1575
1.75
614
1999
36.
7647
732.
8323
920
0327
811.
5418
321.
6265
950
232.
1312
510.
6724
920
0420
011.
3490
40.
8245
23
0.00
20.
0066
720
0511
090.
6463
90.
4657
60
0.00
00.
000
2006
1184
0.79
603
0.47
509
00.
000
0.00
020
0781
50.
5465
60.
3780
50
0.00
00.
000
2008
2519
1.50
1840
0.87
730
00.
000
0.00
020
0912
710.
5873
10.
3157
519
40.
0886
0.03
443
2010
687
0.34
597
0.24
869
00.
000
0.00
0
(Sou
rce:
ww
w.fa
osta
t.fao
.org
)
Page 226
Vegetable Statistics
211
Table 4.71: Major destinations of pea exports from India
(Quantity in t, Value in Lakhs `)
Country 2008-09 2009-10 2010-11Quantity Value Quantity Value Quantity Value
Saudi Arabia 1479.9 (59)* 549.1 (69) 441.0 (35) 214.1 (61) 498.1 (50) 206.4 (78)
UAE 341.8 (14) 109.2 (14) 155.6 (12) 53.1 (15) 118.3 (12) 32.8 (13)
Nepal 168.5 (7) 13.4 (2) 166.5 (13) 67.1 (19) 367.1 (36) 21.5 (9)
Qatar 10.3 (0) 2.5 (0) 0.0 (0) 0.0 (0) 3.0 (0) 1.2 (0)
United States 294.4 (12) 96.0 (12) 0.0 (0) 0.0 (0) 0.9 (0) 0.8 (0)Oman 49.9 (2) 4.0 (1) 4.7 (0) 0.3 (0) 16.2 (2) 0.7 (0)
UK 0.0 (0) 0.0 (0) 0.0 (0) 0.0 (0) 1.1 (0) 0.3 (0)
Indonesia 0.0 (0) 0.0 (0) 0.0 (0) 0.0 (0) 0.0 (0) 0.0 (0)
Others 174.6 (6) 21.1 (2) 502.9 (40) 19.0 (5) 0.0 (0) 0.0 (0)
Total 2519.4 (100) 795.4 (100) 1270.7 (100) 353.7 (100) 1004.6 (100) 263.7 (100)
* Figures in parenthesis give percentage to the total exports.(Source:www.apeda.gov.in)
Table 4.72: Major destinations of pea seeds export from India
(Quantity: Kg; Value: `)
Country 2008-09 2009-10 2010-11Quantity Value Quantity Value Quantity Value
Pakistan 24000 1157722 0 0 376515 16371163
Nepal 0 0 0 0 55795 3750809
Taiwan 0 0 0 0 29 1354
USA 0 0 3208 159104 0 0
China 0 0 900 82414 0 0
Italy 0 0 25193 3147884 0 0
Ireland 0 0 500 24372 0 0
Japan 4610 456409 0 0 0 0
Malaysia 0 0 200 65442 0 0
Kuwait 200 31880 6000 237379 0 0
Others 38 900 2815 158720 0 0Total 28848 1646911 38816 3875315 432339 20123326
(Source: www.agriexchange.apeda.gov.in)
Page 227
Indian Institute of Vegetable Research
212
Beans
Table 4.73: Area, production and yield of beans (green)
Years World IndiaArea Production Yield Area Production Yield
(Million ha) (Million t) (t/ha) (000’ha) (000’t) (t/ha)
1961 0.51 2.70 5.3 80 185 21962 0.50 2.64 5.2 81 186 21963 0.52 2.71 5.2 83 190 21964 0.52 2.81 5.4 85 200 21965 0.54 2.79 5.2 88 210 21966 0.55 2.89 5.3 87 205 21967 0.54 2.93 5.4 90 210 21968 0.55 2.94 5.3 94 220 21969 0.56 3.04 5.4 96 230 21970 0.57 3.15 5.5 100 240 21971 0.59 3.22 5.5 105 250 21972 0.60 3.32 5.6 106 260 21973 0.60 3.38 5.6 107 270 31974 0.61 3.52 5.7 110 277 31975 0.62 3.52 5.7 112 280 31976 0.61 3.43 5.6 114 283 21977 0.63 3.72 5.9 115 285 21978 0.64 3.75 5.9 118 295 31979 0.64 3.92 6.1 121 305 31980 0.63 3.95 6.3 125 320 31981 0.69 4.18 6.1 125 330 31982 0.70 4.42 6.3 130 350 31983 0.71 4.48 6.3 132 355 31984 0.74 4.84 6.5 133 360 31985 0.74 5.00 6.8 134 365 31986 0.77 4.98 6.5 135 370 31987 0.84 5.22 6.2 136 375 31988 0.87 5.47 6.3 138 385 31989 0.91 5.88 6.4 142 390 31990 0.95 6.03 6.4 135 398 31991 0.98 6.38 6.5 143 374 31992 1.05 6.87 6.5 139 380 31993 0.99 6.97 7.0 144 385 31994 1.03 7.06 6.9 145 388 31995 1.31 8.68 6.6 191 390 2
Contd...
Page 228
Vegetable Statistics
213
Years World IndiaArea Production Yield Area Production Yield
(Million ha) (Million t) (t/ha) (000’ha) (000’t) (t/ha)
1996 1.28 8.91 7.0 148 400 31997 1.29 8.94 6.9 138 319 21998 1.31 9.24 7.1 150 410 31999 1.33 9.73 7.3 157 460 32000 1.38 9.95 7.2 157 420 32001 1.45 11.08 7.7 173 461 32002 1.45 11.74 8.1 165 403 22003 1.50 12.97 8.6 207 462 22004 1.42 13.76 9.7 156 383 22005 1.42 15.37 10.8 168 417 22006 1.46 17.21 11.8 183 478 32007 1.46 18.02 12.3 189 514 32008 1.47 19.01 12.9 196 536 32009 1.47 19.13 13.0 199 541 32010 1.52 19.83 13.0 208 582 32011 1.54 20.39 13.2 218 618 3ACGR for last ten years 0.52 6.41 5.85 2.56 4.94 2.31(2002-2011)
(Source:www.faostat.fao.org)
Table 4.74: Major beans producing countries in the world (2010-11)
Country Area % share to total Production % share to total Productivity(000’ha) world area (000’t) bean production (t/ha)
under beans in the world
China 586.2 39.2 15213.7 76.7 26.0Indonesia 144.4 9.7 942.4 4.8 6.5Turkey 70.0 4.7 588.0 3.0 8.4India 207.5 13.9 582.2 2.9 2.8Thailand 152.0 10.2 304.7 1.5 2.0Egypt 26.3 1.8 270.7 1.4 10.3Morocco 8.4 0.6 201.9 1.0 24.1Italy 20.6 1.4 183.0 0.9 8.9Spain 12.3 0.8 174.6 0.9 14.2Belgium 8.1 0.5 89.0 0.4 11.0others 259.7 17.4 1284.1 6.5 11.4World 1495.4 100.0 19834.3 100.0 13.3
(Source: www.faostat.fao.org)
Page 229
Indian Institute of Vegetable Research
214
Table 4.75: Percent share of area production and productivity of beans in India
Year Area % of total area Production % of total Productivity(000’ha) under vegetables (000’t) vegetable (t/ha)
production
1991 143 2.94 374 0.75 2.6
1992 139 3.15 380 0.75 2.7
1993 144 3.06 385 0.73 2.7
1994 145 3.26 388 0.72 2.7
1995 191 3.40 390 0.69 2.0
1996 148 2.93 400 0.70 2.7
1997 138 2.79 319 0.59 2.3
1998 150 2.82 410 0.64 2.7
1999 157 2.87 460 0.65 2.9
2000 157 2.87 420 0.58 2.7
2001 173 2.87 461 0.58 2.7
2002 165 2.86 403 0.58 2.4
2003 207 2.88 462 0.58 2.2
2004 156 2.89 383 0.58 2.5
2005 168 2.88 417 0.58 2.5
2006 183 2.89 478 0.58 2.6
2007 189 2.88 514 0.58 2.7
2008 196 2.88 536 0.58 2.7
2009 199 2.95 541 0.60 2.7
2010 208 2.87 582 0.58 2.8
2011 218 2.88 618 0.58 2.8
(Source: www.faostat.fao.org)*Source for total vegetable area and production NHB, National Horticultural Database, 2011
Page 230
Vegetable Statistics
215
Tabl
e 4.
76: I
ndia
’s tr
ade
in b
eans
(gre
en)
(Qua
ntity
in t;
Val
ue in
‘000
US$
; Uni
t val
ue in
US$
/t)
Year
Expo
rtIm
port
Expo
rt%
sha
re in
Expo
rt%
sha
re in
Uni
tIm
port
% s
hare
inIm
port
% s
hare
inU
nit
Qua
ntity
wor
ld e
xpor
tVa
lue
wor
ld e
xpor
tVa
lue
Qua
ntity
wor
ld im
port
Valu
ew
orld
impo
rtVa
lue
1987
620.
0638
0.05
613
832
0.61
299
0.20
359
1988
50.
002
0.00
400
1659
1.11
592
0.38
357
1989
10.
001
0.00
1000
00.
000
0.00
019
900
0.00
00.
000
287
0.18
112
0.06
390
1991
00.
000
0.00
00
0.00
00.
000
1992
130.
014
0.00
308
222
0.13
980.
0444
119
931
0.00
10.
0010
000
0.00
00.
000
1994
00.
000
0.00
00
0.00
00.
000
1995
690.
0446
0.02
667
570.
0334
0.01
596
1996
10.
001
0.00
1000
465
0.22
810.
0317
419
9712
10.
0673
0.04
603
100
0.04
370.
0137
019
9850
0.02
130.
0126
01
0.00
00.
000
1999
210.
019
0.00
429
00.
000
0.00
020
0020
00.
0883
0.04
415
00.
000
0.00
020
0111
0.00
30.
0027
324
0.01
100.
0041
720
0259
0.03
200.
0133
90
0.00
00.
000
2003
531
0.20
254
0.08
478
00.
000
0.00
020
0412
480.
4031
80.
0925
50
0.00
00.
000
2005
1168
0.33
353
0.09
302
00.
000
0.00
020
0616
610.
5414
280.
3786
00
0.00
00.
000
2007
482
0.13
340
0.08
705
10.
000
0.00
020
0869
0.02
540.
0178
32
0.00
10.
0050
020
0911
70.
0460
0.01
513
10.
000
0.00
020
1010
70.
0353
0.01
495
00.
000
0.00
0
(Sou
rce:
ww
w.fa
osta
t.fao
.org
)
Page 231
Indian Institute of Vegetable Research
216
Tabl
e 4.
77: I
ndia
’s tr
ade
in le
gum
inou
s ve
geta
bles
(Qua
ntity
in t;
val
ue in
‘000
US$
; uni
t val
ue in
US$
/t)
Year
Expo
rtIm
port
Expo
rt%
sha
re in
Expo
rt%
sha
re in
Uni
tIm
port
% s
hare
inIm
port
% s
hare
inU
nit
Qua
ntity
wor
ld e
xpor
tVa
lue
wor
ld e
xpor
tVa
lue
Qua
ntity
wor
ld im
port
Valu
ew
orld
impo
rtVa
lue
1987
225
0.88
880.
4639
11,
506.
009.
8854
66.
9136
319
8826
0.12
100.
0538
51,
122.
005.
8259
63.
6453
119
8912
0.05
40.
0233
30
0.00
00.
000
1990
150.
0610
0.04
667
127
0.82
560.
3544
119
9137
0.15
270.
1273
00
0.00
00.
000
1992
00.
000
0.00
00
0.00
00.
000
1993
00.
000
0.00
00
0.00
00.
000
1994
270.
0410
0.02
370
00.
000
0.00
019
950
0.00
00.
000
00.
000
0.00
019
960
0.00
00.
000
00.
000
0.00
019
970
0.00
00.
000
00.
000
0.00
019
988
0.02
70.
0387
50
0.00
00.
000
1999
60.
014
0.01
667
00.
000
0.00
020
0024
0.03
140.
0358
317
50.
4068
0.22
389
2001
230.
0338
0.08
1652
00.
000
0.00
020
028
0.01
80.
0210
000
0.00
00.
000
2003
620.
0959
0.12
952
00.
000
0.00
020
0498
0.14
590.
1260
20
0.00
00.
000
2005
234
0.26
106
0.21
453
00.
000
0.00
020
0646
0.04
520.
0911
300
0.00
00.
000
2007
450.
069
0.01
200
00.
000
0.00
020
0815
60.
2348
0.07
308
00.
000
0.00
020
0916
641.
9210
131.
2960
90
0.00
00.
000
2010
1326
1.23
1026
1.07
774
00.
000
0.00
0
(Sou
rce:
ww
w.fa
osta
t.fao
.org
)
Page 232
Vegetable Statistics
217
Carrot & turnips
Table 4.78: Area, production and yield of carrots and turnips
Years World IndiaArea Production Yield Area Production Yield
(Million ha) (Million t) (t/ha) (000’ha) (000’t) (t/ha)
1961 0.36 5.84 16.1 8 64 81962 0.38 6.09 16.1 9 70 81963 0.39 6.72 17.0 9 74 81964 0.39 6.75 17.1 10 81 91965 0.39 6.66 17.1 10 85 91966 0.40 7.14 18.1 10 92 91967 0.40 7.34 18.5 11 96 91968 0.41 7.51 18.5 11 100 91969 0.42 7.80 18.6 12 110 91970 0.43 7.85 18.4 12 112 91971 0.42 7.90 18.7 12 120 101972 0.43 7.96 18.5 13 124 101973 0.45 8.65 19.3 13 129 101974 0.46 8.76 19.1 14 140 101975 0.47 8.59 18.3 14 143 101976 0.47 8.61 18.2 15 160 111977 0.49 9.86 20.3 15 165 111978 0.50 10.23 20.4 16 170 111979 0.51 9.96 19.7 16 184 121980 0.53 10.44 19.8 16 186 111981 0.55 10.76 19.6 16 188 121982 0.55 11.24 20.6 17 200 121983 0.54 10.97 20.2 17 204 121984 0.57 12.48 21.8 18 227 131985 0.57 12.07 21.3 18 235 131986 0.59 12.60 21.5 19 250 141987 0.60 13.12 21.8 19 260 141988 0.62 13.27 21.4 20 272 141989 0.64 13.57 21.3 20 275 141990 0.62 13.66 21.9 20 280 141991 0.66 13.97 21.1 20 287 141992 0.64 14.20 22.3 21 293 141993 0.67 15.59 23.2 21 295 141994 0.72 15.87 22.1 22 305 141995 0.75 16.67 22.1 21 300 14
Contd...
Page 233
Indian Institute of Vegetable Research
218
Years World IndiaArea Production Yield Area Production Yield
(Million ha) (Million t) (t/ha) (000’ha) (000’t) (t/ha)
1996 0.79 17.95 22.6 22 320 151997 0.83 19.10 22.9 24 340 141998 0.89 19.18 21.7 30 351 121999 0.93 20.15 21.6 31 346 112000 0.98 21.42 21.8 24 350 152001 0.99 21.94 22.2 27 384 142002 1.02 22.56 22.1 25 336 132003 1.11 25.14 22.7 32 385 122004 1.14 25.96 22.9 24 319 132005 1.15 27.55 23.9 26 348 132006 1.16 28.74 24.7 28 399 142007 1.14 29.65 26.1 29 428 152008 1.13 32.99 29.1 30 446 152009 1.13 33.67 29.9 31 451 152010 1.15 33.79 29.6 32 485 152011 1.18 35.66 30.1 33 515 15ACGR for last ten years 0.86 5.01 4.11 2.57 4.94 2.31(2002-2011)
(Source:www.faostat.fao.org)
Table 4.79: Major carrot &turnips producing countries in the world (2010-11)
Country Area % share to total Production % share to total carrot Productivity(000’ha) area under (000’t) & turnip production (t/ha)
carrot & turnips in the world
China 452.5 39.3 15899.1 47.2 35.1USA 31.8 2.8 1341.7 4.0 42.2Russia 66.1 5.7 1303.3 3.9 19.7Uzbekistan 23.0 2.0 1107.0 3.3 48.1Poland 28.0 2.4 814.9 2.4 29.1UK 11.5 1.0 763.1 2.3 66.1Ukraine 44.2 3.8 714.6 2.1 16.2Japan 18.8 1.6 620.4 1.8 33.0Germany 10.4 0.9 554.0 1.6 53.4Turkey 28.0 2.4 533.3 1.6 19.0others 437.0 38.0 10068.6 29.9 36.2World 1151.3 100.0 33719.9 100.0 29.3
(Source: www.faostat.fao.org)
Page 234
Vegetable Statistics
219
Table 4.80: Percent share of area production and productivity of carrot and turnip in India
Year Area % of total area Production % of total Productivity(000’ha) under vegetables* (000’t) vegetable (t/ha)
production*
1991 20 0.41 287 0.57 14.4
1992 21 0.48 293 0.58 14.0
1993 21 0.45 295 0.56 14.0
1994 22 0.49 305 0.56 13.9
1995 21 0.37 300 0.53 14.3
1996 22 0.44 320 0.56 14.5
1997 24 0.49 340 0.63 14.2
1998 30 0.56 351 0.55 11.7
1999 31 0.57 346 0.49 11.2
2000 24 0.44 350 0.48 14.6
2001 27 0.45 384 0.49 14.2
2002 25 0.43 336 0.49 13.4
2003 32 0.45 385 0.49 12.0
2004 24 0.44 319 0.49 13.3
2005 26 0.45 348 0.49 13.4
2006 28 0.44 399 0.49 14.3
2007 29 0.44 428 0.49 14.8
2008 30 0.44 446 0.49 14.9
2009 31 0.46 451 0.50 14.5
2010 32 0.44 485 0.48 15.2
2011 33 0.44 515 0.49 15.6
(Source: www.faostat.fao.org)*Source for total vegetable area and production NHB, National Horticultural Database, 2011
Page 235
Indian Institute of Vegetable Research
220
Tabl
e 4.
81: I
ndia
’s tr
ade
in c
arro
t and
turn
ips
(Qua
ntity
in t;
Valu
e in
‘000
US$
; Uni
t val
ue in
US$
/t)
Year
Expo
rtIm
port
Expo
rt%
sha
re in
Expo
rt%
sha
re in
Uni
tIm
port
% s
hare
inIm
port
% s
hare
inU
nit
Qua
ntity
wor
ld e
xpor
tVa
lue
wor
ld e
xpor
tVa
lue
Qua
ntity
wor
ld im
port
Valu
ew
orld
impo
rtVa
lue
1961
340.
026
0.04
176
00.
000
0.00
0
1962
201
0.09
130.
0565
00.
000
0.00
0
1963
250.
012
0.01
800
0.00
00.
000
1964
540.
033
0.02
560
0.00
00.
000
1965
00.
000
0.00
00
0.00
00.
000
1966
00.
000
0.00
00
0.00
00.
000
1967
20.
000
0.00
00
0.00
00.
000
1968
00.
000
0.00
00
0.00
00.
000
1969
00.
000
0.00
00
0.00
00.
000
1970
00.
000
0.00
00
0.00
00.
000
1971
00.
000
0.00
00
0.00
00.
000
1972
00.
000
0.00
00
0.00
00.
000
1973
00.
000
0.00
00
0.00
00.
000
1974
00.
000
0.00
00
0.00
00.
000
1975
00.
000
0.00
00
0.00
00.
000
1976
00.
000
0.00
00
0.00
00.
000
1977
10.
000
0.00
00
0.00
00.
000
1978
00.
000
0.00
00
0.00
00.
000
1979
00.
000
0.00
00
0.00
00.
000
1980
00.
000
0.00
00
0.00
00.
000
1981
00.
000
0.00
00
0.00
00.
000
1982
20.
001
0.00
500
00.
000
0.00
0
1983
00.
000
0.00
00
0.00
00.
000
1984
471
0.10
720.
0715
30
0.00
00.
000
Con
td...
Page 236
Vegetable Statistics
221
Year
Expo
rtIm
port
Expo
rt%
sha
re in
Expo
rt%
sha
re in
Uni
tIm
port
% s
hare
inIm
port
% s
hare
inU
nit
Qua
ntity
wor
ld e
xpor
tVa
lue
wor
ld e
xpor
tVa
lue
Qua
ntity
wor
ld im
port
Valu
ew
orld
impo
rtVa
lue
1985
00.
000
0.00
00
0.00
00.
000
1986
00.
000
0.00
00
0.00
00.
000
1987
110.
006
0.00
545
00.
000
0.00
0
1988
10.
000
0.00
00
0.00
00.
000
1989
00.
000
0.00
00
0.00
00.
000
1990
00.
000
0.00
00
0.00
00.
000
1991
00.
000
0.00
00
0.00
00.
000
1992
00.
000
0.00
00
0.00
00.
000
1993
00.
000
0.00
00
0.00
00.
000
1994
00.
000
0.00
00
0.00
00.
000
1995
330.
008
0.00
242
00.
000
0.00
0
1996
10.
000
0.00
00
0.00
00.
000
1997
700.
0122
0.01
314
00.
000
0.00
0
1998
180.
0014
0.00
778
00.
000
0.00
0
1999
170.
0014
0.00
824
00.
000
0.00
0
2000
490.
0015
0.01
306
00.
000
0.00
0
2001
100.
005
0.00
500
00.
000
0.00
0
2002
00.
000
0.00
00
0.00
00.
000
2003
00.
000
0.00
00
0.00
00.
000
2004
00.
000
0.00
00
0.00
00.
000
2005
00.
000
0.00
00
0.00
00.
000
2006
151
0.01
430.
0128
50
0.00
00.
000
2007
203
0.01
930.
0145
80
0.00
00.
000
2008
778
0.04
156
0.02
201
00.
000
0.00
0
2009
596
0.03
141
0.01
237
104
0.01
160.
0015
4
2010
00.
000
0.00
00
0.00
00.
000
(Sou
rce:
ww
w.fa
osta
t.fao
.org
)
Page 237
Indian Institute of Vegetable Research
222
Cucumber & Gherkins
Table 4.82: Area, production and yield of cucumber and gherkins
Years World IndiaArea Production Yield Area Production Yield
(Million ha) (Million t) (t/ha) (000’ha) (000’t) (t/ha)
1961 1.01 9.55 9.4 6 26 51962 1.02 9.37 9.2 6 30 51963 1.01 9.59 9.5 6 32 51964 0.97 9.42 9.7 7 34 51965 0.96 9.31 9.7 7 38 51966 0.96 9.91 10.3 8 40 51967 0.99 10.46 10.6 8 42 51968 0.99 10.89 11.0 8 44 51969 1.00 11.08 11.1 9 46 51970 0.88 10.17 11.6 9 50 61971 0.91 10.56 11.6 9 51 51972 0.92 10.61 11.5 10 53 61973 0.96 11.27 11.8 10 58 61974 0.95 10.98 11.6 10 59 61975 0.98 11.65 11.9 11 61 61976 0.95 11.32 11.9 11 63 61977 0.97 12.30 12.6 11 64 61978 1.04 12.11 11.7 12 69 61979 1.06 13.33 12.6 12 72 61980 1.06 12.76 12.1 12 74 61981 1.09 14.20 13.1 13 81 61982 1.12 14.69 13.2 14 84 61983 1.11 14.56 13.2 14 87 61984 1.10 14.72 13.4 15 91 61985 1.16 15.47 13.3 15 92 61986 1.17 15.82 13.6 15 93 61987 1.17 16.11 13.7 15 94 61988 1.18 15.98 13.6 15 95 61989 1.22 16.17 13.3 15 98 61990 1.20 17.62 14.7 16 102 61991 1.19 17.76 14.9 16 106 61992 1.19 18.46 15.5 17 109 71993 1.31 20.70 15.8 17 111 71994 1.42 22.19 15.7 17 113 71995 1.50 24.02 16.1 17 114 7Contd...
Page 238
Vegetable Statistics
223
Years World IndiaArea Production Yield Area Production Yield
(Million ha) (Million t) (t/ha) (000’ha) (000’t) (t/ha)
1996 1.57 25.78 16.4 17 115 71997 1.68 27.11 16.1 17 116 71998 1.82 28.60 15.7 18 117 71999 1.95 30.79 15.8 18 118 72000 2.05 34.81 17.0 18 119 72001 2.13 36.22 17.0 20 120 62002 2.21 39.35 17.8 19 105 62003 2.28 41.42 18.1 24 120 52004 2.23 42.91 19.2 18 100 62005 1.94 46.40 23.9 19 109 62006 1.91 50.08 26.3 21 125 62007 1.98 54.16 27.3 22 134 62008 1.93 58.63 30.4 23 140 62009 1.99 61.13 30.7 23 141 62010 2.02 62.80 31.1 24 152 62011 2.09 65.33 31.3 25 161 6ACGR for last ten years -1.16 6.26 7.51 2.56 4.94 2.31(2002-2011)
(Source: www.faostat.fao.org)
Table 4.83: Major cucumber &gherkins producing countries in the world (2010-11)
Country Area % share to total Production % share to total Productivity(000’ha) area under (000’t) cucumber & gherkin (t/ha)
cucumber & production ingherkins the world
China 1052.5 53.4 45546.2 73.0 43.3Iran 75.1 3.8 1811.6 2.9 24.1Turkey 59.0 3.0 1739.2 2.8 29.5Russia 66.3 3.4 1161.9 1.9 17.5USA 53.5 2.7 880.5 1.4 16.5Ukraine 51.7 2.6 860.1 1.4 16.6Spain 8.1 0.4 682.9 1.1 84.3Egypt 28.2 1.4 631.4 1.0 22.4Japan 12.1 0.6 587.8 0.9 48.6Indonesia 56.9 2.9 547.1 0.9 9.6others 508.1 25.8 7982.1 12.8 31.2World 1971.6 100.0 62430.8 100.0 31.7
(Source: www.faostat.fao.org)
Page 239
Indian Institute of Vegetable Research
224
Table 4.84: Percent share of area production and productivity of cucumber & gherkin in India
Year Area % of total area Production % of total Productivity(000’ha) under vegetables (000’t) vegetable (t/ha)
production
1991 16 0.41 106 0.57 14.4
1992 17 0.48 109 0.58 14.0
1993 17 0.45 111 0.56 14.0
1994 17 0.49 113 0.56 13.9
1995 17 0.37 114 0.53 14.3
1996 17 0.44 115 0.56 14.5
1997 17 0.49 116 0.63 14.2
1998 18 0.56 117 0.55 11.7
1999 18 0.57 118 0.49 11.2
2000 18 0.44 119 0.48 14.6
2001 20 0.45 120 0.49 14.2
2002 19 0.43 105 0.49 13.4
2003 24 0.45 120 0.49 12.0
2004 18 0.44 100 0.49 13.3
2005 19 0.45 109 0.49 13.4
2006 21 0.44 125 0.49 14.3
2007 22 0.44 134 0.49 14.8
2008 23 0.44 140 0.49 14.9
2009 23 0.46 141 0.50 14.5
2010 24 0.44 152 0.48 15.2
2011 25 0.44 161 0.49 15.6
(Source: www.faostat.fao.org)
Page 240
Vegetable Statistics
225
Tabl
e 4.
85: I
ndia
’s tr
ade
in c
ucum
ber
&gh
erki
ns
(Qua
ntity
in t;
Val
ue in
‘000
US$
; Uni
t val
ue in
US$
/t)
Year
Expo
rtIm
port
Expo
rt%
sha
re in
Expo
rt%
sha
re in
Uni
tIm
port
% s
hare
inIm
port
% s
hare
inU
nit
Qua
ntity
wor
ld e
xpor
tVa
lue
wor
ld e
xpor
tVa
lue
Qua
ntity
wor
ld im
port
Valu
ew
orld
impo
rtVa
lue
1987
10.
001
0.00
1000
00.
000
0.00
019
884
0.00
10.
0025
00
0.00
00.
000
1989
10.
000
0.00
00
0.00
00.
000
1990
00.
000
0.00
00
0.00
00.
000
1991
800.
0141
0.01
513
00.
000
0.00
019
9233
0.00
140.
0042
40
0.00
00.
000
1993
180
0.02
560.
0131
10
0.00
00.
000
1994
1101
0.09
570
0.07
518
00.
000
0.00
019
9550
150.
4020
010.
2139
90
0.00
00.
000
1996
9609
0.74
4057
0.48
422
00.
000
0.00
019
9710
766
0.82
4816
0.64
447
10.
002
0.00
2000
1998
5132
0.37
1720
0.21
335
150.
006
0.00
400
1999
7980
0.56
3245
0.40
407
00.
000
0.00
020
0074
450.
5227
470.
3336
90
0.00
00.
000
2001
2163
81.
4969
760.
8332
20
0.00
00.
000
2002
2785
61.
8197
481.
0735
00
0.00
00.
000
2003
2409
61.
4985
800.
7035
60
0.00
00.
000
2004
7193
0.43
1933
0.15
269
00.
000
0.00
020
0512
990.
0840
20.
0330
90
0.00
00.
000
2006
1043
0.06
327
0.02
314
00.
000
0.00
020
0787
60.
0427
10.
0130
90
0.00
00.
000
2008
3964
0.16
1894
0.09
478
00.
000
0.00
020
0971
40.
0325
50.
0135
70
0.00
00.
000
2010
731
0.03
194
0.01
265
00.
000
0.00
0
(Sou
rce:
ww
w.fa
osta
t.fao
.org
)
Page 241
Indian Institute of Vegetable Research
226
Pumpkin, Squashes & Gourds
Table 4.86: Area, production and yield of pumpkin, squashes and gourds
Years World IndiaArea Production Yield Area Production Yield
(Million ha) (Million t) (t/ha) (000’ha) (000’t) (t/ha)
1961 1.49 6.65 4.5 125 815 71962 1.32 5.69 4.3 133 870 71963 1.57 5.98 3.8 140 940 71964 1.56 5.86 3.8 147 985 71965 1.30 5.58 4.3 150 1000 71966 1.18 6.03 5.1 160 1120 71967 1.05 5.97 5.7 170 1180 71968 0.86 5.93 6.9 175 1220 71969 0.82 5.96 7.3 180 1250 71970 0.76 6.01 7.9 183 1330 71971 0.77 6.28 8.1 190 1380 71972 0.77 6.22 8.1 200 1440 71973 0.75 6.23 8.3 205 1475 71974 0.77 6.55 8.5 210 1550 71975 0.78 6.86 8.8 215 1600 71976 0.79 6.89 8.7 220 1650 81977 0.76 6.89 9.1 225 1690 81978 0.77 7.09 9.3 232 1800 81979 0.78 7.52 9.7 239 1900 81980 0.84 7.96 9.5 245 1960 81981 0.83 8.17 9.8 250 2100 81982 0.89 8.58 9.7 260 2180 81983 0.90 8.93 10.0 265 2250 81984 0.89 9.50 10.6 270 2400 91985 0.93 9.56 10.3 278 2550 91986 0.90 9.94 11.0 283 2630 91987 0.94 10.33 11.0 286 2685 91988 0.90 10.03 11.1 290 2800 101989 0.96 10.33 10.8 300 2850 101990 0.97 10.56 10.9 306 2860 91991 0.96 10.87 11.4 308 2933 101992 1.00 11.55 11.5 310 2950 101993 1.08 13.13 12.2 315 3100 101994 1.12 13.58 12.1 320 3204 101995 1.15 14.14 12.3 330 3150 10
Contd...
Page 242
Vegetable Statistics
227
Years World IndiaArea Production Yield Area Production Yield
(Million ha) (Million t) (t/ha) (000’ha) (000’t) (t/ha)
1996 1.20 15.01 12.5 335 3200 101997 1.24 15.54 12.5 345 3300 101998 1.30 16.04 12.3 350 3350 101999 1.35 16.45 12.2 355 3400 102000 1.45 17.80 12.3 360 3450 102001 1.48 18.20 12.3 398 3500 92002 1.51 18.99 12.6 381 3065 82003 1.66 20.49 12.3 476 3508 72004 1.64 20.66 12.6 358 2909 82005 1.60 20.37 12.7 387 3171 82006 1.59 21.01 13.2 420 3634 92007 1.61 21.54 13.3 435 3905 92008 1.62 21.85 13.5 451 4071 92009 1.77 22.47 12.7 447 4023 92010 1.73 23.07 13.4 481 4456 92011 1.77 24.30 13.7 502 4695 9ACGR for last ten years 1.33 2.27 0.93 2.56 4.94 2.31(2002-2011)
(Source: www.faostat.fao.org)
Table 4.87: Major pumpkin, squash &gourds producing countries in the world (2010-11)
Country Area % share to total Production % share to total Productivity(000’ha) area under pumpkin, (000’t) pumpkin, squash & (t/ha)
squash & gourds gourd production
China 363.2 21.1 6667.0 29.1 18.4India 477.2 27.7 4424.2 19.3 9.3Russia 53.2 3.1 988.6 4.3 18.6USA 37.6 2.2 792.7 3.5 21.1Iran 45.2 2.6 695.6 3.0 15.4Egypt 34.9 2.0 658.2 2.9 18.9Mexico 32.1 1.9 522.4 2.3 16.3Ukraine 24.8 1.4 516.9 2.3 20.8Italy 17.3 1.0 508.1 2.2 29.4Turkey 24.0 1.4 430.4 1.9 17.9others 611.0 35.5 6701.8 29.3 18.6World 1720.5 100.0 22905.9 100.0 13.3
(Source: www.faostat.fao.org)
Page 243
Indian Institute of Vegetable Research
228
Table 4.88: Percent share of area production and productivity of pumpkin, squash & gourds in India
Year Area % of total area Production % of total Productivity(000’ha) under vegetables (000’t) vegetable (t/ha)
production
1991 308 6.33 2933 5.87 9.5
1992 310 7.02 2950 5.85 9.5
1993 315 6.68 3100 5.85 9.8
1994 320 7.18 3204 5.91 10.0
1995 330 5.87 3150 5.57 9.5
1996 335 6.64 3200 5.59 9.6
1997 345 6.97 3300 6.10 9.6
1998 350 6.58 3350 5.25 9.6
1999 355 6.49 3400 4.79 9.6
2000 360 6.58 3450 4.77 9.6
2001 398 6.61 3500 4.44 8.8
2002 381 6.61 3065 4.43 8.0
2003 476 6.63 3508 4.44 7.4
2004 358 6.63 2909 4.44 8.1
2005 387 6.63 3171 4.44 8.2
2006 420 6.63 3634 4.44 8.7
2007 435 6.63 3905 4.44 9.0
2008 451 6.63 4071 4.44 9.0
2009 447 6.62 4023 4.44 9.0
2010 481 6.63 4456 4.44 9.3
2011 502 6.63 4695 4.44 9.4
(Source: www.faostat.fao.org)
Page 244
Vegetable Statistics
229
Tabl
e 4.
89: I
ndia
’s tr
ade
in p
umpk
ins,
squ
ash
and
gour
ds
(Qua
ntity
in t;
val
ue in
‘000
US$
; uni
t val
ue in
US$
/t)
Year
Expo
rtIm
port
Expo
rt%
sha
re in
Expo
rt%
sha
re in
Uni
tIm
port
% s
hare
inIm
port
% s
hare
inU
nit
Qua
ntity
wor
ld e
xpor
tVa
lue
wor
ld e
xpor
tVa
lue
Qua
ntity
wor
ld im
port
Valu
ew
orld
impo
rtVa
lue
2001
00.
000
0.00
05
0.00
190.
0038
00
2002
00.
000
0.00
00
0.00
00.
000
2003
00.
000
0.00
00
0.00
00.
000
2004
00.
000
0.00
00
0.00
00.
000
2005
01.
180
0.00
00
0.00
00.
000
2006
5422
2.01
1404
0.36
259
00.
000
0.00
0
2007
9430
0.66
5087
1.13
539
00.
000
0.00
0
2008
3532
1.02
846
0.16
240
00.
000
0.00
0
2009
5315
0.00
1042
0.20
196
00.
000
0.00
0
2010
00.
000
0.00
00
0.00
00.
000
(Sou
rce:
ww
w.fa
osta
t.fao
.org
)
Page 245
Indian Institute of Vegetable Research
230
Cassava
Table 4.90: Area, production and productivity of cassava
Years World IndiaArea Production Yield Area Production Yield
(Million ha) (Million t) (t/ha) (000’ha) (000’t) (t/ha)
1961 9.62 71.26 7.4 274.00 1969.00 7.21962 9.89 74.64 7.5 265.00 1892.00 7.11963 10.25 77.98 7.6 247.00 1757.00 7.11964 10.43 82.43 7.9 244.00 2823.00 11.61965 10.78 85.58 7.9 240.00 3033.00 12.61966 10.64 84.72 8.0 271.00 3467.00 12.81967 11.05 88.63 8.0 290.00 3817.00 13.21968 11.21 93.09 8.3 347.10 4643.70 13.41969 11.42 95.33 8.3 358.90 4636.10 12.91970 11.62 98.59 8.5 352.60 5214.10 14.81971 11.81 98.76 8.4 345.20 5129.60 14.91972 12.02 101.26 8.4 353.70 6025.90 17.01973 12.45 101.73 8.2 363.20 6371.40 17.51974 12.78 104.37 8.2 368.20 6420.90 17.41975 12.84 110.40 8.6 387.60 6325.90 16.31976 12.88 113.89 8.8 392.00 6638.30 16.91977 13.27 118.61 8.9 385.80 6375.00 16.51978 13.63 123.31 9.0 358.30 5688.30 15.91979 13.30 119.75 9.0 361.50 6050.10 16.71980 13.60 124.13 9.1 351.90 5845.30 16.61981 13.77 127.51 9.3 320.80 5868.10 18.31982 13.98 128.85 9.2 323.20 5292.00 16.41983 13.60 126.89 9.3 301.60 5340.90 17.71984 14.13 133.24 9.4 319.40 5886.20 18.41985 13.83 135.85 9.8 305.30 5662.10 18.51986 13.94 134.23 9.6 275.70 4884.30 17.71987 14.18 138.13 9.7 265.30 4814.40 18.11988 14.65 144.88 9.9 268.40 5416.50 20.21989 15.35 152.89 10.0 249.30 4832.60 19.41990 15.21 152.44 10.0 241.60 4962.00 20.51991 16.33 160.62 9.8 247.40 5416.20 21.91992 16.61 162.07 9.8 250.90 5832.50 23.21993 16.57 163.35 9.9 234.90 5412.80 23.01994 16.80 164.73 9.8 245.80 6028.90 24.51995 16.45 162.27 9.9 231.70 5856.80 25.3
Contd...
Page 246
Vegetable Statistics
231
Years World IndiaArea Production Yield Area Production Yield
(Million ha) (Million t) (t/ha) (000’ha) (000’t) (t/ha)
1996 16.25 158.57 9.8 228.20 5443.20 23.91997 16.05 161.92 10.1 256.10 5662.80 22.11998 16.55 162.77 9.8 264.30 6681.90 25.31999 16.82 169.78 10.1 243.40 5830.00 24.02000 16.97 176.28 10.4 223.50 6014.10 26.92001 17.00 181.92 10.7 253.50 6768.40 26.72002 17.19 184.28 10.7 238.90 6515.90 27.32003 17.68 190.83 10.8 207.00 5426.20 26.22004 18.27 201.11 11.0 220.00 5949.60 27.02005 18.40 205.65 11.2 244.70 7462.80 30.52006 18.61 223.56 12.0 244.60 7854.90 32.12007 18.49 226.42 12.2 255.50 8232.30 32.22008 19.11 232.01 12.1 270.00 9056.00 33.52009 19.05 235.45 12.4 280.20 9623.00 34.32010 18.92 236.71 12.5 231.90 8059.80 34.82011 19.64 252.20 12.8 221.40 8076.00 36.5ACGR for last ten years 1.21 3.39 2.13 1.01 4.8 3.75(2002-2011)
(Source: www.faostat.fao.org)
Table 4.91: Major cassava producing countries in the world (2011)
Country Area % share to total Production % share to total Productivity(000’ha) area under tapioca (000’t) tapioca production (t/ha)
Nigeria 3737 19.02 52404 20.78 14.0
Brazil 1741 8.86 25442 10.09 14.6
Indonesia 1183 6.02 24010 9.52 20.3
Thailand 1135 5.78 21912 8.69 19.3
China 276 1.40 4515 1.79 16.4
India 221 1.13 8076 3.20 36.5
Congo 151 0.77 1150 0.46 7.6
others 11199 57.01 114695 45.48 18.4
World 19644 100.00 252204 100.00 12.8
(Source: www.faostat.fao.org)
Page 247
Indian Institute of Vegetable Research
232
Tabl
e 4.
92: S
tate
-wis
e ar
ea, p
rodu
ctio
n an
d yi
eld
of ta
pioc
a in
Ind
ia f
rom
200
1-02
to 2
010-
11
[Are
a(A
): 00
0’ha
; Pro
duct
ion
(P):
000’
t; Yi
eld
(Y):
t/ha]
Stat
es/U
Ts20
01-0
220
02-0
320
03-0
420
04-0
520
05-0
6A
PY
AP
YA
PY
AP
YA
PY
And
aman
&0.
22.
4-
0.5
0.5
-1
--
1.2
--
--
-N
icob
ar I
slan
ds
And
hra
Prad
esh
17.7
146.
48.
313
.179
.56.
119
122
6.4
18.8
375.
220
15.6
938
8.7
20.5
Ass
am3
144.
82.
813
.54.
82.
913
.64.
72.
713
.14.
82.
7814
4.8
Dam
an &
Diu
--
--
--
--
6.4
--
5.6
--
6.6
Kar
nata
ka0.
97.
28.
90.
96.
97.
71.
212
.210
.21.
111
.610
.51.
1212
10.7
Ker
ala
111.
224
55.9
22.6
110.
325
04.4
22.7
9525
40.8
26.7
104.
424
36.8
23.3
90.5
425
85.1
28.4
Man
ipur
00
00.
2-
--
--
-
Meg
hala
ya4
20.6
5.5
420
.65.
24
20.6
5.2
420
.65.
24.
223
.15.
5
Miz
oram
0.1
1.2
6.7
0.2
1.3
6.5
--
--
--
--
-
Nag
alan
d1.
316
.112
.31.
316
.112
.41.
315
.912
.21.
315
.912
.21.
3315
.911
.9Pu
duch
erry
0.5
15.5
#0.
49.
523
.80.
616
.727
.80.
719
.527
.90.
7619
.546
.6
Raja
stha
n0.
20.
5-
00
--
--
--
--
--
Sikk
im0.
51.
22.
40.
51.
22.
4-
--
--
-0.
37-
4.5
Tam
il N
adu
108
4253
37.6
7327
72.5
22.7
9532
01.4
33.7
110.
645
63.8
41.3
127.
1248
57.4
38.2
Oth
ers
--
--
--
16.
46.
41.
26.
55.
61.
49.
26.
6
Tota
l Ind
ia24
7.6
6934
12.1
220
754
26.2
11.4
322
159
49.6
13.9
246
7463
15.6
245.
379
24.9
16.7
5
Tabl
e co
ntin
ues
Page 248
Vegetable Statistics
233
Stat
es/U
Ts20
06-0
720
07-0
820
08-0
920
09-1
020
10-1
1A
PY
AP
YA
PY
AP
YA
PY
And
aman
&-
--
--
--
--
--
-0.
32.
27.
7N
icob
ar I
slan
ds
And
hra
Prad
esh
15.7
331
4.5
2017
.935
7.5
2017
.935
7.5
2016
.532
9.5
203
60.9
20
Ass
am2.
712
.64.
72.
712
.94.
82.
813
.54.
83.
620
.85.
74.
232
7.6
Dam
an &
Diu
0.02
0.01
0.87
0.02
0.01
0.87
0.02
0.01
0.87
0.02
0.01
0.9
00
0
Kar
nata
ka1.
418
.913
.31
12.8
12.8
113
12.8
113
.112
.80.
912
.313
.4
Ker
ala
87.1
325
1928
.990
.324
92.1
27.6
86.9
2516
.829
74.9
2525
.433
.772
.324
0933
.3
Man
ipur
--
--
--
--
--
Meg
hala
ya4.
223
.35.
54.
323
.55.
54.
926
.45.
44.
926
.45.
44.
926
.45.
4
Miz
oram
--
--
--
--
--
--
--
-
Nag
alan
d0.
98.
99.
51
66.
31
66.
31
66.
31
66
Pudu
cher
ry0.
835
.246
.60.
835
.246
.60.
625
46.6
0.6
2540
.90.
24
25
Raja
stha
n-
--
--
--
--
--
--
--
Sikk
im-
-4.
5-
-4.
5-
--
--
--
--
Tam
il N
adu
137.
252
4638
.215
1.5
6114
.440
.416
5.1
6664
.740
.412
9.4
5113
.639
.513
4.6
5522
.741
Oth
ers
5.32
53.8
610
.13
0.34
1.52
4.45
--
--
--
0.1
0.7
14.6
Tota
l Ind
ia25
5.5
8232
.316
.626
9.9
9055
.915
.828
0.2
9622
.918
.523
1.9
8059
.818
.422
1.5
8076
.217
.4
(Sou
rce:
ww
w.in
dias
tat.c
om)
Page 249
Indian Institute of Vegetable Research
234
Tabl
e 4.
93:M
onth
ly w
hole
sale
pri
ce in
dex
(WPI
) of t
apio
ca in
Indi
a {(B
ase
year
: 198
1-82
; 199
3-94
; 200
4-05
=100
) (A
pril
1990
to D
ecem
ber
1992
and
Sep
tem
ber
1993
to J
uly
2012
)}
Year
Jan.
Feb.
Mar
.A
pr.
May
Jun.
Jul.
Aug
.Se
pt.
Oct
.N
ov.
Dec
.
1981
-82=
100
1990
359.
137
0.1
381.
036
2.5
316.
033
9.2
331.
632
3.1
324.
219
9133
2.8
324.
031
2.8
318.
129
4.0
287.
030
1.4
295.
829
7.3
326.
732
4.1
336.
519
9235
1.4
366.
937
2.4
377.
340
0.3
440.
549
9.6
447.
746
2.1
438.
640
8.8
409.
019
9350
4.1
475.
245
2.4
461.
3
1993
-94=
100
1994
458.
447
7.9
454.
410
2.0
105.
110
8.8
122.
112
1.8
114.
690
.597
.397
.119
9593
.610
0.5
101.
710
3.2
107.
410
6.8
109.
311
2.4
117.
112
0.0
114.
711
6.4
1996
123.
312
5.5
125.
412
5.2
128.
413
2.7
152.
713
8.5
134.
713
4.7
133.
013
3.4
1997
141.
714
8.5
146.
514
7.8
154.
015
8.4
158.
314
1.6
141.
014
6.4
137.
513
6.8
1998
134.
912
2.5
118.
312
2.0
121.
512
7.1
131.
613
5.9
142.
315
7.4
114.
811
3.4
1999
119.
412
2.9
128.
613
8.4
147.
914
8.1
148.
814
8.3
148.
316
6.5
190.
119
9.2
2000
181.
719
2.3
198.
119
8.7
198.
819
8.8
206.
720
6.4
207.
018
4.3
186.
416
3.7
2001
155.
814
4.1
144.
113
5.0
132.
013
3.1
142.
812
8.3
124.
611
4.3
111.
711
2.6
2002
124.
112
2.4
128.
314
0.4
175.
216
5.3
169.
218
8.3
192.
718
7.5
178.
018
0.4
2003
174.
819
2.7
180.
719
4.1
210.
121
6.3
216.
320
7.9
201.
621
2.7
204.
819
7.5
2004
192.
017
5.8
178.
519
4.8
194.
318
5.8
179.
317
8.8
172.
616
8.7
146.
416
1.3
2006
175.
919
4.2
191.
020
2.8
209.
718
9.9
183.
318
3.6
182.
519
8.6
189.
517
6.6
2007
186.
819
8.5
229.
923
4.1
230.
523
0.5
216.
121
6.1
237.
823
7.6
236.
322
4.6
2008
232.
022
7.5
231.
524
8.2
255.
026
8.5
271.
126
4.7
258.
925
4.8
256.
427
6.3
2009
291.
929
8.3
307.
631
7.6
322.
933
1.8
343.
735
7.0
367.
438
2.6
448.
547
6.1
2010
501.
152
0.8
442.
444
1.7
447.
144
4.4
418.
637
5.6
2004
-05=
100
2005
91.0
91.0
90.2
87.3
87.8
91.9
92.4
92.3
93.8
2006
102.
511
4.2
112.
211
9.1
123.
311
0.0
105.
510
5.7
105.
011
4.7
110.
110
2.6
2007
108.
111
4.7
134.
513
6.8
134.
913
4.9
127.
412
7.4
139.
714
0.3
139.
013
1.8
2008
135.
613
2.9
135.
814
5.1
149.
515
8.1
159.
715
5.6
151.
914
9.3
150.
816
3.2
2009
172.
817
6.7
182.
518
8.8
192.
319
7.9
203.
921
4.1
220.
823
0.5
270.
328
7.3
2010
302.
531
4.2
266.
826
6.8
269.
826
7.6
234.
823
7.0
263.
228
0.2
282.
729
8.2
2011
327.
533
4.5
331.
531
9.8
286
282.
130
9.1
329.
633
4.4
315.
228
1.5
281.
120
1225
2.3
212.
322
4.2
240.
924
5.0
238.
622
9.6
(Sou
rce:
ww
w.in
dias
tat.c
om)
Page 250
Vegetable Statistics
235
Sweet Potato
Table 4.94: Area, production and yield of sweet potato
Years World IndiaArea Production Yield Area Production Yield
(Million ha) (Million t) (t/ha) (000’ha) (000’t) (t/ha)
1961 13.36 98.19 7.35 163.00 1261.00 7.741962 13.63 105.29 7.73 138.00 858.00 6.221963 11.97 98.01 8.19 133.00 850.00 6.391964 12.74 93.38 7.33 130.00 855.00 6.581965 11.89 108.38 9.12 155.00 1098.00 7.081966 12.46 119.69 9.61 179.00 991.00 5.541967 11.48 118.61 10.33 206.00 1297.00 6.301968 11.13 118.10 10.61 223.00 1664.00 7.461969 11.51 126.16 10.96 241.55 2042.00 8.451970 11.77 136.51 11.60 215.00 1621.00 7.541971 11.37 127.25 11.19 206.00 1731.00 8.401972 12.07 121.47 10.06 192.00 1538.00 8.011973 12.29 152.87 12.44 199.00 1431.00 7.191974 12.14 137.26 11.31 219.00 1550.00 7.081975 12.03 141.31 11.75 230.50 1658.40 7.191976 11.60 133.32 11.50 251.30 1810.90 7.211977 12.38 143.11 11.56 234.20 1555.30 6.641978 12.74 151.86 11.92 238.00 1588.50 6.671979 11.60 137.94 11.89 219.90 1623.00 7.381980 10.76 137.87 12.81 207.20 1313.10 6.341981 10.10 125.54 12.43 208.50 1501.90 7.201982 9.84 129.43 13.16 224.60 1696.00 7.551983 9.82 137.95 14.05 216.70 1586.90 7.321984 9.29 133.04 14.32 215.70 1585.60 7.351985 8.98 123.00 13.69 192.20 1627.70 8.471986 9.02 120.95 13.41 175.00 1408.00 8.051987 9.13 133.65 14.64 178.30 1490.60 8.361988 9.12 121.96 13.37 162.10 1257.60 7.761989 9.05 123.72 13.66 157.40 1271.00 8.081990 9.16 122.75 13.40 157.10 1251.50 7.971991 9.08 123.73 13.63 152.60 1273.50 8.351992 9.19 123.29 13.41 136.50 1130.70 8.281993 9.18 131.59 14.34 141.40 1215.50 8.601994 8.95 125.57 14.03 143.90 1220.60 8.481995 9.26 136.10 14.70 144.60 1166.10 8.06Contd...
Page 251
Indian Institute of Vegetable Research
236
Years World IndiaArea Production Yield Area Production Yield
(Million ha) (Million t) (t/ha) (000’ha) (000’t) (t/ha)
1996 9.26 142.07 15.34 141.00 1138.10 8.071997 9.17 121.40 13.24 129.90 1102.20 8.491998 9.21 134.74 14.63 120.60 1048.10 8.691999 9.72 147.15 15.14 134.40 1152.40 8.572000 9.79 139.14 14.22 114.00 1110.60 9.742001 9.64 136.18 14.13 114.00 1007.40 8.842002 9.40 136.75 14.54 131.90 1130.30 8.572003 9.18 130.81 14.24 131.90 1130.30 8.572004 9.31 130.68 14.04 133.10 1179.10 8.862005 9.02 128.21 14.21 133.30 1179.40 8.852006 8.12 106.96 13.17 122.80 1066.50 8.682007 8.15 101.16 12.41 122.70 1067.20 8.702008 7.95 104.15 13.10 123.00 1094.00 8.892009 8.19 103.35 12.62 124.30 1119.70 9.012010 8.17 102.51 12.54 118.90 1094.70 9.212011 7.95 104.26 13.11 113.20 1046.60 9.25ACGR for last ten years -2.00 -3.57 -1.60 -1.61 -0.84 0 . 7 8(2002-2011)
(Source: www.faostat.fao.org)
Table 4.95: Major sweet potato producing countries in the world (2010-11)
Country Area % share to total area Production % share to total Productivity(000’ha) under sweet potato (000’t) sweet potato (t/ha)
production
China 3490.93 43.89 75567.93 72.48 21.6
Nigeria 940.00 11.82 2725.00 2.61 2.9
Uganda 531.79 6.69 2554.00 2.45 4.8
Indonesia 177.86 2.24 2192.24 2.10 12.3
Vietnam 148.50 1.87 1390.60 1.33 9.4
India 113.20 1.42 1046.60 1.00 9.2USA 52.49 0.66 1223.07 1.17 23.3
Others 2498.44 31.41 17560.55 16.84 11.9
Total 7953.20 100.00 104259.99 100.00 13.1
(Source: www.faostat.fao.org)
Page 252
Vegetable Statistics
237
Table 4.96: Percent share of area production and productivity of sweet potatoin India
Year Area % of total area Production % of total Productivity(000’ha) under vegetables* (000’t) vegetable (t/ha)
production*
1991 152.6 3.14 1273.5 2.55 8.4
1992 136.5 3.09 1130.7 2.24 8.3
1993 141.4 3.00 1215.5 2.30 8.6
1994 143.9 3.23 1220.6 2.25 8.5
1995 144.6 2.57 1166.1 2.06 8.1
1996 141.0 2.79 1138.1 1.99 8.1
1997 129.9 2.63 1102.2 2.04 8.5
1998 120.6 2.27 1048.1 1.64 8.7
1999 134.4 2.46 1152.4 1.62 8.6
2000 114.0 2.08 1110.6 1.54 9.7
2001 114.0 1.89 1007.4 1.28 8.8
2002 131.9 2.29 1130.3 1.63 8.6
2003 131.9 1.84 1130.3 1.43 8.6
2004 133.1 2.46 1179.1 1.80 8.9
2005 133.3 2.28 1179.4 1.65 8.9
2006 122.8 1.94 1066.5 1.30 8.7
2007 122.7 1.87 1067.2 1.21 8.7
2008 123.0 1.81 1094.0 1.19 8.9
2009 124.3 1.84 1119.7 1.24 9.0
2010 118.9 1.64 1094.7 1.09 9.2
2011 113.2 1.50 1046.6 0.99 9.3
(Source: www.faostat.fao.org)
Page 253
Indian Institute of Vegetable Research
238
Tabl
e 4.
97: S
tate
-wis
e ar
ea (A
), pr
oduc
tion
(P) a
nd y
ield
(Y) o
f sw
eet p
otat
o in
Ind
ia f
rom
200
1-02
to 2
010-
11
(Are
a: 0
00’h
a, P
rodu
ctio
n: 0
00’t
yiel
d: t/
ha)
Stat
es/U
Ts20
01-0
220
02-0
320
03-0
420
04-0
520
05-0
6A
PY
AP
YA
PY
AP
YA
PY
And
aman
&-
--
--
--
-7.
8-
-7.
1-
0.2
-N
icob
ar I
slan
dsA
ndhr
a Pr
ades
h1.
925
.513
.4-
25.5
13.4
--
--
--
-0.
320
Ass
am8.
830
.43.
58.
830
.43.
58.
228
.43.
58
283.
58.
525
.93.
6Bi
har
575
.615
.15
75.6
15.1
4.6
63.9
13.9
4.6
63.9
13.9
-3.
8-
Chh
attis
garh
--
--
--
--
-2.
728
10.4
338
.212
.6G
oa-
--
--
--
--
--
--
--
Guj
arat
--
--
--
--
--
--
--
-H
arya
na-
--
--
--
--
--
--
--
Jhar
khan
d7.
610
313
.67.
610
313
.6-
0-
-0
#-
0-
Kar
nata
ka3.
324
.67.
53.
324
.67.
53.
441
.812
.33.
571
.910
.73.
642
.111
.6K
eral
a-
--
--
--
--
--
--
9-
Mad
hya
Prad
esh
--
--
--
3.8
31-
4.3
34.7
8.1
4.7
256
Mah
aras
htra
4.7
66.7
14.2
4.7
66.7
14.2
570
145
7014
50
-M
anip
ur-
--
--
--
--
--
--
--
Meg
hala
ya-
--
--
--
--
4.9
--
5.4
18.9
3.5
Miz
oram
--
--
--
--
--
--
-0.
9 -
Nag
alan
d-
--
--
--
--
--
--
0.2
-O
dish
a37
.727
2.1
7.2
37.7
272.
17.
247
393.
68.
447
.139
4.3
8.4
47.1
394.
38.
4Pu
njab
--
--
--
--
--
--
--
-Ra
jast
han
--
--
--
--
--
--
-4.
6-
Tam
il N
adu
--
--
--
--
-1.
4-
-1.
429
.621
.1Tr
ipur
a-
--
--
--
--
--
--
8.4
-U
ttar
Prad
esh
22.6
259.
811
.522
.625
9.8
115.
520
240.
812
2024
0.8
12.1
2025
1.5
12.1
Wes
t Ben
gal
2417
27.
224
172
7.2
25.8
190.
57.
426
.119
3.7
7.4
25.8
208
8.1
Oth
ers
16.3
100.
616
.310
0.6
19.9
119.
110
.385
.64.
9-
7.1
Tota
l Ind
ia13
1.9
1130
.310
.413
011
30.3
21.9
137.
711
79.1
9.9
137.
912
10.9
9.56
129.
410
6010
.4
Tabl
e co
ntin
ues
Page 254
Vegetable Statistics
239
Stat
es/U
Ts20
06-0
720
07-0
820
08-0
920
09-1
020
10-1
1A
PY
AP
YA
PY
AP
YA
PY
And
aman
&0.
10.
5-
--
--
--
--
--
--
Nic
obar
Isl
ands
And
hra
Prad
esh
0.7
13.5
19.9
0.7
13.9
200.
713
.920
1.3
26.6
200.
59.
520
.2A
ssam
8.1
28.4
3.5
8.3
293.
58.
731
.53.
68.
934
.33.
99.
135
.13.
9Bi
har
0.2
4.4
--
--
0.3
--
0.4
--
--
-C
hhat
tisga
rh3.
949
.412
.73.
732
.68.
83.
833
.38.
83.
632
.48.
93.
736
.79.
9G
oa0
0-
--
--
--
0-
--
--
Guj
arat
00
--
--
--
-0
--
--
-H
arya
na-
--
--
--
--
--
--
--
Jhar
khan
d-
--
--
--
--
--
--
--
Kar
nata
ka3.
739
.112
.62.
834
.112
.32.
834
.812
.32.
430
.912
.92.
635
.512
.8K
eral
a0.
56.
4-
--
--
--
0.5
--
--
-M
adhy
a Pr
ades
h4.
123
5.6
4.2
23.3
5.5
4.6
25.7
5.5
4.5
265.
85.
129
.75.
8M
ahar
asht
ra0
0-
--
--
--
0-
--
--
Man
ipur
00
--
--
--
-0
--
--
-M
egha
laya
5.3
193.
65.
419
.53.
65.
519
.23.
55.
519
.23.
55.
519
.23.
5M
izor
am-
--
--
--
--
--
--
--
Nag
alan
d0.
10.
2-
--
-0.
1-
-0.
1-
--
--
Odi
sha
47.2
403.
88.
647
.240
4.1
8.6
49.2
417
8.5
50.7
438.
88.
741
.141
0.2
9.3
Punj
ab-
--
--
--
--
--
--
--
Raja
stha
n1.
65.
2-
--
-1.
5-
-2.
2-
--
--
Tam
il N
adu
1.5
31.9
21.3
1.2
20.5
17.1
1.3
22.4
16.8
0.8
11.5
14.8
0.8
12.4
15.5
Trip
ura
--
--
--
--
--
--
--
-U
ttar
Prad
esh
2024
0.8
11.5
22.3
259.
911
.722
.727
312
16.8
227.
913
.616
.820
6.6
12.3
Wes
t Ben
gal
-20
88.
123
.323
5.9
10.1
22.5
231.
110
.322
.523
1.1
10.3
22.9
235.
710
.3O
ther
s-
-6.
53.
521
.56.
12.
417
.77.
32.
116
7.6
2.1
188.
4To
tal I
ndia
9710
73.6
10.4
122.
610
94.3
9.75
126.
111
19.6
9.9
122.
310
94.7
10.0
110.
210
48.6
10.1
7
(Sou
rce:
ww
w.in
dias
tat.c
om)
Page 255
Indian Institute of Vegetable Research
240
Tabl
e 4.
98:
Mon
thly
who
le s
ale
pric
e in
dex
(WPI
) of
swee
t pot
ato
in I
ndia
{(Ba
se y
ear:
1981
-82;
199
3-94
; 200
4-05
=100
) (A
pril
1990
toD
ecem
ber
1992
and
Sep
tem
ber
1993
to J
uly
2012
)}
Year
Jan.
Feb.
Mar
.A
pr.
May
Jun.
Jul.
Aug
.Se
pt.
Oct
.N
ov.
Dec
.
1981
-82=
100
1990
161.
416
9.3
227.
024
4.4
278.
022
3.9
163.
415
7.5
149.
619
9119
0.8
228.
219
6.7
200.
619
8.7
280.
232
6.6
311.
724
4.1
189.
014
0.6
124.
119
9213
6.3
211.
425
2.4
260.
326
8.2
352.
940
0.2
378.
535
8.8
253.
918
7.3
199.
219
9333
9.1
293.
417
7.4
185.
3
1993
-94=
100
1994
231.
927
4.0
281.
995
.314
0.6
139.
811
9.6
191.
318
4.3
128.
811
3.4
104.
219
9514
3.4
187.
018
9.7
165.
514
8.7
153.
315
8.2
168.
821
9.2
217.
720
0.8
124.
219
9613
2.3
153.
315
9.5
161.
016
1.0
161.
016
1.0
161.
016
1.0
178.
318
4.0
184.
019
9718
4.0
184.
018
4.0
184.
018
4.0
184.
018
4.0
184.
018
4.0
184.
018
4.0
184.
019
9818
4.0
184.
016
5.6
165.
618
0.3
153.
318
4.0
184.
018
4.0
184.
021
4.6
214.
619
9921
4.6
207.
021
4.6
214.
621
4.6
214.
621
7.7
241.
429
1.3
275.
926
0.6
184.
020
0015
3.3
153.
315
3.3
156.
417
4.8
168.
718
2.7
226.
927
9.6
261.
420
6.9
190.
120
0121
8.4
233.
823
6.7
223.
119
6.3
203.
618
4.0
171.
720
6.0
214.
622
6.9
222.
020
0217
9.4
197.
821
0.9
189.
318
4.0
208.
524
5.3
218.
325
6.8
245.
323
5.5
222.
320
0323
7.6
245.
325
5.1
233.
022
5.7
306.
620
3.1
209.
127
3.6
291.
325
6.3
256.
820
0426
3.1
262.
928
2.8
272.
126
7.3
252.
221
8.9
219.
226
0.6
286.
429
3.6
258.
320
0631
6.6
313.
532
2.7
326.
230
7.3
325.
029
1.3
345.
039
8.6
429.
247
5.2
441.
520
0739
5.5
371.
736
7.9
345.
735
1.9
343.
435
8.4
384.
838
2.4
439.
242
3.9
451.
320
0832
3.5
316.
533
3.0
317.
330
0.5
296.
630
7.4
372.
943
9.2
446.
943
5.4
433.
120
0939
8.6
398.
639
8.6
398.
639
8.6
398.
639
8.6
398.
639
8.6
398.
639
8.6
613.
220
1061
3.2
613.
261
3.2
613.
261
3.2
613.
247
5.2
383.
2
2004
-05=
100
2005
94.4
76.8
77.7
82.4
95.8
116.
016
8.6
162.
612
7.2
2006
124.
412
3.2
126.
812
8.2
120.
812
7.7
114.
413
5.5
156.
616
8.6
186.
717
3.4
2007
155.
414
6.0
144.
513
5.8
138.
213
4.9
140.
815
1.2
150.
217
2.5
166.
517
7.3
2008
127.
112
4.4
130.
812
4.7
118
116.
512
0.7
146.
517
2.6
175.
617
1.1
170.
220
0915
6.6
156.
615
6.6
156.
615
6.6
156.
615
6.6
156.
615
6.6
156.
615
6.6
240.
920
1024
0.9
240.
924
0.9
240.
924
0.9
240.
916
8.7
150.
615
0.6
150.
615
0.6
150.
620
1120
3.6
228.
825
2.9
277.
027
7.0
277.
018
7.2
183.
718
6.7
203.
819
8.7
140.
720
1215
6.6
174.
720
8.6
192.
719
5.7
181.
219
5.7
(Sou
rce:
ww
w.In
dias
tat.c
om)
Page 256
Vegetable Statistics
241
Tabl
e 4.
99: I
ndia
’s tr
ade
in s
wee
t pot
ato
(Qua
ntity
in t;
val
ue in
‘000
US$
; uni
t val
ue in
US$
/t)
Year
Expo
rtIm
port
Expo
rt%
sha
re in
Expo
rt%
sha
re in
Uni
tIm
port
% s
hare
inIm
port
% s
hare
inU
nit
Qua
ntity
wor
ld e
xpor
tVa
lue
wor
ld e
xpor
tVa
lue
Qua
ntity
wor
ld im
port
Valu
ew
orld
impo
rtVa
lue
1961
180.
251
0.15
560
0.00
00.
000
1962
50.
060
0.00
00
0.00
00.
000
1963
30.
050
0.00
00
0.00
00.
000
1964
380.
634
0.72
105
00.
000
0.00
0
1965
70.
131
0.27
143
00.
000
0.00
0
1966
00.
000
0.00
00
0.00
00.
000
1967
00.
000
0.00
00
0.00
00.
000
1968
00.
000
0.00
00
0.00
00.
000
1969
00.
000
0.00
00
0.00
00.
000
1970
00.
000
0.00
00
0.00
00.
000
1971
00.
000
0.00
00
0.00
00.
000
1972
00.
000
0.00
00
0.00
00.
000
1973
00.
000
0.00
00
0.00
00.
000
1974
00.
000
0.00
00
0.00
00.
000
1975
00.
000
0.00
00
0.00
00.
000
1976
00.
000
0.00
00
0.00
00.
000
1977
120.
063
0.07
250
00.
000
0.00
0
1978
00.
000
0.00
00
0.00
00.
000
1979
228
0.89
380.
5816
70
0.00
00.
000
1980
00.
000
0.00
00
0.00
00.
000
1981
467
1.39
540.
7111
60
0.00
00.
000
1982
880.
1212
0.14
136
00.
000
0.00
0
1983
161
0.10
170.
1910
60
0.00
00.
000
1984
890.
0717
0.16
191
00.
000
0.00
0
Con
td...
Page 257
Indian Institute of Vegetable Research
242
Year
Expo
rtIm
port
Expo
rt%
sha
re in
Expo
rt%
sha
re in
Uni
tIm
port
% s
hare
inIm
port
% s
hare
inU
nit
Qua
ntity
wor
ld e
xpor
tVa
lue
wor
ld e
xpor
tVa
lue
Qua
ntity
wor
ld im
port
Valu
ew
orld
impo
rtVa
lue
1985
400.
018
0.02
200
00.
000
0.00
019
8614
0.00
50.
0135
70
0.00
00.
000
1987
00.
000
0.00
00
0.00
00.
000
1988
00.
000
0.00
00
0.00
00.
000
1989
120.
005
0.01
417
00.
000
0.00
0
1990
10.
000
0.00
00
0.00
00.
000
1991
390.
0010
0.01
256
00.
000
0.00
0
1992
00.
000
0.00
00
0.00
00.
000
1993
00.
000
0.00
00
0.00
00.
000
1994
00.
000
0.00
00
0.00
00.
000
1995
00.
000
0.00
00
0.00
00.
000
1996
178
0.27
620.
2434
80
0.00
00.
000
1997
00.
000
0.00
00
0.00
00.
000
1998
120.
023
0.01
250
00.
000
0.00
0
1999
140.
027
0.02
500
00.
000
0.00
0
2000
144
0.17
500.
1334
70
0.00
00.
000
2001
119
0.14
290.
0724
40
0.00
00.
000
2002
860.
0921
0.05
244
00.
000
0.00
0
2003
196
0.21
340.
0617
368
0.07
40.
0159
2004
110
0.10
190.
0317
30
0.00
00.
000
2005
571
0.45
119
0.15
208
00.
000
0.00
0
2006
533
0.39
106
0.12
199
00.
000
0.00
0
2007
347
0.23
860.
0824
80
0.00
00.
000
2008
879
0.47
188
0.16
214
00.
000
0.00
0
2009
534
0.28
116
0.09
217
00.
000
0.00
020
1067
50.
3316
30.
1124
10
0.00
00.
000
(Sou
rce:
ww
w.fa
osta
t.fao
.org
)
Page 258
Vegetable Statistics
243
Tabl
e 4.
100:
Ind
ia’s
trad
e in
roo
ts a
nd tu
bers
(Qua
ntity
in t;
val
ue in
‘000
US$
; uni
t val
ue in
US$
/t)
Year
Expo
rtIm
port
Expo
rt%
sha
re in
Expo
rt%
sha
re in
Uni
tIm
port
% s
hare
inIm
port
% s
hare
inU
nit
Qua
ntity
wor
ld e
xpor
tVa
lue
wor
ld e
xpor
tVa
lue
Qua
ntity
wor
ld im
port
Valu
ew
orld
impo
rtVa
lue
1962
00.
000
0.00
014
0.05
161.
3311
4319
630
0.00
00.
000
10.
002
0.15
2000
1964
00.
000
0.00
00
0.00
00.
000
1965
00.
000
0.00
01
0.00
10.
0510
0019
660
0.00
00.
000
380.
1671
3.73
1868
1967
70.
051
0.07
143
20.
011
0.05
500
1968
240.
153
0.18
125
00.
000
0.00
019
6910
0.11
10.
0610
00
0.00
00.
000
1970
120.
171
0.05
831
0.00
10.
0310
0019
719
0.06
20.
1022
20
0.00
00.
000
1972
430.
198
0.34
186
00.
000
0.00
019
7317
60.
6113
0.20
740
0.00
00.
000
1974
00.
000
0.00
00
0.00
00.
000
1975
40.
011
0.01
250
00.
000
0.00
019
760
0.00
00.
000
00.
000
0.00
019
7725
0.08
90.
0836
04
0.01
100.
0925
0019
7830
0.09
160.
0753
320
50.
3388
0.78
429
1979
170.
0517
0.09
1000
1010
1.87
434
3.23
430
1980
120.
045
0.04
417
1001
1.85
248
1.68
248
1981
220.
0512
0.07
545
3151
3.51
956
4.35
303
1982
870.
2049
0.32
563
1289
1.75
401
2.17
311
1983
410.
1025
0.15
610
10.
000
0.00
019
8439
0.06
280.
1271
817
90.
4476
0.62
425
1985
210
0.27
880.
2941
90
0.00
00.
000
1986
148
0.19
540.
1836
50
0.00
00.
000
Con
td...
Page 259
Indian Institute of Vegetable Research
244
Year
Expo
rtIm
port
Expo
rt%
sha
re in
Expo
rt%
sha
re in
Uni
tIm
port
% s
hare
inIm
port
% s
hare
inU
nit
Qua
ntity
wor
ld e
xpor
tVa
lue
wor
ld e
xpor
tVa
lue
Qua
ntity
wor
ld im
port
Valu
ew
orld
impo
rtVa
lue
1987
220
0.23
860.
2939
119
0.04
400.
2721
0519
8824
90.
2597
0.22
390
180.
0212
0.03
667
1989
208
0.32
132
0.38
635
00.
000
0.00
0
1990
157
0.26
730.
2046
50
0.00
00.
000
1991
522
0.74
175
0.38
335
00.
000
0.00
0
1992
294
0.39
100
0.26
340
00.
000
0.00
0
1993
170
0.25
101
0.30
594
00.
000
0.00
0
1994
487
0.91
160
0.44
329
00.
000
0.00
0
1995
2546
3.90
796
1.90
313
10.
0014
0.02
1400
0
1996
647
0.90
214
0.44
331
10.
004
0.00
4000
1997
1738
2.20
517
0.88
297
10.
003
0.00
3000
1998
572
0.86
264
0.56
462
60.
0111
0.02
1833
1999
612
0.77
464
1.19
758
30.
003
0.00
1000
2000
535
0.65
147
0.38
275
480.
0423
0.03
479
2001
667
0.67
216
0.42
324
150.
0117
0.02
1133
2002
433
0.53
159
0.30
367
220.
0211
0.01
500
2003
2467
2.44
642
1.00
260
10.
004
0.01
4000
2004
1017
0.97
519
0.75
510
120.
0117
0.02
1417
2005
461
0.39
217
0.28
471
200.
0119
0.02
950
2006
546
0.48
371
0.57
679
00.
000
0.00
0
2007
583
0.53
268
0.38
460
170.
0127
0.02
1588
2008
1703
1.08
1123
0.94
659
230.
0239
0.02
1696
2009
1850
1.12
978
0.72
529
150.
0118
0.01
1200
2010
1630
1.00
876
0.73
537
40.
0033
0.02
8250
(Sou
rce:
ww
w.fa
osta
t.fao
.org
)
Page 260
Vegetable Statistics
245
Chilli
Table 4.101: Area, production and yield of chilli and pepper green
Years World IndiaArea Production Yield Area Production Yield
(Million ha) (Million t) (t/ha) (000’ha) (000’t) (t/ha)
1961 0.7 5.9 9.0 2.9 17.0 6.01962 0.6 5.2 8.8 2.9 17.2 6.01963 0.6 5.3 8.9 2.9 17.3 6.01964 0.6 5.1 8.7 3.1 19.0 6.11965 0.6 5.2 8.5 3.2 19.2 6.01966 0.6 5.6 8.7 3.2 19.8 6.21967 0.7 5.9 8.9 3.3 20.2 6.21968 0.7 6.0 9.1 3.3 20.2 6.21969 0.7 6.1 9.0 3.3 20.8 6.41970 0.6 5.5 8.6 3.3 20.9 6.41971 0.7 6.0 8.8 3.3 21.0 6.41972 0.7 6.2 8.4 3.3 21.4 6.51973 0.8 6.7 8.6 3.4 22.5 6.61974 0.8 6.7 8.7 3.5 23.4 6.71975 0.8 6.6 8.3 3.6 24.1 6.71976 0.8 6.8 8.1 3.6 24.3 6.71977 0.8 7.4 8.7 3.6 25.4 7.01978 0.9 7.5 8.7 3.7 25.6 7.01979 0.9 7.8 8.8 3.7 27.0 7.31980 0.9 7.7 8.4 3.9 28.5 7.31981 0.9 8.0 8.5 3.9 28.6 7.31982 1.0 8.2 8.3 4.0 30.8 7.71983 0.9 8.5 9.1 4.1 31.6 7.71984 1.0 8.9 8.6 4.2 34.5 8.21985 1.1 9.6 8.6 4.4 36.0 8.21986 1.2 9.9 8.4 4.5 37.8 8.41987 1.1 10.2 9.3 4.6 39.0 8.51988 1.1 10.3 9.2 4.7 41.4 8.81989 1.1 10.6 9.4 4.7 41.5 8.81990 1.1 10.9 10.1 4.8 42.0 8.81991 1.1 11.1 10.2 4.8 42.2 8.81992 1.1 11.5 10.3 4.8 43.0 9.01993 1.2 12.3 10.1 4.8 43.5 9.01994 1.2 13.0 10.5 4.9 44.0 9.01995 1.3 15.2 11.8 5.0 45.5 9.11996 1.4 16.4 12.0 5.2 47.0 9.01997 1.4 17.3 12.3 5.3 48.0 9.11998 1.5 18.5 12.2 5.4 49.0 9.11999 1.6 19.4 12.2 5.7 55.0 9.72000 1.7 20.8 12.5 5.5 50.0 9.12001 1.6 21.3 13.0 6.1 50.5 8.32002 1.7 22.4 13.1 5.8 44.2 7.62003 1.7 24.2 14.0 7.3 50.6 7.02004 1.6 24.6 15.1 5.5 42.0 7.72005 1.8 25.3 14.3 5.9 45.8 7.7Contd...
Page 261
Indian Institute of Vegetable Research
246
Table 4.103: State-wise area, production and yield of chillies in India (2008-2009)
State Area (ha) Production (t) Yield (t/ha)
Andhra Pradesh 171450 537710 3.14Assam 14690 9490 0.65Arunachal Pradesh 2168 2646 1.22Bihar 3093 3089 1.00Gujarat 31650 37840 1.20Himachal Pradesh 740 200 0.27Karnataka 69880 94500 1.35Madhya Pradesh 46660 42480 0.91Maharashtra 99300 51214 0.52Manipur 6490 3890 0.60Odisha 75120 63290 0.84Punjab 9882 15888 1.61Rajasthan 17720 17530 0.99Tamil Nadu 49033 31830 0.65West Bengal 51957 60727 1.17Total 649833 972324 1.50
(Source: www.agropedia.iitk.ac.in)
Table 4.102: Major chilli and pepper green producing countries in the world (2010-11)
Country Area % share to total Production % share to total Productivity(000’ha) area under chilli (000’t) chilli and pepper (t/ha)
and pepper green green production
China 707 37.26 15546 51.92 22.0Mexico 144 7.61 2132 7.12 14.8Turkey 94 4.94 1975 6.60 21.1Indonesia 240 12.63 1483 4.95 6.2USA 31 1.63 1018 3.40 33.0Spain 17 0.89 898 3.00 53.2Egypt 40 2.09 670 2.24 16.9Others 625 32.95 6216 20.76 23.9World 1898 100.00 29939 100.00 15.8
(Source: www.faostat.fao.org)
Years World IndiaArea Production Yield Area Production Yield
(Million ha) (Million t) (t/ha) (000’ha) (000’t) (t/ha)
2006 1.8 26.6 15.0 6.4 51.0 7.92007 1.8 27.5 15.4 6.6 54.8 8.22008 1.8 28.1 15.7 6.9 57.1 8.32009 1.9 29.0 15.4 6.8 56.5 8.32010 1.9 29.4 15.5 7.4 62.5 8.52011 1.9 29.9 15.8 7.7 65.9 8.6ACGR for last ten years 1.45 3.16 1.69 2.56 4.52 1.9(2002-2011)
Chilli and pepper green include Capsicum annuum; C. fructescens; Pimenta officinalis. Production data exclude cropscultivated explicitly as spices. In contrast, trade data include these crops, provided they are fresh, uncrushed andunground.(Source: www.faostat.fao.org)
Page 262
Vegetable Statistics
247
Tabl
e 4.
104:
Ind
ia’s
trad
e in
chi
lli a
nd p
eppe
r gr
een
(Qua
ntity
in t;
val
ue in
‘000
US$
; uni
t val
ue in
US$
/t)
Year
Expo
rtIm
port
Expo
rt%
sha
re in
Expo
rt%
sha
re in
Uni
tIm
port
% s
hare
inIm
port
% s
hare
inU
nit
Qua
ntity
wor
ld e
xpor
tVa
lue
wor
ld e
xpor
tVa
lue
Qua
ntity
wor
ld im
port
Valu
ew
orld
impo
rtVa
lue
1990
510.
0137
0.00
725
00.
000
0.00
0
1991
101
0.01
320.
0031
70
0.00
00.
000
1992
124
0.02
530.
0142
70
0.00
00.
000
1993
293
0.03
131
0.01
447
00.
000
0.00
019
9411
70.
0154
0.00
462
00.
000
0.00
0
1995
192
0.02
103
0.01
536
00.
000
0.00
0
1996
1316
0.11
677
0.05
514
00.
000
0.00
0
1997
1116
0.10
418
0.03
375
00.
002
0.00
0
1998
407
0.03
162
0.01
398
280.
0014
0.00
500
1999
1566
0.12
606
0.04
387
00.
000
0.00
0
2000
3579
0.27
1507
0.09
421
00.
000
0.00
0
2001
3124
0.22
1821
0.11
583
00.
000
0.00
0
2002
3792
0.24
2298
0.13
606
00.
000
0.00
0
2003
4404
0.26
2334
0.10
530
20.
003
0.00
1500
2004
7903
0.44
2088
0.07
264
00.
000
0.00
0
2005
9831
0.50
3964
0.14
403
00.
000
0.00
020
0619
830
0.97
5985
0.21
302
00.
000
0.00
0
2007
2775
71.
3111
108
0.30
400
00.
000
0.00
0
2008
3074
31.
3211
471
0.28
373
00.
000
0.00
0
2009
3095
91.
2413
185
0.37
426
250.
0036
0.00
1440
2010
3069
61.
1613
260
0.32
432
400.
0013
60.
0034
00
(Sou
rce:
ww
w.fa
osta
t.fao
.org
)
Page 263
Indian Institute of Vegetable Research
248
Table 4.105: Major destinations of green chilli exports from India
(Qty in Tonnes, Value in Lakhs `)
Country 2008-09 2009-10 2010-11Quantity Value Quantity Value Quantity Value
UAE 25286.97 (83) 5231.19 (85) 24103.06 (85) 5173.71 (85) 32837.11 (71) 6793.05 (70)
Bangladesh 535.92 (2) 61.55 (1) 152.78 (1) 34.81 (1) 4014.56 (9) 906.36 (9)
Pakistan 867.01 (3) 77.71 (1) 69.99 (0) 31.27 (1) 4315.13 (9) 847.08 (9)
Saudi Arabia 264.45 (1) 53.32 (1) 541.07 (2) 140.81 (2) 949.40 (2) 400.19 (4)
UK 1358.88 (4) 391.20 (6) 1204.08 (4) 278.70 (5) 1825.49 (4) 331.54 (3)
Bahrain 903.24 (3) 128.43 (2) 711.01 (3) 107.99 (2) 599.04 (1) 132.32 (1)
Qatar 182.90 (1) 39.16 (1) 200.05 (1) 51.58 (1) 505.72 (1) 122.39 (1)
Nepal 519.10 (2) 46.49 (1) 527.89 (2) 49.34 (1) 874.77 (2) 94.36 (1)
Oman 199.75 (1) 29.00 (0) 147.11 (1) 30.25 (0) 183.59 (0) 40.92 (0)
Maldives 61.44 (0) 24.50 (0) 90.51 (0) 27.23 (0) 123.97 (0) 31.79 (0)
Kuwait 77.60 (0) 11.13 (0) 540.86 (2) 140.46 (2) 152.17 (0) 28.32 (0)
US 49.57 (0) 25.31 (0) 33.87 (0) 15.04 (0) 115.65 (0) 24.89 (0)
Total 31002.49 (100) 6455.15 (100) 28561.04 (100) 6163.39 (100) 46909.36 (100) 9895.21 (100)
(Source:www.apeda.gov.in)(Figures in parenthesis give Percentage to the total exports)
Page 264
Vegetable Statistics
249
Tabl
e 4.
106:
Ave
rage
who
le s
ale
pric
e (W
SP),
reta
il pr
ice
(RP)
and
tota
l arr
ival
of
gree
n ch
illi,
2012
(Pri
ce in
`/q
and
arr
ival
in to
nes)
Cen
tre
Janu
ary
Febr
uary
Mar
chA
pril
May
June
Avg
.A
vg.
Tota
lA
vg.
Avg
.To
tal
Avg
.A
vg.
Tota
lA
vg.
Avg
.To
tal
Avg
.A
vg.
Tota
lA
vg.
Avg
.To
tal
WSP
RP
Arr
ival
WSP
RP
Arr
ival
WSP
RP
Arr
ival
WSP
RP
Arr
ival
WSP
RP
Arr
ival
WSP
RP
Arr
ival
Abo
har
1461
2417
3513
6822
7349
1372
2278
4316
3725
2948
1750
2617
6816
3225
6560
Agr
a17
5525
5216
417
4325
4530
420
4831
3627
417
6634
3624
316
7930
7729
519
3834
5841
8A
hmed
abad
1197
2160
1855
1305
2313
1789
1291
2192
1931
1513
2522
1526
1377
2271
1587
1946
2895
1237
Am
rits
ar17
8839
6035
521
6147
6325
323
4845
6529
717
0239
7631
614
1433
7545
725
4761
1122
0Ba
ngal
ore
1477
2560
386
1692
2828
468
1970
3143
340
2494
4021
334
2311
3889
203
2508
4462
271
Bara
ut32
9838
2052
3515
4004
4634
9139
9348
3509
4014
3532
5037
9079
3830
4452
41Bh
opal
1290
1596
816
1385
1692
851
1465
1870
750
1866
2286
620
1935
2331
634
2256
2742
723
Bhub
anes
war
3003
3825
9120
3326
3820
315
9520
1824
817
2622
0011
120
8228
4110
757
8073
9161
Cha
ndig
arh
2240
3552
579
2478
3791
426
2402
4096
477
2689
4570
338
2646
4077
619
2801
5119
457
Che
nnai
1565
2541
1774
1383
2517
1332
1566
2376
1375
2083
2958
1149
1785
2608
1782
2608
3588
1195
Deh
radu
n19
8827
5038
2260
3136
4123
5133
8027
2427
3523
3122
4030
5919
038
8553
7528
Del
hi18
9433
3111
982
2190
3633
1301
823
1438
5015
422
2488
4322
6895
2041
4022
4507
3548
5231
3013
Gan
gato
k21
8927
8727
2083
2558
2925
9229
8112
3226
3739
2433
5638
6712
2993
3683
23G
uwah
ati
1730
2500
474
1588
2367
486
1960
2731
461
2125
2915
286
2382
3184
349
3256
4379
491
Hyd
erab
ad78
512
8329
3689
541
9028
8813
0518
6247
9313
1617
8059
2710
8415
2470
5518
9224
7232
24Ja
ipur
1083
1874
2346
1130
1946
2662
1523
2742
2789
1616
2961
1887
1776
3311
617
1616
2960
489
Jam
mu
1938
2644
284
2134
3104
264
2386
3227
244
2600
3404
167
1975
2865
160
3313
4277
113
Kan
pur
00
00
00
00
00
00
00
042
1358
1320
Kol
kata
2891
5469
1633
2582
4949
2700
2401
4725
6625
2541
4655
1012
2654
4858
973
5000
1228
883
5Lu
ckno
w14
5827
6826
524
4040
5816
421
0434
4618
726
3443
6816
121
2834
4432
737
6559
1213
3M
umba
i17
8130
0050
7619
3130
0068
5219
4830
0044
9724
5938
1832
1717
4540
0036
1729
6346
6748
88N
agpu
r11
1020
2958
013
8920
4239
514
6321
2281
018
9227
9439
122
6529
8363
031
2438
2459
9N
asik
2180
2481
2723
8626
6222
2282
2574
2724
7427
9226
2387
2710
2922
7026
4830
Patn
a21
7746
7664
521
2542
9666
518
8438
9063
016
1935
0847
016
8235
4257
736
6957
4437
7Pi
mal
gaon
00
00
00
2410
2700
10
00
00
00
00
Pune
1476
1795
837
2063
2475
1310
2062
2538
820
2418
2917
648
1563
1968
302
2161
2653
525
Raip
ur15
5624
9682
1595
2945
7714
4628
1586
1621
2671
6420
3232
3263
2800
4265
49Ra
nchi
2155
4279
679
2059
3975
765
2071
4000
667
1992
3738
627
2034
3963
781
4285
6588
514
Shim
la40
1752
9255
3985
4813
101
2887
4115
130
4895
6286
8042
7760
0011
346
7761
1511
7Sr
inag
ar24
2037
0015
2458
4000
1327
6545
1534
2383
4000
2324
2538
5730
3932
5068
22Su
rat
1906
3052
444
2181
3108
424
2081
2985
739
2323
3230
488
1640
2529
742
2772
4108
378
Triv
andr
um21
0828
7530
1629
2243
128
1565
2152
161
1964
2743
9518
2424
2087
2304
2938
53
Tabl
e co
ntin
ues
Page 265
Indian Institute of Vegetable Research
250
Cen
tre
July
Aug
ust
Sept
embe
rO
ctob
erN
ovem
ber
Dec
embe
rA
vg.
Avg
.To
tal
Avg
.A
vg.
Tota
lA
vg.
Avg
.To
tal
Avg
.A
vg.
Tota
lA
vg.
Avg
.To
tal
Avg
.A
vg.
Tota
lW
SPR
PA
rriv
alW
SPR
PA
rriv
alW
SPR
PA
rriv
alW
SPR
PA
rriv
alW
SPR
PA
rriv
alW
SPR
PA
rriv
al
Abo
har
1910
3095
4518
8329
2551
1720
2718
7015
8725
7974
1559
2500
6113
3421
2410
4A
gra
2171
3500
533
2086
3227
358
1654
2879
710
1567
3043
951
1208
2313
1246
1059
2000
1109
Ahm
edab
ad18
8931
2215
5115
9028
5013
7410
6422
8696
378
020
0016
4469
319
2712
2568
516
0013
32A
mri
tsar
2326
5759
294
1533
3161
280
1524
3214
277
1640
3786
324
1122
2391
424
947
2000
326
Bang
alor
e39
3062
2025
622
5042
0833
921
9838
8127
820
0940
0034
419
1534
3827
219
2735
6827
7Ba
raut
4702
5524
2532
5839
2328
3122
3848
2630
8337
6327
2667
3325
4023
9829
8033
Bhop
al28
7934
5071
223
1729
2262
192
912
1395
991
712
0080
311
8015
1277
898
812
7912
62Bh
uban
esw
ar48
1759
3675
2221
2862
8923
2831
9313
028
7636
9510
026
0335
3012
623
3829
3314
3C
hand
igar
h25
5443
7756
120
5137
2565
922
9739
0867
624
1442
7168
123
0939
0068
921
9737
2965
7C
henn
ai22
6532
5411
9814
9223
8311
9014
0422
1611
8513
3521
2212
2412
3519
7511
9610
3518
9495
3D
ehra
dun
4088
6130
3722
5438
7576
1941
3479
7626
4843
6477
2500
4304
8916
7926
8878
Del
hi37
6554
3471
9616
7745
6046
8314
3137
6667
4818
0937
7775
3313
3135
7199
0611
4929
6912
687
Gan
gato
k83
0811
500
1058
5478
5425
4784
6320
3346
4261
0043
2408
3242
3825
0037
4452
Guw
ahat
i72
1110
537
388
4613
6840
471
5069
7271
262
4100
5008
348
3274
4157
403
2463
3188
521
Hyd
erab
ad17
1523
0412
9210
1716
1720
3290
816
1719
0295
515
8114
9912
3319
5715
5910
0515
8623
58Ja
ipur
1886
3540
366
1542
2935
942
990
1687
3822
1059
1813
2990
974
1674
1717
882
1463
1793
Jam
mu
3079
3936
139
1602
2550
179
1915
2729
130
1835
2771
155
1215
2004
264
1248
2136
199
Kan
pur
5150
7167
115
3445
5200
6128
0045
009
00
065
015
0030
00
0K
olka
ta48
3578
4212
6625
2651
0736
5928
0061
4694
822
7150
5239
4417
6838
0821
1718
6041
2810
36Lu
ckno
w43
9270
1920
525
0238
6718
422
3941
6017
615
1623
6133
066
013
8652
960
310
7653
5M
umba
i30
8557
3161
2319
2138
7549
3611
6523
4838
2613
4229
5840
4512
7527
0036
0813
3120
0048
66N
agpu
r27
5240
7729
818
0830
7036
510
8926
1979
512
7222
5054
211
0625
0091
075
516
5297
0N
asik
3083
3540
6520
5123
8051
1481
1770
5613
8316
5131
1637
1910
2614
3217
1210
4Pa
tna
5239
9056
300
1755
3521
555
2463
4606
340
1788
4044
675
1243
2869
1095
1406
2266
2531
Pim
alga
on0
00
00
00
00
00
00
00
00
0Pu
ne24
1130
1411
2417
2922
4764
712
2515
5672
113
4016
7079
511
1814
7185
812
8816
1910
76Ra
ipur
4129
5942
5526
3641
1898
1500
2854
132
1172
2391
105
1214
2381
8510
4720
2515
4Ra
nchi
7807
1112
069
249
6075
8770
022
0737
3365
120
8934
9673
214
5730
3367
320
8535
7666
6Sh
imla
5492
7920
124
4288
5583
132
2894
4875
142
2979
4375
157
3198
5000
134
2564
4000
124
Srin
agar
3894
4938
2427
9635
6523
2329
3105
1923
1731
2524
2339
3114
2225
6234
6226
Sura
t33
1846
0030
618
2028
1589
312
5820
9588
014
2322
1310
4215
1923
9510
7514
1722
2057
0Tr
ivan
drum
3243
4193
6218
2024
4810
219
8326
7683
1875
2529
4717
4223
6426
620
6827
5516
5
(Sou
rce:
NH
B, N
atio
nal H
ortic
ultu
re D
atab
ase,
201
1)
Page 266
Vegetable StatisticsVegetable Statistics
Technical Bulletin No. 51
Indian Institute of Vegetable Research
Varanasi - 221 305 (Uttar Pradesh)
(Indian Council of Agricultural Research)
6.25
6.16
6.09
6.08 6.
74 7.21 7.58 7.85
7.98
7.99 8.
59.39
8.86
8.48 8.83 10
.13
11.1
4
11.5 12
.85
12.9
1
13.3
7
14.6
6
15 14.4
13.9 14.5 15 15
.4
15.2 16
.4
16.2 16.7 17.3
0
2
4
6
8
10
12
14
16
18
20
2000-01 2001-02 2002-03 2003-04 2004-05 2005-06 2006-07 2007-08 2008-09 2009-10 2010-11
Area (million ha) Production (10 x million t) Productivity (t/ha)
Vegetable production in India (2000 -2001 to 2010-2011)WB, 18.2
UP, 12.1
Bihar, 10
AP, 8.1Gujarat, 6.4
Karnataka, 6.2
TN, 5.6
Odisha, 5.3
Maharashtra, 5.1
Haryana, 3.2
Others, 19.8
Percentage share of different states in vegetable production in India (2010-2011)
(Source: NHB, 2011)
gj dne] gj Mxjfdlkuksa dk gelQjHkkjrh; Ñd̀f"k vuqlaèkku ifj"kn
Extension Bulletin No. 50
M.H. Kodandaram
Sujoy Saha
A.B. Rai
Prakash S. Naik
Compendium on Pesticide
Use in Vegetables
Compendium on Pesticide
Use in Vegetables
Indian Institute of Vegetable Research
Varanasi - 221 305 (Uttar Pradesh)
(Indian Council of Agricultural Research)
Selectivity & Efficacy
Lab
el C
laim
Foo
d s
afet
y
Rational Pesticide
Use